Earlier this year, a panel of nationally recognized experts in the fields of physical activity and public health convened to determine recommended physical activity guidelines for all Americans. Several new health benefits related to exercise have come to light since the committee last met in 2008, including improved cognitive functioning in children, decreased risk of certain cancers, and reduced feelings of anxiety and depression in adults.
By the standards laid out in the latest federal physical activity guidelines, many Americans are not getting enough exercise. While the federal activity guidelines recommend at least 2 hours and 30 minutes of moderate-intensity aerobic physical activity per week, some 23.0% of U.S. adults engage in no physical activity outside of work whatsoever. Exercise habits can vary considerably by geography, however, from state to state and even city to city.
To determine the fitness capital of every state, 24/7 Wall St. ranked metro areas based on the share of adults who are physically active during their leisure time and the share of the population with access to venues for physical activity outside of their homes. We used data from County Health Rankings & Roadmaps, a collaboration between the Robert Wood Johnson Foundation and the University of Wisconsin Population Health Institute.
Click here to see the fitness capital of every state.
Click here to see our detailed findings and methodology.

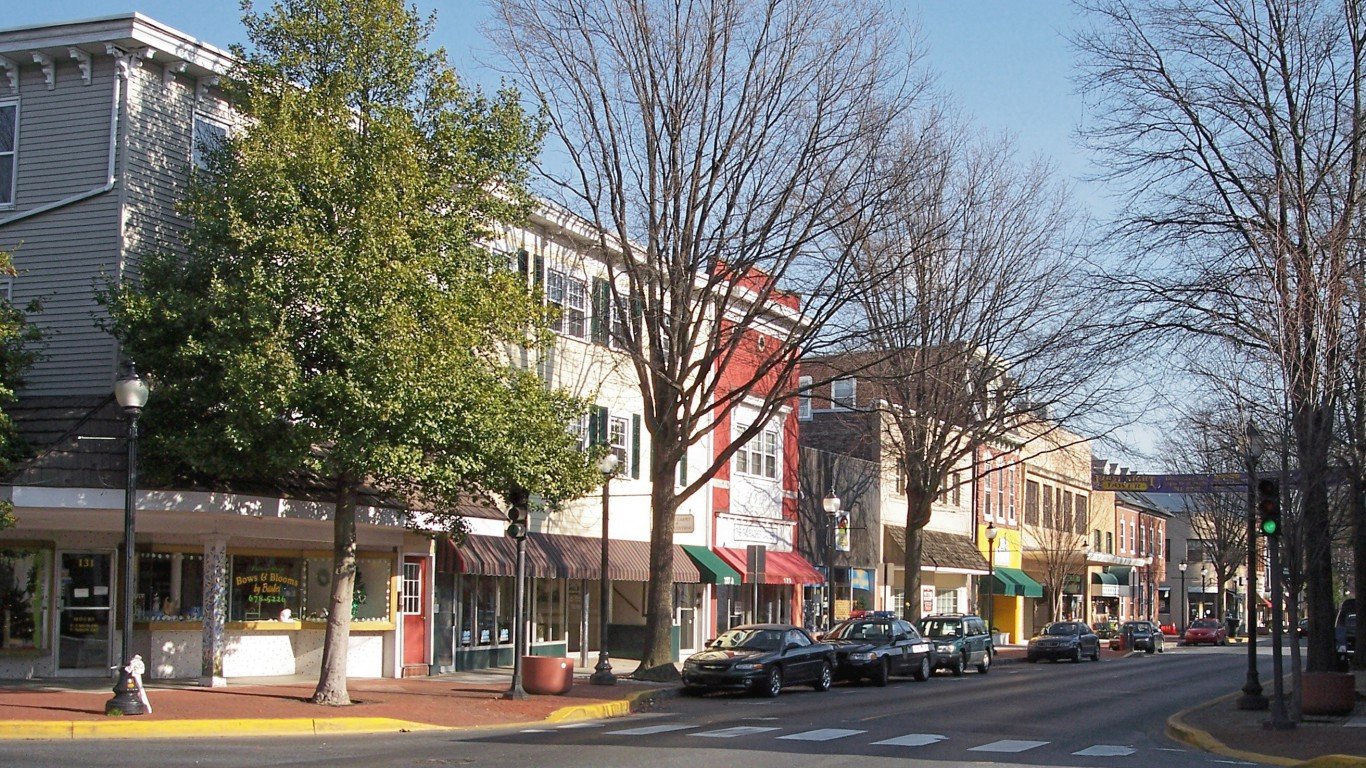
1. Daphne-Fairhope-Foley, Alabama
> Physically active adults: 75.5% (Alabama: 71.0%)
> Population with access to exercise locations: 68.5% (Alabama: 62.8%)
> Obesity rate: 29.3% (Alabama: 34.7%)
> Adults in fair or poor health: 18.1% (Alabama: 21.4%)
> Median household income: $56,732 (Alabama: $46,257)
[in-text-ad]
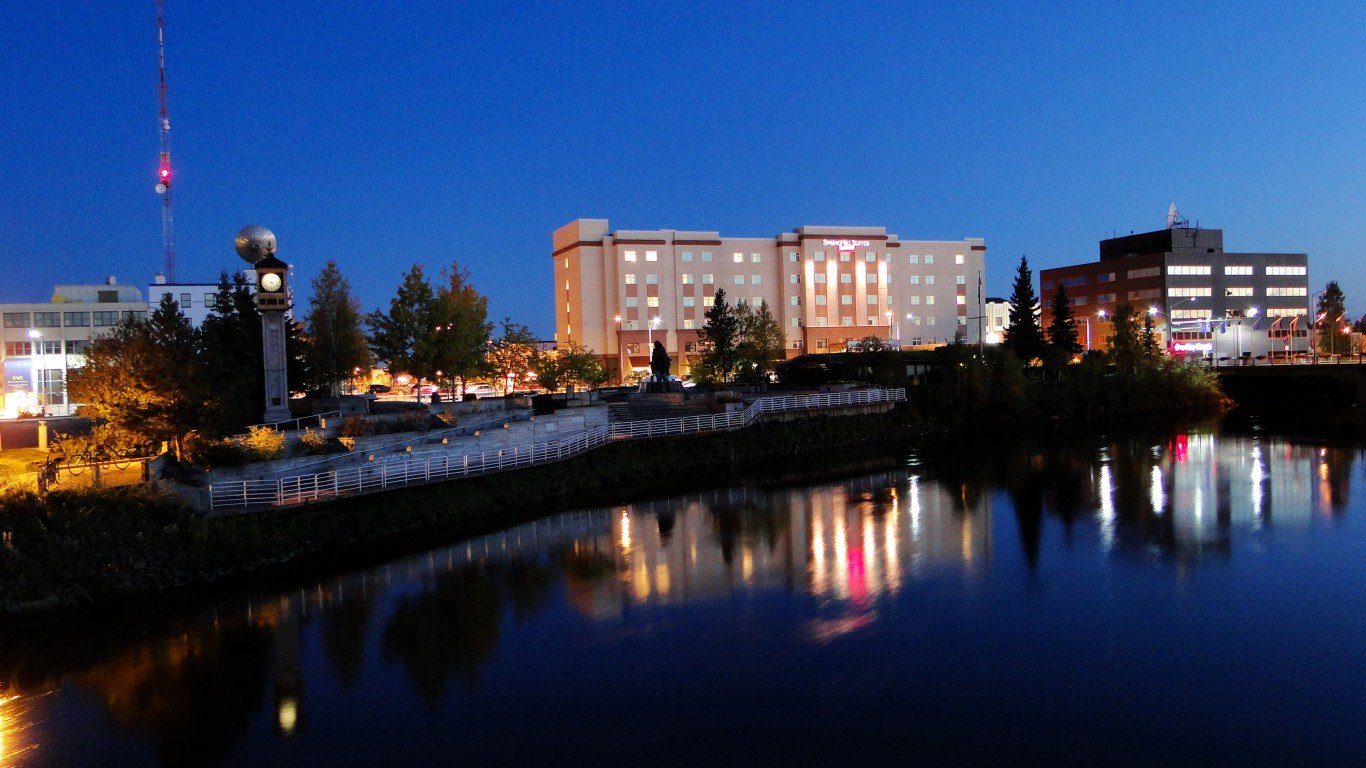
2. Fairbanks, Alaska
> Physically active adults: 81.5% (Alaska: 80.7%)
> Population with access to exercise locations: 87.2% (Alaska: 83.9%)
> Obesity rate: 28.9% (Alaska: 29.4%)
> Adults in fair or poor health: 13.2% (Alaska: 13.4%)
> Median household income: $77,328 (Alaska: $76,440)
[recirclink id=444492]

3. Flagstaff, Arizona
> Physically active adults: 83.8% (Arizona: 79.8%)
> Population with access to exercise locations: 83.2% (Arizona: 86.3%)
> Obesity rate: 22.8% (Arizona: 26.7%)
> Adults in fair or poor health: 16.0% (Arizona: 17.8%)
> Median household income: $55,091 (Arizona: $53,558)

4. Fayetteville-Springdale-Rogers, Arkansas
> Physically active adults: 73.4% (Arkansas: 67.7%)
> Population with access to exercise locations: 78.0% (Arkansas: 65.6%)
> Obesity rate: 30.4% (Arkansas: 34.6%)
> Adults in fair or poor health: 20.1% (Arkansas: 24.5%)
> Median household income: $51,848 (Arkansas: $44,334)
[in-text-ad-2]

5. Santa Cruz-Watsonville, California
> Physically active adults: 85.6% (California: 82.1%)
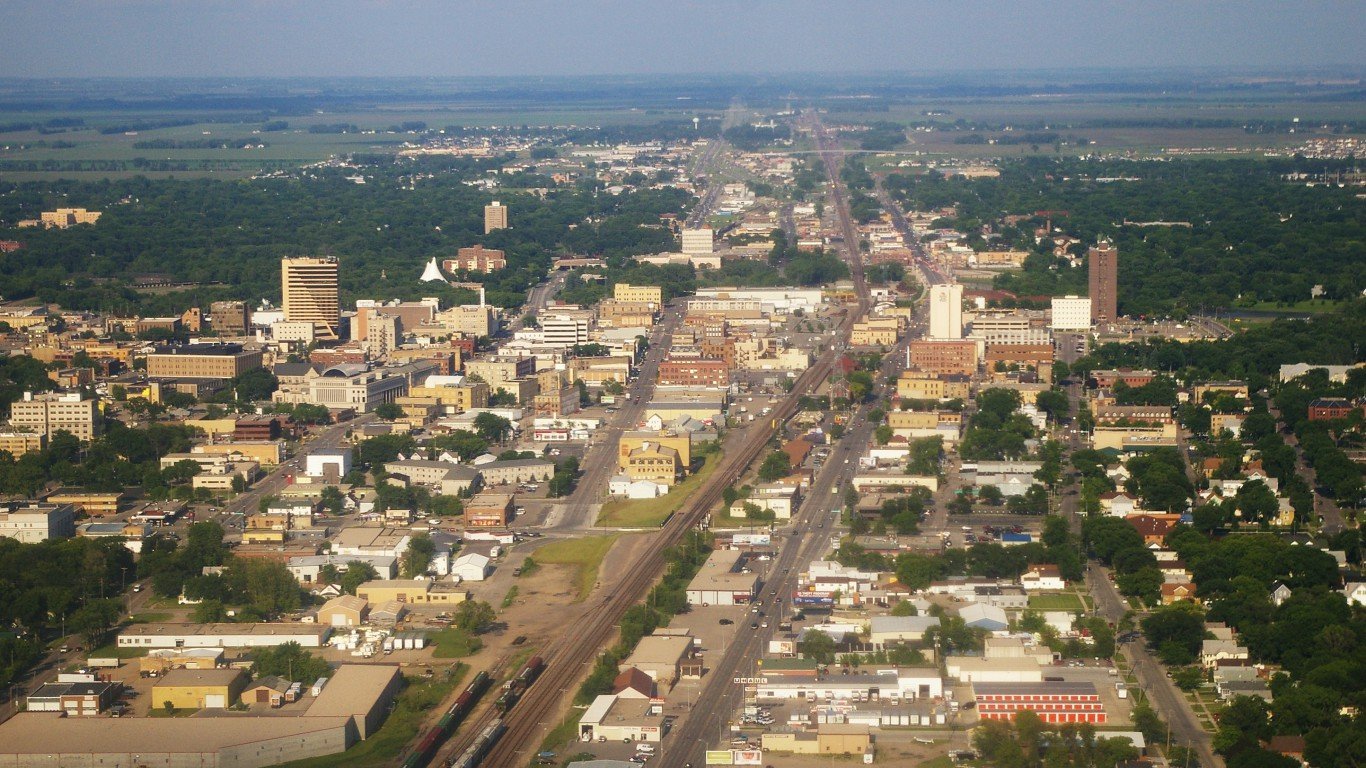
> Population with access to exercise locations: 93.7% (California: 89.6%)
> Obesity rate: 18.2% (California: 22.7%)
> Adults in fair or poor health: 16.4% (California: 17.5%)
> Median household income: $77,613 (California: $67,739)
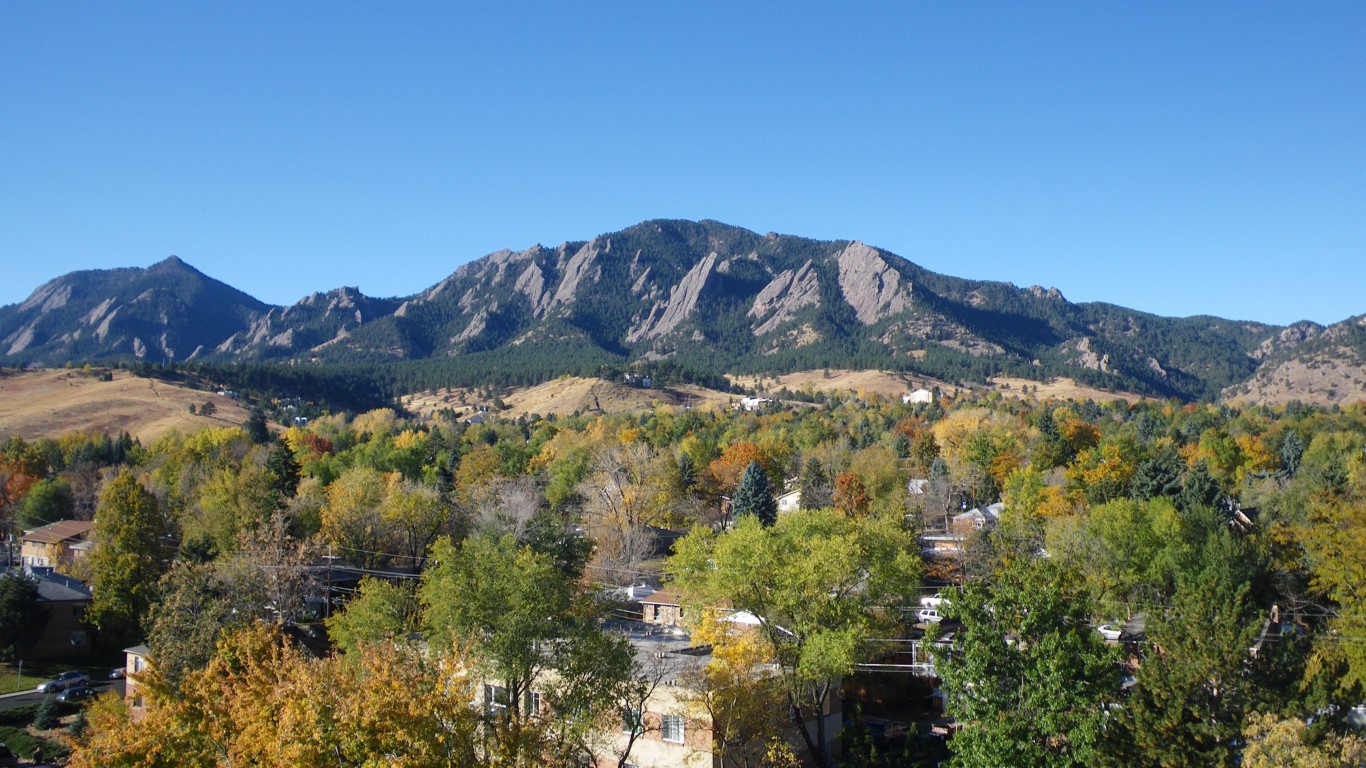
6. Boulder, Colorado
> Physically active adults: 90.0% (Colorado: 84.9%)
> Population with access to exercise locations: 96.8% (Colorado: 91.2%)
> Obesity rate: 13.8% (Colorado: 20.5%)
> Adults in fair or poor health: 9.4% (Colorado: 14.3%)
> Median household income: $74,615 (Colorado: $65,685)
[in-text-ad]

7. Bridgeport-Stamford-Norwalk, Connecticut
> Physically active adults: 81.1% (Connecticut: 79.6%)
> Population with access to exercise locations: 96.0% (Connecticut: 93.6%)
> Obesity rate: 21.4% (Connecticut: 25.2%)
> Adults in fair or poor health: 11.1% (Connecticut: 13.8%)
> Median household income: $90,123 (Connecticut: $73,433)
[recirclink id=444468]
8. Dover, Delaware
> Physically active adults: 69.7% (Delaware: 73.9%)
> Population with access to exercise locations: 62.0% (Delaware: 86.3%)
> Obesity rate: 33.6% (Delaware: 30.6%)
> Adults in fair or poor health: 16.9% (Delaware: 15.8%)
> Median household income: $54,140 (Delaware: $61,757)
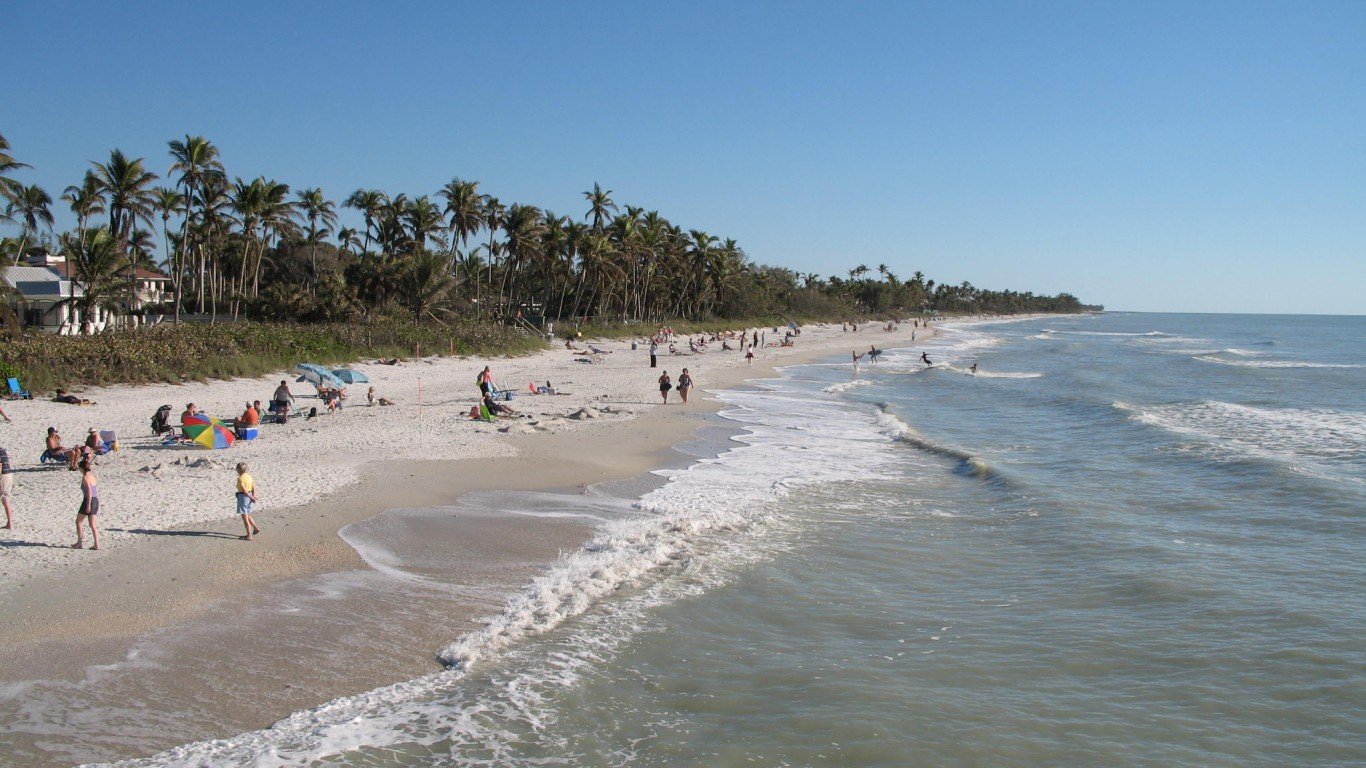
9. Naples-Immokalee-Marco Island, Florida
> Physically active adults: 81.3% (Florida: 76.2%)
> Population with access to exercise locations: 87.7% (Florida: 87.0%)
> Obesity rate: 20.3% (Florida: 25.9%)
> Adults in fair or poor health: 15.8% (Florida: 18.5%)
> Median household income: $61,228 (Florida: $50,860)
[in-text-ad-2]

10. Atlanta-Sandy Springs-Roswell, Georgia
> Physically active adults: 78.0% (Georgia: 75.9%)
> Population with access to exercise locations: 84.0% (Georgia: 76.7%)
> Obesity rate: 28.6% (Georgia: 30.2%)
> Adults in fair or poor health: 15.7% (Georgia: 18.8%)
> Median household income: $62,613 (Georgia: $53,559)

11. Urban Honolulu, Hawaii
> Physically active adults: 79.8% (Hawaii: 79.9%)
> Population with access to exercise locations: 96.9% (Hawaii: 92.8%)
> Obesity rate: 22.2% (Hawaii: 22.3%)
> Adults in fair or poor health: 12.3% (Hawaii: 14.0%)
> Median household income: $80,513 (Hawaii: $74,511)
[in-text-ad]

12. Coeur d’Alene, Idaho
> Physically active adults: 79.7% (Idaho: 79.8%)
> Population with access to exercise locations: 92.4% (Idaho: 79.5%)
> Obesity rate: 26.2% (Idaho: 28.6%)
> Adults in fair or poor health: 15.4% (Idaho: 15.3%)
> Median household income: $51,765 (Idaho: $51,807)
[recirclink id=444391]

13. Chicago-Naperville-Elgin, Illinois
> Physically active adults: 78.7% (Illinois: 77.8%)
> Population with access to exercise locations: 97.5% (Illinois: 91.3%)
> Obesity rate: 27.4% (Illinois: 28.0%)
> Adults in fair or poor health: 16.5% (Illinois: 17.2%)
> Median household income: $66,020 (Illinois: $60,960)
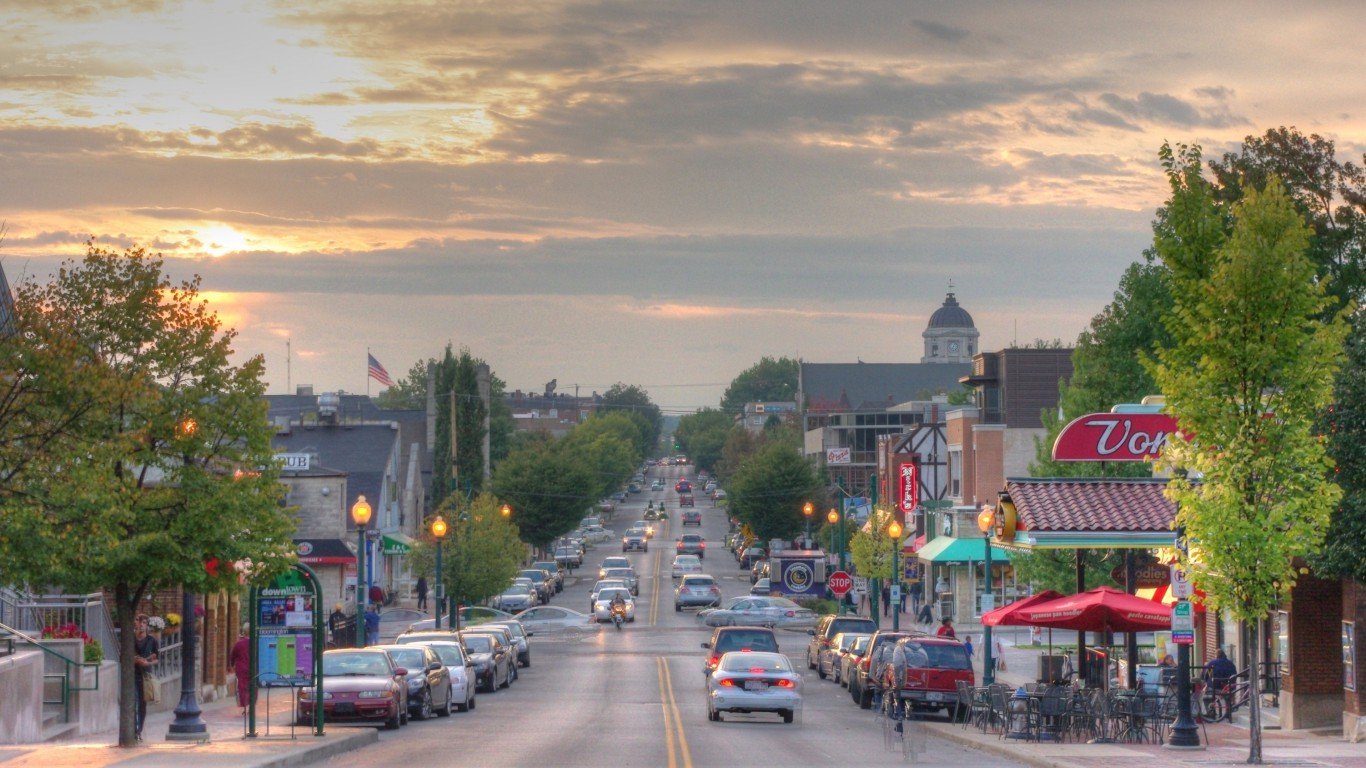
14. Bloomington, Indiana
> Physically active adults: 78.4% (Indiana: 73.2%)
> Population with access to exercise locations: 78.2% (Indiana: 76.6%)
> Obesity rate: 24.3% (Indiana: 32.0%)
> Adults in fair or poor health: 16.9% (Indiana: 17.7%)
> Median household income: $43,693 (Indiana: $52,314)
[in-text-ad-2]
15. Iowa City, Iowa
> Physically active adults: 81.5% (Iowa: 75.3%)
> Population with access to exercise locations: 88.8% (Iowa: 83.0%)
> Obesity rate: 24.5% (Iowa: 31.8%)
> Adults in fair or poor health: 12.2% (Iowa: 13.1%)
> Median household income: $57,777 (Iowa: $56,247)

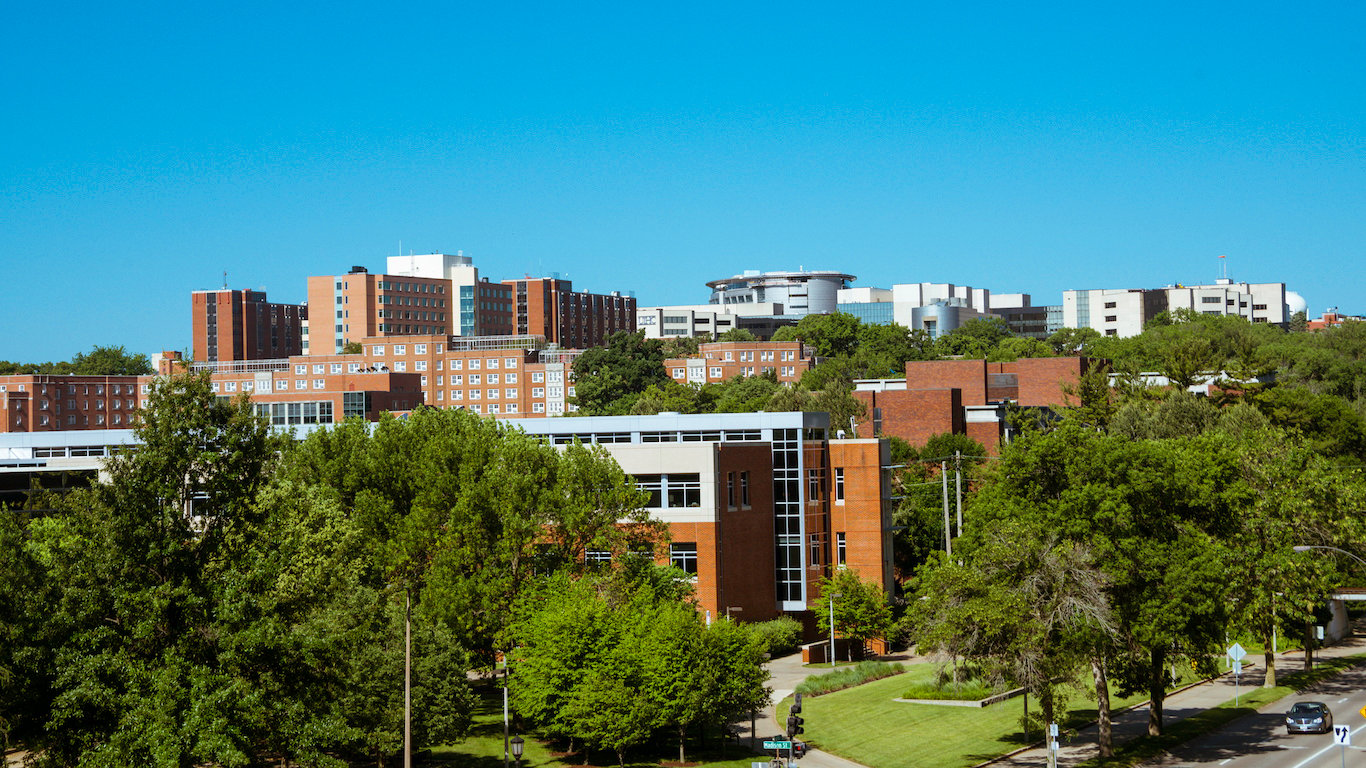
16. Lawrence, Kansas
> Physically active adults: 81.9% (Kansas: 75.4%)
> Population with access to exercise locations: 90.3% (Kansas: 80.9%)
> Obesity rate: 26.2% (Kansas: 32.4%)
> Adults in fair or poor health: 13.1% (Kansas: 15.0%)
> Median household income: $56,345 (Kansas: $54,935)
[in-text-ad]

17. Lexington-Fayette, Kentucky
> Physically active adults: 77.2% (Kentucky: 71.9%)
> Population with access to exercise locations: 90.7% (Kentucky: 72.4%)
> Obesity rate: 29.3% (Kentucky: 33.7%)
> Adults in fair or poor health: 18.2% (Kentucky: 21.3%)
> Median household income: $53,769 (Kentucky: $46,659)
[recirclink id=444326]

18. New Orleans-Metairie, Louisiana
> Physically active adults: 73.2% (Louisiana: 70.4%)
> Population with access to exercise locations: 87.7% (Louisiana: 74.0%)
> Obesity rate: 33.4% (Louisiana: 34.7%)
> Adults in fair or poor health: 18.4% (Louisiana: 21.1%)
> Median household income: $48,804 (Louisiana: $45,146)
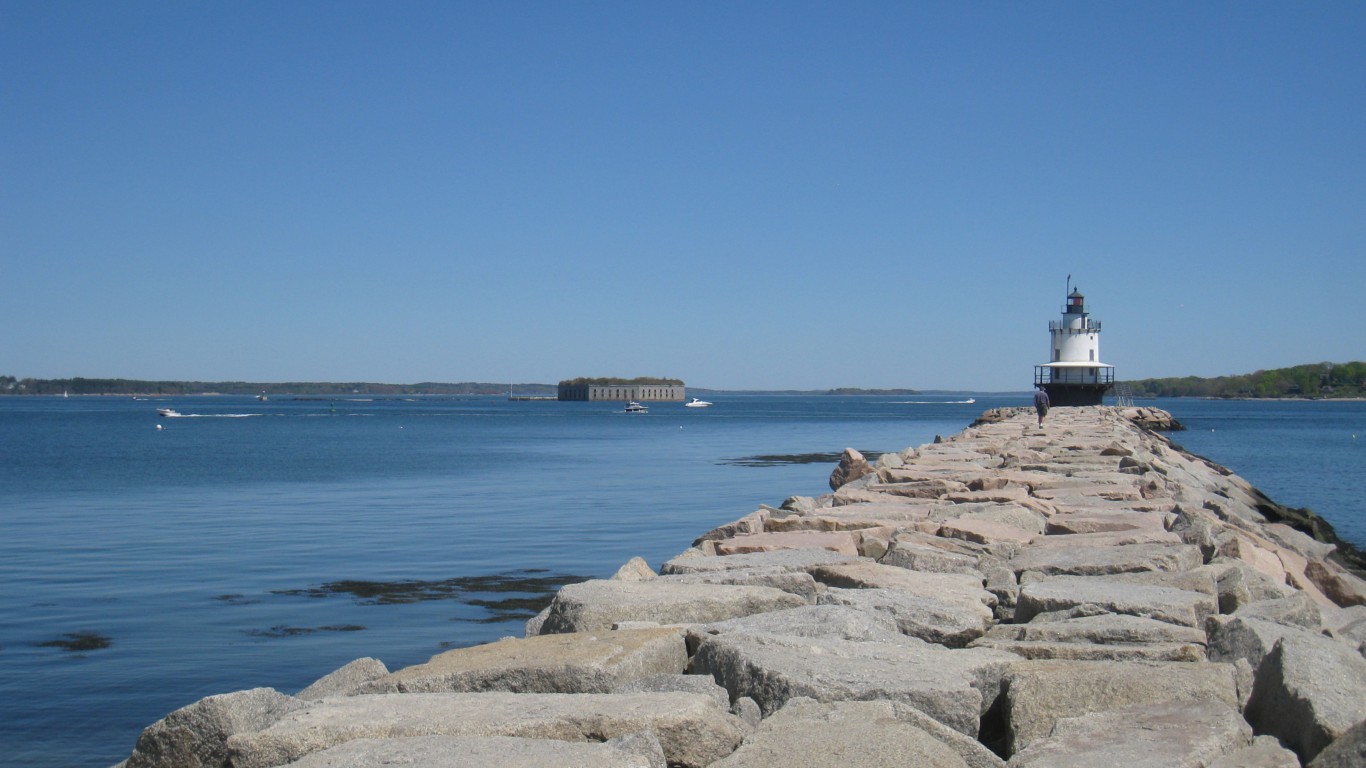
19. Portland-South Portland, Maine
> Physically active adults: 81.9% (Maine: 78.6%)
> Population with access to exercise locations: 81.9% (Maine: 72.8%)
> Obesity rate: 25.9% (Maine: 29.0%)
> Adults in fair or poor health: 11.1% (Maine: 15.4%)
> Median household income: $63,422 (Maine: $53,079)
[in-text-ad-2]

20. Baltimore-Columbia-Towson, Maryland
> Physically active adults: 77.2% (Maryland: 77.8%)
> Population with access to exercise locations: 95.2% (Maryland: 93.0%)
> Obesity rate: 29.6% (Maryland: 29.2%)
> Adults in fair or poor health: 13.4% (Maryland: 13.9%)
> Median household income: $76,788 (Maryland: $78,945)
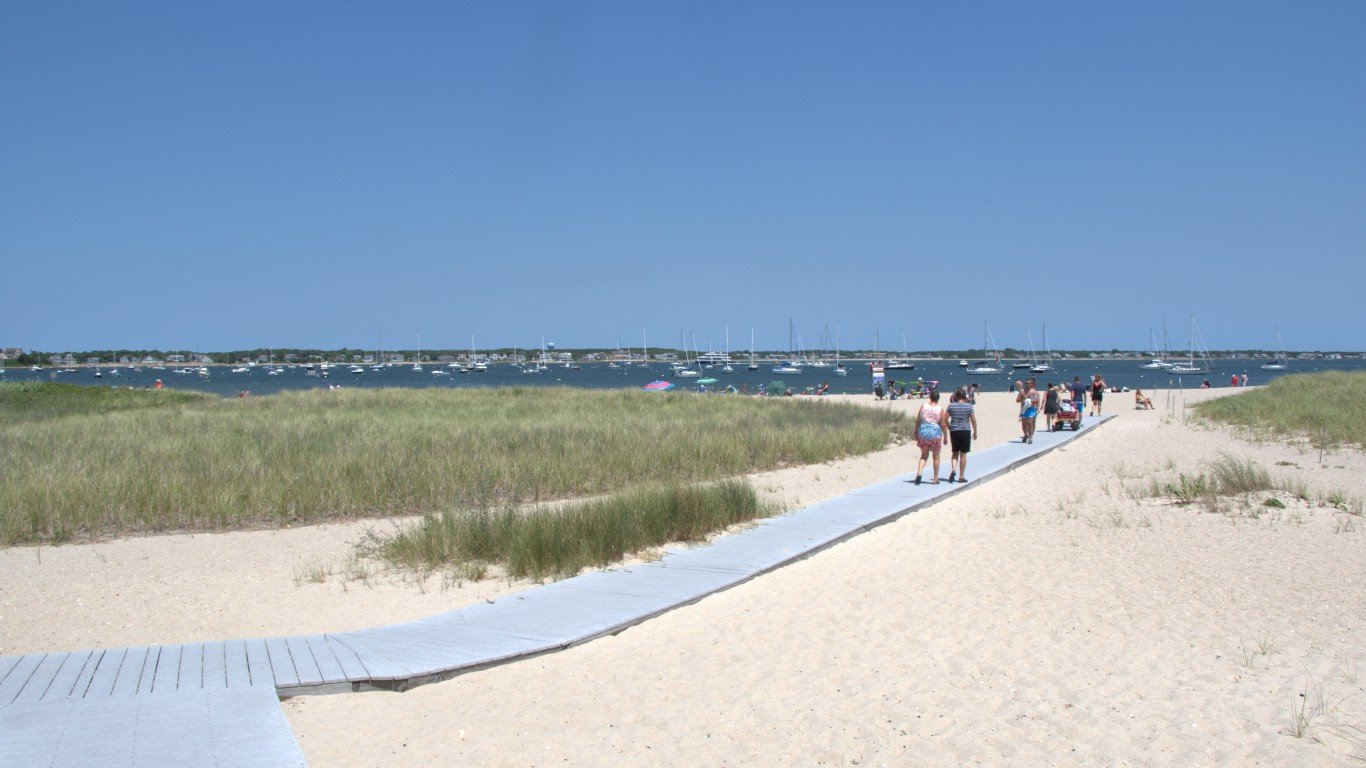
21. Barnstable Town, Massachusetts
> Physically active adults: 82.9% (Massachusetts: 78.5%)
> Population with access to exercise locations: 89.3% (Massachusetts: 93.8%)
> Obesity rate: 20.5% (Massachusetts: 24.3%)
> Adults in fair or poor health: 10.4% (Massachusetts: 13.8%)
> Median household income: $67,898 (Massachusetts: $75,297)
[in-text-ad]
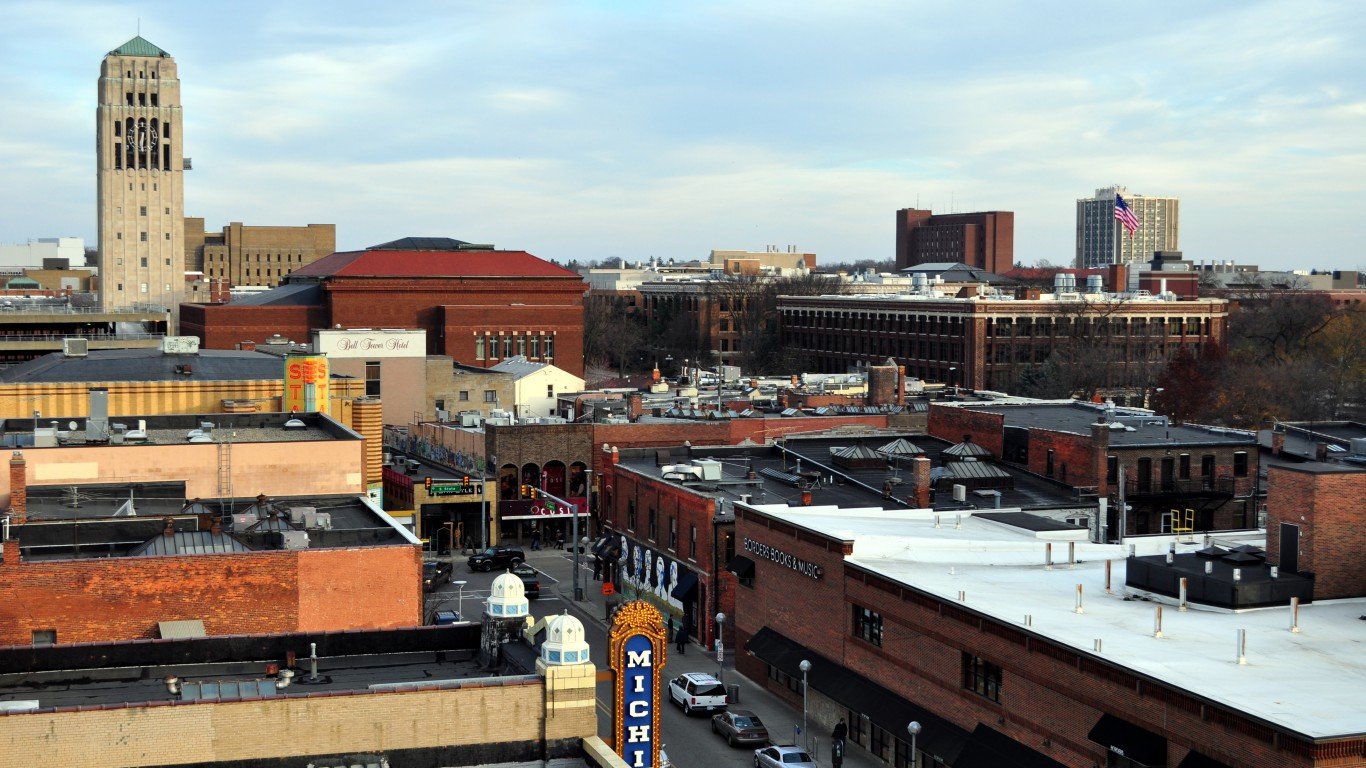
22. Ann Arbor, Michigan
> Physically active adults: 84.2% (Michigan: 76.8%)
> Population with access to exercise locations: 93.9% (Michigan: 85.8%)
> Obesity rate: 23.9% (Michigan: 31.3%)
> Adults in fair or poor health: 11.5% (Michigan: 17.4%)
> Median household income: $65,601 (Michigan: $52,492)
[recirclink id=444046]

23. Minneapolis-St. Paul-Bloomington, Minnesota
> Physically active adults: 81.8% (Minnesota: 80.2%)
> Population with access to exercise locations: 95.6% (Minnesota: 88.1%)
> Obesity rate: 25.7% (Minnesota: 27.3%)
> Adults in fair or poor health: 10.8% (Minnesota: 12.0%)
> Median household income: $73,231 (Minnesota: $65,599)
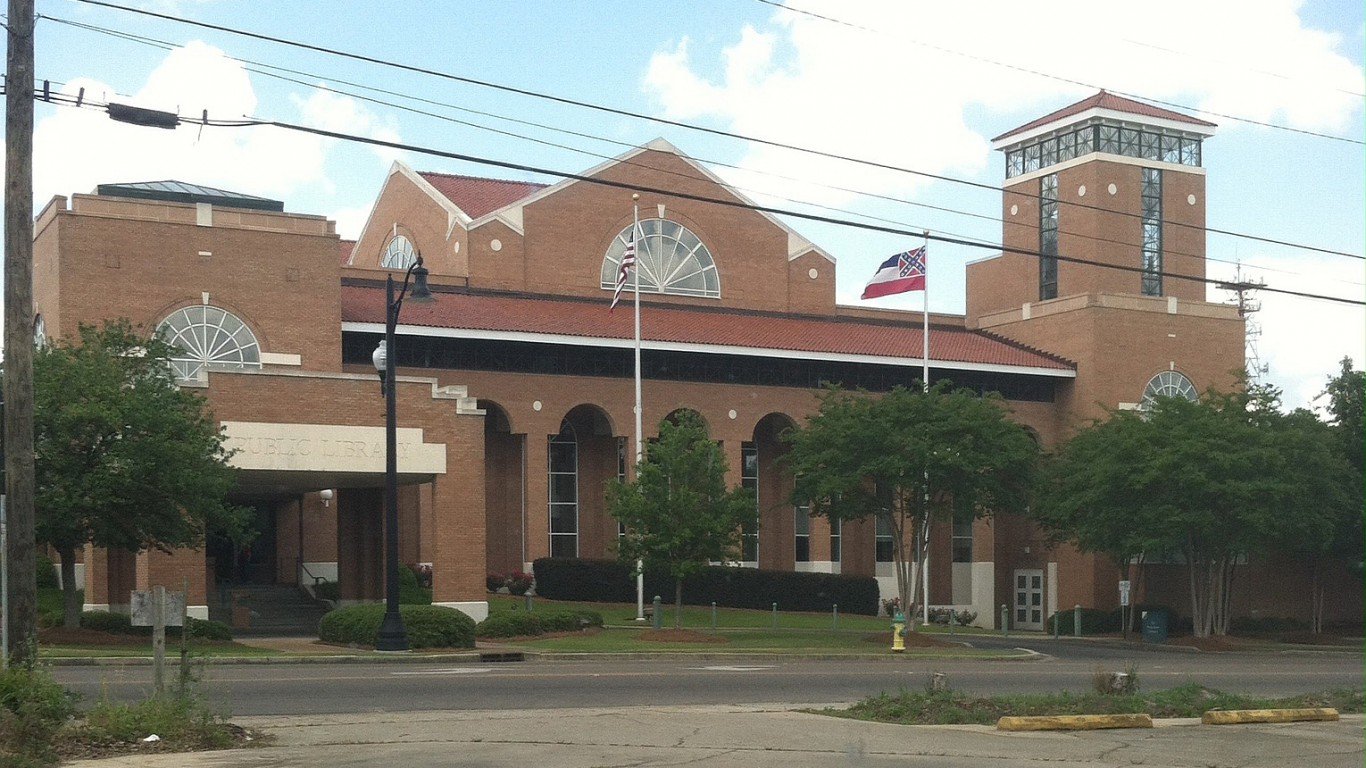
24. Hattiesburg, Mississippi
> Physically active adults: 70.1% (Mississippi: 66.0%)
> Population with access to exercise locations: 75.1% (Mississippi: 57.7%)
> Obesity rate: 34.4% (Mississippi: 35.3%)
> Adults in fair or poor health: 19.4% (Mississippi: 22.2%)
> Median household income: $46,765 (Mississippi: $41,754)
[in-text-ad-2]
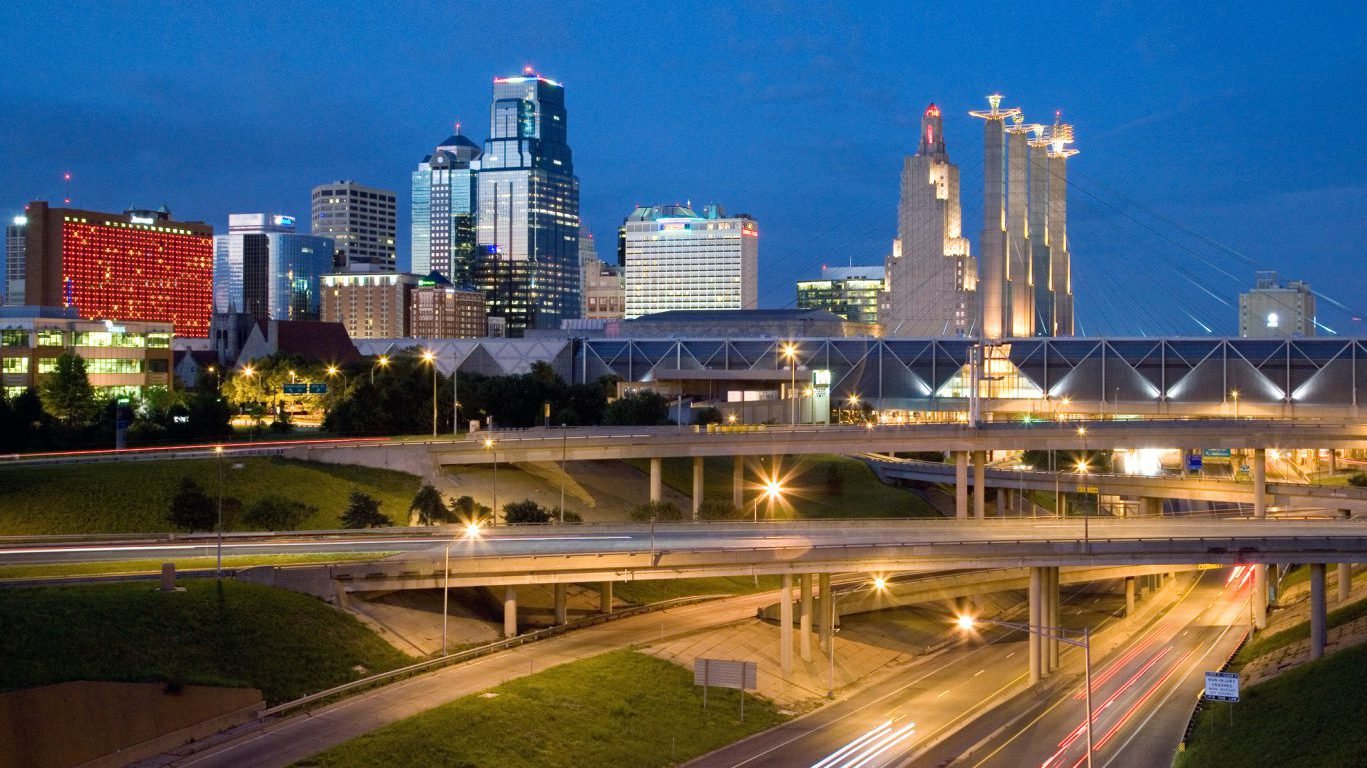
25. Kansas City, Missouri
> Physically active adults: 77.0% (Missouri: 74.2%)
> Population with access to exercise locations: 89.4% (Missouri: 77.4%)
> Obesity rate: 31.5% (Missouri: 31.8%)
> Adults in fair or poor health: 14.6% (Missouri: 18.5%)
> Median household income: $61,385 (Missouri: $51,746)
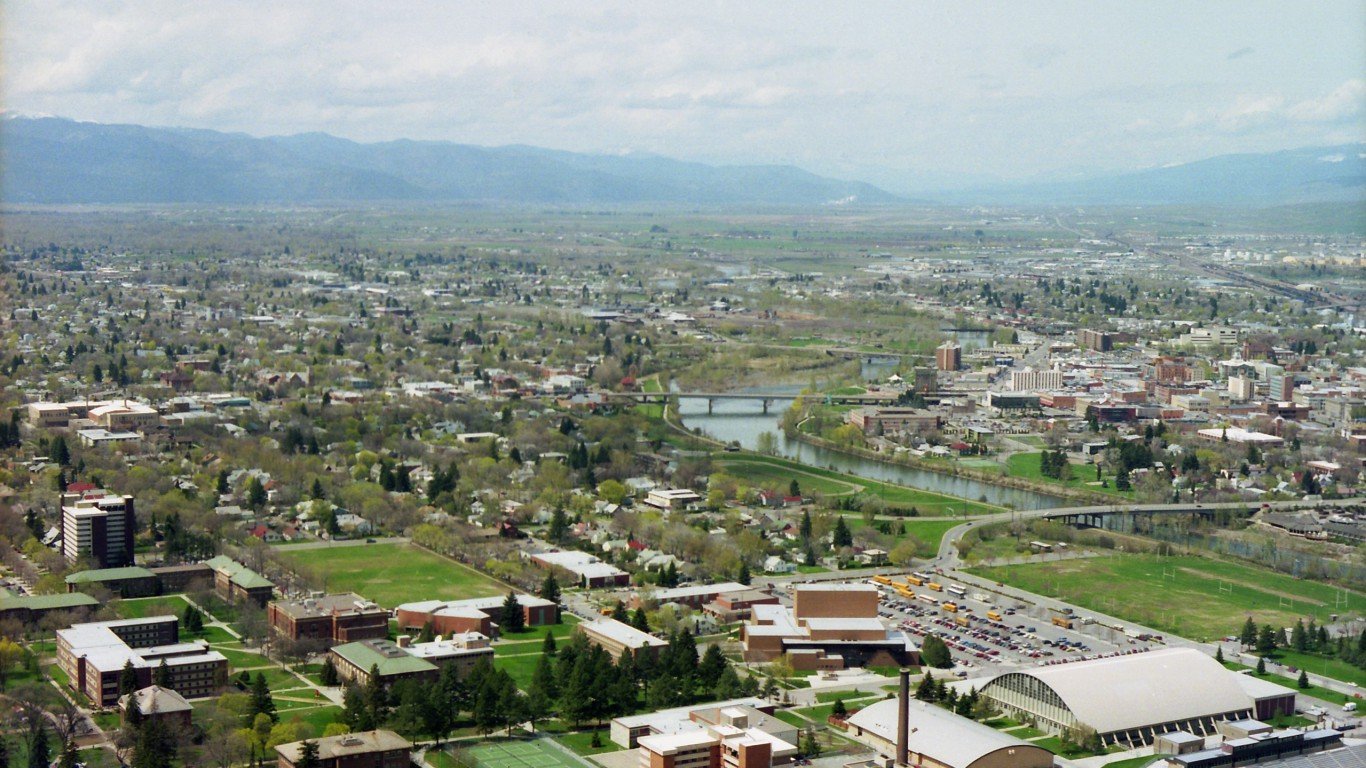
26. Missoula, Montana
> Physically active adults: 84.9% (Montana: 79.2%)
> Population with access to exercise locations: 91.8% (Montana: 76.3%)
> Obesity rate: 22.7% (Montana: 25.0%)
> Adults in fair or poor health: 13.9% (Montana: 13.9%)
> Median household income: $46,550 (Montana: $50,027)
[in-text-ad]
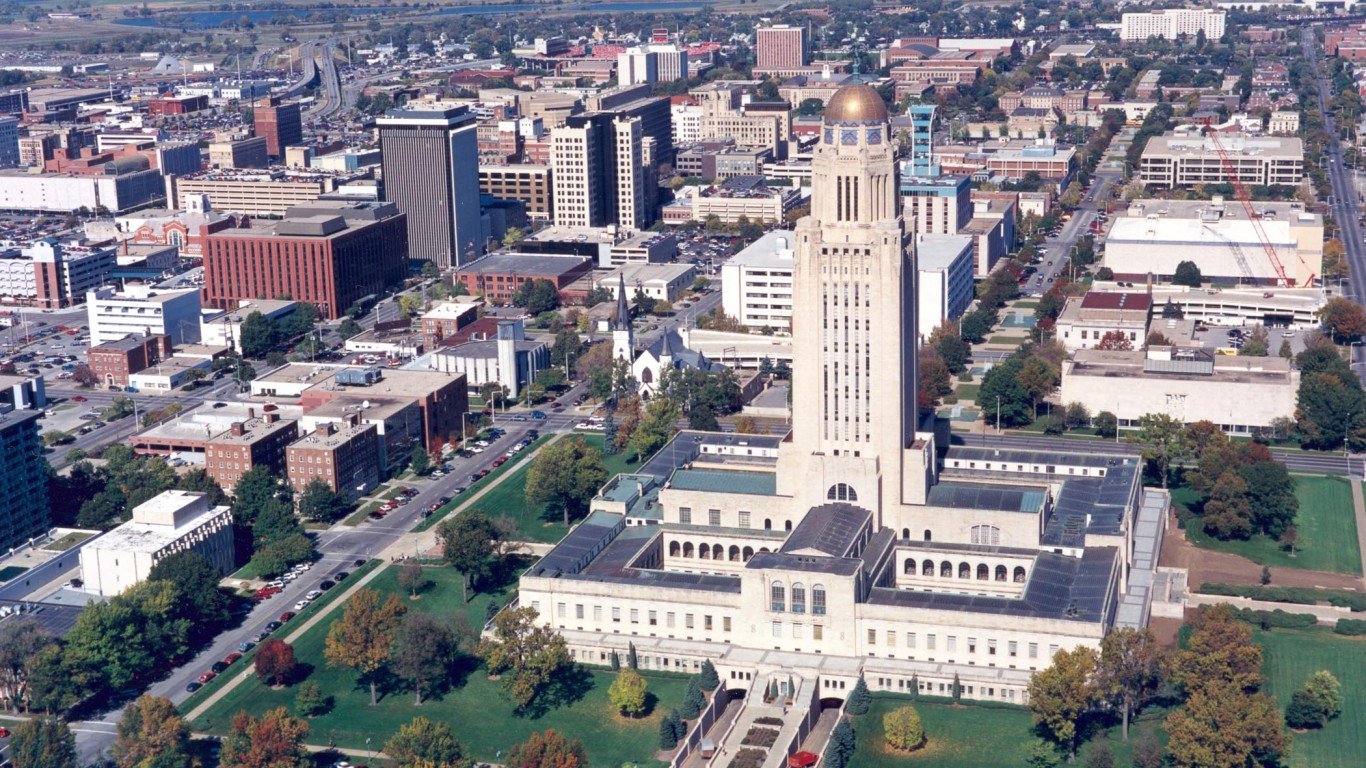
27. Lincoln, Nebraska
> Physically active adults: 81.9% (Nebraska: 77.3%)
> Population with access to exercise locations: 95.1% (Nebraska: 83.3%)
> Obesity rate: 27.4% (Nebraska: 30.7%)
> Adults in fair or poor health: 11.1% (Nebraska: 14.2%)
> Median household income: $59,344 (Nebraska: $56,927)
[recirclink id=443940]
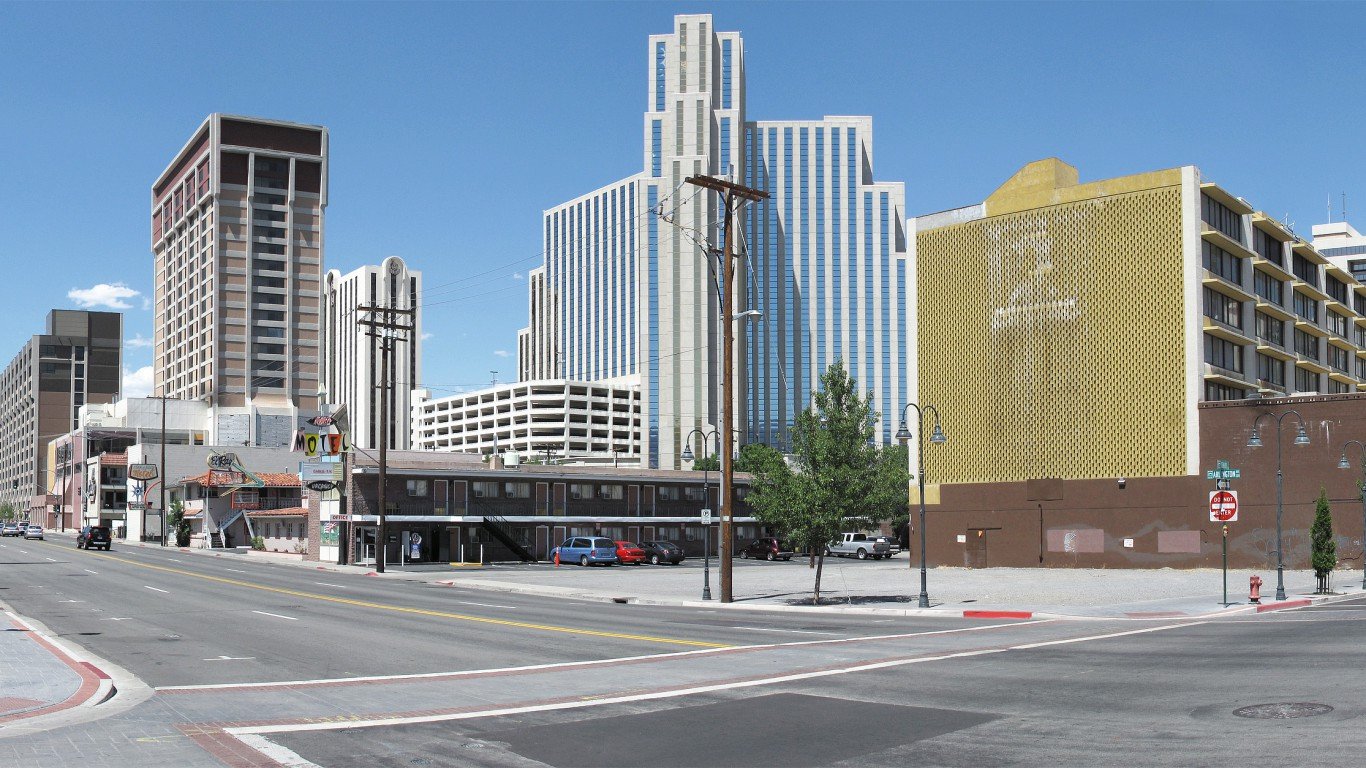
28. Reno, Nevada
> Physically active adults: 82.9% (Nevada: 77.8%)
> Population with access to exercise locations: 90.5% (Nevada: 91.8%)
> Obesity rate: 21.5% (Nevada: 26.8%)
> Adults in fair or poor health: 15.6% (Nevada: 20.5%)
> Median household income: $58,056 (Nevada: $55,180)

29. Manchester-Nashua, New Hampshire
> Physically active adults: 79.4% (New Hampshire: 79.4%)
> Population with access to exercise locations: 86.5% (New Hampshire: 82.4%)
> Obesity rate: 28.1% (New Hampshire: 27.9%)
> Adults in fair or poor health: 12.6% (New Hampshire: 13.6%)
> Median household income: $76,254 (New Hampshire: $70,936)
[in-text-ad-2]

30. Trenton, New Jersey
> Physically active adults: 77.9% (New Jersey: 76.7%)
> Population with access to exercise locations: 97.5% (New Jersey: 95.0%)
> Obesity rate: 25.2% (New Jersey: 25.9%)
> Adults in fair or poor health: 14.5% (New Jersey: 16.5%)
> Median household income: $77,650 (New Jersey: $76,126)

31. Santa Fe, New Mexico
> Physically active adults: 89.0% (New Mexico: 80.6%)
> Population with access to exercise locations: 76.3% (New Mexico: 77.5%)
> Obesity rate: 13.5% (New Mexico: 24.4%)
> Adults in fair or poor health: 14.6% (New Mexico: 20.8%)
> Median household income: $57,863 (New Mexico: $46,748)
[in-text-ad]

32. New York-Newark-Jersey City, New York
> Physically active adults: 75.2% (New York: 74.6%)
> Population with access to exercise locations: 97.4% (New York: 93.3%)
> Obesity rate: 23.8% (New York: 25.0%)
> Adults in fair or poor health: 16.5% (New York: 16.1%)
> Median household income: $71,897 (New York: $62,909)
[recirclink id=443564]

33. Raleigh, North Carolina
> Physically active adults: 80.8% (North Carolina: 75.7%)
> Population with access to exercise locations: 86.7% (North Carolina: 76.1%)
> Obesity rate: 25.2% (North Carolina: 29.6%)
> Adults in fair or poor health: 13.5% (North Carolina: 17.6%)
> Median household income: $71,685 (North Carolina: $50,584)
34. Fargo, North Dakota
> Physically active adults: 80.4% (North Dakota: 76.2%)
> Population with access to exercise locations: 87.0% (North Dakota: 74.6%)
> Obesity rate: 29.3% (North Dakota: 31.8%)
> Adults in fair or poor health: 12.2% (North Dakota: 14.3%)
> Median household income: $60,009 (North Dakota: $60,656)
[in-text-ad-2]

35. Cleveland-Elyria, Ohio
> Physically active adults: 75.4% (Ohio: 74.3%)
> Population with access to exercise locations: 94.1% (Ohio: 84.7%)
> Obesity rate: 30.0% (Ohio: 31.6%)
> Adults in fair or poor health: 15.5% (Ohio: 17.0%)
> Median household income: $52,131 (Ohio: $52,334)
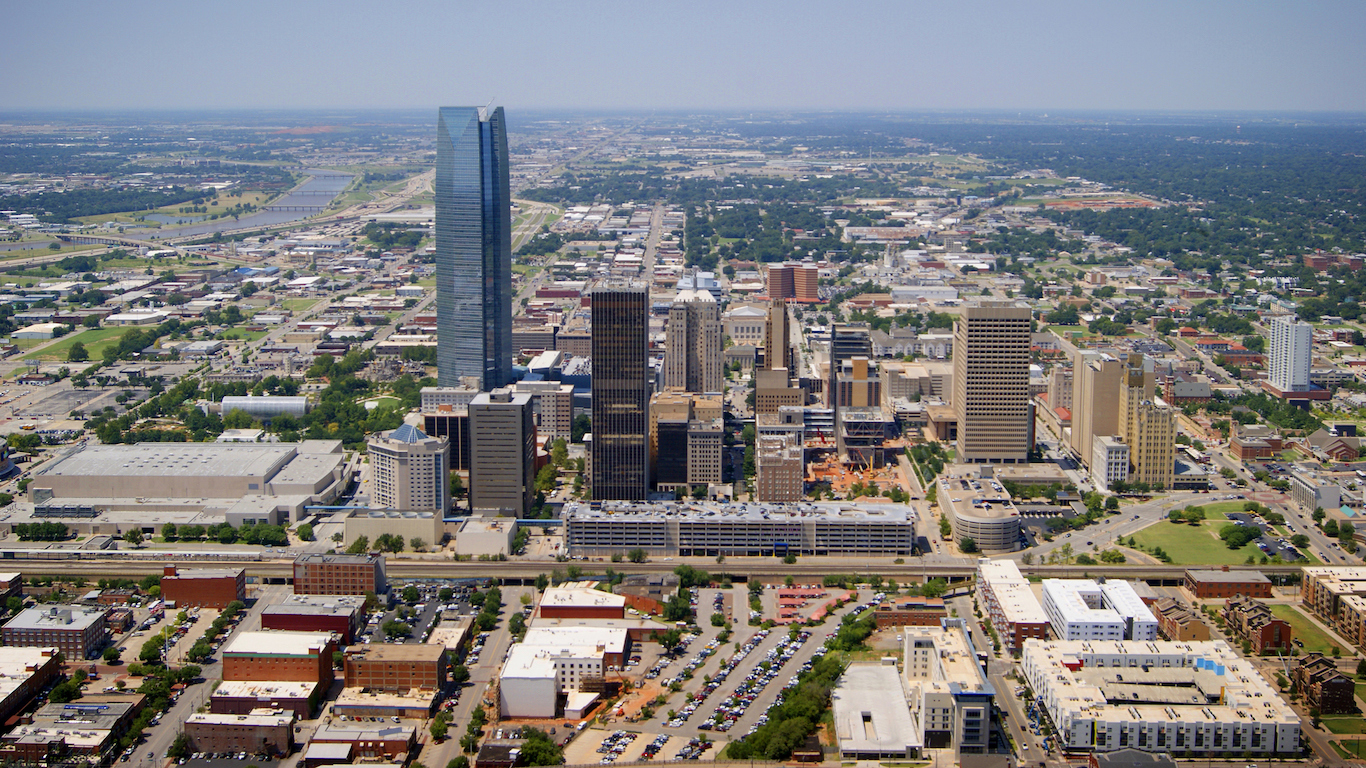
36. Oklahoma City, Oklahoma
> Physically active adults: 72.5% (Oklahoma: 70.1%)
> Population with access to exercise locations: 86.5% (Oklahoma: 73.8%)
> Obesity rate: 31.8% (Oklahoma: 33.2%)
> Adults in fair or poor health: 16.4% (Oklahoma: 19.6%)
> Median household income: $55,065 (Oklahoma: $49,176)
[in-text-ad]

37. Portland-Vancouver-Hillsboro, Oregon
> Physically active adults: 85.5% (Oregon: 84.2%)
> Population with access to exercise locations: 89.8% (Oregon: 77.5%)
> Obesity rate: 25.6% (Oregon: 27.2%)
> Adults in fair or poor health: 12.5% (Oregon: 15.8%)
> Median household income: $68,676 (Oregon: $57,532)
[recirclink id=443882]

38. Philadelphia-Camden-Wilmington, Pennsylvania
> Physically active adults: 77.0% (Pennsylvania: 76.0%)
> Population with access to exercise locations: 89.1% (Pennsylvania: 67.8%)
> Obesity rate: 27.6% (Pennsylvania: 29.6%)
> Adults in fair or poor health: 15.2% (Pennsylvania: 15.1%)
> Median household income: $65,996 (Pennsylvania: $56,907)

39. Providence-Warwick, Rhode Island
> Physically active adults: 75.0% (Rhode Island: 75.9%)
> Population with access to exercise locations: 91.1% (Rhode Island: 91.0%)
> Obesity rate: 27.9% (Rhode Island: 27.2%)
> Adults in fair or poor health: 14.5% (Rhode Island: 14.8%)
> Median household income: $61,948 (Rhode Island: $60,596)
[in-text-ad-2]
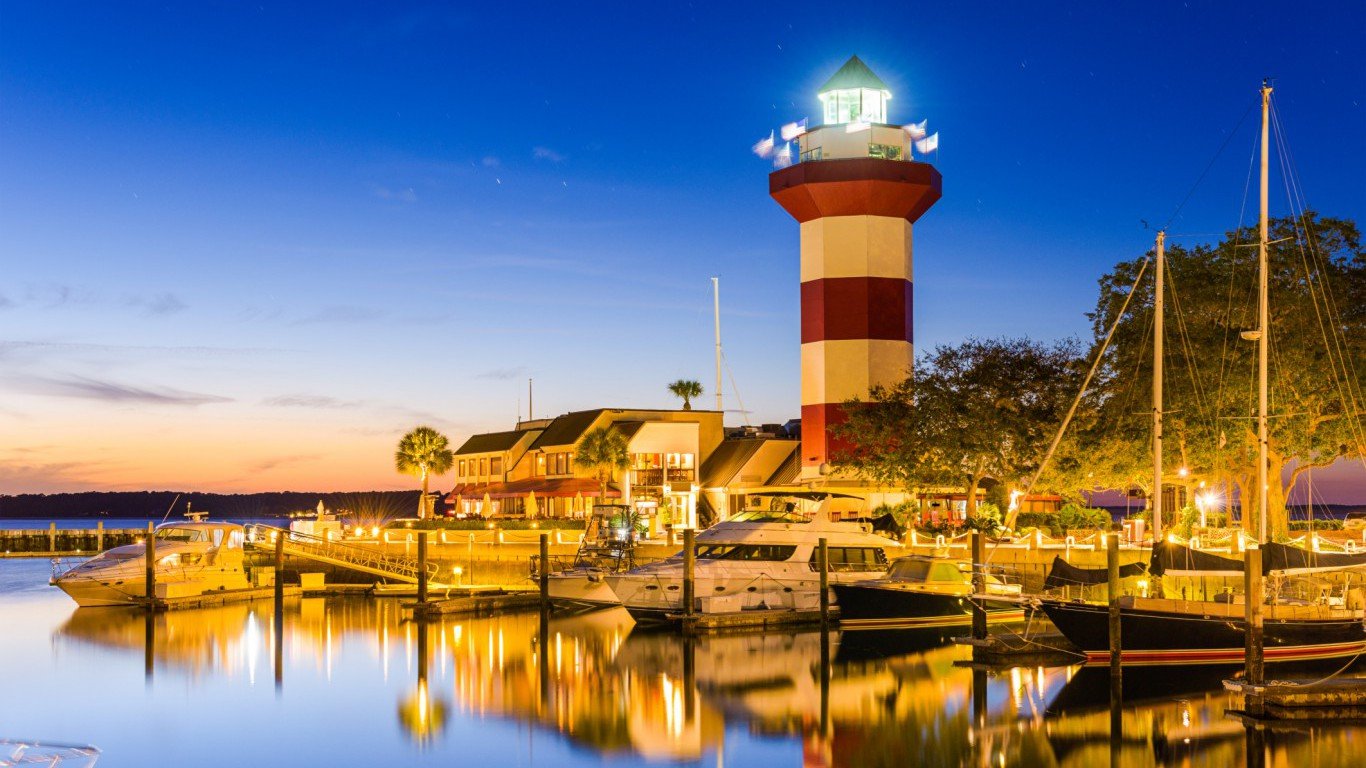
40. Hilton Head Island-Bluffton-Beaufort, South Carolina
> Physically active adults: 82.0% (South Carolina: 75.2%)
> Population with access to exercise locations: 72.0% (South Carolina: 54.2%)
> Obesity rate: 25.0% (South Carolina: 32.0%)
> Adults in fair or poor health: 14.0% (South Carolina: 19.1%)
> Median household income: $63,756 (South Carolina: $49,501)
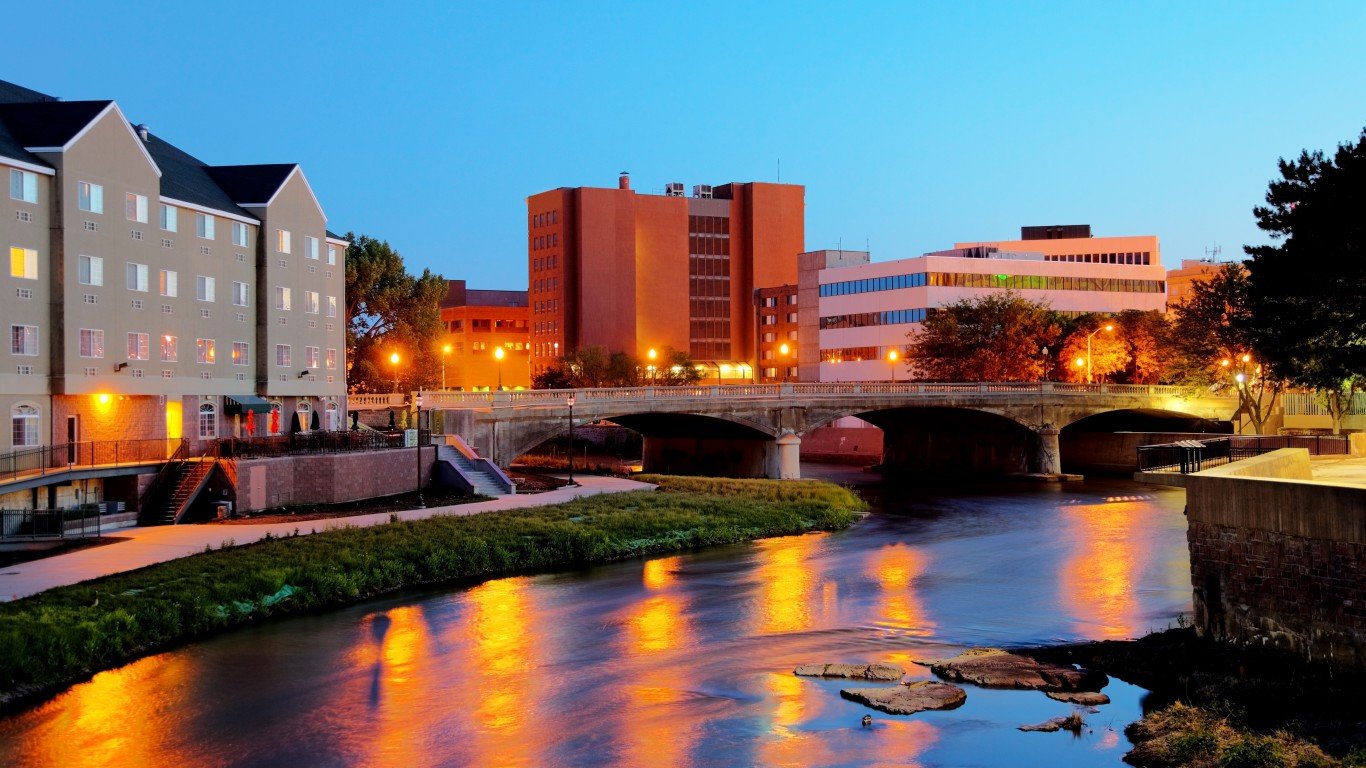
41. Sioux Falls, South Dakota
> Physically active adults: 79.6% (South Dakota: 78.5%)
> Population with access to exercise locations: 87.5% (South Dakota: 72.3%)
> Obesity rate: 30.1% (South Dakota: 30.6%)
> Adults in fair or poor health: 10.0% (South Dakota: 11.8%)
> Median household income: $63,931 (South Dakota: $54,467)
[in-text-ad]
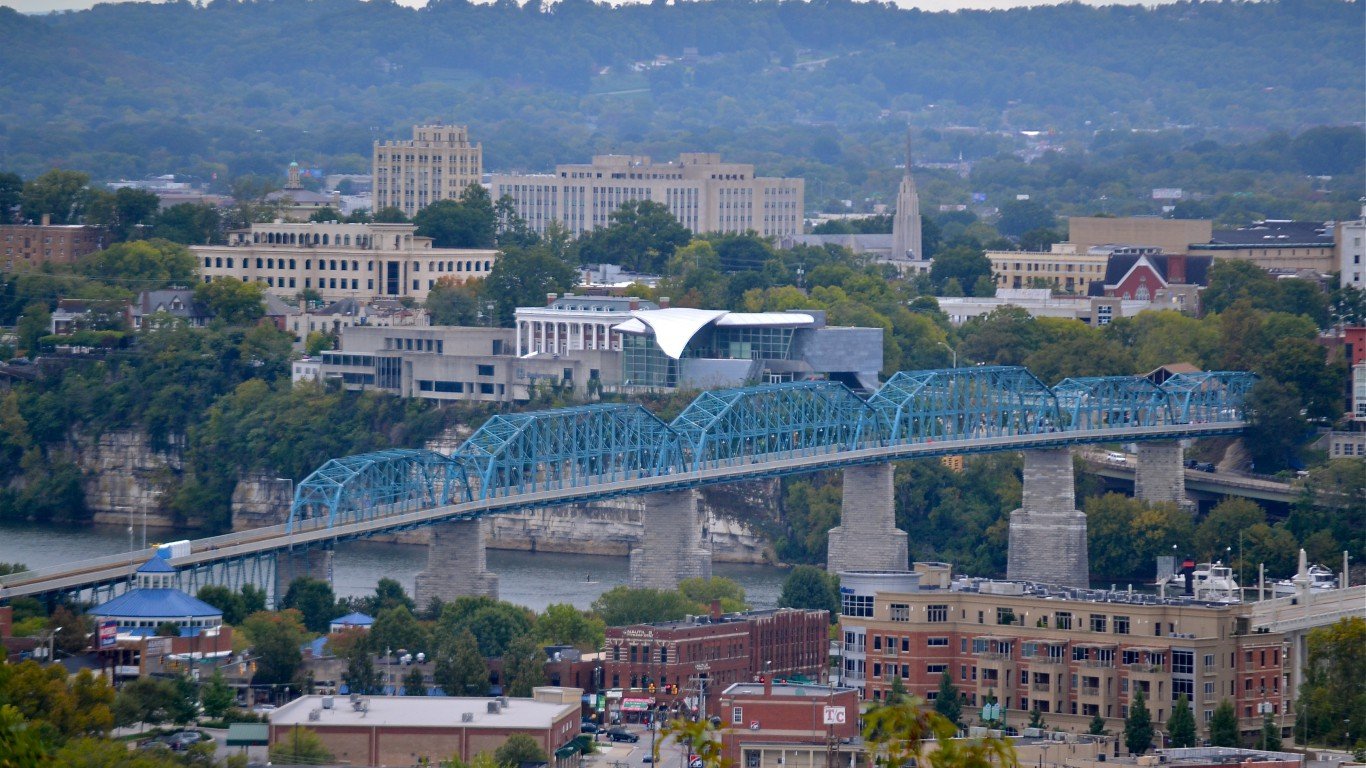
42. Chattanooga, Tennessee
> Physically active adults: 71.6% (Tennessee: 69.9%)
> Population with access to exercise locations: 80.7% (Tennessee: 71.2%)
> Obesity rate: 31.3% (Tennessee: 32.4%)
> Adults in fair or poor health: 16.8% (Tennessee: 19.1%)
> Median household income: $46,537 (Tennessee: $48,547)
[recirclink id=443620]

43. Austin-Round Rock, Texas
> Physically active adults: 82.7% (Texas: 75.7%)
> Population with access to exercise locations: 89.6% (Texas: 80.6%)
> Obesity rate: 24.3% (Texas: 28.4%)
> Adults in fair or poor health: 14.4% (Texas: 18.2%)
> Median household income: $71,000 (Texas: $56,565)

44. Salt Lake City, Utah
> Physically active adults: 82.6% (Utah: 82.6%)
> Population with access to exercise locations: 92.7% (Utah: 87.7%)
> Obesity rate: 25.3% (Utah: 25.3%)
> Adults in fair or poor health: 12.2% (Utah: 12.1%)
> Median household income: $68,196 (Utah: $65,977)
[in-text-ad-2]
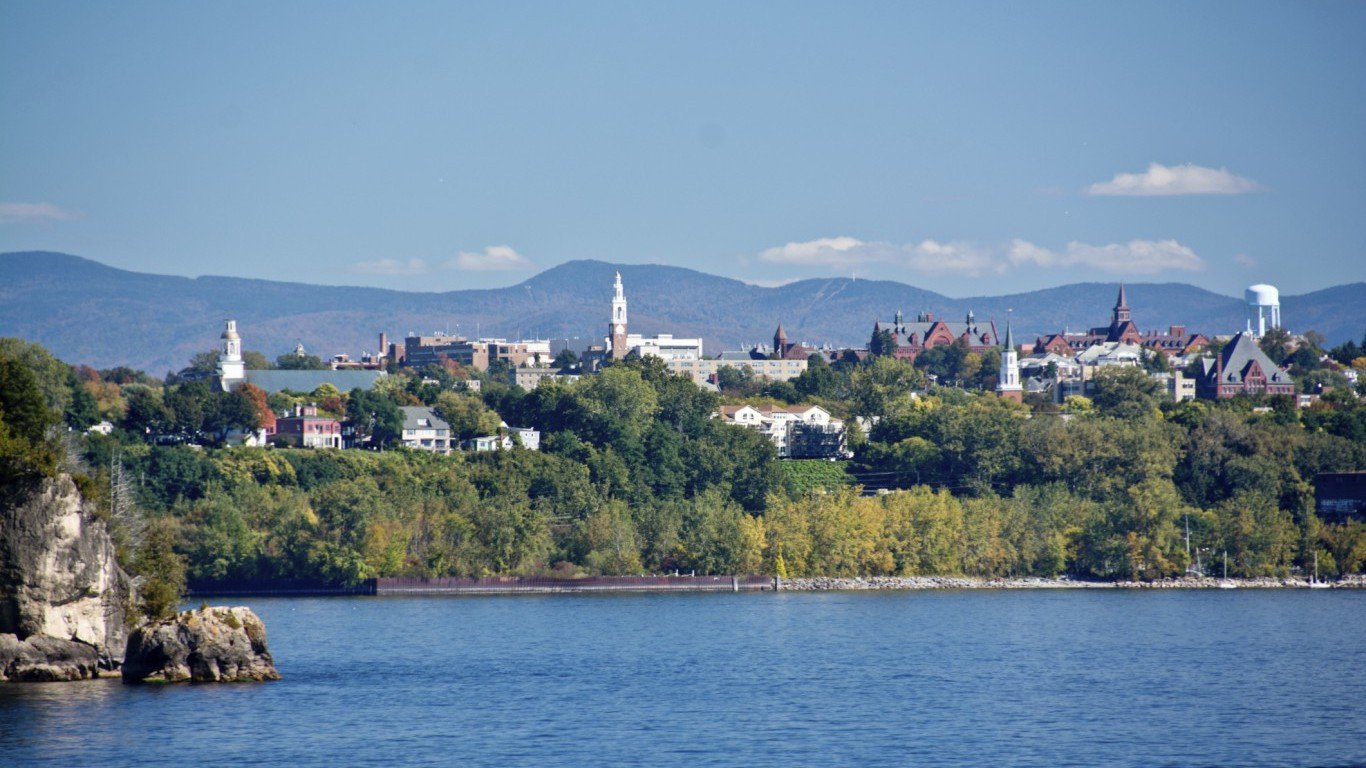
45. Burlington-South Burlington, Vermont
> Physically active adults: 82.5% (Vermont: 80.5%)
> Population with access to exercise locations: 85.0% (Vermont: 78.5%)
> Obesity rate: 21.7% (Vermont: 24.7%)
> Adults in fair or poor health: 10.5% (Vermont: 12.5%)
> Median household income: $66,367 (Vermont: $57,677)

46. Virginia Beach-Norfolk-Newport News, Virginia
> Physically active adults: 76.3% (Virginia: 77.7%)
> Population with access to exercise locations: 90.4% (Virginia: 83.2%)
> Obesity rate: 31.3% (Virginia: 28.3%)
> Adults in fair or poor health: 15.3% (Virginia: 15.9%)
> Median household income: $61,805 (Virginia: $68,114)
[in-text-ad]

47. Seattle-Tacoma-Bellevue, Washington
> Physically active adults: 84.2% (Washington: 82.9%)
> Population with access to exercise locations: 92.5% (Washington: 87.5%)
> Obesity rate: 25.1% (Washington: 27.0%)
> Adults in fair or poor health: 11.6% (Washington: 13.9%)
> Median household income: $78,612 (Washington: $67,106)
[recirclink id=443575]

48. Weirton-Steubenville, West Virginia
> Physically active adults: 70.0% (West Virginia: 70.8%)
> Population with access to exercise locations: 87.7% (West Virginia: 63.4%)
> Obesity rate: 37.2% (West Virginia: 35.5%)
> Adults in fair or poor health: 19.0% (West Virginia: 24.1%)
> Median household income: $44,733 (West Virginia: $43,385)
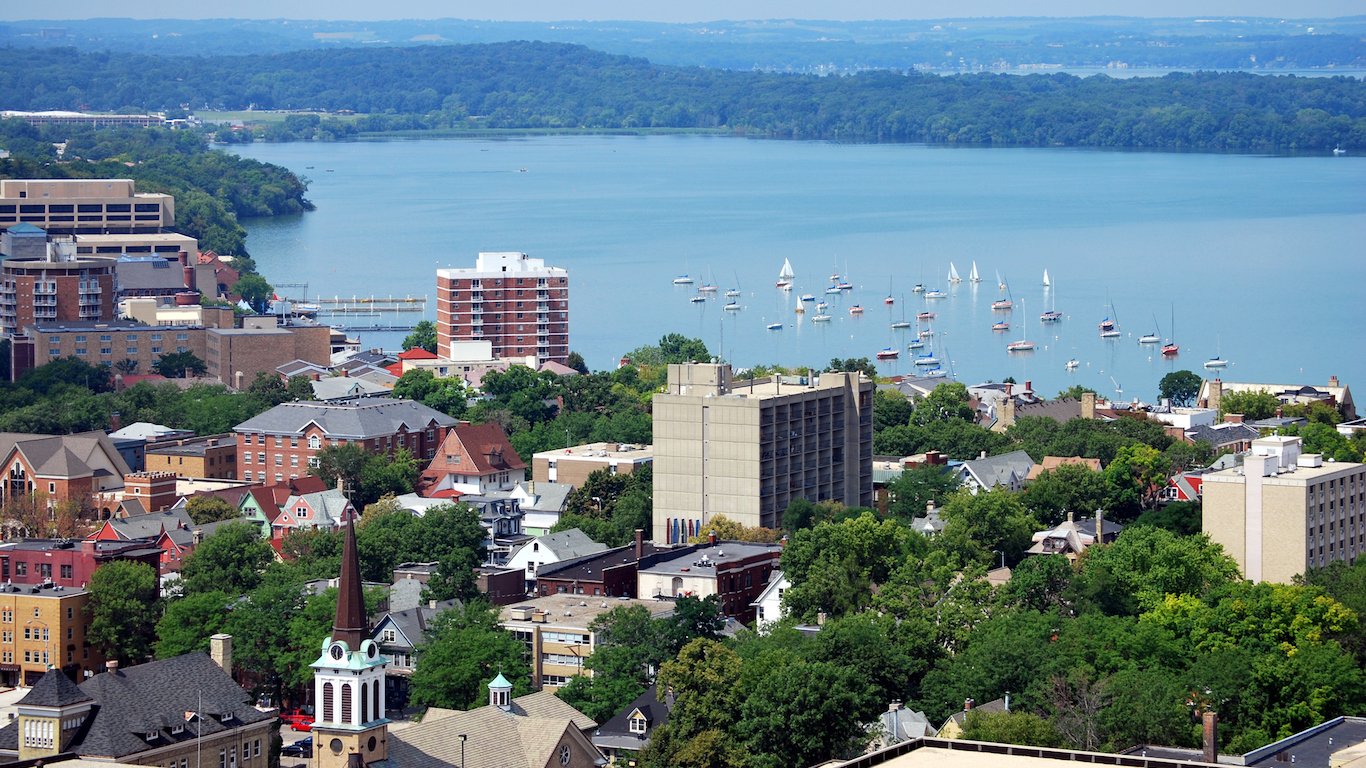
49. Madison, Wisconsin
> Physically active adults: 82.9% (Wisconsin: 78.9%)
> Population with access to exercise locations: 90.7% (Wisconsin: 86.3%)
> Obesity rate: 26.0% (Wisconsin: 30.6%)
> Adults in fair or poor health: 12.7% (Wisconsin: 15.4%)
> Median household income: $68,497 (Wisconsin: $56,811)
[in-text-ad-2]
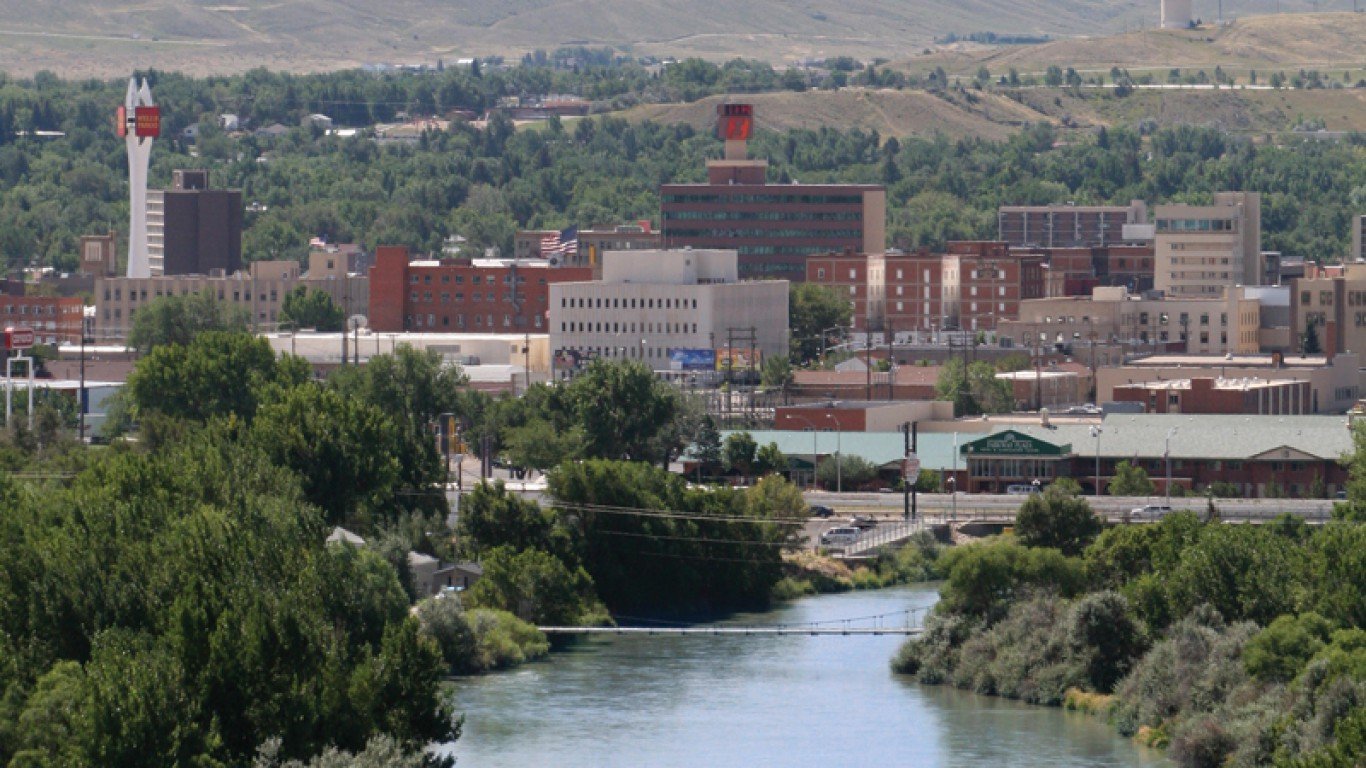
50. Casper, Wyoming
> Physically active adults: 75.8% (Wyoming: 76.3%)
> Population with access to exercise locations: 85.4% (Wyoming: 73.7%)
> Obesity rate: 31.3% (Wyoming: 28.5%)
> Adults in fair or poor health: 14.9% (Wyoming: 15.1%)
> Median household income: $59,474 (Wyoming: $59,882)
Detailed Findings
Many of the most physically active cities in the country are on the West Coast. The state with the highest activity rate is Colorado, where 84.9% of adults exercise regularly. Other active states include Oregon, Washington, Utah, and California.
Meanwhile, the Southern U.S. is home to many of the most inactive states. In Mississippi, just 66.0% of adults exercise regularly, the smallest share of any state. States with the lowest activity rates also include Arkansas, Tennessee, Oklahoma, and West Virginia.
In some of the less healthy parts of the country, even the most active city is relatively sedentary compared to the U.S. as a whole. While the Weirton-Steubenville metro area has the highest activity rate in West Virginia, for example, just 70.0% of city adults exercise regularly, well below the 77.0% national figure. Other cities which, despite ranking number one in their state, have lower activity rates than the nation as a whole include Dover, Delaware; Hattiesburg, Mississippi; Chattanooga, Tennessee; Oklahoma City, Oklahoma; New Orleans, Louisiana; Fayetteville, Arkansas; Providence, Rhode Island; New York, New York; Cleveland, Ohio; Daphne, Alabama; Casper, Wyoming; and Virginia Beach, Virginia.
Active populations need access to venues for physical activities, such as parks, gyms, and recreation centers. In 38 of the 50 most active cities in the country, a greater share of residents have access to venues for physical activity than the 83.0% national figure.
Exercise is one of the primary determinants of overall health. Adults who exercise more are far more likely to maintain other healthy habits, and less likely be obese or die prematurely. The obesity rate in 46 of the 50 most physically active cities is below the 28.0% national figure. Similarly, the premature death rates in all 50 of the most active cities rank in the lower half of all metro areas.
Methodology
To identify the fitness capital of every state, 24/7 Wall St. created an index of two measures: the share of adults in a metro area who are physically active during their leisure time and the share of the population who have access to venues for physical activities outside of their homes. Information on leisure time physical activity, access to exercise locations, obesity rates, and adults who report being in fair or poor health comes from County Health Rankings & Roadmaps, a collaboration between the Robert Wood Johnson Foundation and the University of Wisconsin Population Health Institute. Population figures come from the U.S. Census Bureau’s American Community Survey and are for 2016.
Contact [email protected] for any questions or corrections.