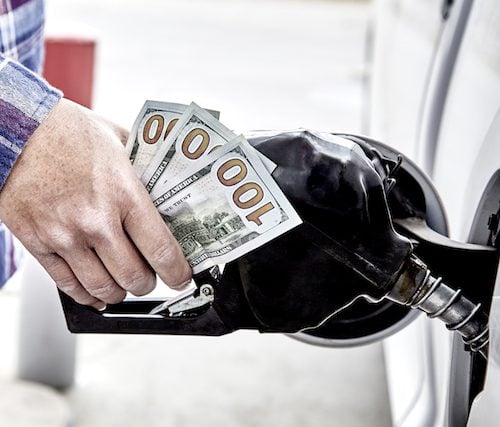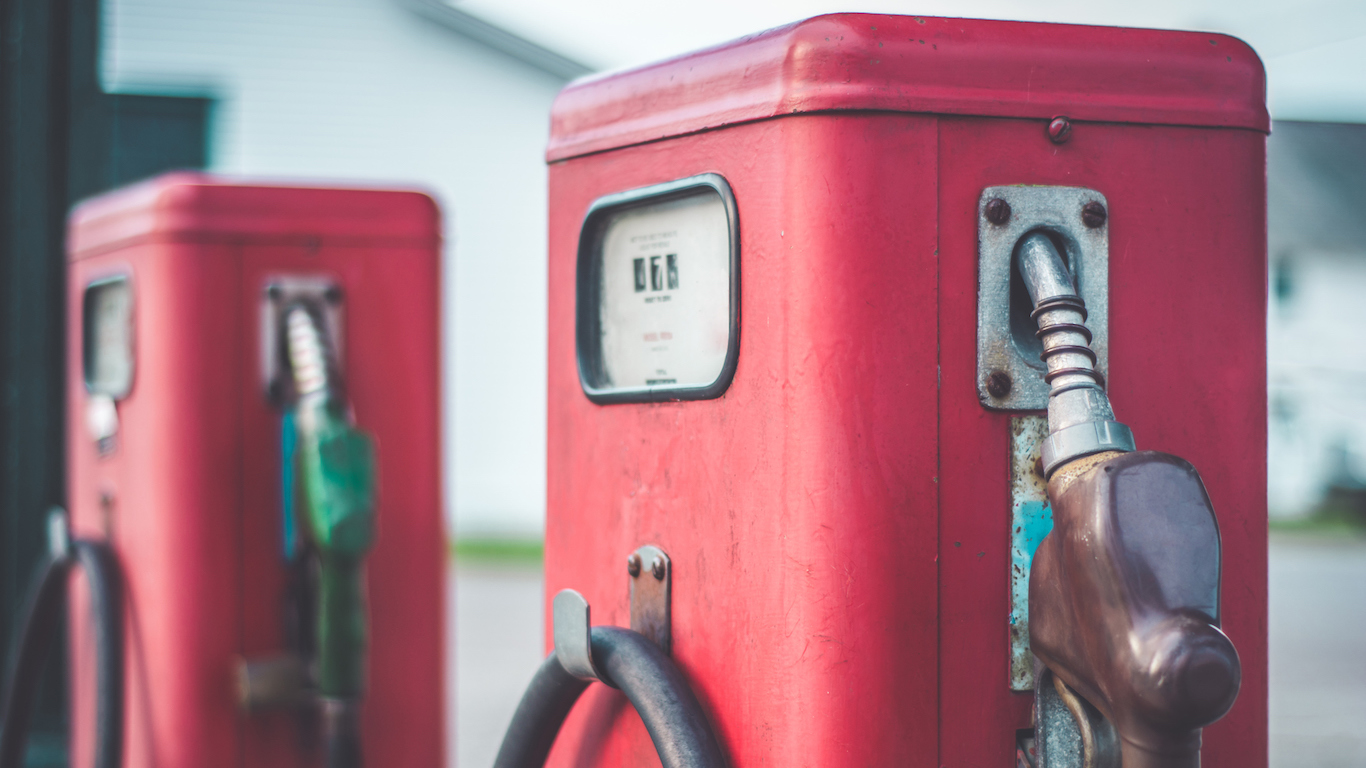
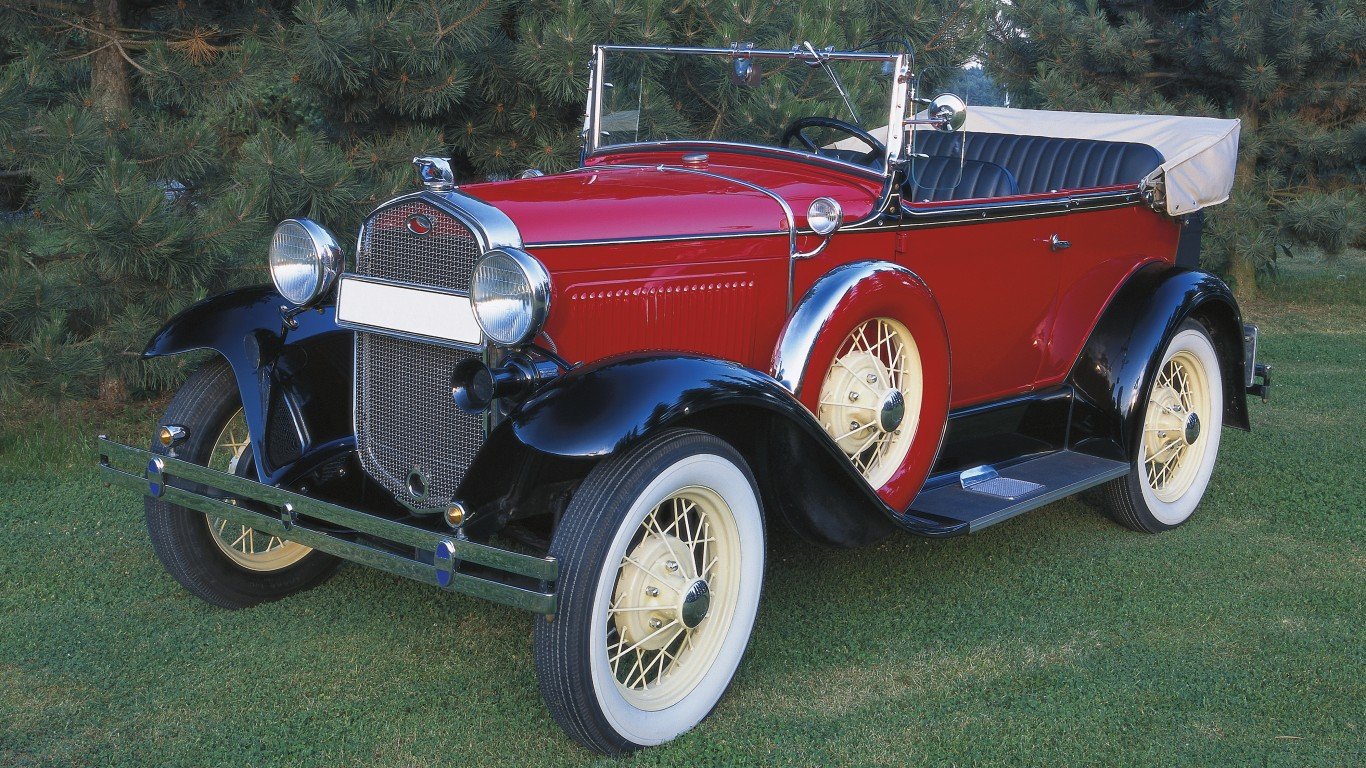
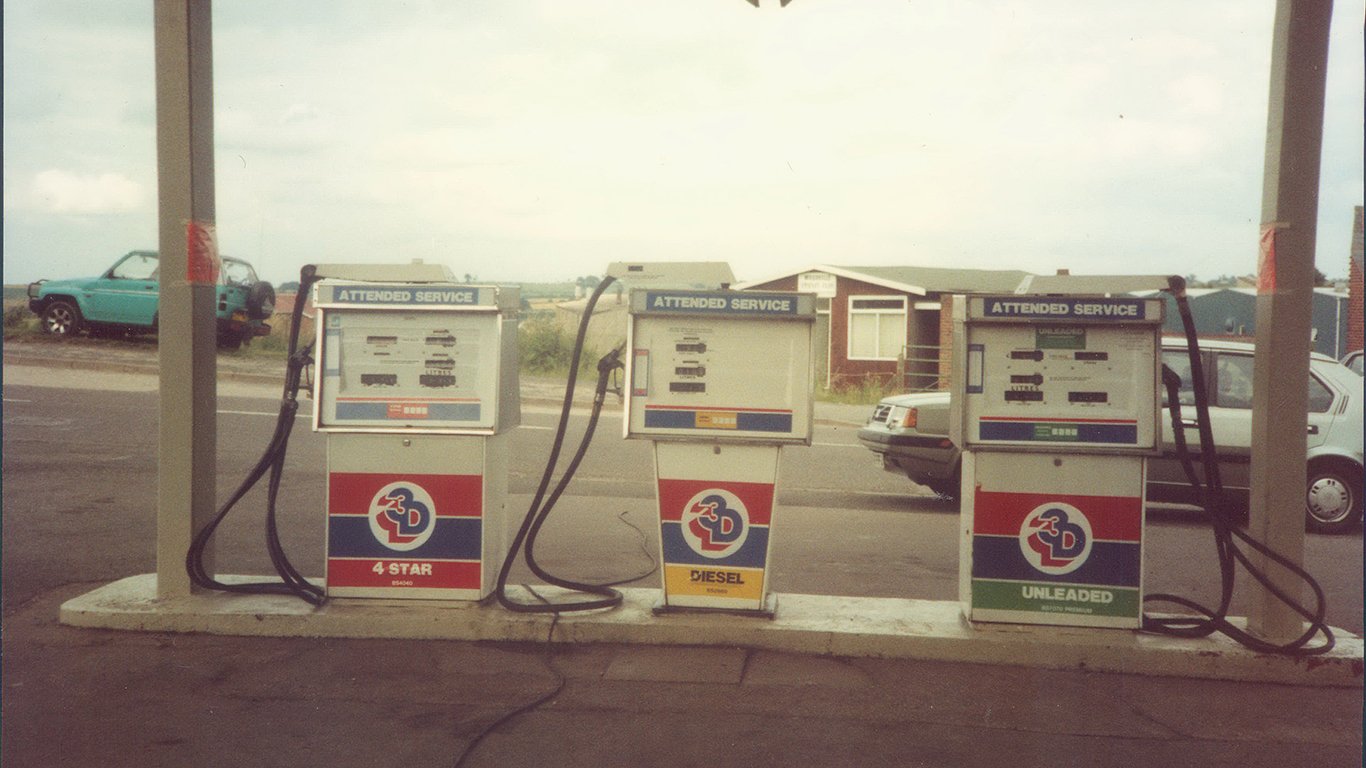
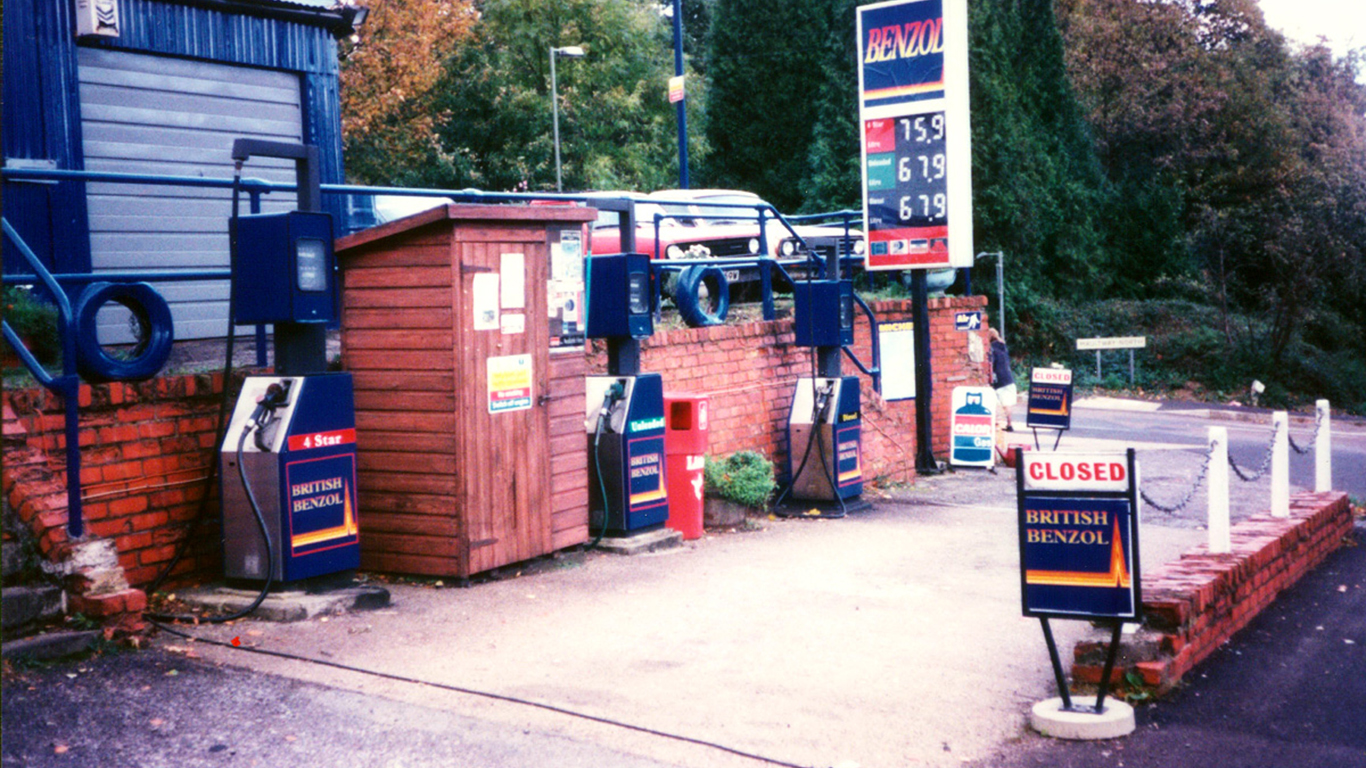
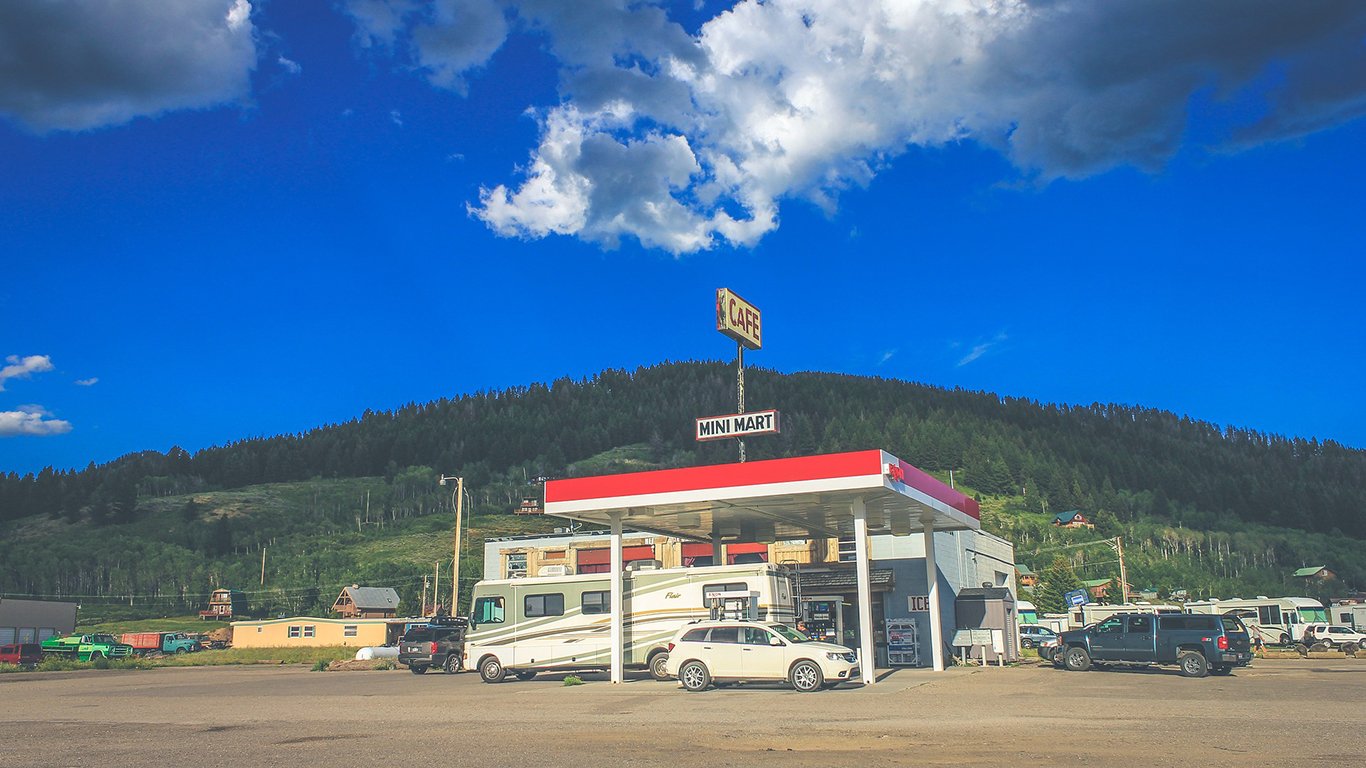
In the early 1930s, an American motorist could pull up to the pump in a Ford Model T Speedster running on fumes, and for little more than a dollar drive away with a full tank. Today, the same amount of gasoline costs about $25.
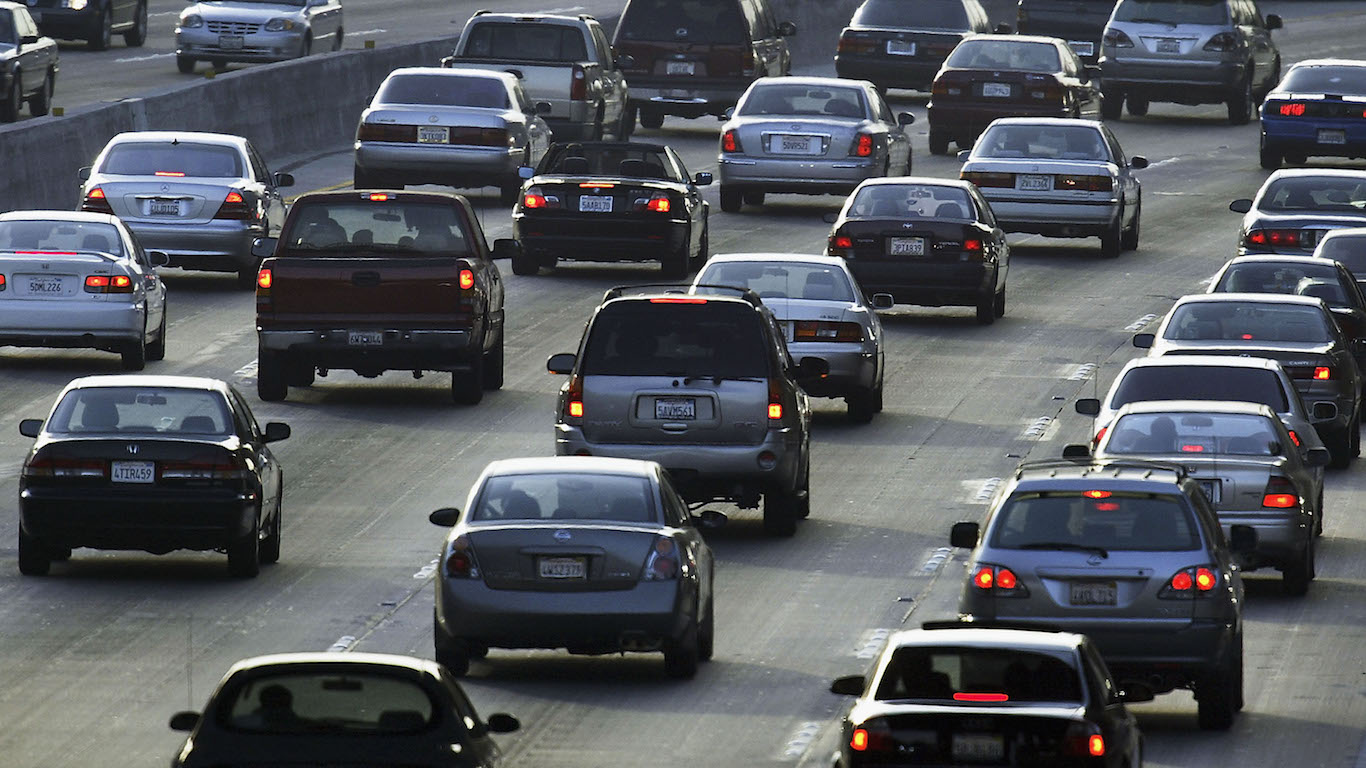
Inflation is the primary reason for the increase in gas prices over time. However, while inflation affects the cost of all goods and services, the price of gasoline is subject to a number of additional market forces — and it can be uniquely volatile.
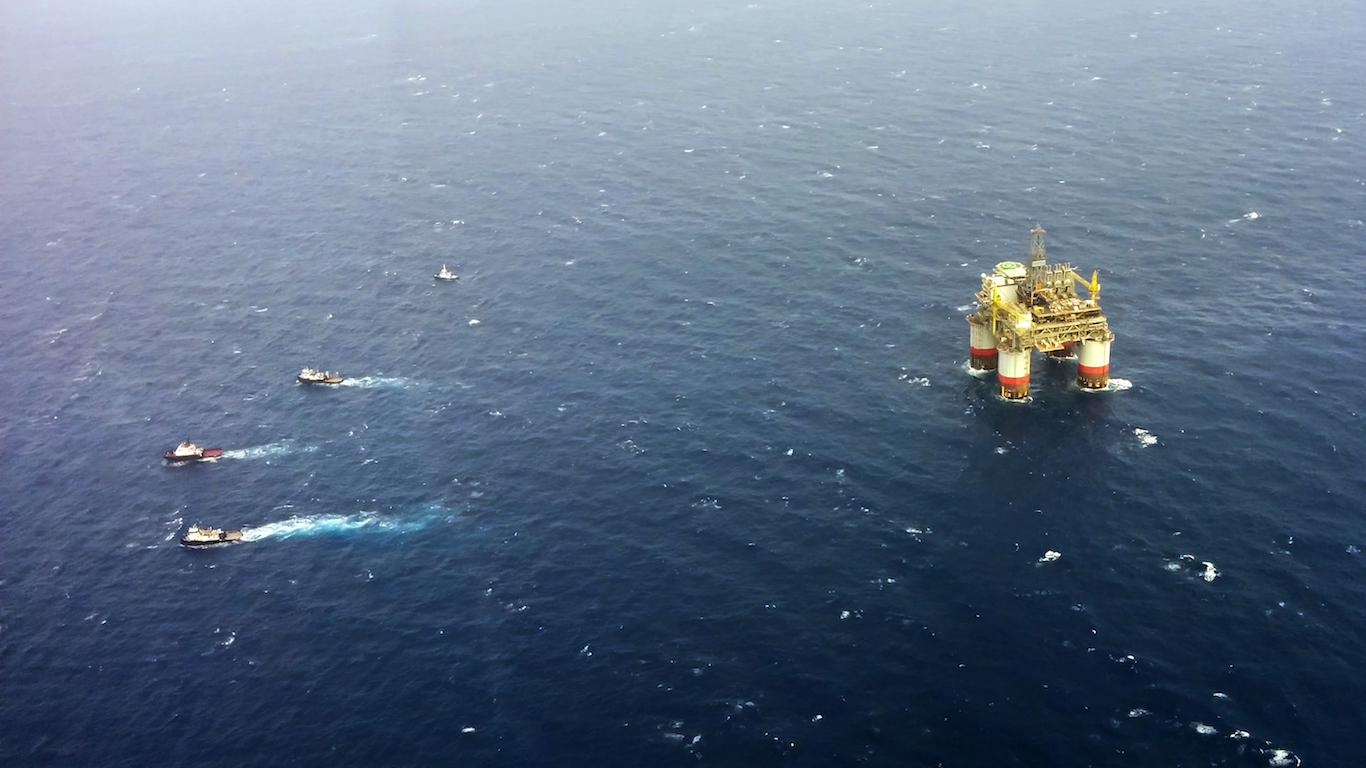
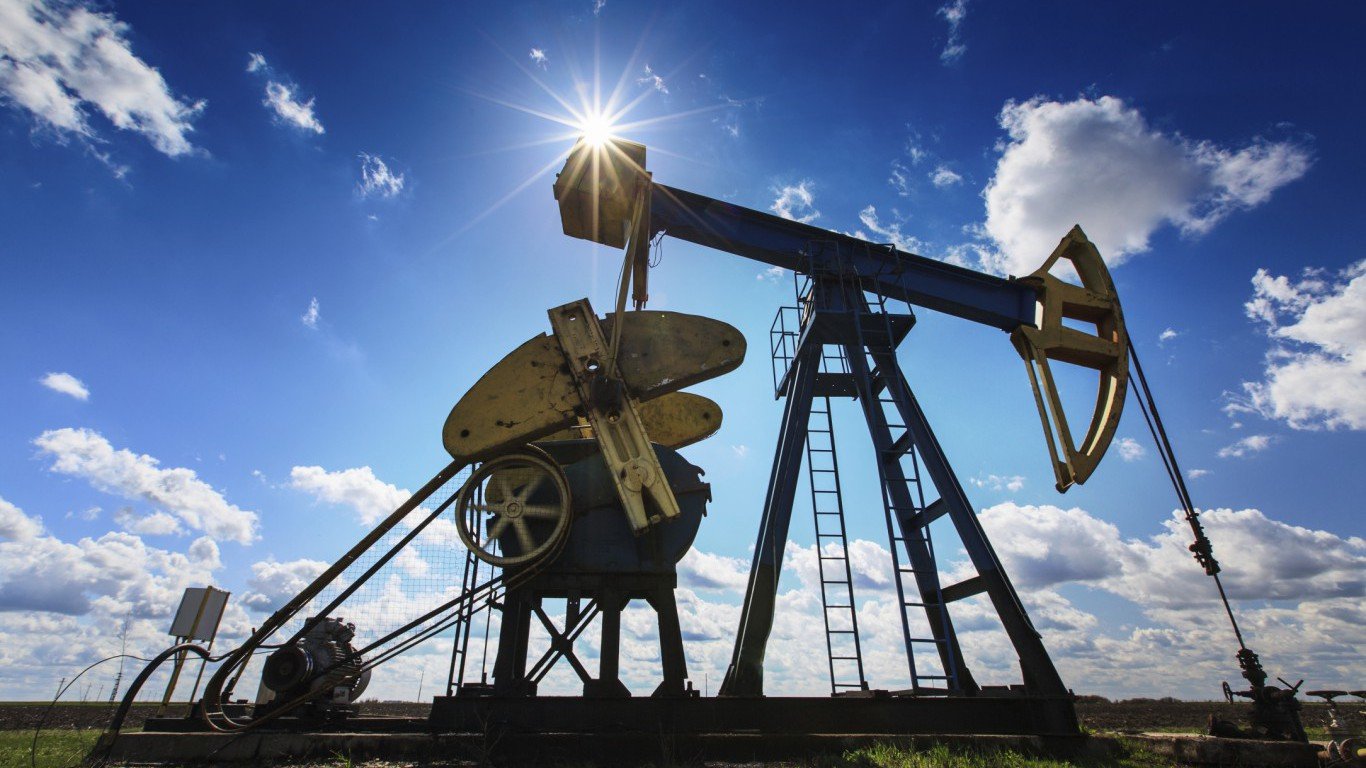
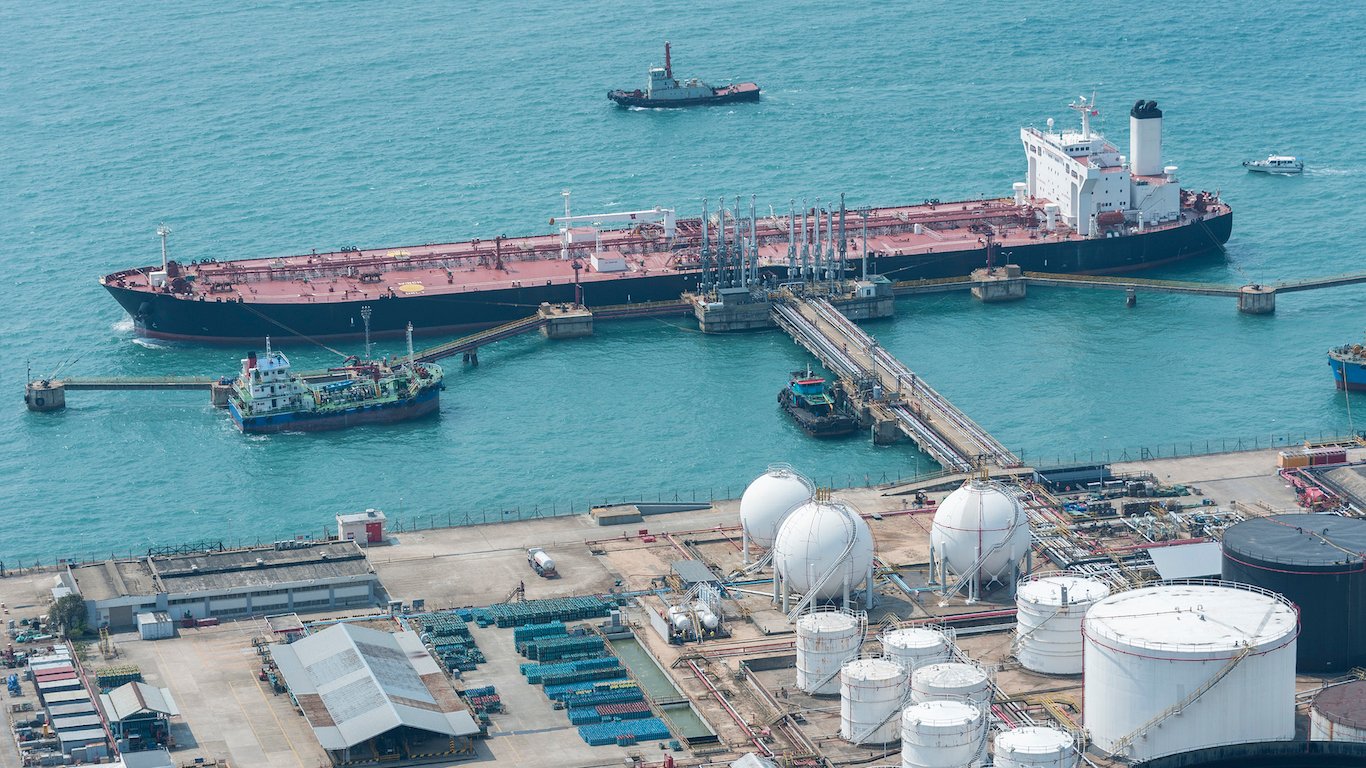
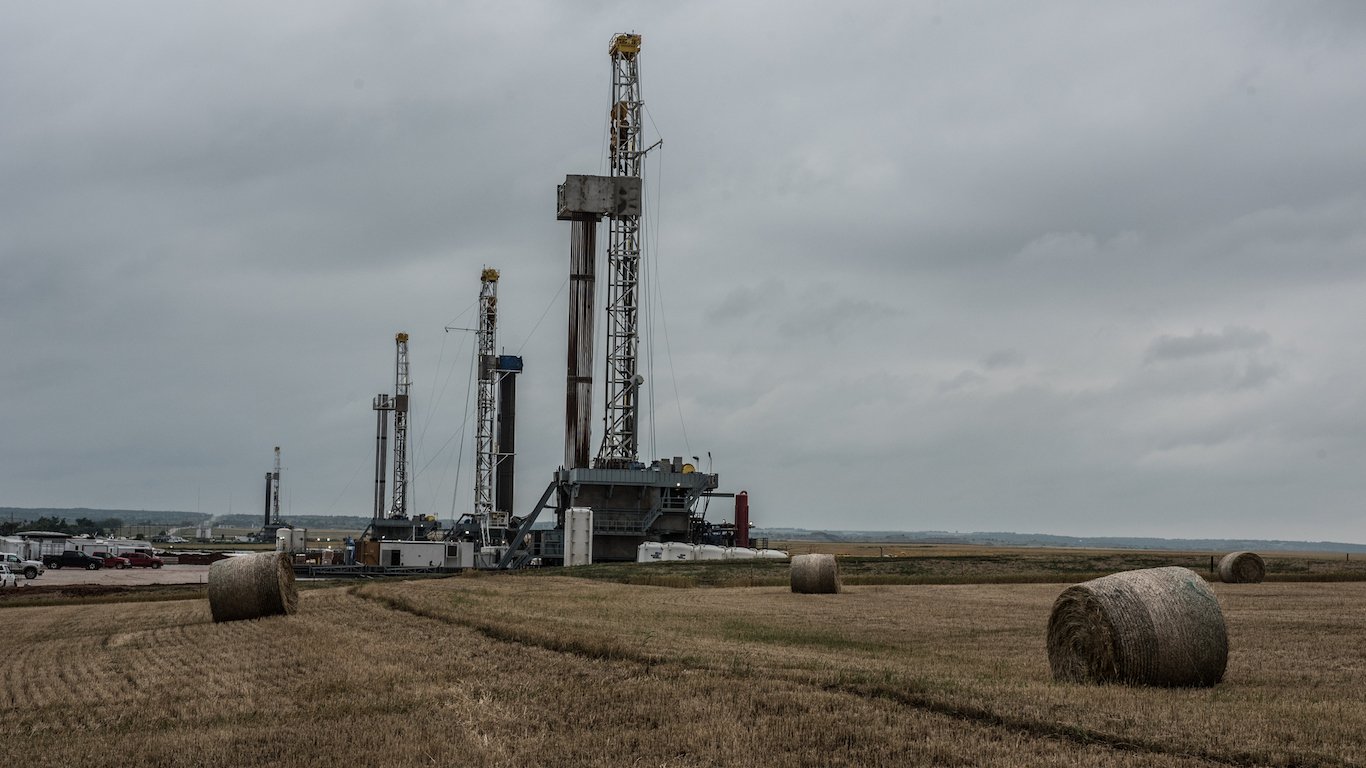
The average cost of a gallon of gas in the United States is the product of a number of interrelated global market forces. Foreign and domestic oil production, consumption, projected demand, financial markets, refining capacity, supply chain disruptions, transportation costs, futures speculation, and the value of the U.S. dollar all affect the price of gasoline.
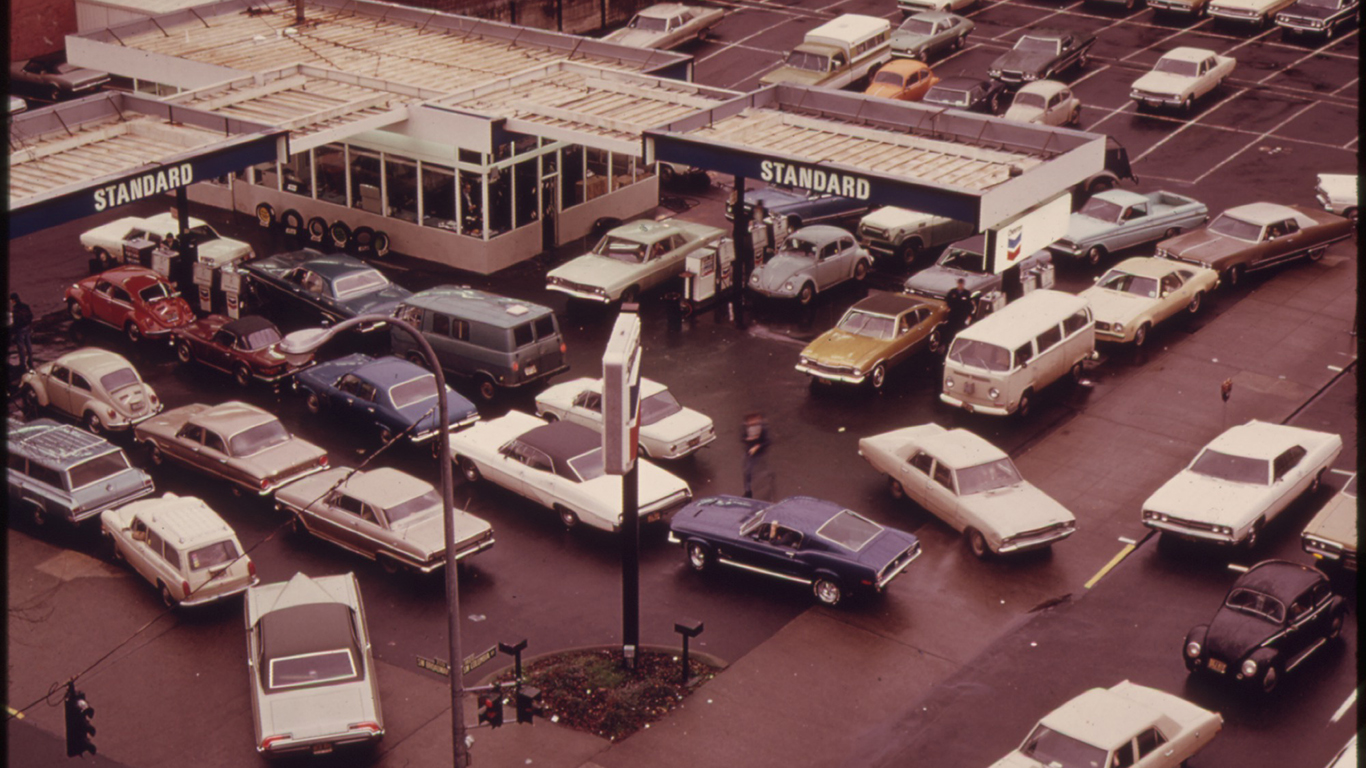
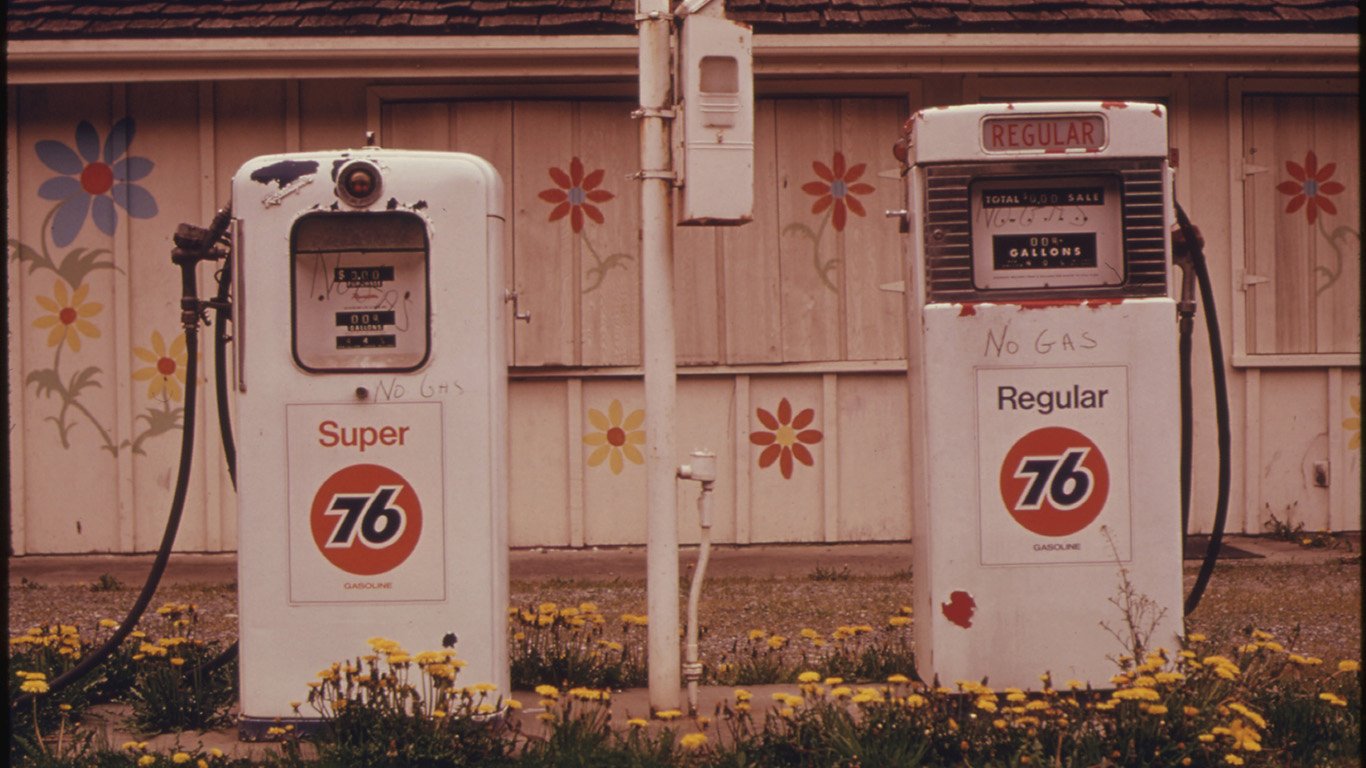
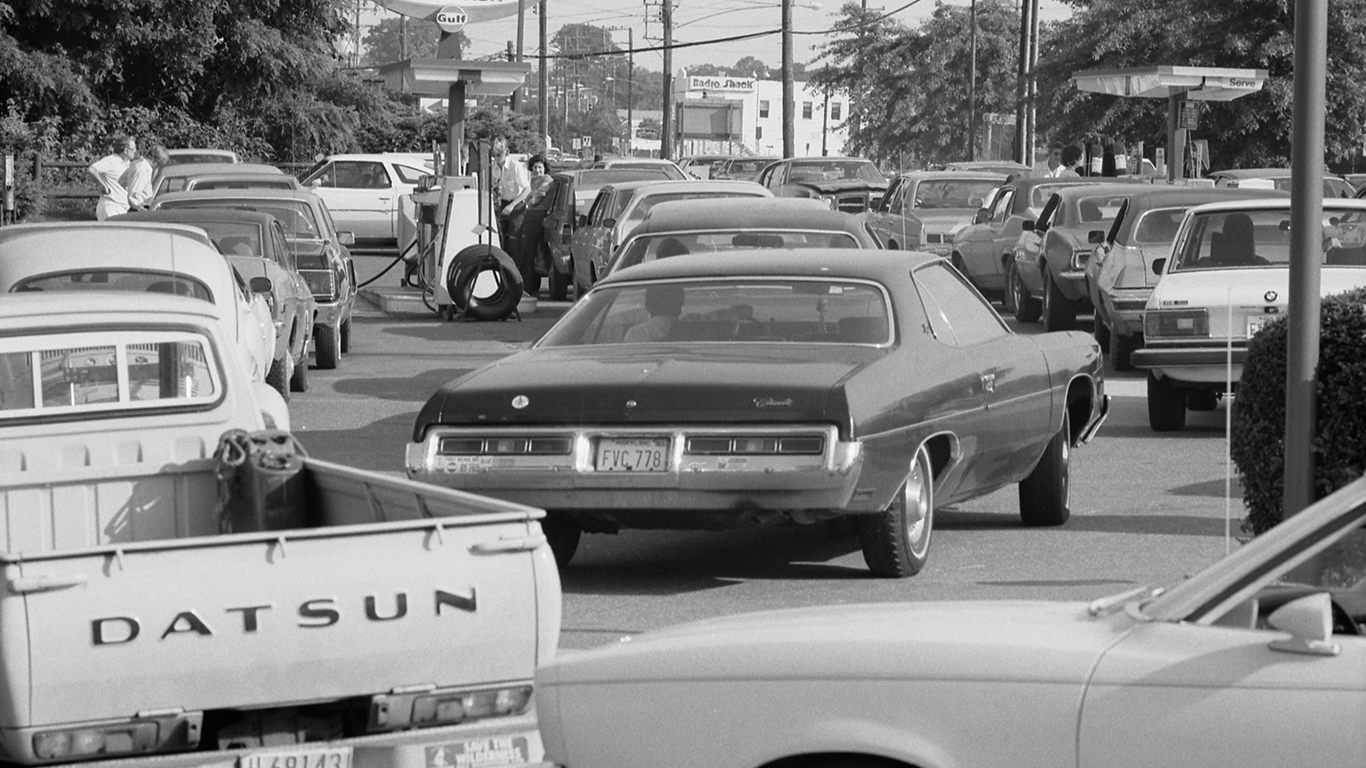
Seemingly unrelated geopolitical and economic events can also influence the price of crude oil, which largely determines the price of a gallon of gas. For example, the cost of a barrel of oil more than doubled in the early 1970s, when oil-exporting Arab states imposed an embargo to retaliate against the United States for lending military aid to Israel. Similarly, the price of crude oil hit an all time high of over $160 per barrel during the 2008 global financial crisis. Today, crude oil prices are around $68 a barrel.
Adjusting the price of gasoline in the United States for inflation highlights just how much motorists actually pay for a gallon of gas. The average cost of a gallon in 2016 was just $2.14, well below the inflation-adjusted all-time high of $3.86 in 2012.
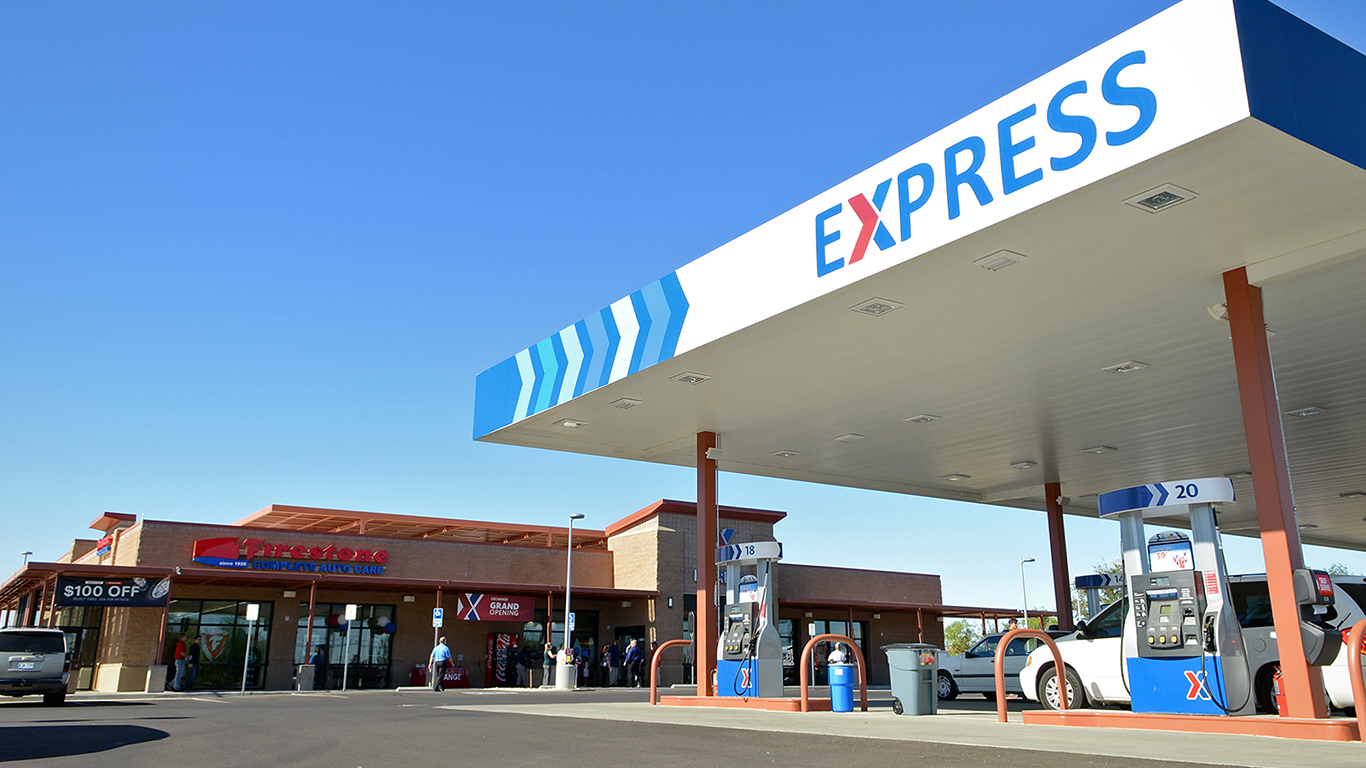
Similarly, though gas stations nationwide sold gas by the gallon for less than a quarter through much of the first half of the 20th century, accounting for inflation, it was not until the 1990s that real gas prices hit an all-time low.
24/7 Wall St. reviewed data from the U.S. Energy Information Administration to determine the average cost of a gallon of gas every year since 1929. We also reviewed the price of a barrel of oil each year, average daily U.S. oil production, and gasoline consumption. Annual data on total gasoline consumption and per capita consumption is only available from 1945 through the present.
Click here to see the cost of gas the year you were born.
Click here to see our methodology.

1929
> Price per gallon (inflation adj.): $0.21 ($2.41)
> Price per barrel (inflation adj.): $1.27 ($14.30)
> U.S. oil production: 2.8 million barrels per day
[in-text-ad]

1930
> Price per gallon (inflation adj.): $0.20 ($2.33)
> Price per barrel (inflation adj.): $1.19 ($13.91)
> U.S. oil production: 2.5 million barrels per day
1931
> Price per gallon (inflation adj.): $0.17 ($2.21)
> Price per barrel (inflation adj.): $0.65 ($8.47)
> U.S. oil production: 2.3 million barrels per day

1932
> Price per gallon (inflation adj.): $0.18 ($2.65)
> Price per barrel (inflation adj.): $0.87 ($12.84)
> U.S. oil production: 2.1 million barrels per day
[recirclink id=444492]
1933
> Price per gallon (inflation adj.): $0.18 ($2.70)
> Price per barrel (inflation adj.): $0.67 ($10.17)
> U.S. oil production: 2.5 million barrels per day

1934
> Price per gallon (inflation adj.): $0.19 ($2.71)
> Price per barrel (inflation adj.): $1.00 ($14.38)
> U.S. oil production: 2.5 million barrels per day

1935
> Price per gallon (inflation adj.): $0.19 ($2.66)
> Price per barrel (inflation adj.): $0.97 ($13.67)
> U.S. oil production: 2.7 million barrels per day
[in-text-ad-2]

1936
> Price per gallon (inflation adj.): $0.19 ($2.71)
> Price per barrel (inflation adj.): $1.09 ($15.18)
> U.S. oil production: 3.0 million barrels per day

1937
> Price per gallon (inflation adj.): $0.20 ($2.67)
> Price per barrel (inflation adj.): $1.18 ($15.75)
> U.S. oil production: 3.5 million barrels per day

1938
> Price per gallon (inflation adj.): $0.20 ($2.68)
> Price per barrel (inflation adj.): $1.13 ($15.53)
> U.S. oil production: 3.3 million barrels per day

1939
> Price per gallon (inflation adj.): $0.19 ($2.60)
> Price per barrel (inflation adj.): $1.02 ($14.15)
> U.S. oil production: 3.5 million barrels per day
[in-text-ad]

1940
> Price per gallon (inflation adj.): $0.18 ($2.52)
> Price per barrel (inflation adj.): $1.02 ($13.98)
> U.S. oil production: 4.1 million barrels per day

1941
> Price per gallon (inflation adj.): $0.19 ($2.47)
> Price per barrel (inflation adj.): $1.14 ($14.64)
> U.S. oil production: 3.8 million barrels per day

1942
> Price per gallon (inflation adj.): $0.20 ($2.43)
> Price per barrel (inflation adj.): $1.19 ($14.16)
> U.S. oil production: 3.8 million barrels per day
[recirclink id=444468]

1943
> Price per gallon (inflation adj.): $0.21 ($2.34)
> Price per barrel (inflation adj.): $1.20 ($13.65)
> U.S. oil production: 4.1 million barrels per day
1944
> Price per gallon (inflation adj.): $0.21 ($2.29)
> Price per barrel (inflation adj.): $1.21 ($13.45)
> U.S. oil production: 4.6 million barrels per day

1945
> Price per gallon (inflation adj.): $0.20 ($2.22)
> Price per barrel (inflation adj.): $1.22 ($13.22)
> U.S. gas consumption: 579.3 million barrels
> Per capita consumption: 173.9 gallons
> U.S. oil production: 4.7 million barrels per day
[in-text-ad-2]

1946
> Price per gallon (inflation adj.): $0.21 ($1.99)
> Price per barrel (inflation adj.): $1.41 ($13.53)
> U.S. gas consumption: 722.5 million barrels
> Per capita consumption: 214.6 gallons
> U.S. oil production: 4.7 million barrels per day

1947
> Price per gallon (inflation adj.): $0.23 ($2.00)
> Price per barrel (inflation adj.): $1.93 ($16.69)
> U.S. gas consumption: 773.4 million barrels
> Per capita consumption: 225.4 gallons
> U.S. oil production: 5.1 million barrels per day

1948
> Price per gallon (inflation adj.): $0.26 ($2.12)
> Price per barrel (inflation adj.): $2.60 ($21.30)
> U.S. gas consumption: 834.6 million barrels
> Per capita consumption: 239.0 gallons
> U.S. oil production: 5.5 million barrels per day
1949
> Price per gallon (inflation adj.): $0.27 ($2.20)
> Price per barrel (inflation adj.): $2.54 ($20.84)
> U.S. gas consumption: 879.7 million barrels
> Per capita consumption: 247.7 gallons
> U.S. oil production: 5.0 million barrels per day
[in-text-ad]

1950
> Price per gallon (inflation adj.): $0.27 ($2.17)
> Price per barrel (inflation adj.): $2.51 ($20.35)
> U.S. gas consumption: 954.8 million barrels
> Per capita consumption: 263.3 gallons
> U.S. oil production: 5.4 million barrels per day
1951
> Price per gallon (inflation adj.): $0.27 ($2.06)
> Price per barrel (inflation adj.): $2.53 ($19.16)
> U.S. gas consumption: 1.1 billion barrels
> Per capita consumption: 295.5 gallons
> U.S. oil production: 6.2 million barrels per day
1952
> Price per gallon (inflation adj.): $0.27 ($2.04)
> Price per barrel (inflation adj.): $2.53 ($18.83)
> U.S. gas consumption: 1.1 billion barrels
> Per capita consumption: 288.2 gallons
> U.S. oil production: 6.3 million barrels per day
[recirclink id=444391]
1953
> Price per gallon (inflation adj.): $0.29 ($2.11)
> Price per barrel (inflation adj.): $2.68 ($19.71)
> U.S. gas consumption: 1.1 billion barrels
> Per capita consumption: 297.6 gallons
> U.S. oil production: 6.5 million barrels per day

1954
> Price per gallon (inflation adj.): $0.29 ($2.11)
> Price per barrel (inflation adj.): $2.78 ($20.25)
> U.S. gas consumption: 1.2 billion barrels
> Per capita consumption: 300.3 gallons
> U.S. oil production: 6.3 million barrels per day
1955
> Price per gallon (inflation adj.): $0.29 ($2.08)
> Price per barrel (inflation adj.): $2.77 ($19.84)
> U.S. gas consumption: 1.3 billion barrels
> Per capita consumption: 320.0 gallons
> U.S. oil production: 6.8 million barrels per day
[in-text-ad-2]

1956
> Price per gallon (inflation adj.): $0.30 ($2.07)
> Price per barrel (inflation adj.): $2.79 ($19.32)
> U.S. gas consumption: 1.3 billion barrels
> Per capita consumption: 322.9 gallons
> U.S. oil production: 7.2 million barrels per day

1957
> Price per gallon (inflation adj.): $0.31 ($2.08)
> Price per barrel (inflation adj.): $3.09 ($20.71)
> U.S. gas consumption: 1.3 billion barrels
> Per capita consumption: 322.2 gallons
> U.S. oil production: 7.2 million barrels per day
1958
> Price per gallon (inflation adj.): $0.30 ($1.99)
> Price per barrel (inflation adj.): $3.01 ($19.73)
> U.S. gas consumption: 1.4 billion barrels
> Per capita consumption: 325.3 gallons
> U.S. oil production: 6.7 million barrels per day
1959
> Price per gallon (inflation adj.): $0.30 ($1.97)
> Price per barrel (inflation adj.): $2.90 ($18.75)
> U.S. gas consumption: 1.4 billion barrels
> Per capita consumption: 332.7 gallons
> U.S. oil production: 7.1 million barrels per day
[in-text-ad]

1960
> Price per gallon (inflation adj.): $0.31 ($1.98)
> Price per barrel (inflation adj.): $2.88 ($18.37)
> U.S. gas consumption: 1.5 billion barrels
> Per capita consumption: 337.7 gallons
> U.S. oil production: 7.0 million barrels per day

1961
> Price per gallon (inflation adj.): $0.31 ($1.94)
> Price per barrel (inflation adj.): $2.89 ($18.23)
> U.S. gas consumption: 1.5 billion barrels
> Per capita consumption: 337.4 gallons
> U.S. oil production: 7.2 million barrels per day

1962
> Price per gallon (inflation adj.): $0.31 ($1.91)
> Price per barrel (inflation adj.): $2.90 ($18.07)
> U.S. gas consumption: 1.5 billion barrels
> Per capita consumption: 345.1 gallons
> U.S. oil production: 7.3 million barrels per day
[recirclink id=444326]

1963
> Price per gallon (inflation adj.): $0.30 ($1.87)
> Price per barrel (inflation adj.): $2.89 ($17.81)
> U.S. gas consumption: 1.6 billion barrels
> Per capita consumption: 351.1 gallons
> U.S. oil production: 7.5 million barrels per day
1964
> Price per gallon (inflation adj.): $0.30 ($1.84)
> Price per barrel (inflation adj.): $2.88 ($17.48)
> U.S. gas consumption: 1.6 billion barrels
> Per capita consumption: 352.7 gallons
> U.S. oil production: 7.6 million barrels per day
1965
> Price per gallon (inflation adj.): $0.31 ($1.86)
> Price per barrel (inflation adj.): $2.86 ($17.04)
> U.S. gas consumption: 1.7 billion barrels
> Per capita consumption: 362.3 gallons
> U.S. oil production: 7.8 million barrels per day
[in-text-ad-2]
1966
> Price per gallon (inflation adj.): $0.32 ($1.86)
> Price per barrel (inflation adj.): $2.88 ($16.69)
> U.S. gas consumption: 1.8 billion barrels
> Per capita consumption: 375.0 gallons
> U.S. oil production: 8.3 million barrels per day
1967
> Price per gallon (inflation adj.): $0.33 ($1.87)
> Price per barrel (inflation adj.): $2.92 ($16.45)
> U.S. gas consumption: 1.8 billion barrels
> Per capita consumption: 382.5 gallons
> U.S. oil production: 8.8 million barrels per day
1968
> Price per gallon (inflation adj.): $0.34 ($1.82)
> Price per barrel (inflation adj.): $2.94 ($15.88)
> U.S. gas consumption: 1.9 billion barrels
> Per capita consumption: 402.9 gallons
> U.S. oil production: 9.1 million barrels per day
1969
> Price per gallon (inflation adj.): $0.35 ($1.79)
> Price per barrel (inflation adj.): $3.09 ($15.91)
> U.S. gas consumption: 2.0 billion barrels
> Per capita consumption: 418.0 gallons
> U.S. oil production: 9.2 million barrels per day
[in-text-ad]
1970
> Price per gallon (inflation adj.): $0.36 ($1.75)
> Price per barrel (inflation adj.): $3.18 ($15.55)
> U.S. gas consumption: 2.1 billion barrels
> Per capita consumption: 432.5 gallons
> U.S. oil production: 9.6 million barrels per day

1971
> Price per gallon (inflation adj.): $0.36 ($1.69)
> Price per barrel (inflation adj.): $3.39 ($15.78)
> U.S. gas consumption: 2.2 billion barrels
> Per capita consumption: 444.0 gallons
> U.S. oil production: 9.5 million barrels per day
1972
> Price per gallon (inflation adj.): $0.36 ($1.61)
> Price per barrel (inflation adj.): $3.39 ($15.13)
> U.S. gas consumption: 2.3 billion barrels
> Per capita consumption: 467.0 gallons
> U.S. oil production: 9.4 million barrels per day
[recirclink id=444046]
1973
> Price per gallon (inflation adj.): $0.39 ($1.64)
> Price per barrel (inflation adj.): $3.89 ($16.46)
> U.S. gas consumption: 2.4 billion barrels
> Per capita consumption: 482.8 gallons
> U.S. oil production: 9.2 million barrels per day
1974
> Price per gallon (inflation adj.): $0.53 ($2.07)
> Price per barrel (inflation adj.): $6.87 ($26.67)
> U.S. gas consumption: 2.4 billion barrels
> Per capita consumption: 468.6 gallons
> U.S. oil production: 8.8 million barrels per day
1975
> Price per gallon (inflation adj.): $0.57 ($2.01)
> Price per barrel (inflation adj.): $7.67 ($27.26)
> U.S. gas consumption: 2.4 billion barrels
> Per capita consumption: 473.8 gallons
> U.S. oil production: 8.4 million barrels per day
[in-text-ad-2]
1976
> Price per gallon (inflation adj.): $0.59 ($1.99)
> Price per barrel (inflation adj.): $8.19 ($27.59)
> U.S. gas consumption: 2.6 billion barrels
> Per capita consumption: 491.9 gallons
> U.S. oil production: 8.1 million barrels per day

1977
> Price per gallon (inflation adj.): $0.62 ($1.97)
> Price per barrel (inflation adj.): $8.57 ($27.18)
> U.S. gas consumption: 2.6 billion barrels
> Per capita consumption: 499.6 gallons
> U.S. oil production: 8.2 million barrels per day
1978
> Price per gallon (inflation adj.): $0.63 ($1.86)
> Price per barrel (inflation adj.): $9.00 ($26.67)
> U.S. gas consumption: 2.7 billion barrels
> Per capita consumption: 510.5 gallons
> U.S. oil production: 8.7 million barrels per day
1979
> Price per gallon (inflation adj.): $0.86 ($2.35)
> Price per barrel (inflation adj.): $12.64 ($34.61)
> U.S. gas consumption: 2.6 billion barrels
> Per capita consumption: 479.2 gallons
> U.S. oil production: 8.6 million barrels per day
[in-text-ad]
1980
> Price per gallon (inflation adj.): $1.19 ($2.99)
> Price per barrel (inflation adj.): $21.59 ($54.22)
> U.S. gas consumption: 2.4 billion barrels
> Per capita consumption: 445.0 gallons
> U.S. oil production: 8.6 million barrels per day
1981
> Price per gallon (inflation adj.): $1.31 ($3.01)
> Price per barrel (inflation adj.): $31.77 ($72.97)
> U.S. gas consumption: 2.4 billion barrels
> Per capita consumption: 440.1 gallons
> U.S. oil production: 8.6 million barrels per day

1982
> Price per gallon (inflation adj.): $1.22 ($2.64)
> Price per barrel (inflation adj.): $28.52 ($61.68)
> U.S. gas consumption: 2.4 billion barrels
> Per capita consumption: 432.7 gallons
> U.S. oil production: 8.6 million barrels per day
[recirclink id=443940]

1983
> Price per gallon (inflation adj.): $1.16 ($2.41)
> Price per barrel (inflation adj.): $26.19 ($54.49)
> U.S. gas consumption: 2.4 billion barrels
> Per capita consumption: 434.2 gallons
> U.S. oil production: 8.7 million barrels per day
1984
> Price per gallon (inflation adj.): $1.13 ($2.27)
> Price per barrel (inflation adj.): $25.88 ($52.00)
> U.S. gas consumption: 2.4 billion barrels
> Per capita consumption: 436.2 gallons
> U.S. oil production: 8.9 million barrels per day
1985
> Price per gallon (inflation adj.): $1.12 ($2.17)
> Price per barrel (inflation adj.): $24.09 ($46.90)
> U.S. gas consumption: 2.5 billion barrels
> Per capita consumption: 440.1 gallons
> U.S. oil production: 9.0 million barrels per day
[in-text-ad-2]

1986
> Price per gallon (inflation adj.): $0.86 ($1.64)
> Price per barrel (inflation adj.): $12.51 ($23.87)
> U.S. gas consumption: 2.6 billion barrels
> Per capita consumption: 449.1 gallons
> U.S. oil production: 8.7 million barrels per day

1987
> Price per gallon (inflation adj.): $0.90 ($1.67)
> Price per barrel (inflation adj.): $15.40 ($28.66)
> U.S. gas consumption: 2.6 billion barrels
> Per capita consumption: 455.9 gallons
> U.S. oil production: 8.3 million barrels per day
1988
> Price per gallon (inflation adj.): $0.90 ($1.62)
> Price per barrel (inflation adj.): $12.58 ($22.62)
> U.S. gas consumption: 2.7 billion barrels
> Per capita consumption: 461.3 gallons
> U.S. oil production: 8.1 million barrels per day
1989
> Price per gallon (inflation adj.): $1.00 ($1.73)
> Price per barrel (inflation adj.): $15.86 ($27.45)
> U.S. gas consumption: 2.7 billion barrels
> Per capita consumption: 455.1 gallons
> U.S. oil production: 7.6 million barrels per day
[in-text-ad]
1990
> Price per gallon (inflation adj.): $1.15 ($1.92)
> Price per barrel (inflation adj.): $20.03 ($33.43)
> U.S. gas consumption: 2.6 billion barrels
> Per capita consumption: 444.6 gallons
> U.S. oil production: 7.4 million barrels per day
1991
> Price per gallon (inflation adj.): $1.14 ($1.84)
> Price per barrel (inflation adj.): $16.54 ($26.72)
> U.S. gas consumption: 2.6 billion barrels
> Per capita consumption: 437.0 gallons
> U.S. oil production: 7.4 million barrels per day

1992
> Price per gallon (inflation adj.): $1.13 ($1.78)
> Price per barrel (inflation adj.): $15.99 ($25.25)
> U.S. gas consumption: 2.7 billion barrels
> Per capita consumption: 438.1 gallons
> U.S. oil production: 7.2 million barrels per day
[recirclink id=443564]
1993
> Price per gallon (inflation adj.): $1.11 ($1.71)
> Price per barrel (inflation adj.): $14.25 ($21.98)
> U.S. gas consumption: 2.7 billion barrels
> Per capita consumption: 444.6 gallons
> U.S. oil production: 6.8 million barrels per day
1994
> Price per gallon (inflation adj.): $1.11 ($1.68)
> Price per barrel (inflation adj.): $13.19 ($19.92)
> U.S. gas consumption: 2.8 billion barrels
> Per capita consumption: 447.6 gallons
> U.S. oil production: 6.7 million barrels per day
1995
> Price per gallon (inflation adj.): $1.15 ($1.70)
> Price per barrel (inflation adj.): $14.62 ($21.63)
> U.S. gas consumption: 2.8 billion barrels
> Per capita consumption: 454.3 gallons
> U.S. oil production: 6.6 million barrels per day
[in-text-ad-2]

1996
> Price per gallon (inflation adj.): $1.23 ($1.79)
> Price per barrel (inflation adj.): $18.46 ($26.82)
> U.S. gas consumption: 2.9 billion barrels
> Per capita consumption: 457.3 gallons
> U.S. oil production: 6.5 million barrels per day
1997
> Price per gallon (inflation adj.): $1.23 ($1.76)
> Price per barrel (inflation adj.): $17.23 ($24.61)
> U.S. gas consumption: 2.9 billion barrels
> Per capita consumption: 458.9 gallons
> U.S. oil production: 6.5 million barrels per day
![]()
1998
> Price per gallon (inflation adj.): $1.06 ($1.50)
> Price per barrel (inflation adj.): $10.87 ($15.36)
> U.S. gas consumption: 3.0 billion barrels
> Per capita consumption: 468.2 gallons
> U.S. oil production: 6.3 million barrels per day
1999
> Price per gallon (inflation adj.): $1.17 ($1.62)
> Price per barrel (inflation adj.): $15.56 ($21.66)
> U.S. gas consumption: 3.1 billion barrels
> Per capita consumption: 474.0 gallons
> U.S. oil production: 5.9 million barrels per day
[in-text-ad]
2000
> Price per gallon (inflation adj.): $1.51 ($2.06)
> Price per barrel (inflation adj.): $26.72 ($36.36)
> U.S. gas consumption: 3.1 billion barrels
> Per capita consumption: 461.6 gallons
> U.S. oil production: 5.8 million barrels per day

2001
> Price per gallon (inflation adj.): $1.46 ($1.94)
> Price per barrel (inflation adj.): $21.84 ($29.06)
> U.S. gas consumption: 3.1 billion barrels
> Per capita consumption: 463.2 gallons
> U.S. oil production: 5.8 million barrels per day
2002
> Price per gallon (inflation adj.): $1.36 ($1.78)
> Price per barrel (inflation adj.): $22.51 ($29.50)
> U.S. gas consumption: 3.2 billion barrels
> Per capita consumption: 471.6 gallons
> U.S. oil production: 5.7 million barrels per day
[recirclink id=443882]

2003
> Price per gallon (inflation adj.): $1.59 ($2.04)
> Price per barrel (inflation adj.): $27.56 ($35.41)
> U.S. gas consumption: 3.3 billion barrels
> Per capita consumption: 472.1 gallons
> U.S. oil production: 5.6 million barrels per day
2004
> Price per gallon (inflation adj.): $1.88 ($2.35)
> Price per barrel (inflation adj.): $36.77 ($45.98)
> U.S. gas consumption: 3.3 billion barrels
> Per capita consumption: 478.0 gallons
> U.S. oil production: 5.4 million barrels per day

2005
> Price per gallon (inflation adj.): $2.30 ($2.78)
> Price per barrel (inflation adj.): $50.28 ($60.92)
> U.S. gas consumption: 3.3 billion barrels
> Per capita consumption: 475.1 gallons
> U.S. oil production: 5.2 million barrels per day
[in-text-ad-2]
2006
> Price per gallon (inflation adj.): $2.59 ($3.04)
> Price per barrel (inflation adj.): $59.69 ($70.16)
> U.S. gas consumption: 3.4 billion barrels
> Per capita consumption: 475.4 gallons
> U.S. oil production: 5.1 million barrels per day

2007
> Price per gallon (inflation adj.): $2.80 ($3.21)
> Price per barrel (inflation adj.): $66.52 ($76.16)
> U.S. gas consumption: 3.4 billion barrels
> Per capita consumption: 472.6 gallons
> U.S. oil production: 5.1 million barrels per day

2008
> Price per gallon (inflation adj.): $3.27 ($3.67)
> Price per barrel (inflation adj.): $94.04 ($105.60)
> U.S. gas consumption: 3.3 billion barrels
> Per capita consumption: 454.4 gallons
> U.S. oil production: 5.0 million barrels per day
2009
> Price per gallon (inflation adj.): $2.35 ($2.62)
> Price per barrel (inflation adj.): $56.35 ($62.80)
> U.S. gas consumption: 3.3 billion barrels
> Per capita consumption: 449.6 gallons
> U.S. oil production: 5.3 million barrels per day
[in-text-ad]

2010
> Price per gallon (inflation adj.): $2.79 ($3.07)
> Price per barrel (inflation adj.): $74.71 ($82.26)
> U.S. gas consumption: 3.3 billion barrels
> Per capita consumption: 445.6 gallons
> U.S. oil production: 5.5 million barrels per day
2011
> Price per gallon (inflation adj.): $3.53 ($3.80)
> Price per barrel (inflation adj.): $95.73 ($103.27)
> U.S. gas consumption: 3.2 billion barrels
> Per capita consumption: 430.5 gallons
> U.S. oil production: 5.6 million barrels per day
[recirclink id=443620]

2012
> Price per gallon (inflation adj.): $3.64 ($3.86)
> Price per barrel (inflation adj.): $94.52 ($100.12)
> U.S. gas consumption: 3.2 billion barrels
> Per capita consumption: 424.9 gallons
> U.S. oil production: 6.5 million barrels per day

2013
> Price per gallon (inflation adj.): $3.53 ($3.68)
> Price per barrel (inflation adj.): $95.99 ($100.06)
> U.S. gas consumption: 3.2 billion barrels
> Per capita consumption: 428.4 gallons
> U.S. oil production: 7.5 million barrels per day
2014
> Price per gallon (inflation adj.): $3.37 ($3.45)
> Price per barrel (inflation adj.): $87.39 ($89.49)
> U.S. gas consumption: 3.3 billion barrels
> Per capita consumption: 428.8 gallons
> U.S. oil production: 8.8 million barrels per day
[in-text-ad-2]
2015
> Price per gallon (inflation adj.): $2.45 ($2.48)
> Price per barrel (inflation adj.): $44.39 ($44.97)
> U.S. gas consumption: 3.4 billion barrels
> Per capita consumption: 437.8 gallons
> U.S. oil production: 9.4 million barrels per day

2016
> Price per gallon (inflation adj.): $2.14 ($2.14)
> Price per barrel (inflation adj.): $38.29 ($38.29)
> U.S. gas consumption: 3.4 billion barrels
> Per capita consumption: 442.9 gallons
> U.S. oil production: 8.9 million barrels per day
Methodology
To identify the price of gas the year you were born, 24/7 Wall St. reviewed the inflation-adjusted annual average price of a gallon of regular gasoline (leaded pre-1990) from the U.S. Energy Information Administration’s May 2017 Monthly Energy Review (table 9.4).
The average price of a barrel of crude oil and annual gasoline consumption also came from the EIA. Annual U.S. crude oil imports and production also came from the EIA.
Per-capita gas consumption was calculated using population estimates from the U.S. Census Bureau. All inflation-adjusted prices are tied to 2016 dollars.
Contact [email protected] for any questions or corrections.