The price of gasoline and oil is an important component in the energy sector of the government’s consumer price index, which measures inflation. Gas prices were the largest contributor to inflation in August, accounting for more than half of the CPI’s increase.
24/7 Wall St. reviewed data from the U.S. Department of Energy Efficiency & Renewable Energy and the U.S. Energy Information Administration to determine the average cost of a gallon of gas every year since 1929. For the average U.S. gas price from 1929 to 1993, we referenced the March 7, 2016 Average Historical Annual Gasoline Pump Price, 1929-2015 report. For gas prices from 1994 to 2022, we referenced the U.S. Energy Information Administration’s historical annual gas prices data.
Americans did not pay much attention to gas prices until the Arab oil embargo of 1973-74, when the price of a gallon of gasoline soared from 34 cents to 84 cents, and rationing was enacted in many states. Since then, Americans have been watching gas prices more carefully. The first time the price per gallon topped $1 was in 1980 at $1.19. The gasoline price surged over $2 a gallon in 2005, and first topped $3 in 2008.
According to AAA, the current national average price of a gallon of gasoline is $3.798. Gas prices are highest in the West and lowest in Southern states and the Midwest. California has the highest average price at the pump, at $6.02, and Kansas the lowest at $3.594.
After surging to a yearly high of $93.68 a barrel on Sept. 27, the price of West Texas Intermediate oil has slipped back under $89. Higher oil prices toward the end of the summer were partially caused by Russia and Saudi Arabia cutting supply as well as the searing heat that idled some U.S. refineries. (See, this is the country that has the most oil.)
Gas prices are affected by a host of factors. In addition to supply and demand, gas prices are impacted by foreign and domestic oil production and consumption, financial markets, refining capacity, supply chain disruptions, transportation costs, futures speculation, and the value of the U.S. dollar. (Here are the states with the lowest and highest gas taxes.)
See the cost of gas the year you were born:

1929
> Avg. U.S. gas prices per gallon (inflation adj.): $0.21 ($3.59 — #23 highest since 1929)
> U.S. gas consumption: N/A
> Per capita gas consumption: N/A
> Price of a barrel of oil (inflation adj.): $1.30 ($21.74 — #81 highest since 1929)
> U.S. oil production: 1.0 billion barrels — #88 most since 1929

1930
> Avg. U.S. gas prices per gallon (inflation adj.): $0.20 ($3.50 — #26 highest since 1929)
> U.S. gas consumption: N/A
> Per capita gas consumption: N/A
> Price of a barrel of oil (inflation adj.): $1.20 ($20.85 — #86 highest since 1929)
> U.S. oil production: 898.0 million barrels — #92 most since 1929

1931
> Avg. U.S. gas prices per gallon (inflation adj.): $0.17 ($3.27 — #37 highest since 1929)
> U.S. gas consumption: N/A
> Per capita gas consumption: N/A
> Price of a barrel of oil (inflation adj.): $0.70 ($12.51 — #94 highest since 1929)
> U.S. oil production: 851.1 million barrels — #93 most since 1929

1932
> Avg. U.S. gas prices per gallon (inflation adj.): $0.18 ($3.85 — #17 highest since 1929)
> U.S. gas consumption: N/A
> Per capita gas consumption: N/A
> Price of a barrel of oil (inflation adj.): $0.90 ($18.58 — #92 highest since 1929)
> U.S. oil production: 785.2 million barrels — #94 most since 1929

1933
> Avg. U.S. gas prices per gallon (inflation adj.): $0.18 ($4.05 — #13 highest since 1929)
> U.S. gas consumption: N/A
> Per capita gas consumption: N/A
> Price of a barrel of oil (inflation adj.): $0.70 ($15.08 — #93 highest since 1929)
> U.S. oil production: 905.7 million barrels — #91 most since 1929

1934
> Avg. U.S. gas prices per gallon (inflation adj.): $0.19 ($4.15 — #9 highest since 1929)
> U.S. gas consumption: N/A
> Per capita gas consumption: N/A
> Price of a barrel of oil (inflation adj.): $1.00 ($21.84 — #80 highest since 1929)
> U.S. oil production: 908.1 million barrels — #90 most since 1929
1935
> Avg. U.S. gas prices per gallon (inflation adj.): $0.19 ($4.06 — #12 highest since 1929)
> U.S. gas consumption: N/A
> Per capita gas consumption: N/A
> Price of a barrel of oil (inflation adj.): $1.00 ($20.72 — #87 highest since 1929)
> U.S. oil production: 993.9 million barrels — #89 most since 1929

1936
> Avg. U.S. gas prices per gallon (inflation adj.): $0.19 ($4.00 — #15 highest since 1929)
> U.S. gas consumption: N/A
> Per capita gas consumption: N/A
> Price of a barrel of oil (inflation adj.): $1.10 ($22.95 — #78 highest since 1929)
> U.S. oil production: 1.1 billion barrels — #87 most since 1929

1937
> Avg. U.S. gas prices per gallon (inflation adj.): $0.20 ($4.06 — #10 highest since 1929)
> U.S. gas consumption: N/A
> Per capita gas consumption: N/A
> Price of a barrel of oil (inflation adj.): $1.20 ($23.98 — #75 highest since 1929)
> U.S. oil production: 1.3 billion barrels — #84 most since 1929

1938
> Avg. U.S. gas prices per gallon (inflation adj.): $0.20 ($4.15 — #8 highest since 1929)
> U.S. gas consumption: N/A
> Per capita gas consumption: N/A
> Price of a barrel of oil (inflation adj.): $1.10 ($23.45 — #77 highest since 1929)
> U.S. oil production: 1.2 billion barrels — #86 most since 1929

1939
> Avg. U.S. gas prices per gallon (inflation adj.): $0.19 ($4.00 — #15 highest since 1929)
> U.S. gas consumption: N/A
> Per capita gas consumption: N/A
> Price of a barrel of oil (inflation adj.): $1.00 ($21.48 — #82 highest since 1929)
> U.S. oil production: 1.3 billion barrels — #85 most since 1929

1940
> Avg. U.S. gas prices per gallon (inflation adj.): $0.18 ($3.76 — #21 highest since 1929)
> U.S. gas consumption: N/A
> Per capita gas consumption: N/A
> Price of a barrel of oil (inflation adj.): $1.00 ($21.32 — #84 highest since 1929)
> U.S. oil production: 1.5 billion barrels — #81 most since 1929

1941
> Avg. U.S. gas prices per gallon (inflation adj.): $0.19 ($3.78 — #20 highest since 1929)
> U.S. gas consumption: N/A
> Per capita gas consumption: N/A
> Price of a barrel of oil (inflation adj.): $1.10 ($22.70 — #79 highest since 1929)
> U.S. oil production: 1.4 billion barrels — #82 most since 1929

1942
> Avg. U.S. gas prices per gallon (inflation adj.): $0.20 ($3.59 — #24 highest since 1929)
> U.S. gas consumption: N/A
> Per capita gas consumption: N/A
> Price of a barrel of oil (inflation adj.): $1.20 ($21.37 — #83 highest since 1929)
> U.S. oil production: 1.4 billion barrels — #83 most since 1929

1943
> Avg. U.S. gas prices per gallon (inflation adj.): $0.21 ($3.55 — #25 highest since 1929)
> U.S. gas consumption: N/A
> Per capita gas consumption: N/A
> Price of a barrel of oil (inflation adj.): $1.20 ($20.30 — #88 highest since 1929)
> U.S. oil production: 1.5 billion barrels — #80 most since 1929

1944
> Avg. U.S. gas prices per gallon (inflation adj.): $0.21 ($3.49 — #27 highest since 1929)
> U.S. gas consumption: N/A
> Per capita gas consumption: N/A
> Price of a barrel of oil (inflation adj.): $1.20 ($20.12 — #89 highest since 1929)
> U.S. oil production: 1.7 billion barrels — #79 most since 1929

1945
> Avg. U.S. gas prices per gallon (inflation adj.): $0.21 ($3.41 — #30 highest since 1929)
> U.S. gas consumption: 24.3 billion gallons — #78 most since 1945
> Per capita gas consumption: 173.9 gallons — #78 most since 1945
> Price of a barrel of oil (inflation adj.): $1.20 ($19.84 — #90 highest since 1929)
> U.S. oil production: 1.7 billion barrels — #78 most since 1929

1946
> Avg. U.S. gas prices per gallon (inflation adj.): $0.21 ($3.15 — #45 highest since 1929)
> U.S. gas consumption: 30.3 billion gallons — #77 most since 1945
> Per capita gas consumption: 214.6 gallons — #77 most since 1945
> Price of a barrel of oil (inflation adj.): $1.40 ($21.16 — #85 highest since 1929)
> U.S. oil production: 1.7 billion barrels — #77 most since 1929

1947
> Avg. U.S. gas prices per gallon (inflation adj.): $0.23 ($3.02 — #57 highest since 1929)
> U.S. gas consumption: 32.5 billion gallons — #76 most since 1945
> Per capita gas consumption: 225.4 gallons — #76 most since 1945
> Price of a barrel of oil (inflation adj.): $1.90 ($25.33 — #70 highest since 1929)
> U.S. oil production: 1.9 billion barrels — #72 most since 1929

1948
> Avg. U.S. gas prices per gallon (inflation adj.): $0.26 ($3.16 — #43 highest since 1929)
> U.S. gas consumption: 35.1 billion gallons — #75 most since 1945
> Per capita gas consumption: 239 gallons — #75 most since 1945
> Price of a barrel of oil (inflation adj.): $2.60 ($31.57 — #44 highest since 1929)
> U.S. oil production: 2.0 billion barrels — #66 most since 1929

1949
> Avg. U.S. gas prices per gallon (inflation adj.): $0.27 ($3.32 — #33 highest since 1929)
> U.S. gas consumption: 36.9 billion gallons — #74 most since 1945
> Per capita gas consumption: 247.7 gallons — #74 most since 1945
> Price of a barrel of oil (inflation adj.): $2.50 ($31.23 — #46 highest since 1929)
> U.S. oil production: 1.8 billion barrels — #75 most since 1929

1950
> Avg. U.S. gas prices per gallon (inflation adj.): $0.27 ($3.28 — #35 highest since 1929)
> U.S. gas consumption: 40.1 billion gallons — #73 most since 1945
> Per capita gas consumption: 263.3 gallons — #73 most since 1945
> Price of a barrel of oil (inflation adj.): $2.50 ($30.48 — #49 highest since 1929)
> U.S. oil production: 2.0 billion barrels — #69 most since 1929

1951
> Avg. U.S. gas prices per gallon (inflation adj.): $0.27 ($3.04 — #53 highest since 1929)
> U.S. gas consumption: 45.8 billion gallons — #71 most since 1945
> Per capita gas consumption: 295.5 gallons — #71 most since 1945
> Price of a barrel of oil (inflation adj.): $2.50 ($28.48 — #56 highest since 1929)
> U.S. oil production: 2.2 billion barrels — #59 most since 1929
1952
> Avg. U.S. gas prices per gallon (inflation adj.): $0.27 ($2.98 — #61 highest since 1929)
> U.S. gas consumption: 45.4 billion gallons — #72 most since 1945
> Per capita gas consumption: 288.2 gallons — #72 most since 1945
> Price of a barrel of oil (inflation adj.): $2.50 ($27.94 — #61 highest since 1929)
> U.S. oil production: 2.3 billion barrels — #57 most since 1929

1953
> Avg. U.S. gas prices per gallon (inflation adj.): $0.29 ($3.18 — #41 highest since 1929)
> U.S. gas consumption: 47.7 billion gallons — #70 most since 1945
> Per capita gas consumption: 297.6 gallons — #70 most since 1945
> Price of a barrel of oil (inflation adj.): $2.70 ($29.38 — #53 highest since 1929)
> U.S. oil production: 2.4 billion barrels — #54 most since 1929

1954
> Avg. U.S. gas prices per gallon (inflation adj.): $0.29 ($3.16 — #44 highest since 1929)
> U.S. gas consumption: 49.0 billion gallons — #69 most since 1945
> Per capita gas consumption: 300.3 gallons — #69 most since 1945
> Price of a barrel of oil (inflation adj.): $2.80 ($30.24 — #51 highest since 1929)
> U.S. oil production: 2.3 billion barrels — #56 most since 1929

1955
> Avg. U.S. gas prices per gallon (inflation adj.): $0.29 ($3.17 — #42 highest since 1929)
> U.S. gas consumption: 53.1 billion gallons — #68 most since 1945
> Per capita gas consumption: 320 gallons — #68 most since 1945
> Price of a barrel of oil (inflation adj.): $2.80 ($30.25 — #50 highest since 1929)
> U.S. oil production: 2.5 billion barrels — #48 most since 1929

1956
> Avg. U.S. gas prices per gallon (inflation adj.): $0.30 ($3.23 — #39 highest since 1929)
> U.S. gas consumption: 54.5 billion gallons — #67 most since 1945
> Per capita gas consumption: 322.9 gallons — #66 most since 1945
> Price of a barrel of oil (inflation adj.): $2.80 ($30.02 — #52 highest since 1929)
> U.S. oil production: 2.6 billion barrels — #43 most since 1929

1957
> Avg. U.S. gas prices per gallon (inflation adj.): $0.31 ($3.23 — #38 highest since 1929)
> U.S. gas consumption: 55.4 billion gallons — #66 most since 1945
> Per capita gas consumption: 322.2 gallons — #67 most since 1945
> Price of a barrel of oil (inflation adj.): $3.10 ($32.18 — #43 highest since 1929)
> U.S. oil production: 2.6 billion barrels — #44 most since 1929

1958
> Avg. U.S. gas prices per gallon (inflation adj.): $0.30 ($3.04 — #54 highest since 1929)
> U.S. gas consumption: 56.9 billion gallons — #65 most since 1945
> Per capita gas consumption: 325.3 gallons — #65 most since 1945
> Price of a barrel of oil (inflation adj.): $3.00 ($30.48 — #48 highest since 1929)
> U.S. oil production: 2.4 billion barrels — #49 most since 1929

1959
> Avg. U.S. gas prices per gallon (inflation adj.): $0.31 ($3.12 — #47 highest since 1929)
> U.S. gas consumption: 59.2 billion gallons — #64 most since 1945
> Per capita gas consumption: 332.7 gallons — #64 most since 1945
> Price of a barrel of oil (inflation adj.): $2.90 ($29.16 — #54 highest since 1929)
> U.S. oil production: 2.6 billion barrels — #46 most since 1929
1960
> Avg. U.S. gas prices per gallon (inflation adj.): $0.31 ($3.06 — #51 highest since 1929)
> U.S. gas consumption: 61.0 billion gallons — #63 most since 1945
> Per capita gas consumption: 337.7 gallons — #62 most since 1945
> Price of a barrel of oil (inflation adj.): $2.90 ($28.47 — #57 highest since 1929)
> U.S. oil production: 2.6 billion barrels — #45 most since 1929

1961
> Avg. U.S. gas prices per gallon (inflation adj.): $0.31 ($3.03 — #56 highest since 1929)
> U.S. gas consumption: 62.0 billion gallons — #62 most since 1945
> Per capita gas consumption: 337.4 gallons — #63 most since 1945
> Price of a barrel of oil (inflation adj.): $2.90 ($28.29 — #58 highest since 1929)
> U.S. oil production: 2.6 billion barrels — #42 most since 1929

1962
> Avg. U.S. gas prices per gallon (inflation adj.): $0.31 ($3.00 — #59 highest since 1929)
> U.S. gas consumption: 64.4 billion gallons — #61 most since 1945
> Per capita gas consumption: 345.1 gallons — #61 most since 1945
> Price of a barrel of oil (inflation adj.): $2.90 ($28.10 — #59 highest since 1929)
> U.S. oil production: 2.7 billion barrels — #40 most since 1929

1963
> Avg. U.S. gas prices per gallon (inflation adj.): $0.30 ($2.87 — #66 highest since 1929)
> U.S. gas consumption: 66.4 billion gallons — #60 most since 1945
> Per capita gas consumption: 351.1 gallons — #60 most since 1945
> Price of a barrel of oil (inflation adj.): $2.90 ($27.64 — #62 highest since 1929)
> U.S. oil production: 2.8 billion barrels — #36 most since 1929

1964
> Avg. U.S. gas prices per gallon (inflation adj.): $0.30 ($2.83 — #68 highest since 1929)
> U.S. gas consumption: 67.7 billion gallons — #59 most since 1945
> Per capita gas consumption: 352.7 gallons — #59 most since 1945
> Price of a barrel of oil (inflation adj.): $2.90 ($27.19 — #64 highest since 1929)
> U.S. oil production: 2.8 billion barrels — #34 most since 1929

1965
> Avg. U.S. gas prices per gallon (inflation adj.): $0.31 ($2.88 — #65 highest since 1929)
> U.S. gas consumption: 70.4 billion gallons — #58 most since 1945
> Per capita gas consumption: 362.3 gallons — #58 most since 1945
> Price of a barrel of oil (inflation adj.): $2.90 ($26.57 — #65 highest since 1929)
> U.S. oil production: 2.8 billion barrels — #33 most since 1929

1966
> Avg. U.S. gas prices per gallon (inflation adj.): $0.32 ($2.89 — #64 highest since 1929)
> U.S. gas consumption: 73.7 billion gallons — #57 most since 1945
> Per capita gas consumption: 375 gallons — #56 most since 1945
> Price of a barrel of oil (inflation adj.): $2.90 ($26.01 — #67 highest since 1929)
> U.S. oil production: 3.0 billion barrels — #29 most since 1929

1967
> Avg. U.S. gas prices per gallon (inflation adj.): $0.33 ($2.89 — #63 highest since 1929)
> U.S. gas consumption: 76.0 billion gallons — #56 most since 1945
> Per capita gas consumption: 382.5 gallons — #55 most since 1945
> Price of a barrel of oil (inflation adj.): $2.90 ($25.59 — #69 highest since 1929)
> U.S. oil production: 3.2 billion barrels — #17 most since 1929
1968
> Avg. U.S. gas prices per gallon (inflation adj.): $0.34 ($2.86 — #67 highest since 1929)
> U.S. gas consumption: 80.9 billion gallons — #55 most since 1945
> Per capita gas consumption: 402.9 gallons — #54 most since 1945
> Price of a barrel of oil (inflation adj.): $2.90 ($24.72 — #71 highest since 1929)
> U.S. oil production: 3.3 billion barrels — #13 most since 1929

1969
> Avg. U.S. gas prices per gallon (inflation adj.): $0.35 ($2.79 — #70 highest since 1929)
> U.S. gas consumption: 84.7 billion gallons — #54 most since 1945
> Per capita gas consumption: 418 gallons — #51 most since 1945
> Price of a barrel of oil (inflation adj.): $3.10 ($24.64 — #72 highest since 1929)
> U.S. oil production: 3.4 billion barrels — #11 most since 1929

1970
> Avg. U.S. gas prices per gallon (inflation adj.): $0.36 ($2.72 — #72 highest since 1929)
> U.S. gas consumption: 88.7 billion gallons — #53 most since 1945
> Per capita gas consumption: 432.5 gallons — #46 most since 1945
> Price of a barrel of oil (inflation adj.): $3.20 ($23.99 — #74 highest since 1929)
> U.S. oil production: 3.5 billion barrels — #6 most since 1929
1971
> Avg. U.S. gas prices per gallon (inflation adj.): $0.36 ($2.60 — #73 highest since 1929)
> U.S. gas consumption: 92.2 billion gallons — #52 most since 1945
> Per capita gas consumption: 444 gallons — #33 most since 1945
> Price of a barrel of oil (inflation adj.): $3.40 ($24.50 — #73 highest since 1929)
> U.S. oil production: 3.5 billion barrels — #8 most since 1929

1972
> Avg. U.S. gas prices per gallon (inflation adj.): $0.36 ($2.52 — #79 highest since 1929)
> U.S. gas consumption: 98.0 billion gallons — #51 most since 1945
> Per capita gas consumption: 467 gallons — #16 most since 1945
> Price of a barrel of oil (inflation adj.): $3.40 ($23.73 — #76 highest since 1929)
> U.S. oil production: 3.5 billion barrels — #7 most since 1929
1973
> Avg. U.S. gas prices per gallon (inflation adj.): $0.39 ($2.57 — #76 highest since 1929)
> U.S. gas consumption: 102.3 billion gallons — #45 most since 1945
> Per capita gas consumption: 482.8 gallons — #4 most since 1945
> Price of a barrel of oil (inflation adj.): $3.90 ($25.64 — #68 highest since 1929)
> U.S. oil production: 3.4 billion barrels — #12 most since 1929

1974
> Avg. U.S. gas prices per gallon (inflation adj.): $0.53 ($3.15 — #46 highest since 1929)
> U.S. gas consumption: 100.2 billion gallons — #50 most since 1945
> Per capita gas consumption: 468.6 gallons — #14 most since 1945
> Price of a barrel of oil (inflation adj.): $6.90 ($40.78 — #33 highest since 1929)
> U.S. oil production: 3.2 billion barrels — #19 most since 1929

1975
> Avg. U.S. gas prices per gallon (inflation adj.): $0.57 ($3.10 — #49 highest since 1929)
> U.S. gas consumption: 102.3 billion gallons — #44 most since 1945
> Per capita gas consumption: 473.8 gallons — #10 most since 1945
> Price of a barrel of oil (inflation adj.): $7.70 ($41.72 — #30 highest since 1929)
> U.S. oil production: 3.1 billion barrels — #27 most since 1929

1976
> Avg. U.S. gas prices per gallon (inflation adj.): $0.59 ($3.03 — #55 highest since 1929)
> U.S. gas consumption: 107.3 billion gallons — #41 most since 1945
> Per capita gas consumption: 491.9 gallons — #3 most since 1945
> Price of a barrel of oil (inflation adj.): $8.20 ($42.12 — #29 highest since 1929)
> U.S. oil production: 3.0 billion barrels — #32 most since 1929
1977
> Avg. U.S. gas prices per gallon (inflation adj.): $0.62 ($2.99 — #60 highest since 1929)
> U.S. gas consumption: 110.0 billion gallons — #38 most since 1945
> Per capita gas consumption: 499.6 gallons — #2 most since 1945
> Price of a barrel of oil (inflation adj.): $8.60 ($41.39 — #32 highest since 1929)
> U.S. oil production: 3.0 billion barrels — #30 most since 1929
1978
> Avg. U.S. gas prices per gallon (inflation adj.): $0.63 ($2.83 — #69 highest since 1929)
> U.S. gas consumption: 113.6 billion gallons — #31 most since 1945
> Per capita gas consumption: 510.5 gallons — #1 most since 1945
> Price of a barrel of oil (inflation adj.): $9.00 ($40.40 — #34 highest since 1929)
> U.S. oil production: 3.2 billion barrels — #20 most since 1929

1979
> Avg. U.S. gas prices per gallon (inflation adj.): $0.86 ($3.47 — #29 highest since 1929)
> U.S. gas consumption: 107.8 billion gallons — #39 most since 1945
> Per capita gas consumption: 479.2 gallons — #5 most since 1945
> Price of a barrel of oil (inflation adj.): $12.60 ($50.95 — #24 highest since 1929)
> U.S. oil production: 3.1 billion barrels — #26 most since 1929

1980
> Avg. U.S. gas prices per gallon (inflation adj.): $1.19 ($4.23 — #6 highest since 1929)
> U.S. gas consumption: 101.1 billion gallons — #47 most since 1945
> Per capita gas consumption: 445 gallons — #30 most since 1945
> Price of a barrel of oil (inflation adj.): $21.60 ($76.68 — #14 highest since 1929)
> U.S. oil production: 3.1 billion barrels — #24 most since 1929
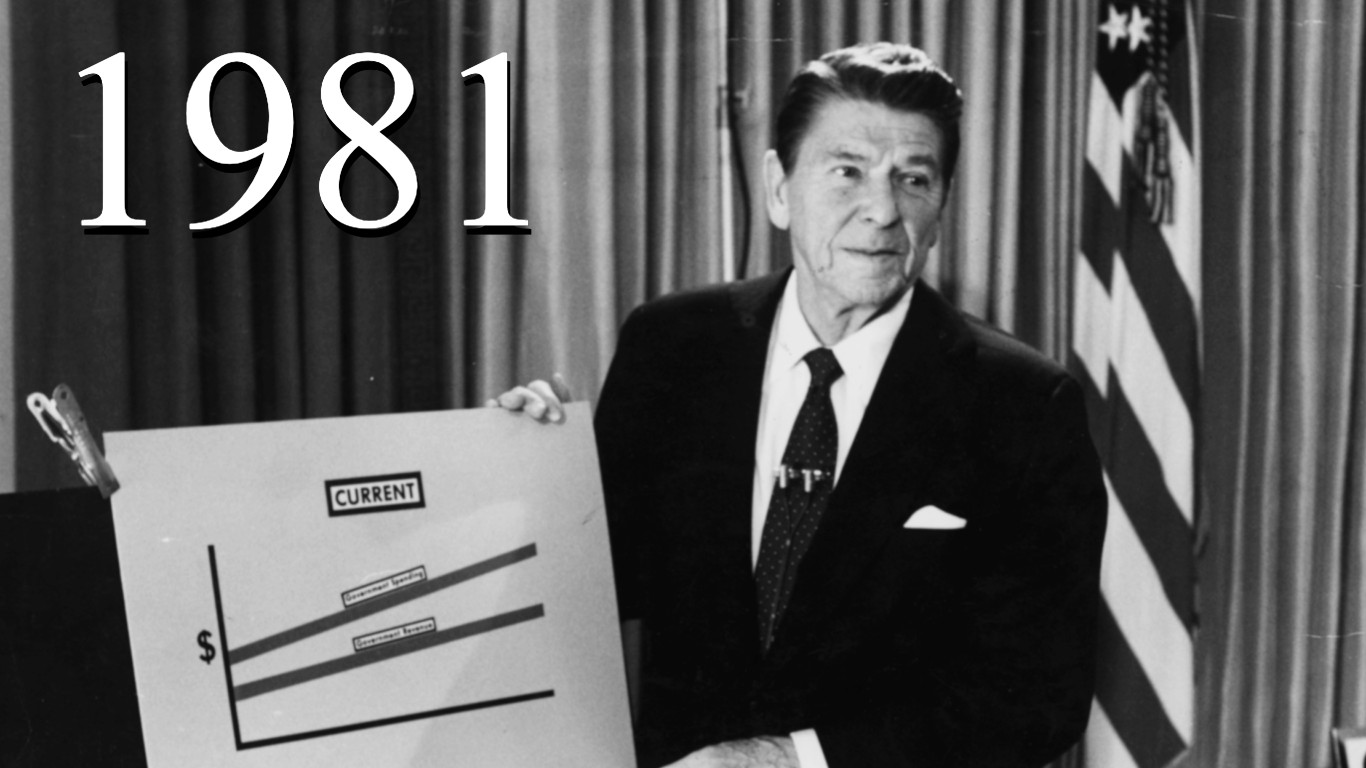
1981
> Avg. U.S. gas prices per gallon (inflation adj.): $1.31 ($4.22 — #7 highest since 1929)
> U.S. gas consumption: 101.0 billion gallons — #48 most since 1945
> Per capita gas consumption: 440.1 gallons — #36 most since 1945
> Price of a barrel of oil (inflation adj.): $31.80 ($102.28 — #6 highest since 1929)
> U.S. oil production: 3.1 billion barrels — #25 most since 1929
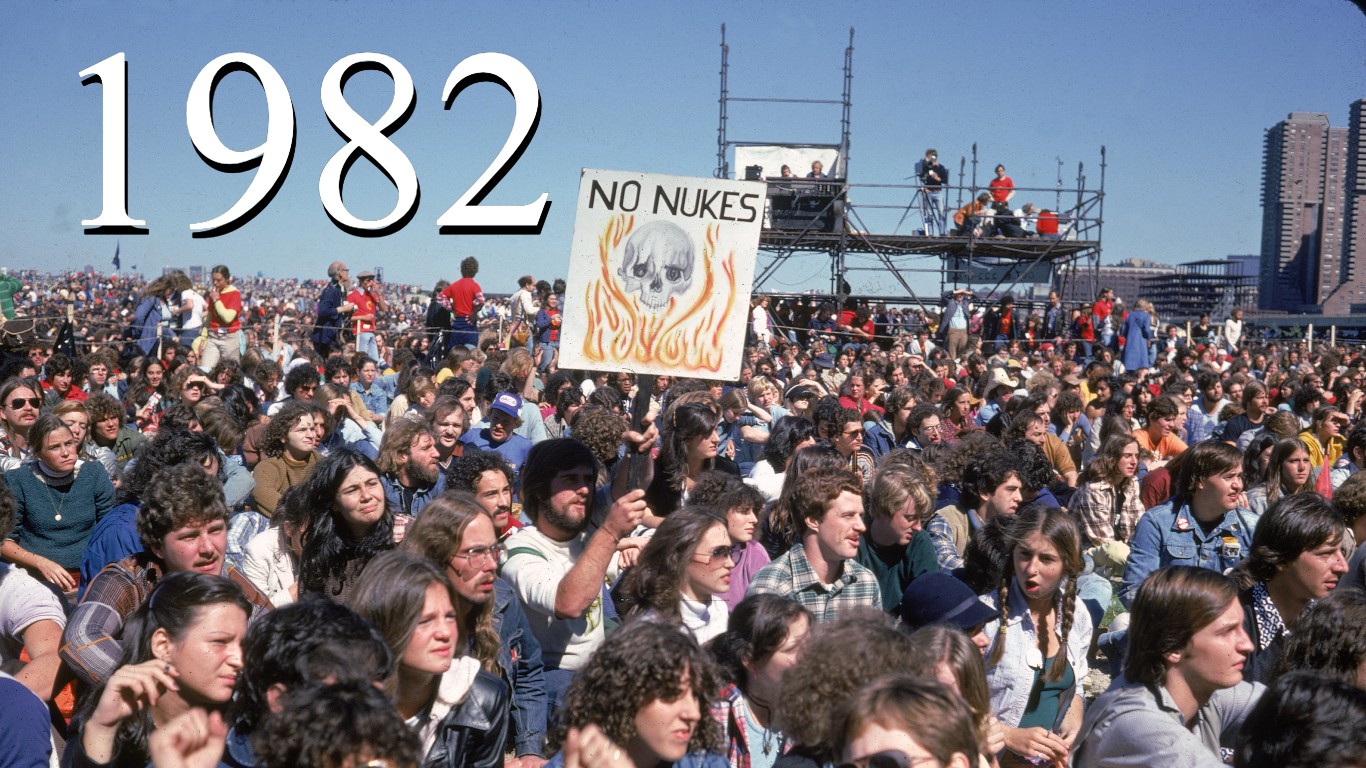
1982
> Avg. U.S. gas prices per gallon (inflation adj.): $1.22 ($3.70 — #22 highest since 1929)
> U.S. gas consumption: 100.2 billion gallons — #49 most since 1945
> Per capita gas consumption: 432.7 gallons — #45 most since 1945
> Price of a barrel of oil (inflation adj.): $28.50 ($86.49 — #11 highest since 1929)
> U.S. oil production: 3.2 billion barrels — #23 most since 1929
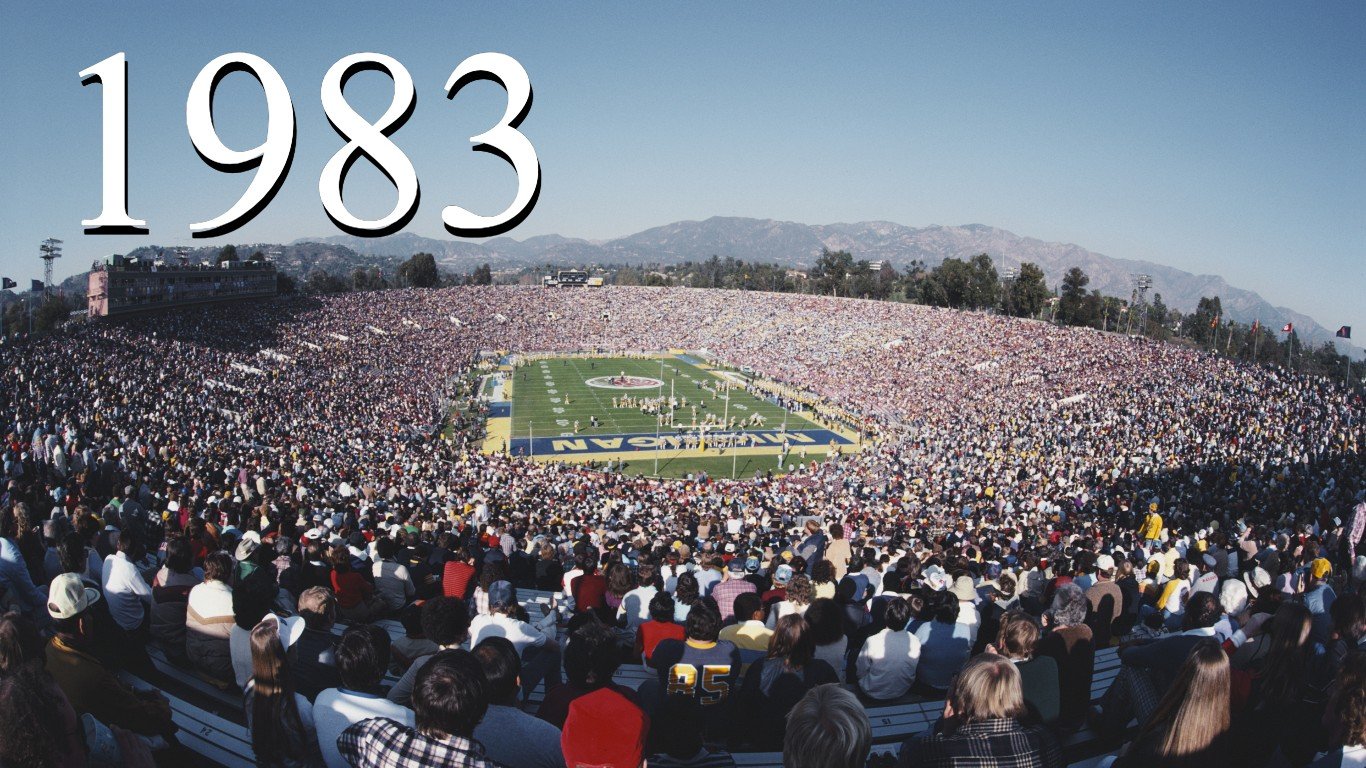
1983
> Avg. U.S. gas prices per gallon (inflation adj.): $1.16 ($3.41 — #31 highest since 1929)
> U.S. gas consumption: 101.5 billion gallons — #46 most since 1945
> Per capita gas consumption: 434.2 gallons — #44 most since 1945
> Price of a barrel of oil (inflation adj.): $26.20 ($76.95 — #12 highest since 1929)
> U.S. oil production: 3.2 billion barrels — #21 most since 1929

1984
> Avg. U.S. gas prices per gallon (inflation adj.): $1.13 ($3.18 — #40 highest since 1929)
> U.S. gas consumption: 102.9 billion gallons — #43 most since 1945
> Per capita gas consumption: 436.2 gallons — #42 most since 1945
> Price of a barrel of oil (inflation adj.): $25.90 ($72.90 — #16 highest since 1929)
> U.S. oil production: 3.2 billion barrels — #15 most since 1929
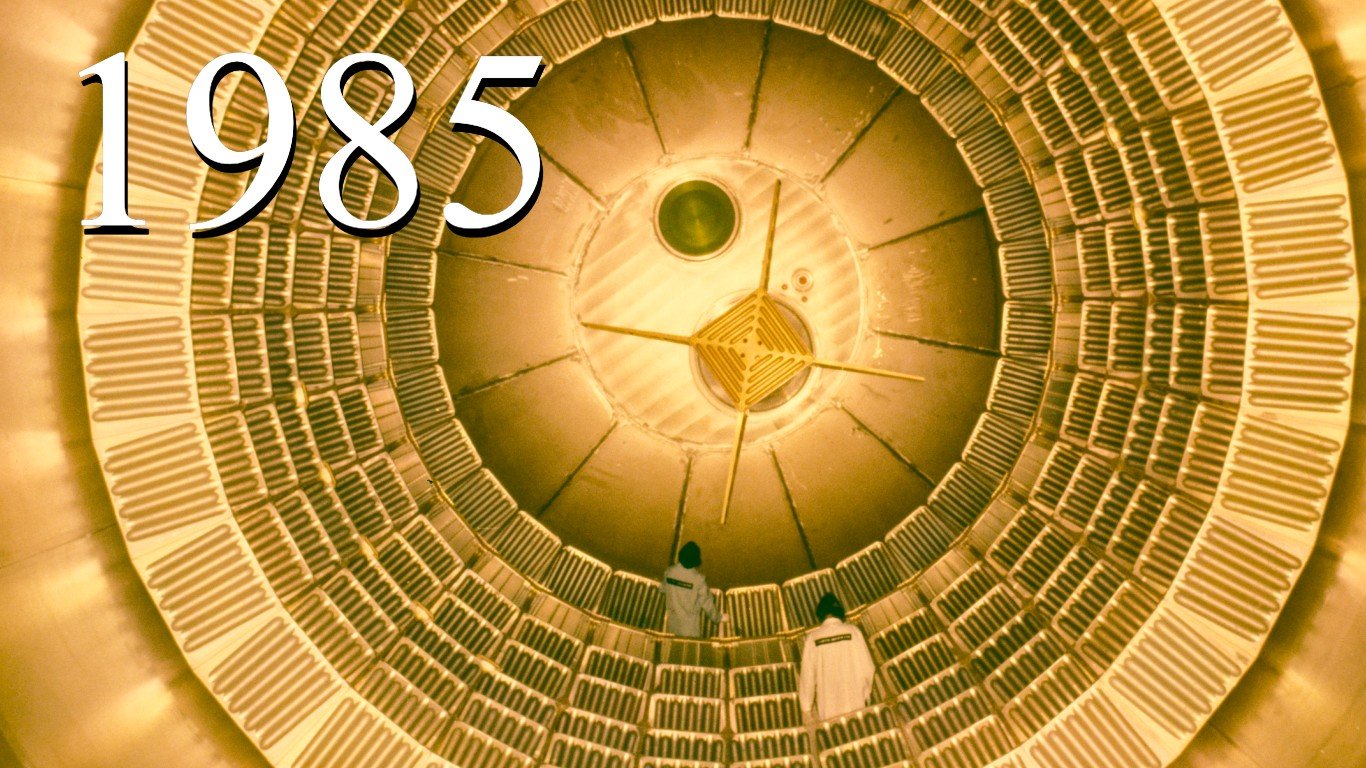
1985
> Avg. U.S. gas prices per gallon (inflation adj.): $1.12 ($3.05 — #52 highest since 1929)
> U.S. gas consumption: 104.7 billion gallons — #42 most since 1945
> Per capita gas consumption: 440.1 gallons — #35 most since 1945
> Price of a barrel of oil (inflation adj.): $24.10 ($65.52 — #19 highest since 1929)
> U.S. oil production: 3.3 billion barrels — #14 most since 1929
1986
> Avg. U.S. gas prices per gallon (inflation adj.): $0.86 ($2.30 — #86 highest since 1929)
> U.S. gas consumption: 107.8 billion gallons — #40 most since 1945
> Per capita gas consumption: 449.1 gallons — #27 most since 1945
> Price of a barrel of oil (inflation adj.): $12.50 ($33.40 — #41 highest since 1929)
> U.S. oil production: 3.2 billion barrels — #22 most since 1929

1987
> Avg. U.S. gas prices per gallon (inflation adj.): $0.90 ($2.32 — #85 highest since 1929)
> U.S. gas consumption: 110.5 billion gallons — #36 most since 1945
> Per capita gas consumption: 455.9 gallons — #22 most since 1945
> Price of a barrel of oil (inflation adj.): $15.40 ($39.67 — #35 highest since 1929)
> U.S. oil production: 3.0 billion barrels — #28 most since 1929

1988
> Avg. U.S. gas prices per gallon (inflation adj.): $0.90 ($2.23 — #90 highest since 1929)
> U.S. gas consumption: 112.8 billion gallons — #32 most since 1945
> Per capita gas consumption: 461.3 gallons — #19 most since 1945
> Price of a barrel of oil (inflation adj.): $12.60 ($31.12 — #47 highest since 1929)
> U.S. oil production: 3.0 billion barrels — #31 most since 1929

1989
> Avg. U.S. gas prices per gallon (inflation adj.): $1.00 ($2.36 — #82 highest since 1929)
> U.S. gas consumption: 112.3 billion gallons — #33 most since 1945
> Per capita gas consumption: 455.1 gallons — #23 most since 1945
> Price of a barrel of oil (inflation adj.): $15.90 ($37.43 — #36 highest since 1929)
> U.S. oil production: 2.8 billion barrels — #35 most since 1929
1990
> Avg. U.S. gas prices per gallon (inflation adj.): $1.15 ($2.58 — #75 highest since 1929)
> U.S. gas consumption: 110.9 billion gallons — #35 most since 1945
> Per capita gas consumption: 444.6 gallons — #32 most since 1945
> Price of a barrel of oil (inflation adj.): $20.00 ($44.85 — #27 highest since 1929)
> U.S. oil production: 2.7 billion barrels — #39 most since 1929

1991
> Avg. U.S. gas prices per gallon (inflation adj.): $1.14 ($2.45 — #80 highest since 1929)
> U.S. gas consumption: 110.2 billion gallons — #37 most since 1945
> Per capita gas consumption: 437 gallons — #41 most since 1945
> Price of a barrel of oil (inflation adj.): $16.50 ($35.54 — #39 highest since 1929)
> U.S. oil production: 2.7 billion barrels — #38 most since 1929

1992
> Avg. U.S. gas prices per gallon (inflation adj.): $1.13 ($2.36 — #83 highest since 1929)
> U.S. gas consumption: 111.7 billion gallons — #34 most since 1945
> Per capita gas consumption: 438.1 gallons — #39 most since 1945
> Price of a barrel of oil (inflation adj.): $16.00 ($33.35 — #42 highest since 1929)
> U.S. oil production: 2.6 billion barrels — #41 most since 1929

1993
> Avg. U.S. gas prices per gallon (inflation adj.): $1.11 ($2.25 — #89 highest since 1929)
> U.S. gas consumption: 114.6 billion gallons — #30 most since 1945
> Per capita gas consumption: 444.6 gallons — #31 most since 1945
> Price of a barrel of oil (inflation adj.): $14.30 ($28.86 — #55 highest since 1929)
> U.S. oil production: 2.5 billion barrels — #47 most since 1929

1994
> Avg. U.S. gas prices per gallon (inflation adj.): $1.08 ($2.13 — #92 highest since 1929)
> U.S. gas consumption: 116.5 billion gallons — #29 most since 1945
> Per capita gas consumption: 447.6 gallons — #28 most since 1945
> Price of a barrel of oil (inflation adj.): $13.20 ($26.05 — #66 highest since 1929)
> U.S. oil production: 2.4 billion barrels — #50 most since 1929
1995
> Avg. U.S. gas prices per gallon (inflation adj.): $1.16 ($2.22 — #91 highest since 1929)
> U.S. gas consumption: 119.4 billion gallons — #28 most since 1945
> Per capita gas consumption: 454.3 gallons — #25 most since 1945
> Price of a barrel of oil (inflation adj.): $14.60 ($28.07 — #60 highest since 1929)
> U.S. oil production: 2.4 billion barrels — #51 most since 1929

1996
> Avg. U.S. gas prices per gallon (inflation adj.): $1.25 ($2.32 — #84 highest since 1929)
> U.S. gas consumption: 121.3 billion gallons — #27 most since 1945
> Per capita gas consumption: 457.3 gallons — #21 most since 1945
> Price of a barrel of oil (inflation adj.): $18.50 ($34.43 — #40 highest since 1929)
> U.S. oil production: 2.4 billion barrels — #53 most since 1929

1997
> Avg. U.S. gas prices per gallon (inflation adj.): $1.24 ($2.27 — #87 highest since 1929)
> U.S. gas consumption: 122.9 billion gallons — #26 most since 1945
> Per capita gas consumption: 458.9 gallons — #20 most since 1945
> Price of a barrel of oil (inflation adj.): $17.20 ($31.42 — #45 highest since 1929)
> U.S. oil production: 2.4 billion barrels — #55 most since 1929

1998
> Avg. U.S. gas prices per gallon (inflation adj.): $1.07 ($1.92 — #94 highest since 1929)
> U.S. gas consumption: 126.5 billion gallons — #24 most since 1945
> Per capita gas consumption: 468.2 gallons — #15 most since 1945
> Price of a barrel of oil (inflation adj.): $10.90 ($19.52 — #91 highest since 1929)
> U.S. oil production: 2.3 billion barrels — #58 most since 1929

1999
> Avg. U.S. gas prices per gallon (inflation adj.): $1.18 ($2.07 — #93 highest since 1929)
> U.S. gas consumption: 129.2 billion gallons — #23 most since 1945
> Per capita gas consumption: 474 gallons — #9 most since 1945
> Price of a barrel of oil (inflation adj.): $15.60 ($27.33 — #63 highest since 1929)
> U.S. oil production: 2.1 billion barrels — #60 most since 1929
2000
> Avg. U.S. gas prices per gallon (inflation adj.): $1.52 ($2.59 — #74 highest since 1929)
> U.S. gas consumption: 130.2 billion gallons — #22 most since 1945
> Per capita gas consumption: 461.6 gallons — #18 most since 1945
> Price of a barrel of oil (inflation adj.): $26.70 ($45.41 — #26 highest since 1929)
> U.S. oil production: 2.1 billion barrels — #61 most since 1929

2001
> Avg. U.S. gas prices per gallon (inflation adj.): $1.46 ($2.41 — #81 highest since 1929)
> U.S. gas consumption: 132.0 billion gallons — #21 most since 1945
> Per capita gas consumption: 463.2 gallons — #17 most since 1945
> Price of a barrel of oil (inflation adj.): $21.80 ($36.09 — #38 highest since 1929)
> U.S. oil production: 2.1 billion barrels — #62 most since 1929

2002
> Avg. U.S. gas prices per gallon (inflation adj.): $1.39 ($2.25 — #88 highest since 1929)
> U.S. gas consumption: 135.6 billion gallons — #15 most since 1945
> Per capita gas consumption: 471.6 gallons — #13 most since 1945
> Price of a barrel of oil (inflation adj.): $22.50 ($36.62 — #37 highest since 1929)
> U.S. oil production: 2.1 billion barrels — #63 most since 1929
2003
> Avg. U.S. gas prices per gallon (inflation adj.): $1.60 ($2.55 — #78 highest since 1929)
> U.S. gas consumption: 137.0 billion gallons — #13 most since 1945
> Per capita gas consumption: 472.1 gallons — #12 most since 1945
> Price of a barrel of oil (inflation adj.): $27.60 ($43.83 — #28 highest since 1929)
> U.S. oil production: 2.1 billion barrels — #65 most since 1929

2004
> Avg. U.S. gas prices per gallon (inflation adj.): $1.90 ($2.94 — #62 highest since 1929)
> U.S. gas consumption: 140.0 billion gallons — #9 most since 1945
> Per capita gas consumption: 478 gallons — #6 most since 1945
> Price of a barrel of oil (inflation adj.): $36.80 ($56.97 — #22 highest since 1929)
> U.S. oil production: 2.0 billion barrels — #68 most since 1929

2005
> Avg. U.S. gas prices per gallon (inflation adj.): $2.31 ($3.47 — #28 highest since 1929)
> U.S. gas consumption: 140.4 billion gallons — #8 most since 1945
> Per capita gas consumption: 475.1 gallons — #8 most since 1945
> Price of a barrel of oil (inflation adj.): $50.30 ($75.34 — #15 highest since 1929)
> U.S. oil production: 1.9 billion barrels — #71 most since 1929

2006
> Avg. U.S. gas prices per gallon (inflation adj.): $2.62 ($3.80 — #19 highest since 1929)
> U.S. gas consumption: 141.8 billion gallons — #6 most since 1945
> Per capita gas consumption: 475.4 gallons — #7 most since 1945
> Price of a barrel of oil (inflation adj.): $59.70 ($86.65 — #10 highest since 1929)
> U.S. oil production: 1.9 billion barrels — #73 most since 1929

2007
> Avg. U.S. gas prices per gallon (inflation adj.): $2.84 ($4.01 — #14 highest since 1929)
> U.S. gas consumption: 142.3 billion gallons — #5 most since 1945
> Per capita gas consumption: 472.6 gallons — #11 most since 1945
> Price of a barrel of oil (inflation adj.): $66.50 ($93.89 — #9 highest since 1929)
> U.S. oil production: 1.9 billion barrels — #74 most since 1929

2008
> Avg. U.S. gas prices per gallon (inflation adj.): $3.30 ($4.48 — #4 highest since 1929)
> U.S. gas consumption: 138.2 billion gallons — #10 most since 1945
> Per capita gas consumption: 454.4 gallons — #24 most since 1945
> Price of a barrel of oil (inflation adj.): $94.00 ($127.83 — #1 highest since 1929)
> U.S. oil production: 1.8 billion barrels — #76 most since 1929

2009
> Avg. U.S. gas prices per gallon (inflation adj.): $2.41 ($3.28 — #34 highest since 1929)
> U.S. gas consumption: 137.9 billion gallons — #11 most since 1945
> Per capita gas consumption: 449.6 gallons — #26 most since 1945
> Price of a barrel of oil (inflation adj.): $56.40 ($76.87 — #13 highest since 1929)
> U.S. oil production: 2.0 billion barrels — #70 most since 1929

2010
> Avg. U.S. gas prices per gallon (inflation adj.): $2.84 ($3.80 — #18 highest since 1929)
> U.S. gas consumption: 137.9 billion gallons — #12 most since 1945
> Per capita gas consumption: 445.7 gallons — #29 most since 1945
> Price of a barrel of oil (inflation adj.): $74.70 ($100.27 — #7 highest since 1929)
> U.S. oil production: 2.0 billion barrels — #67 most since 1929

2011
> Avg. U.S. gas prices per gallon (inflation adj.): $3.58 ($4.65 — #2 highest since 1929)
> U.S. gas consumption: 134.2 billion gallons — #19 most since 1945
> Per capita gas consumption: 430.6 gallons — #47 most since 1945
> Price of a barrel of oil (inflation adj.): $95.70 ($124.55 — #2 highest since 1929)
> U.S. oil production: 2.1 billion barrels — #64 most since 1929

2012
> Avg. U.S. gas prices per gallon (inflation adj.): $3.68 ($4.69 — #1 highest since 1929)
> U.S. gas consumption: 133.5 billion gallons — #20 most since 1945
> Per capita gas consumption: 425.2 gallons — #50 most since 1945
> Price of a barrel of oil (inflation adj.): $94.50 ($120.48 — #4 highest since 1929)
> U.S. oil production: 2.4 billion barrels — #52 most since 1929

2013
> Avg. U.S. gas prices per gallon (inflation adj.): $3.58 ($4.49 — #3 highest since 1929)
> U.S. gas consumption: 135.6 billion gallons — #16 most since 1945
> Per capita gas consumption: 428.9 gallons — #49 most since 1945
> Price of a barrel of oil (inflation adj.): $96.00 ($120.59 — #3 highest since 1929)
> U.S. oil production: 2.7 billion barrels — #37 most since 1929

2014
> Avg. U.S. gas prices per gallon (inflation adj.): $3.44 ($4.25 — #5 highest since 1929)
> U.S. gas consumption: 136.8 billion gallons — #14 most since 1945
> Per capita gas consumption: 429.5 gallons — #48 most since 1945
> Price of a barrel of oil (inflation adj.): $87.40 ($108.03 — #5 highest since 1929)
> U.S. oil production: 3.2 billion barrels — #18 most since 1929

2015
> Avg. U.S. gas prices per gallon (inflation adj.): $2.52 ($3.11 — #48 highest since 1929)
> U.S. gas consumption: 140.7 billion gallons — #7 most since 1945
> Per capita gas consumption: 438.7 gallons — #38 most since 1945
> Price of a barrel of oil (inflation adj.): $44.40 ($54.81 — #23 highest since 1929)
> U.S. oil production: 3.4 billion barrels — #9 most since 1929

2016
> Avg. U.S. gas prices per gallon (inflation adj.): $2.25 ($2.74 — #71 highest since 1929)
> U.S. gas consumption: 143.2 billion gallons — #1 most since 1945
> Per capita gas consumption: 443.3 gallons — #34 most since 1945
> Price of a barrel of oil (inflation adj.): $38.30 ($46.69 — #25 highest since 1929)
> U.S. oil production: 3.2 billion barrels — #16 most since 1929

2017
> Avg. U.S. gas prices per gallon (inflation adj.): $2.53 ($3.02 — #58 highest since 1929)
> U.S. gas consumption: 143.0 billion gallons — #3 most since 1945
> Per capita gas consumption: 439.8 gallons — #37 most since 1945
> Price of a barrel of oil (inflation adj.): $48.10 ($57.37 — #21 highest since 1929)
> U.S. oil production: 3.4 billion barrels — #10 most since 1929

2018
> Avg. U.S. gas prices per gallon (inflation adj.): $2.81 ($3.28 — #36 highest since 1929)
> U.S. gas consumption: 143.0 billion gallons — #2 most since 1945
> Per capita gas consumption: 437.6 gallons — #40 most since 1945
> Price of a barrel of oil (inflation adj.): $61.40 ($71.56 — #17 highest since 1929)
> U.S. oil production: 4.0 billion barrels — #5 most since 1929

2019
> Avg. U.S. gas prices per gallon (inflation adj.): $2.69 ($3.08 — #50 highest since 1929)
> U.S. gas consumption: 142.7 billion gallons — #4 most since 1945
> Per capita gas consumption: 434.7 gallons — #43 most since 1945
> Price of a barrel of oil (inflation adj.): $55.60 ($63.63 — #20 highest since 1929)
> U.S. oil production: 4.5 billion barrels — #1 most since 1929

2020
> Avg. U.S. gas prices per gallon (inflation adj.): $2.26 ($2.55 — #77 highest since 1929)
> U.S. gas consumption: 123.7 billion gallons — #25 most since 1945
> Per capita gas consumption: 373.2 gallons — #57 most since 1945
> Price of a barrel of oil (inflation adj.): $36.90 ($41.68 — #31 highest since 1929)
> U.S. oil production: 4.1 billion barrels — #3 most since 1929

2021
> Avg. U.S. gas prices per gallon (inflation adj.): $3.10 ($3.35 — #32 highest since 1929)
> U.S. gas consumption: 135.1 billion gallons — #17 most since 1945
> Per capita gas consumption: 407 gallons — #52 most since 1945
> Price of a barrel of oil (inflation adj.): $65.80 ($71.11 — #18 highest since 1929)
> U.S. oil production: 4.1 billion barrels — #4 most since 1929

2022
> Avg. U.S. gas prices per gallon (inflation adj.): $4.06 ($4.06 — #11 highest since 1929)
> U.S. gas consumption: 135.1 billion gallons — #18 most since 1945
> Per capita gas consumption: 405.2 gallons — #53 most since 1945
> Price of a barrel of oil (inflation adj.): $94.00 ($93.97 — #8 highest since 1929)
> U.S. oil production: 4.3 billion barrels — #2 most since 1929
Methodology:
24/7 Wall St. reviewed data from the U.S. Department of Energy Efficiency & Renewable Energy and the U.S. Energy Information Administration to determine the average cost of a gallon of gas every year since 1929. For the average U.S. motor gas price from 1929 to 1993, wwe referenced the March 7, 2016 Average Historical Annual Gasoline Pump Price, 1929-2015 report released by the Office of Energy Efficiency & Renewable Energy. For prices from 1994 to 2022, we referenced the U.S. Energy Information Administration’s historical annual gas prices data.
Annual U.S. gas consumption, annual U.S. oil production, and the average cost of a barrel of oil all also came from the EIA. All inflation-adjusted prices are tied to 2015 dollars. Annual U.S. crude oil imports and production also came from the EIA. The per capita gas consumption figure was calculated using historical annual U.S. Census Bureau figures, collected by USAFacts.org We adjusted oil and gas price figures for inflation using the Bureau of Labor Statistics’ Consumer Price Index.
Contact [email protected] for any questions or corrections.