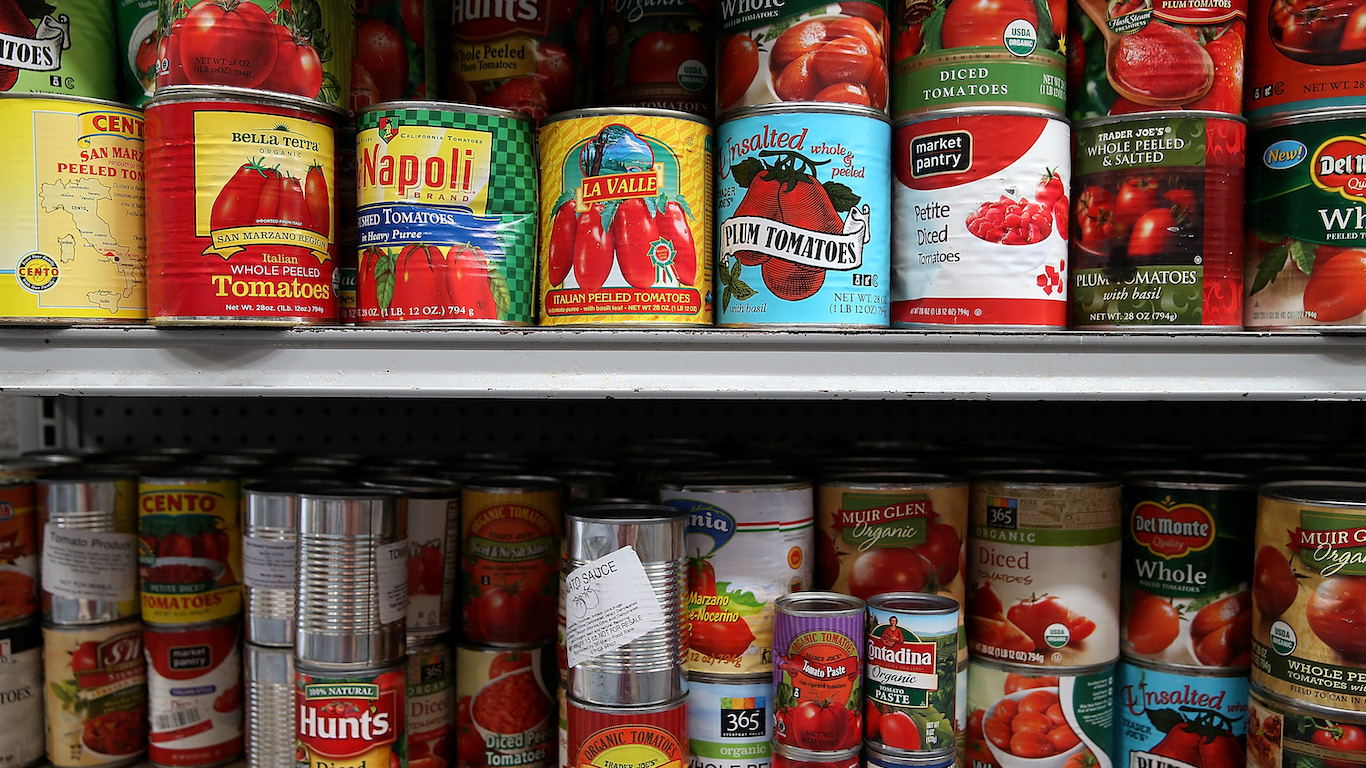
Food is a basic need that an estimated 42 million Americans struggle to afford. Americans on fixed incomes, those with disabilities, and low-income households with children are among the most likely to struggle to put food on the table. However, because of the Supplemental Nutrition Assistance Program — or SNAP — many of these Americans do not go hungry.
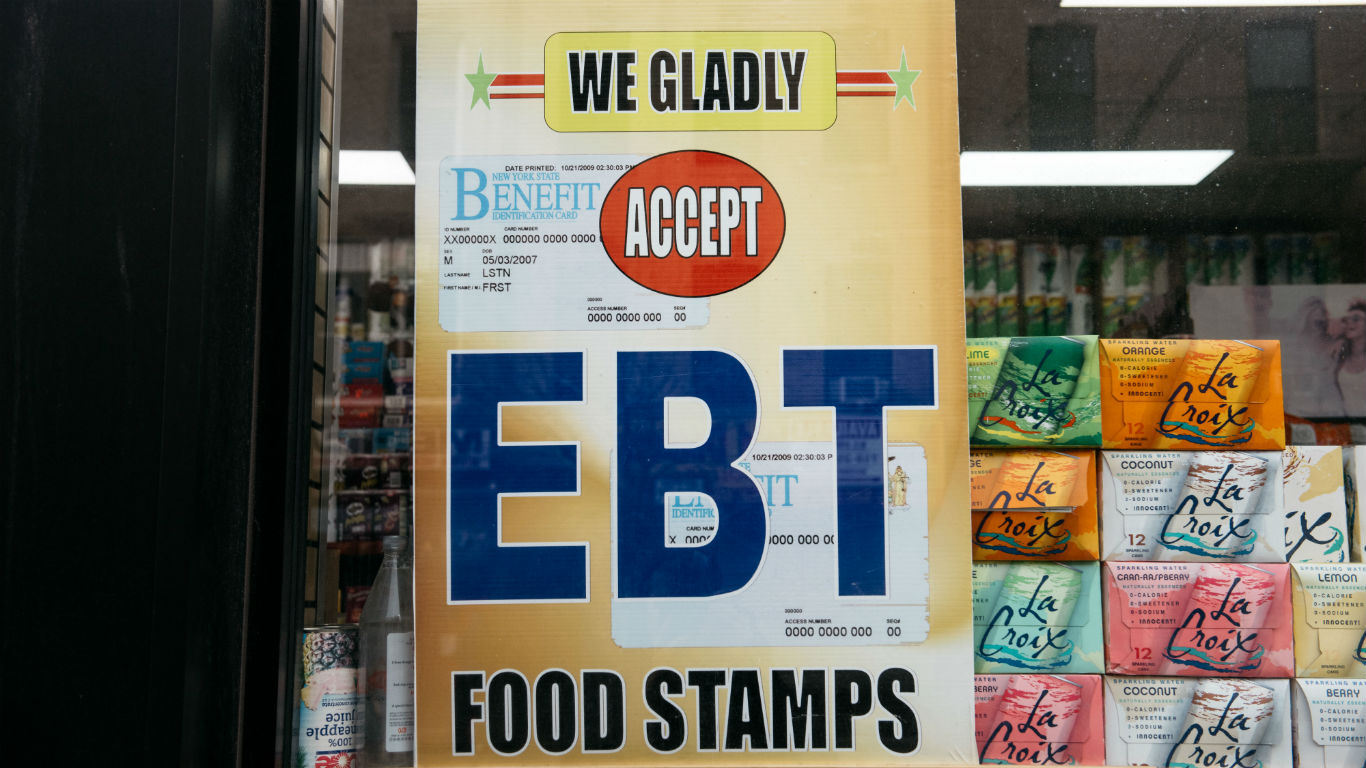
SNAP began as a temporary relief program during the Great Depression and became a permanent fixture in 1964 under President Lyndon Johnson. In its first year, the Food Stamp Program, as it was then known, had a budget of $75 million. As of fiscal 2017, the federal government spent about $70 billion on SNAP, in addition to modest administrative costs shouldered by the states.
[in-text-ad]
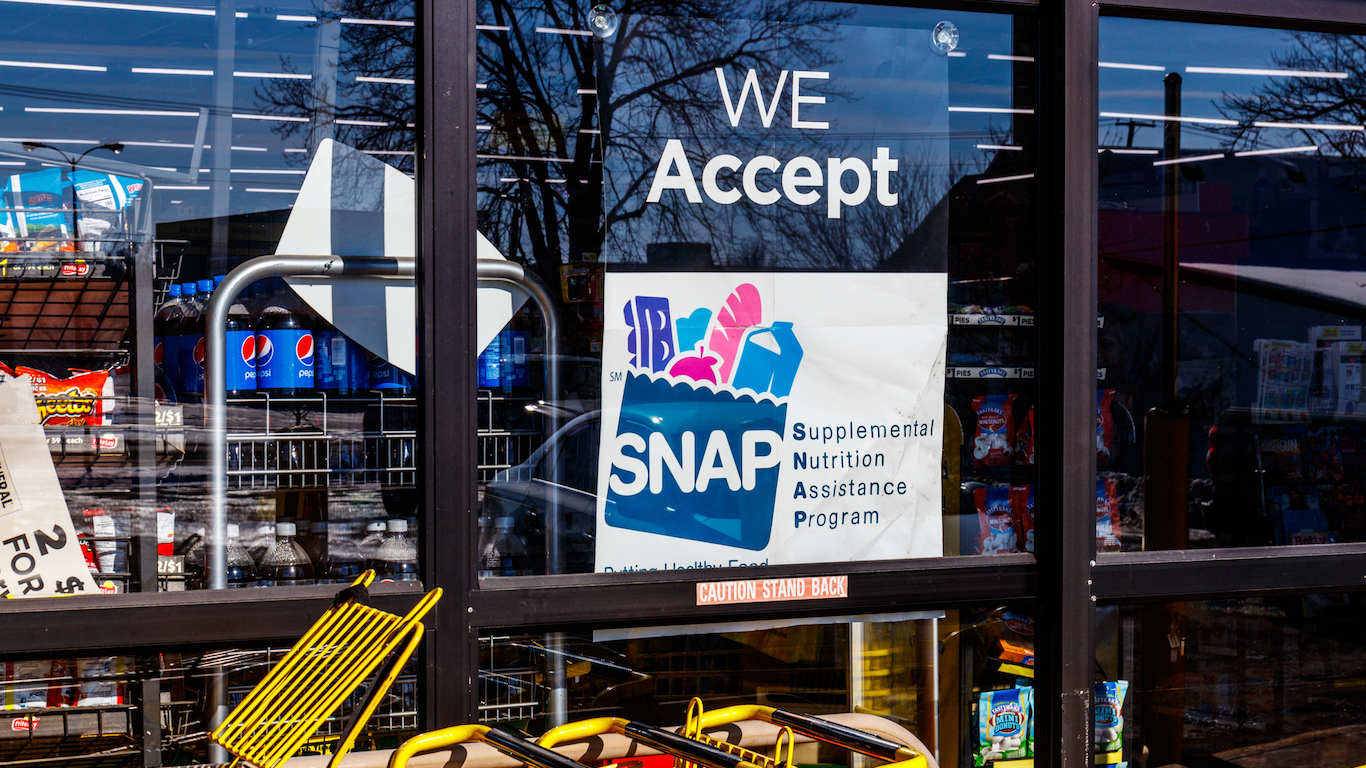
One of the most widely used federal programs, SNAP helped over 40 million Americans afford groceries in a typical month in 2017. However, the size and scope of the SNAP program is not static. During the Great Recession, the number of SNAP-eligible households increased considerably, and so did the recipiency rate. But as economic conditions have improved, the SNAP recipiency has fallen every year since 2014.
Because the size of the SNAP caseload is closely tied to the strength of the economy, varying social and economic conditions can affect recipiency on a regional level. 24/7 Wall St. reviewed recipiency rates in all U.S. metro areas to identify the cities where the largest share of people rely on SNAP benefits.
Not only do the vast majority of cities on this list have higher unemployment than the national average, but they are also home to large shares of the most vulnerable populations, including poor single-parent families, the disabled, adults with less than a high school education, and retirees on a low fixed income. SNAP recipiency rates tend to be higher in cities in the South and Western United States.
Nationwide, 12.4% of Americans rely on SNAP benefits. Several cities on this list have SNAP recipiency rates more than double the national average rate.
Click here to see the cities with the most people on food stamps.
Click here to see our detailed findings and methodology.

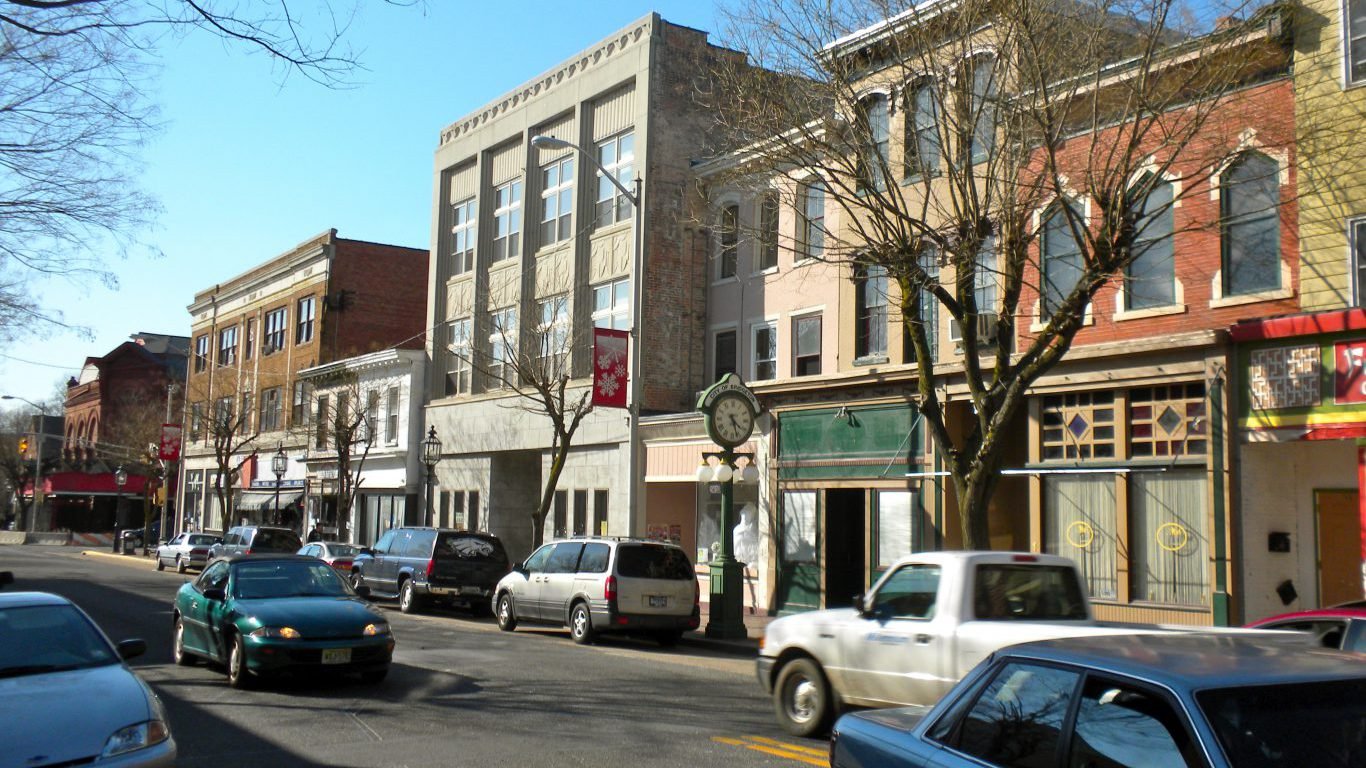
25. Beckley, WV
> Households with SNAP benefits: 19.8%
> Poverty rate: 15.9%
> Pop. with a disability: 22.8%
> May unemployment: 5.5%
[in-text-ad]

24. Medford, OR
> Households with SNAP benefits: 20.0%
> Poverty rate: 14.3%
> Pop. with a disability: 16.1%
> May unemployment: 4.1%
[recirclink id=444492]

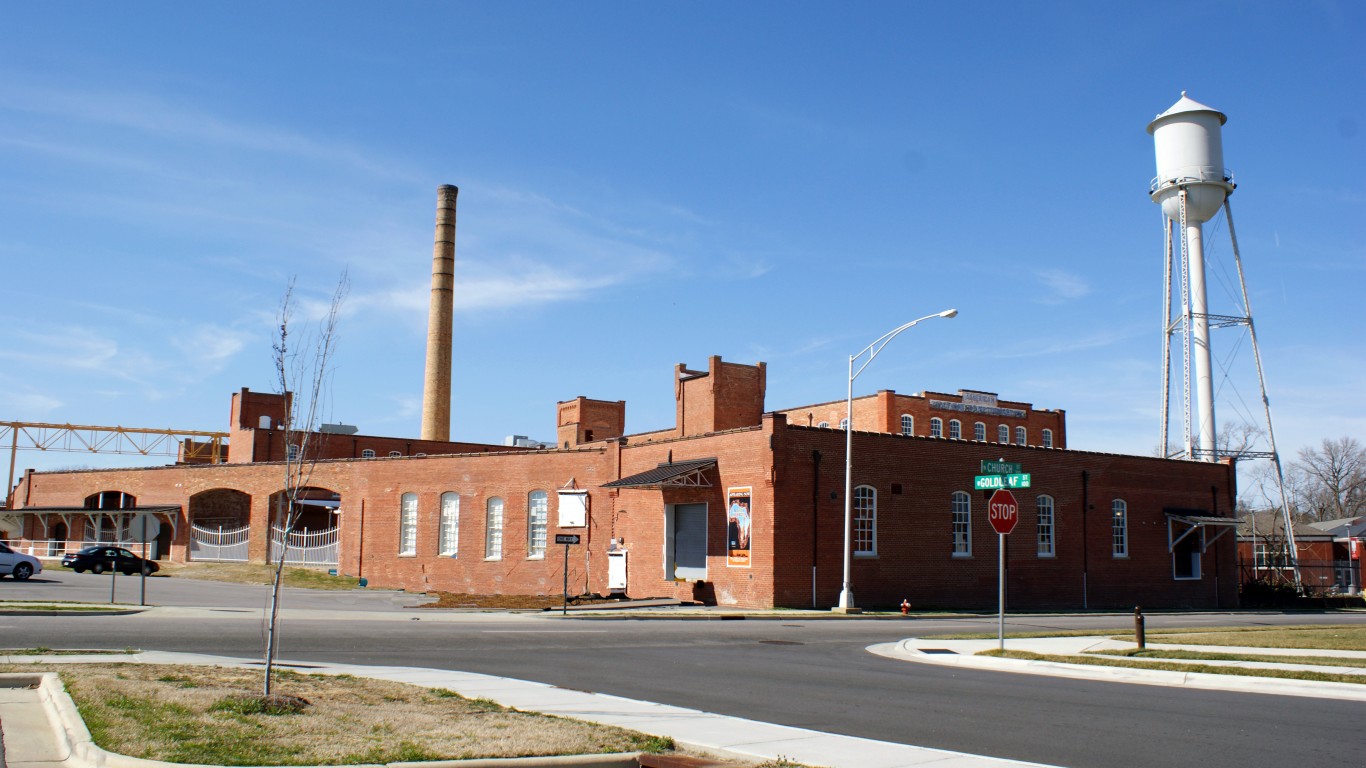
23. Goldsboro, NC
> Households with SNAP benefits: 20.0%
> Poverty rate: 22.0%
> Pop. with a disability: 17.1%
> May unemployment: 4.1%

22. Morristown, TN
> Households with SNAP benefits: 20.5%
> Poverty rate: 17.6%
> Pop. with a disability: 18.8%
> May unemployment: 3.2%

21. Decatur, IL
> Households with SNAP benefits: 20.6%
> Poverty rate: 17.2%
> Pop. with a disability: 16.9%
> May unemployment: 4.5%
20. Vineland-Bridgeton, NJ
> Households with SNAP benefits: 20.8%
> Poverty rate: 19.2%
> Pop. with a disability: 14.6%
> May unemployment: 5.4%
[in-text-ad]
19. El Centro, CA
> Households with SNAP benefits: 20.9%
> Poverty rate: 24.6%
> Pop. with a disability: 13.6%
> May unemployment: 15.8%
[recirclink id=444468]
18. Florence, SC
> Households with SNAP benefits: 21.2%
> Poverty rate: 18.6%
> Pop. with a disability: 16.4%
> May unemployment: 3.2%

17. Flint, MI
> Households with SNAP benefits: 21.2%
> Poverty rate: 20.2%
> Pop. with a disability: 16.7%
> May unemployment: 4.7%

16. Fresno, CA
> Households with SNAP benefits: 21.5%
> Poverty rate: 25.6%
> Pop. with a disability: 12.2%
> May unemployment: 6.9%

15. El Paso, TX
> Households with SNAP benefits: 21.6%
> Poverty rate: 22.8%
> Pop. with a disability: 15.2%
> May unemployment: 4.1%
[in-text-ad]
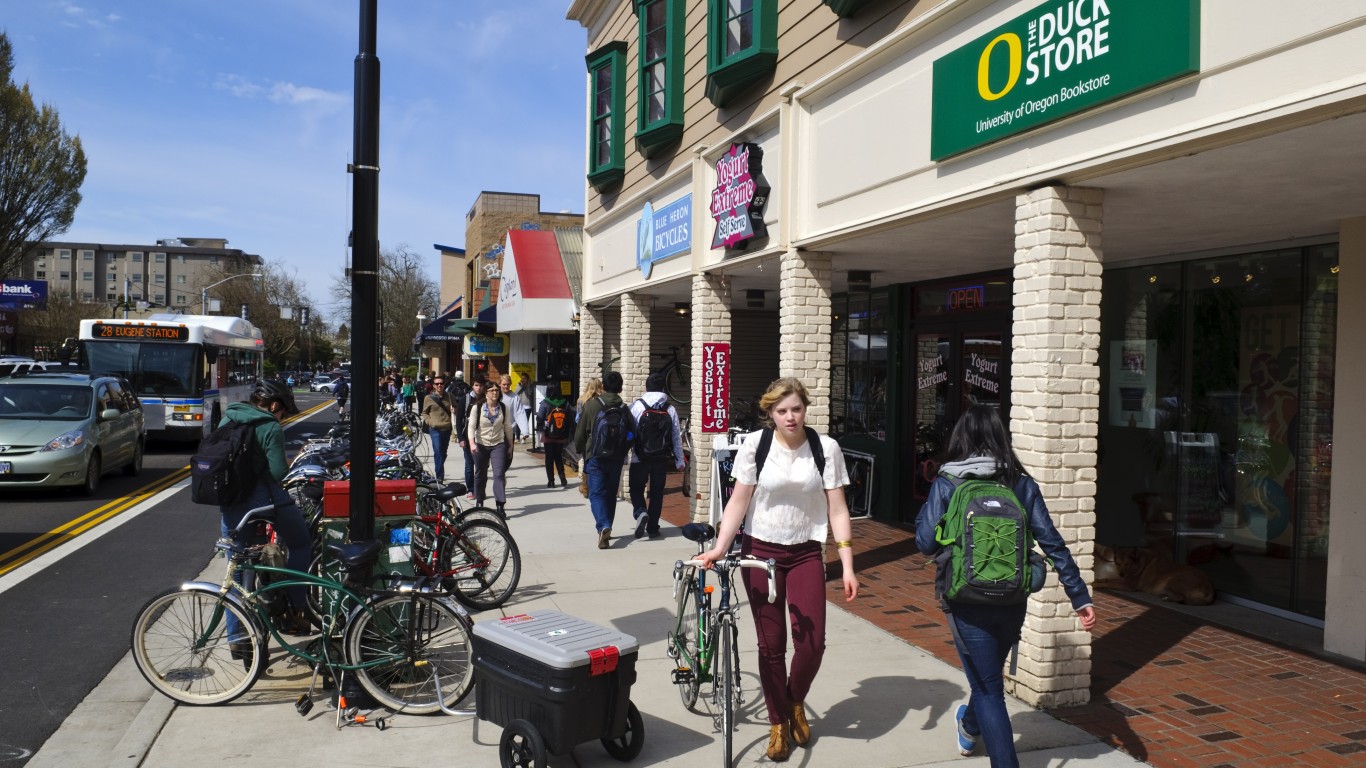
14. Eugene, OR
> Households with SNAP benefits: 21.7%
> Poverty rate: 19.0%
> Pop. with a disability: 16.5%
> May unemployment: 3.8%
[recirclink id=444391]

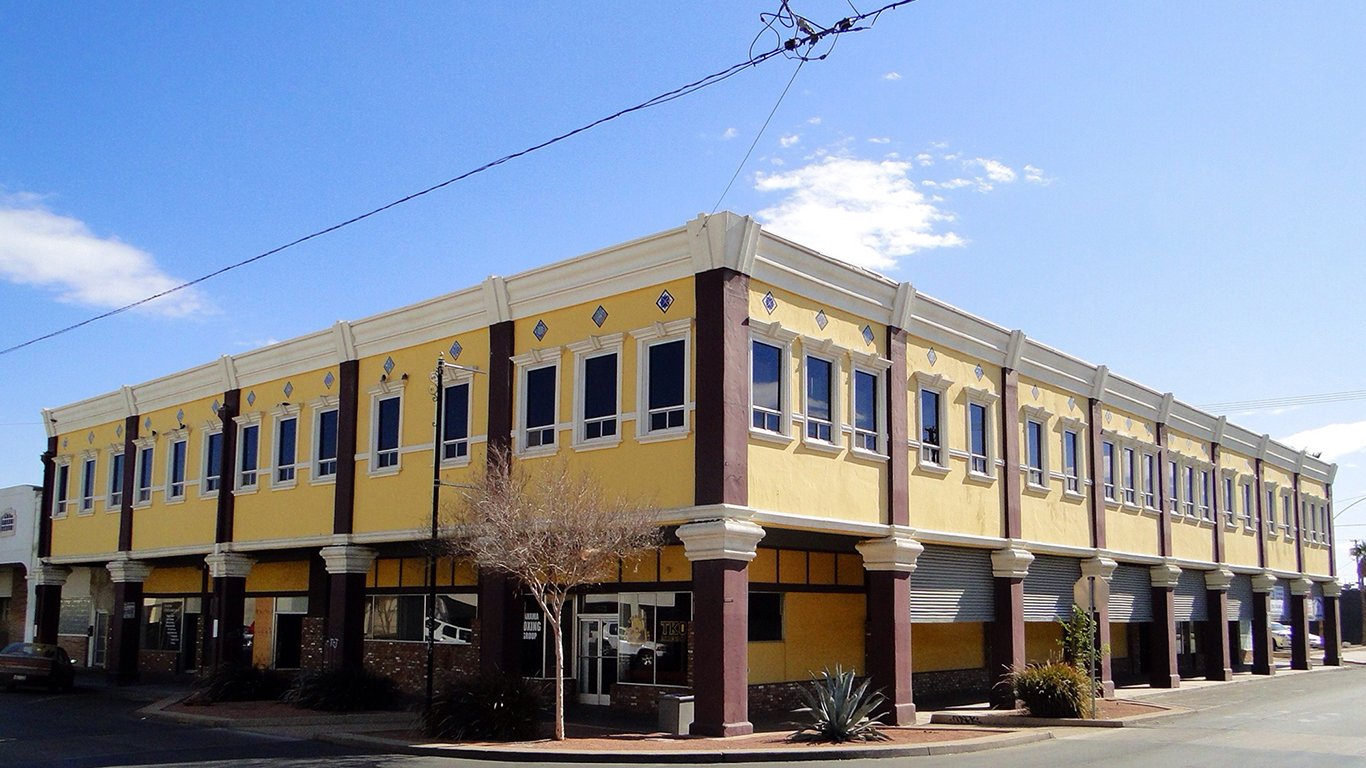
13. Yakima, WA
> Households with SNAP benefits: 21.8%
> Poverty rate: 18.0%
> Pop. with a disability: 13.9%
> May unemployment: 6.0%

12. Sumter, SC
> Households with SNAP benefits: 22.3%
> Poverty rate: 21.2%
> Pop. with a disability: 20.6%
> May unemployment: 3.4%
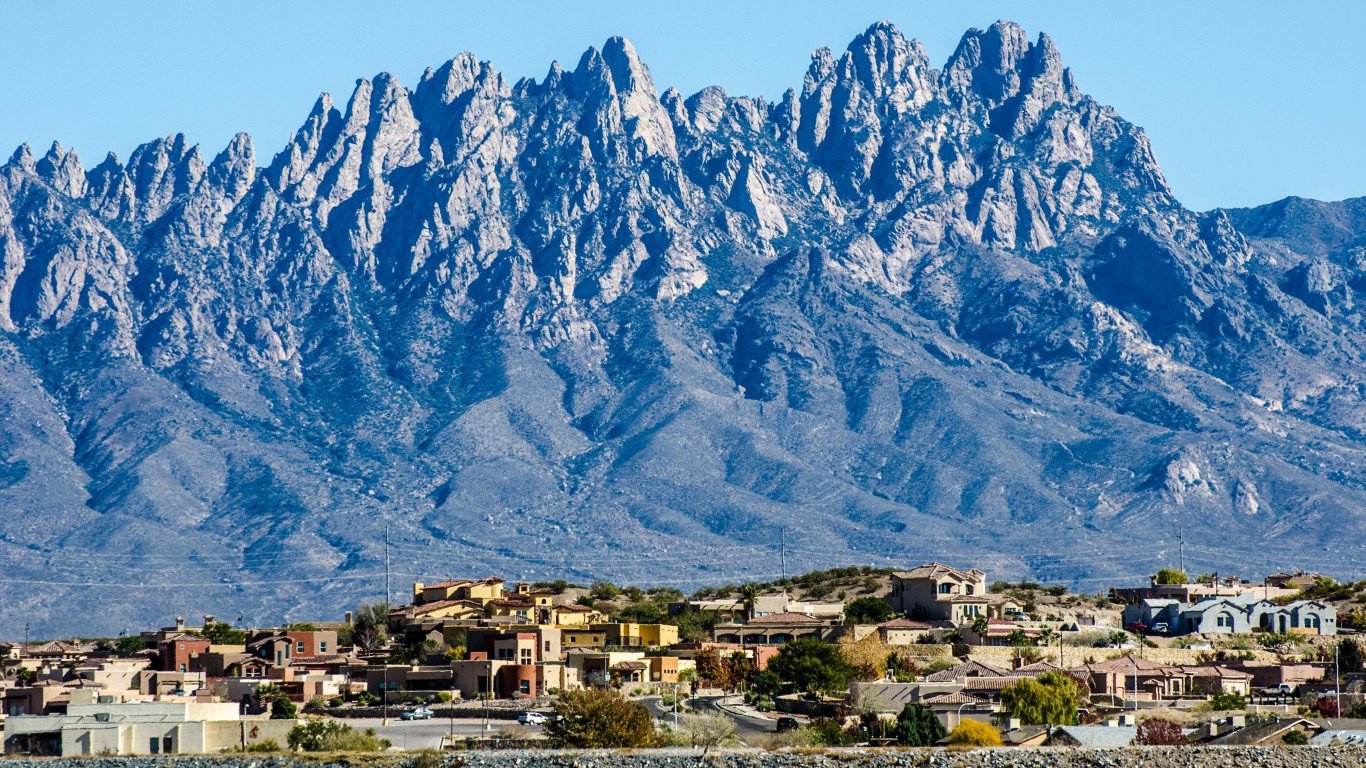
11. Las Cruces, NM
> Households with SNAP benefits: 22.5%
> Poverty rate: 27.1%
> Pop. with a disability: 12.8%
> May unemployment: 4.9%

10. Merced, CA
> Households with SNAP benefits: 22.6%
> Poverty rate: 20.3%
> Pop. with a disability: 14.1%
> May unemployment: 7.8%
[in-text-ad]

9. Longview, WA
> Households with SNAP benefits: 22.7%
> Poverty rate: 16.8%
> Pop. with a disability: 21.0%
> May unemployment: 5.8%
[recirclink id=444326]

8. Visalia-Porterville, CA
> Households with SNAP benefits: 23.0%
> Poverty rate: 25.2%
> Pop. with a disability: 13.9%
> May unemployment: 8.4%
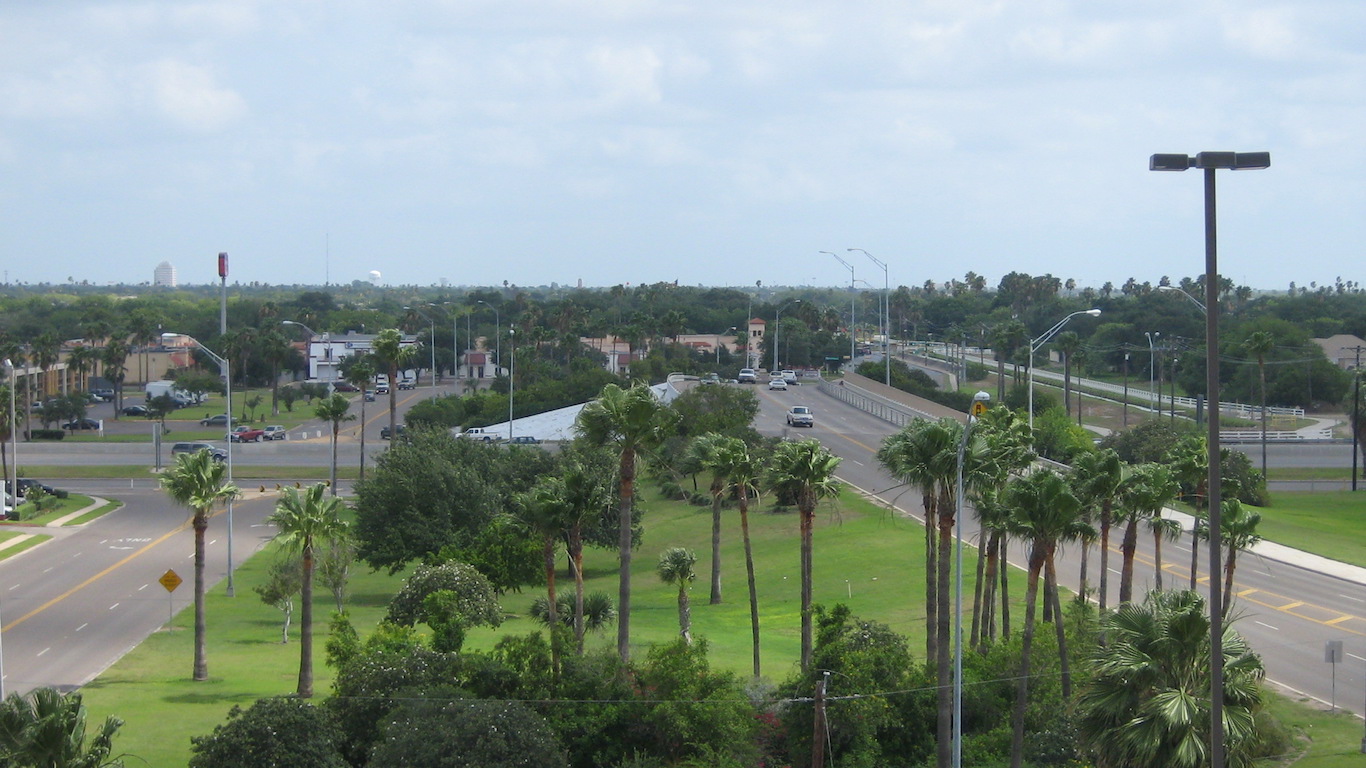
7. Brownsville-Harlingen, TX
> Households with SNAP benefits: 23.1%
> Poverty rate: 29.3%
> Pop. with a disability: 11.6%
> May unemployment: 6.0%

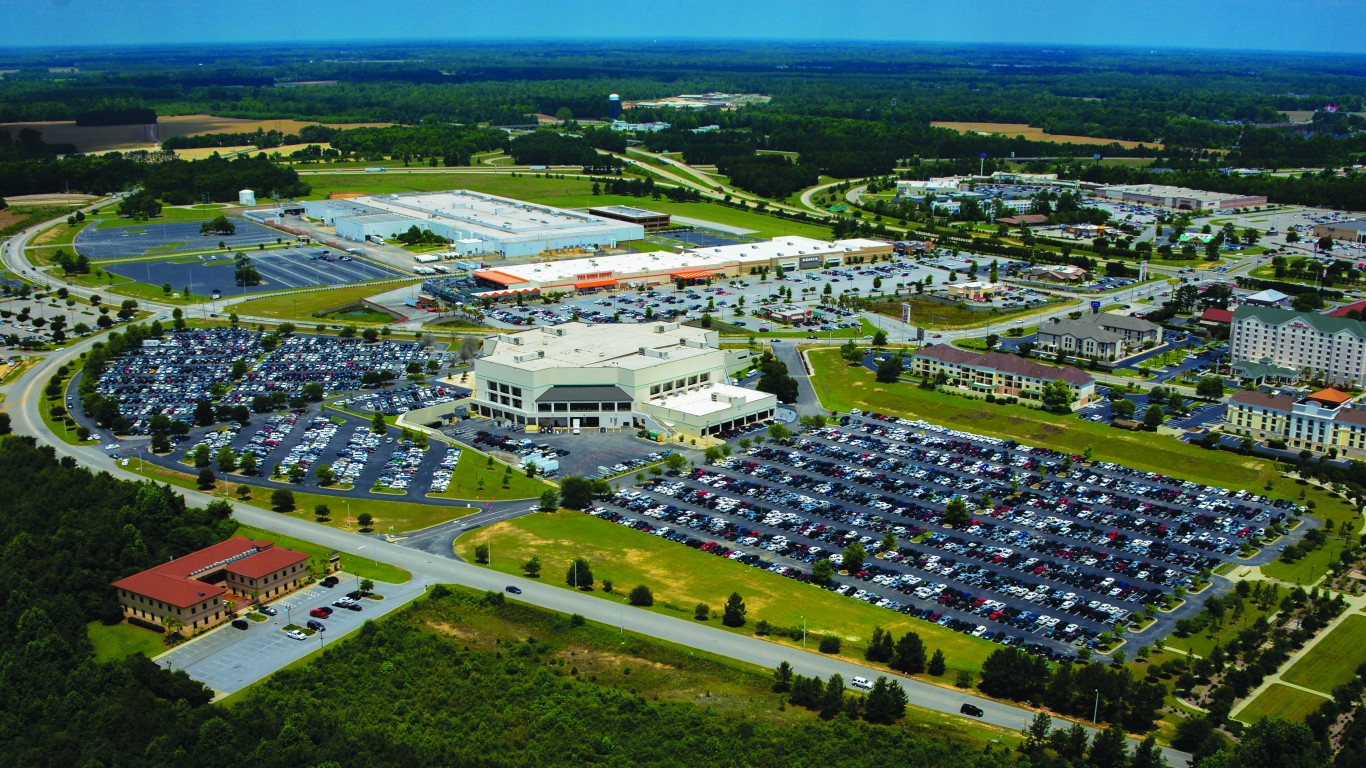
6. Albany, GA
> Households with SNAP benefits: 23.9%
> Poverty rate: 25.0%
> Pop. with a disability: 14.6%
> May unemployment: 4.2%

5. Hammond, LA
> Households with SNAP benefits: 24.4%
> Poverty rate: 20.4%
> Pop. with a disability: 20.8%
> May unemployment: 5.0%
[in-text-ad]
4. Rocky Mount, NC
> Households with SNAP benefits: 24.5%
> Poverty rate: 17.8%
> Pop. with a disability: 17.8%
> May unemployment: 5.8%
[recirclink id=444046]

3. Grants Pass, OR
> Households with SNAP benefits: 25.1%
> Poverty rate: 17.6%
> Pop. with a disability: 20.1%
> May unemployment: 4.6%

2. Laredo, TX
> Households with SNAP benefits: 27.0%
> Poverty rate: 33.0%
> Pop. with a disability: 11.5%
> May unemployment: 3.6%
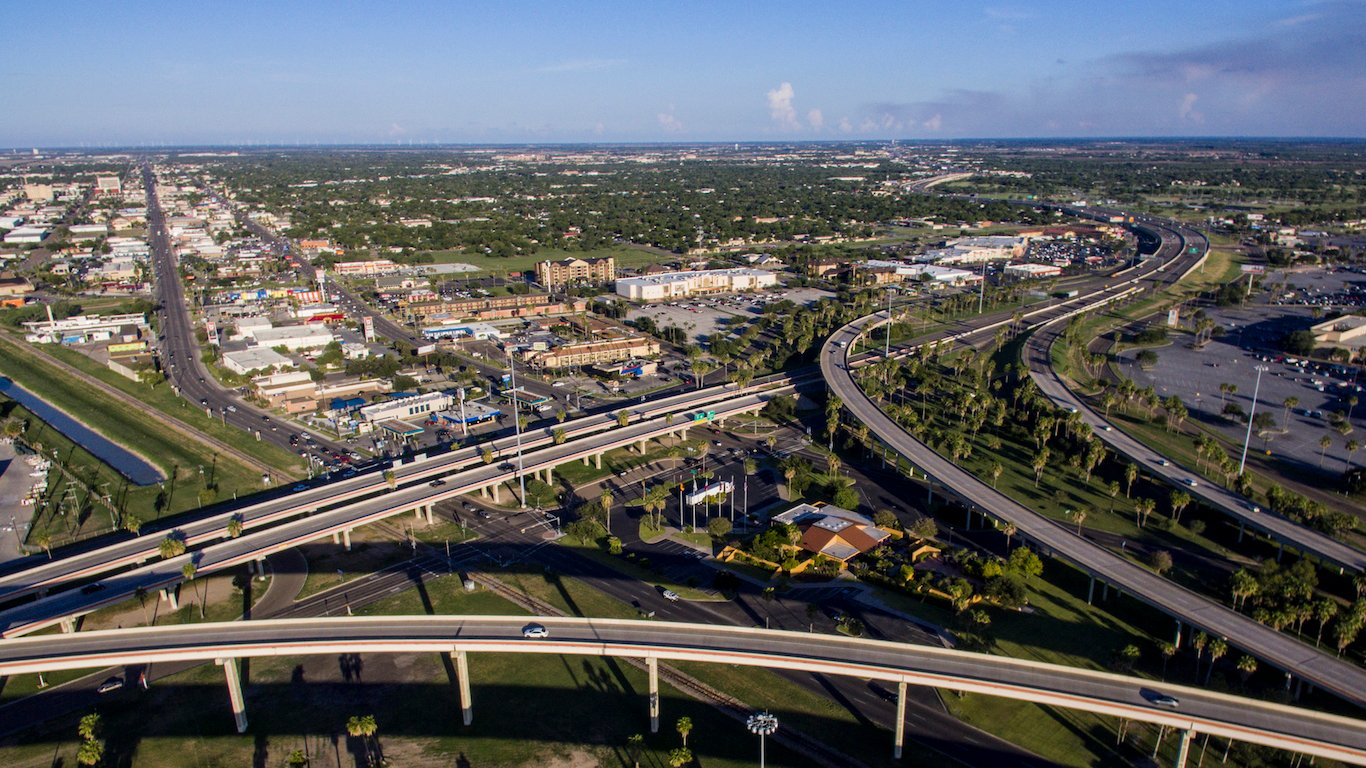
1. McAllen-Edinburg-Mission, TX
> Households with SNAP benefits: 29.8%
> Poverty rate: 31.4%
> Pop. with a disability: 13.8%
> May unemployment: 6.2%
Detailed Findings
Nationwide, the share of households receiving SNAP benefits tends to go up during times of high unemployment. Similarly, unemployment rates are high in most cities on this list. In 20 of the 25 cities with the highest SNAP recipiency rates, the May 2018 jobless rates exceeded the 3.8% U.S. unemployment rate.
Generally, Americans with a gross monthly income within 130% of the poverty line are eligible for SNAP benefits. In every city on this list, the poverty rate exceeds the 14.0% national poverty rate.
According to the Center on Budget and Policy Priorities, nearly 70% of SNAP recipients are families with children. Indeed, the cities on this list are home to relatively large shares of families struggling financially. Medford, Oregon, is the only metro area on this list home to a smaller share of families living in poverty than the 15.9% national rate. Similarly, all but two cities on this list have a higher poverty rate among single-mother households than the 37% national rate.
The CBPP also estimates that about a third of all SNAP recipients are households with seniors or people with disabilities. Seniors often live on a fixed income, and the average annual retirement income is lower than the national average of $25,829 in 21 of the 25 cities on this list.
Disabled Americans also often are unable to work and have to rely on social assistance. The share of disabled residents is higher than it is nationwide in 21 of the 25 cities with the highest SNAP recipiency rates.
For those Americans who are healthy enough and able to work, the likelihood of landing a well-paying job depends heavily on education — and those without a high school degree are at a serious disadvantage. In 19 of the cities on this list, a smaller share of adults have a high school diploma than the 87.5% national share. In the McAllen, Texas, metro area, fewer than two out of three adults have completed high school, likely contributing to greater overall dependence on government assistance.
Methodology
To identify the cities with the most people receiving SNAP benefits, 24/7 Wall St. reviewed the SNAP recipiency rate in all 382 U.S. metro areas. SNAP recipiency rates, as well as poverty, educational attainment, retirement income, and disability rates are one year estimates from the U.S. Census Bureau’s 2016 American Community Survey. Unemployment rates are seasonally adjusted for May 2018 and are from the Bureau of Labor Statistics.