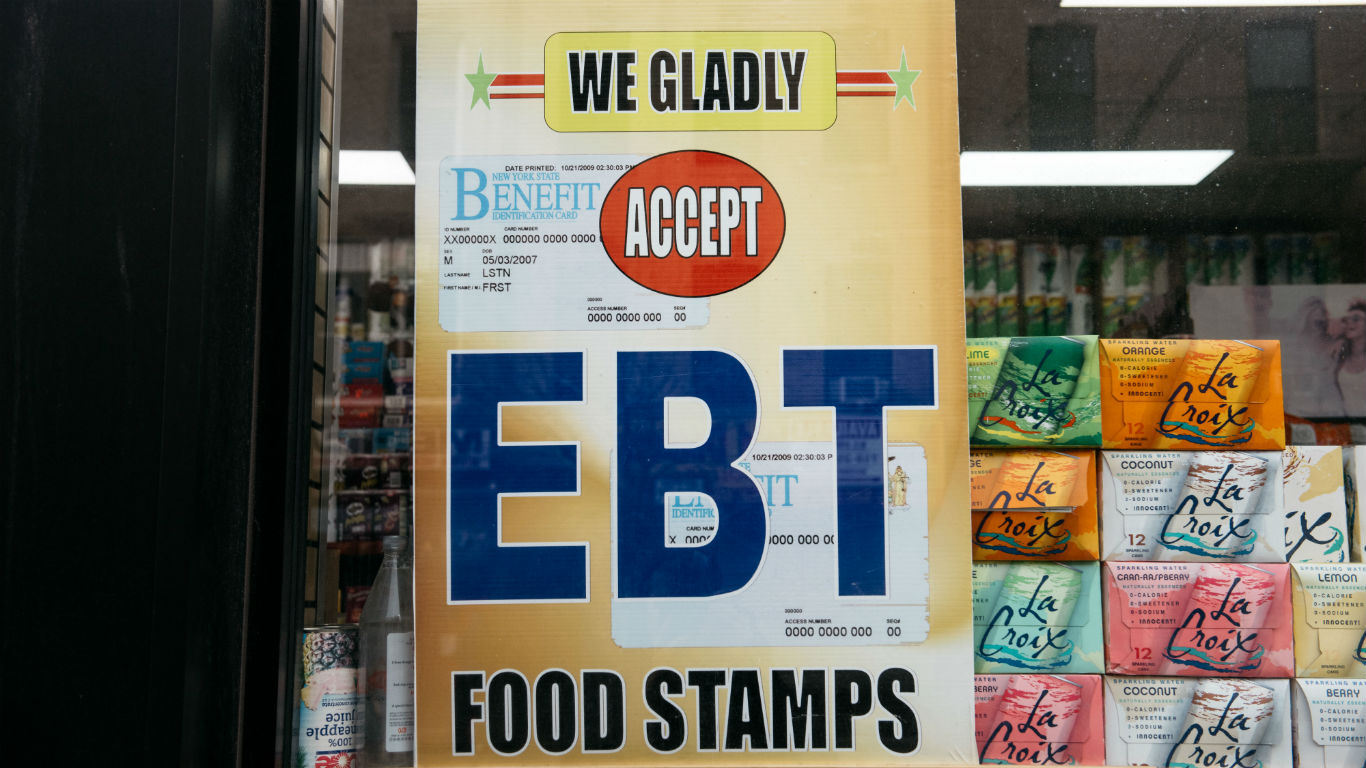
In June, California announced it would be sending $1,050 checks to approximately 23 million residents to combat the devastating effects inflation has had on state residents. Since then, a number of other states have followed suit with some form of check or tax rebate. Should even more states follow suit and release their own relief, the checks likely would not be enough on their own for needy families. One long-standing program that millions of Americans rely on is the government’s food assistance benefits, the Supplemental Nutrition Assistance Program.
As of 2020, roughly 13.8 million U.S. households received SNAP benefits, formerly known as food stamps. To find the city with the highest SNAP recipiency rate in every state, 24/7 Wall St. reviewed five-year estimates for places with at least 25,000 people to determine the share of households that received SNAP benefits in the 12 months prior to the survey from the U.S. Census Bureau’s 2020 American Community Survey.
As of 2020, 11.4% of U.S. households received SNAP benefits. In most states, there is at least one city where a higher share of households receive nutrition assistance. In some of the cities with the highest SNAP recipiency rates in each state, that figure exceeds 30%, even in some cases 40%.
While factors such as assets and household composition impact whether a household qualifies for the benefit, SNAP recipiency is primarily determined by income. The majority of the cities with the highest SNAP recipiency rate in each state also have the highest or second highest poverty rate in their respective states. Youngstown, Ohio, has a SNAP recipiency rate of 34.9% and a poverty rate of 34.3%, each the highest share in the state and among the highest such futures nationwide. These are the states where the most children live in Poverty.
Because income is the primary determinant for SNAP recipiency, unemployment is strongly linked to how many people receive benefits, as those workers who are out of a job are likely to have little to no income. Out of the 50 cities on this list, 44 have higher five-year unemployment rates compared to their respective states. This includes Flint, Michigan, which has an unemployment rate of 19.5% and a SNAP recipiency rate of 39.5%. These are the states with the worst spikes in unemployment since the pandemic began.
Click here to see the city with the highest SNAP recipiency rate in every state.
Click here to see our detailed methodology.

Alabama: Bessemer
> Households receiving SNAP benefits: 27.3% (Alabama: 13.4%)
> Poverty rate: 25.9% (Alabama: 16.0%)
> Median household income: $30,284 (Alabama: $52,035)
> Unemployment rate: 13.8% (Alabama: 5.5%)
> No. of cities considered in ranking: 22
[in-text-ad]

Alaska: Fairbanks
> Households receiving SNAP benefits: 9.8% (Alaska: 10.3%)
> Poverty rate: 9.3% (Alaska: 10.3%)
> Median household income: $64,397 (Alaska: $77,790)
> Unemployment rate: 6.2% (Alaska: 6.8%)
> No. of cities considered in ranking: 3
[recirclink id=1112369]

Arizona: San Luis
> Households receiving SNAP benefits: 34.1% (Arizona: 10.5%)
> Poverty rate: 23.1% (Arizona: 14.1%)
> Median household income: $41,648 (Arizona: $61,529)
> Unemployment rate: 10.2% (Arizona: 5.8%)
> No. of cities considered in ranking: 38

Arkansas: Pine Bluff
> Households receiving SNAP benefits: 22.4% (Arkansas: 11.7%)
> Poverty rate: 25.4% (Arkansas: 16.1%)
> Median household income: $34,410 (Arkansas: $49,475)
> Unemployment rate: 10.8% (Arkansas: 5.2%)
> No. of cities considered in ranking: 18
[in-text-ad-2]

California: Adelanto
> Households receiving SNAP benefits: 35.8% (California: 9.0%)
> Poverty rate: 25.3% (California: 12.6%)
> Median household income: $49,493 (California: $78,672)
> Unemployment rate: 12.2% (California: 6.1%)
> No. of cities considered in ranking: 281

Colorado: Pueblo
> Households receiving SNAP benefits: 23.3% (Colorado: 7.2%)
> Poverty rate: 21.8% (Colorado: 9.8%)
> Median household income: $42,902 (Colorado: $75,231)
> Unemployment rate: 7.7% (Colorado: 4.6%)
> No. of cities considered in ranking: 31
[in-text-ad]

Connecticut: Hartford
> Households receiving SNAP benefits: 38.2% (Connecticut: 11.6%)
> Poverty rate: 28.0% (Connecticut: 9.8%)
> Median household income: $36,154 (Connecticut: $79,855)
> Unemployment rate: 11.3% (Connecticut: 6.0%)
> No. of cities considered in ranking: 24
[recirclink id=1111559]

Delaware: Wilmington
> Households receiving SNAP benefits: 21.1% (Delaware: 10.6%)
> Poverty rate: 24.9% (Delaware: 11.4%)
> Median household income: $45,139 (Delaware: $69,110)
> Unemployment rate: 9.8% (Delaware: 5.8%)
> No. of cities considered in ranking: 3

Florida: Leisure City
> Households receiving SNAP benefits: 43.8% (Florida: 13.2%)
> Poverty rate: 23.5% (Florida: 13.3%)
> Median household income: $36,611 (Florida: $57,703)
> Unemployment rate: 8.0% (Florida: 5.4%)
> No. of cities considered in ranking: 153
[in-text-ad-2]

Georgia: Albany
> Households receiving SNAP benefits: 27.6% (Georgia: 12.2%)
> Poverty rate: 29.7% (Georgia: 14.3%)
> Median household income: $38,826 (Georgia: $61,224)
> Unemployment rate: 10.9% (Georgia: 5.5%)
> No. of cities considered in ranking: 42

Hawaii: Hilo
> Households receiving SNAP benefits: 22.5% (Hawaii: 10.7%)
> Poverty rate: 17.0% (Hawaii: 9.3%)
> Median household income: $65,727 (Hawaii: $83,173)
> Unemployment rate: 6.2% (Hawaii: 4.3%)
> No. of cities considered in ranking: 10
[in-text-ad]

Idaho: Caldwell
> Households receiving SNAP benefits: 16.9% (Idaho: 9.0%)
> Poverty rate: 13.7% (Idaho: 11.9%)
> Median household income: $55,069 (Idaho: $58,915)
> Unemployment rate: 6.2% (Idaho: 4.2%)
> No. of cities considered in ranking: 12
[recirclink id=1047662]

Illinois: East St. Louis
> Households receiving SNAP benefits: 40.8% (Illinois: 12.4%)
> Poverty rate: 30.6% (Illinois: 12.0%)
> Median household income: $24,009 (Illinois: $68,428)
> Unemployment rate: 13.1% (Illinois: 5.9%)
> No. of cities considered in ranking: 89
Indiana: East Chicago
> Households receiving SNAP benefits: 31.2% (Indiana: 9.3%)
> Poverty rate: 30.6% (Indiana: 12.9%)
> Median household income: $35,396 (Indiana: $58,235)
> Unemployment rate: 8.4% (Indiana: 4.7%)
> No. of cities considered in ranking: 36
[in-text-ad-2]

Iowa: Waterloo
> Households receiving SNAP benefits: 19.0% (Iowa: 9.8%)
> Poverty rate: 17.5% (Iowa: 11.1%)
> Median household income: $46,942 (Iowa: $61,836)
> Unemployment rate: 6.7% (Iowa: 3.9%)
> No. of cities considered in ranking: 18

Kansas: Kansas City
> Households receiving SNAP benefits: 14.3% (Kansas: 7.2%)
> Poverty rate: 19.2% (Kansas: 11.4%)
> Median household income: $46,424 (Kansas: $61,091)
> Unemployment rate: 6.6% (Kansas: 4.0%)
> No. of cities considered in ranking: 14
[in-text-ad]

Kentucky: Henderson
> Households receiving SNAP benefits: 19.2% (Kentucky: 13.0%)
> Poverty rate: 23.0% (Kentucky: 16.6%)
> Median household income: $40,360 (Kentucky: $52,238)
> Unemployment rate: 3.8% (Kentucky: 5.3%)
> No. of cities considered in ranking: 15
[recirclink id=1104870]

Louisiana: Monroe
> Households receiving SNAP benefits: 27.7% (Louisiana: 15.3%)
> Poverty rate: 36.0% (Louisiana: 18.6%)
> Median household income: $31,926 (Louisiana: $50,800)
> Unemployment rate: 7.9% (Louisiana: 6.5%)
> No. of cities considered in ranking: 18
Maine: Lewiston
> Households receiving SNAP benefits: 23.9% (Maine: 12.6%)
> Poverty rate: 16.6% (Maine: 11.1%)
> Median household income: $42,969 (Maine: $59,489)
> Unemployment rate: 5.3% (Maine: 4.0%)
> No. of cities considered in ranking: 4
[in-text-ad-2]

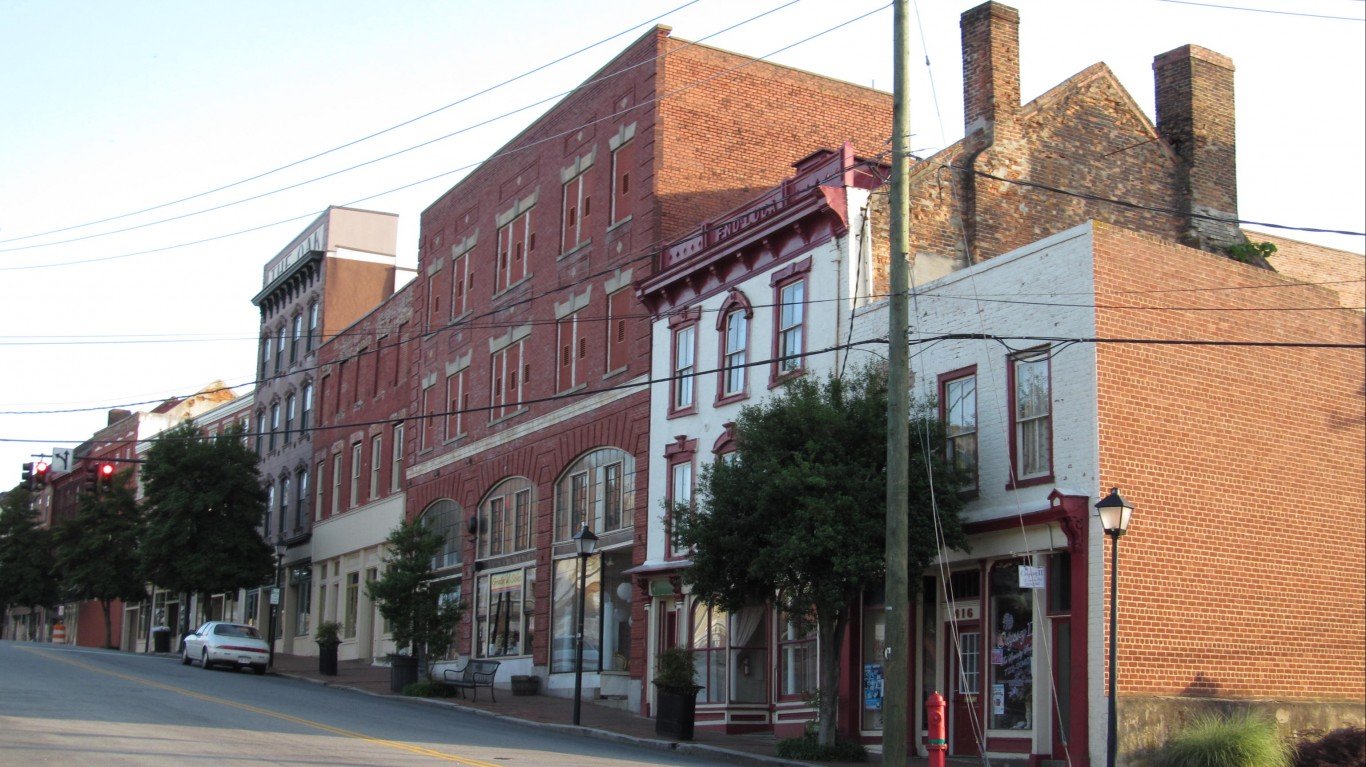
Maryland: Hagerstown
> Households receiving SNAP benefits: 26.8% (Maryland: 10.1%)
> Poverty rate: 24.6% (Maryland: 9.0%)
> Median household income: $41,905 (Maryland: $87,063)
> Unemployment rate: 8.3% (Maryland: 5.1%)
> No. of cities considered in ranking: 52

Massachusetts: Lawrence
> Households receiving SNAP benefits: 39.0% (Massachusetts: 11.6%)
> Poverty rate: 21.0% (Massachusetts: 9.8%)
> Median household income: $45,045 (Massachusetts: $84,385)
> Unemployment rate: 11.0% (Massachusetts: 5.1%)
> No. of cities considered in ranking: 64
[in-text-ad]
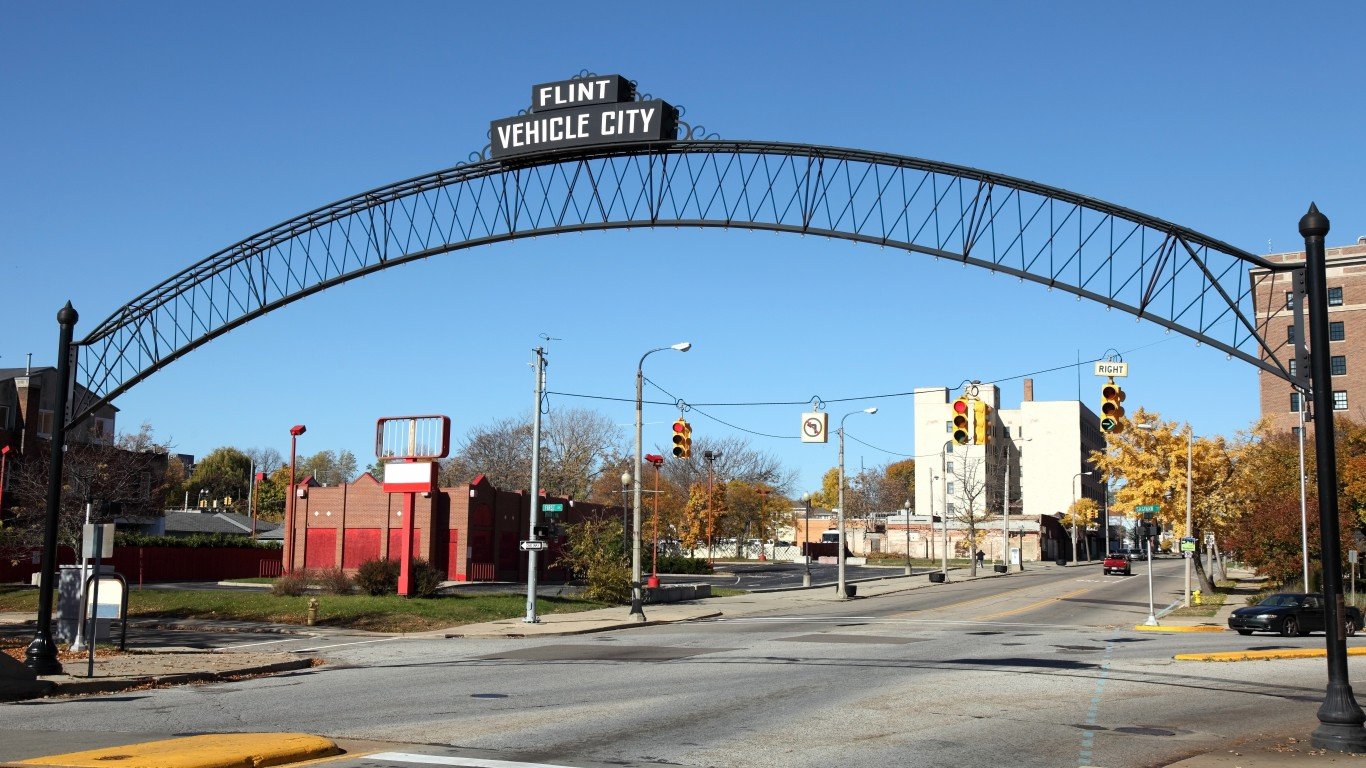
Michigan: Flint
> Households receiving SNAP benefits: 39.5% (Michigan: 12.7%)
> Poverty rate: 37.3% (Michigan: 13.7%)
> Median household income: $30,383 (Michigan: $59,234)
> Unemployment rate: 19.5% (Michigan: 6.0%)
> No. of cities considered in ranking: 44
[recirclink id=1100321]

Minnesota: St. Paul
> Households receiving SNAP benefits: 15.9% (Minnesota: 7.5%)
> Poverty rate: 17.9% (Minnesota: 9.3%)
> Median household income: $59,717 (Minnesota: $73,382)
> Unemployment rate: 5.0% (Minnesota: 3.8%)
> No. of cities considered in ranking: 40

Mississippi: Greenville
> Households receiving SNAP benefits: 28.0% (Mississippi: 14.6%)
> Poverty rate: 34.6% (Mississippi: 19.6%)
> Median household income: $29,013 (Mississippi: $46,511)
> Unemployment rate: 11.3% (Mississippi: 7.1%)
> No. of cities considered in ranking: 13
[in-text-ad-2]

Missouri: St. Louis
> Households receiving SNAP benefits: 18.8% (Missouri: 10.5%)
> Poverty rate: 20.4% (Missouri: 13.0%)
> Median household income: $45,782 (Missouri: $57,290)
> Unemployment rate: 5.8% (Missouri: 4.5%)
> No. of cities considered in ranking: 26

Montana: Butte-Silver Bow
> Households receiving SNAP benefits: 14.8% (Montana: 9.3%)
> Poverty rate: 16.0% (Montana: 12.8%)
> Median household income: $49,659 (Montana: $56,539)
> Unemployment rate: 5.3% (Montana: 4.1%)
> No. of cities considered in ranking: 6
[in-text-ad]
Nebraska: Fremont
> Households receiving SNAP benefits: 12.9% (Nebraska: 8.1%)
> Poverty rate: 12.3% (Nebraska: 10.4%)
> Median household income: $54,291 (Nebraska: $63,015)
> Unemployment rate: 5.6% (Nebraska: 3.4%)
> No. of cities considered in ranking: 6
[recirclink id=1112369]
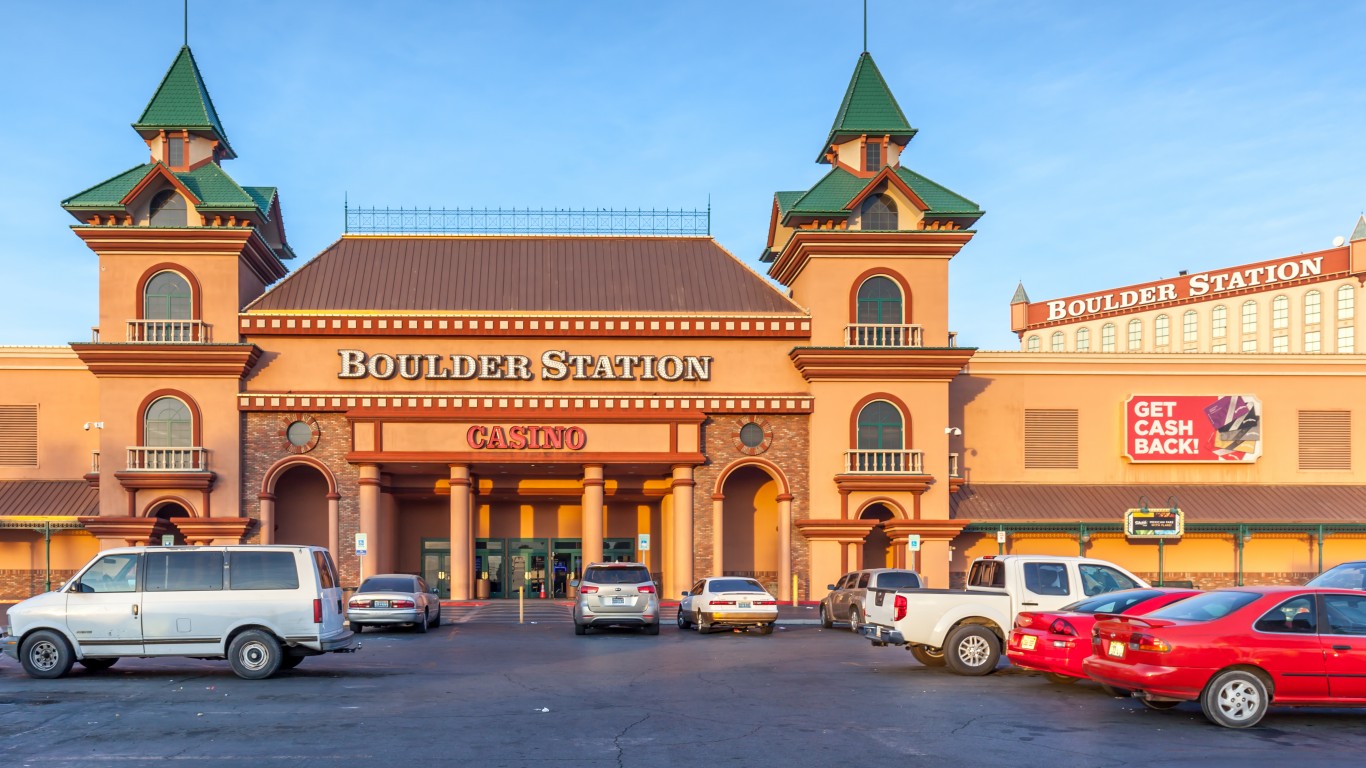
Nevada: Sunrise Manor
> Households receiving SNAP benefits: 23.8% (Nevada: 11.6%)
> Poverty rate: 21.4% (Nevada: 12.8%)
> Median household income: $44,641 (Nevada: $62,043)
> Unemployment rate: 9.2% (Nevada: 6.5%)
> No. of cities considered in ranking: 13

New Hampshire: Manchester
> Households receiving SNAP benefits: 11.5% (New Hampshire: 6.4%)
> Poverty rate: 13.1% (New Hampshire: 7.4%)
> Median household income: $62,087 (New Hampshire: $77,923)
> Unemployment rate: 5.2% (New Hampshire: 3.7%)
> No. of cities considered in ranking: 5
[in-text-ad-2]

New Jersey: Camden
> Households receiving SNAP benefits: 38.9% (New Jersey: 8.4%)
> Poverty rate: 33.6% (New Jersey: 9.7%)
> Median household income: $28,623 (New Jersey: $85,245)
> Unemployment rate: 13.9% (New Jersey: 5.8%)
> No. of cities considered in ranking: 36
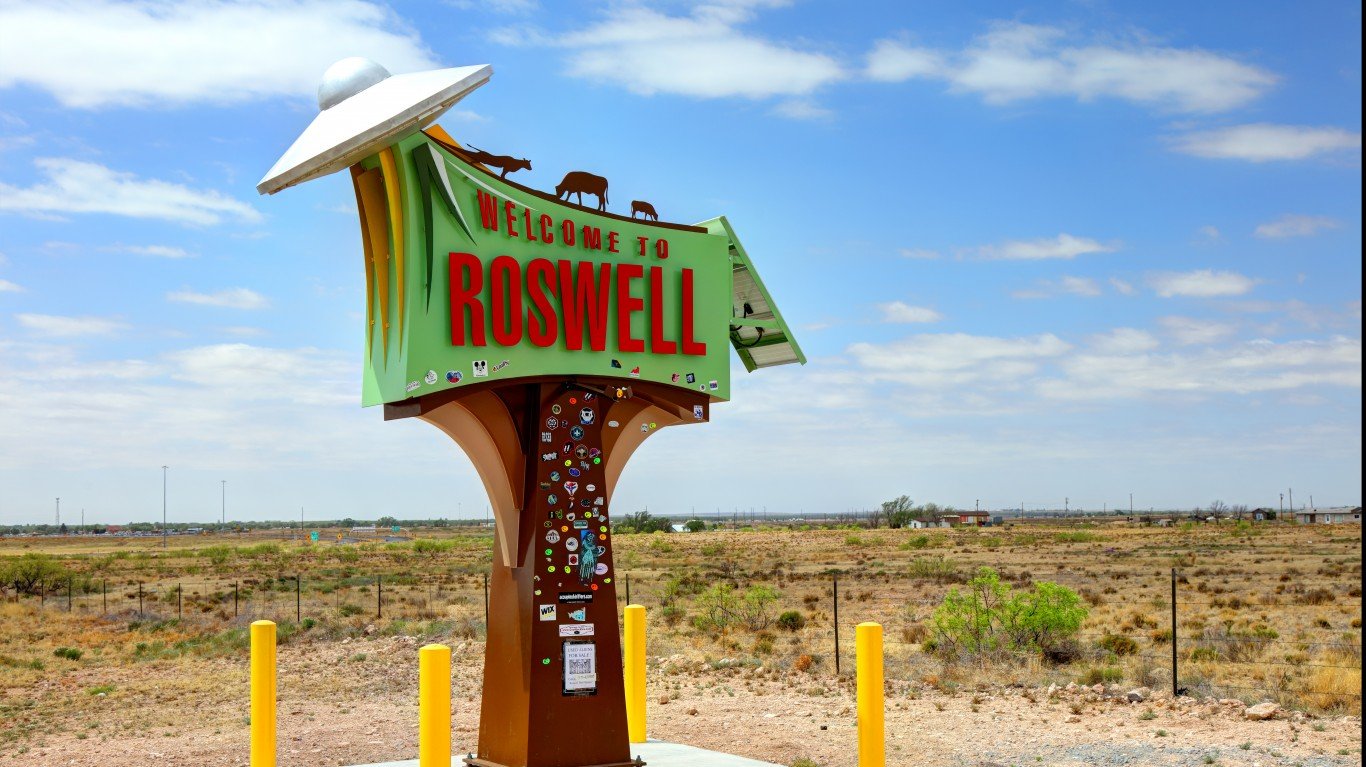
New Mexico: Roswell
> Households receiving SNAP benefits: 23.6% (New Mexico: 17.0%)
> Poverty rate: 20.7% (New Mexico: 18.6%)
> Median household income: $45,493 (New Mexico: $51,243)
> Unemployment rate: 5.5% (New Mexico: 6.5%)
> No. of cities considered in ranking: 11
[in-text-ad]
New York: Kiryas Joel
> Households receiving SNAP benefits: 46.6% (New York: 14.3%)
> Poverty rate: 41.3% (New York: 13.6%)
> Median household income: $35,437 (New York: $71,117)
> Unemployment rate: 3.5% (New York: 5.7%)
> No. of cities considered in ranking: 62
[recirclink id=1111559]

North Carolina: Goldsboro
> Households receiving SNAP benefits: 23.9% (North Carolina: 12.0%)
> Poverty rate: 24.3% (North Carolina: 14.0%)
> Median household income: $37,556 (North Carolina: $56,642)
> Unemployment rate: 9.4% (North Carolina: 5.3%)
> No. of cities considered in ranking: 37

North Dakota: Grand Forks
> Households receiving SNAP benefits: 8.3% (North Dakota: 6.6%)
> Poverty rate: 17.9% (North Dakota: 10.5%)
> Median household income: $50,194 (North Dakota: $65,315)
> Unemployment rate: 4.3% (North Dakota: 3.0%)
> No. of cities considered in ranking: 6
[in-text-ad-2]

Ohio: Youngstown
> Households receiving SNAP benefits: 34.5% (Ohio: 12.6%)
> Poverty rate: 34.9% (Ohio: 13.6%)
> Median household income: $30,129 (Ohio: $58,116)
> Unemployment rate: 13.6% (Ohio: 5.3%)
> No. of cities considered in ranking: 57

Oklahoma: Muskogee
> Households receiving SNAP benefits: 23.8% (Oklahoma: 12.6%)
> Poverty rate: 23.9% (Oklahoma: 15.3%)
> Median household income: $38,218 (Oklahoma: $53,840)
> Unemployment rate: 7.4% (Oklahoma: 5.0%)
> No. of cities considered in ranking: 16
[in-text-ad]

Oregon: Grants Pass
> Households receiving SNAP benefits: 26.8% (Oregon: 15.0%)
> Poverty rate: 15.9% (Oregon: 12.4%)
> Median household income: $46,580 (Oregon: $65,667)
> Unemployment rate: 5.9% (Oregon: 5.4%)
> No. of cities considered in ranking: 23
[recirclink id=1047662]
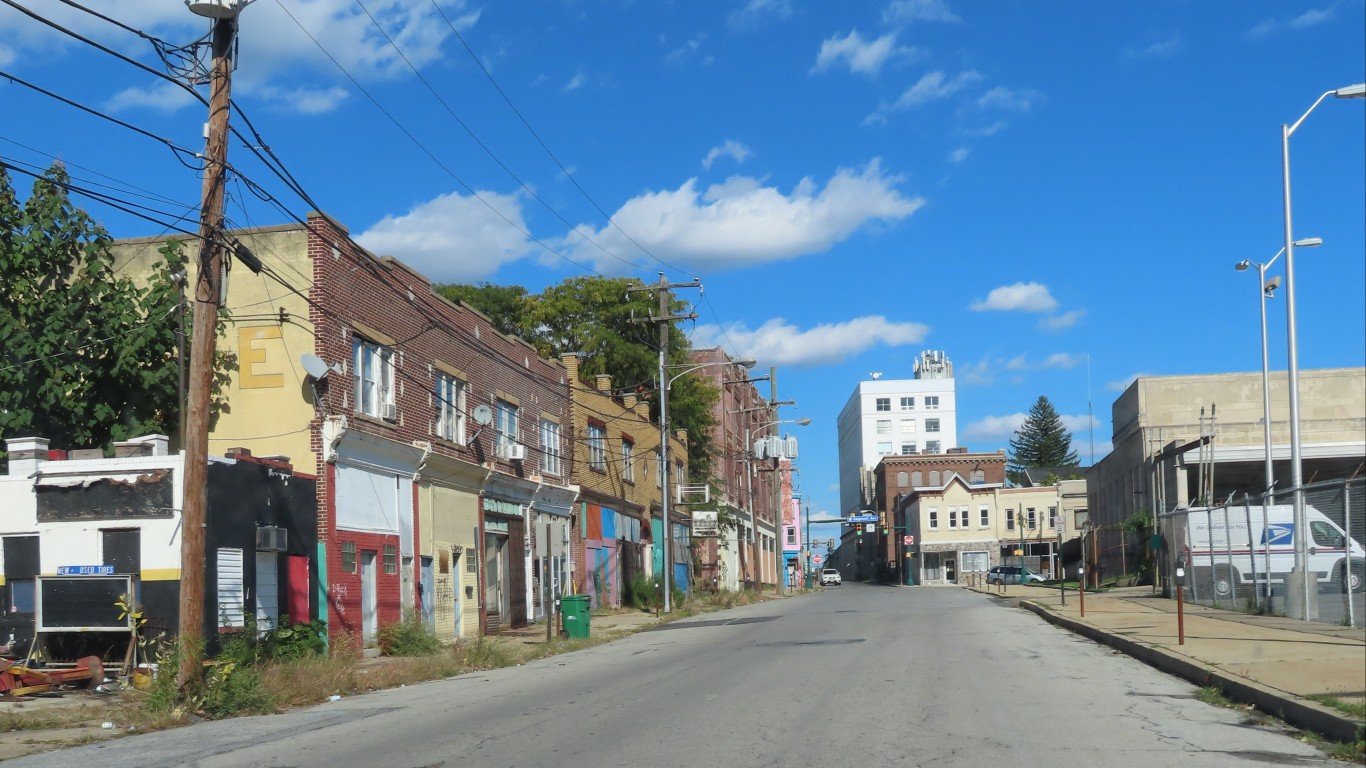
Pennsylvania: Chester
> Households receiving SNAP benefits: 41.4% (Pennsylvania: 13.1%)
> Poverty rate: 30.4% (Pennsylvania: 12.0%)
> Median household income: $32,867 (Pennsylvania: $63,627)
> Unemployment rate: 14.3% (Pennsylvania: 5.3%)
> No. of cities considered in ranking: 23

Rhode Island: Providence
> Households receiving SNAP benefits: 30.1% (Rhode Island: 14.8%)
> Poverty rate: 23.0% (Rhode Island: 11.6%)
> Median household income: $49,065 (Rhode Island: $70,305)
> Unemployment rate: 7.1% (Rhode Island: 5.5%)
> No. of cities considered in ranking: 6
[in-text-ad-2]

South Carolina: Anderson
> Households receiving SNAP benefits: 21.0% (South Carolina: 11.2%)
> Poverty rate: 22.9% (South Carolina: 14.7%)
> Median household income: $33,569 (South Carolina: $54,864)
> Unemployment rate: 7.6% (South Carolina: 5.5%)
> No. of cities considered in ranking: 18

South Dakota: Rapid City
> Households receiving SNAP benefits: 12.2% (South Dakota: 8.7%)
> Poverty rate: 16.2% (South Dakota: 12.8%)
> Median household income: $53,760 (South Dakota: $59,896)
> Unemployment rate: 4.4% (South Dakota: 3.5%)
> No. of cities considered in ranking: 3
[in-text-ad]

Tennessee: Morristown
> Households receiving SNAP benefits: 21.5% (Tennessee: 12.6%)
> Poverty rate: 27.0% (Tennessee: 14.6%)
> Median household income: $33,511 (Tennessee: $54,833)
> Unemployment rate: 9.0% (Tennessee: 5.3%)
> No. of cities considered in ranking: 25
[recirclink id=1104870]

Texas: Pharr
> Households receiving SNAP benefits: 33.1% (Texas: 11.5%)
> Poverty rate: 28.3% (Texas: 14.2%)
> Median household income: $40,513 (Texas: $63,826)
> Unemployment rate: 5.1% (Texas: 5.3%)
> No. of cities considered in ranking: 117

Utah: South Salt Lake
> Households receiving SNAP benefits: 13.4% (Utah: 6.2%)
> Poverty rate: 17.5% (Utah: 9.1%)
> Median household income: $49,616 (Utah: $74,197)
> Unemployment rate: 5.9% (Utah: 3.6%)
> No. of cities considered in ranking: 34
[in-text-ad-2]

Vermont: Burlington*
> Households receiving SNAP benefits: 11.4% (Vermont: 10.6%)
> Poverty rate: 25.0% (Vermont: 10.8%)
> Median household income: $55,461 (Vermont: $63,477)
> Unemployment rate: 4.2% (Vermont: 3.8%)
> No. of cities considered in ranking: 1
*Because Burlington is the only eligible city in Vermont, it is the city with the highest SNAP recipiency rate by default.
Virginia: Petersburg
> Households receiving SNAP benefits: 22.3% (Virginia: 7.9%)
> Poverty rate: 22.6% (Virginia: 10.0%)
> Median household income: $43,029 (Virginia: $76,398)
> Unemployment rate: 12.2% (Virginia: 4.5%)
> No. of cities considered in ranking: 40
[in-text-ad]

Washington: Longview
> Households receiving SNAP benefits: 25.4% (Washington: 11.1%)
> Poverty rate: 16.1% (Washington: 10.2%)
> Median household income: $48,028 (Washington: $77,006)
> Unemployment rate: 6.0% (Washington: 4.8%)
> No. of cities considered in ranking: 44
[recirclink id=1100321]

West Virginia: Parkersburg
> Households receiving SNAP benefits: 21.8% (West Virginia: 16.5%)
> Poverty rate: 22.1% (West Virginia: 17.1%)
> Median household income: $37,933 (West Virginia: $48,037)
> Unemployment rate: 7.2% (West Virginia: 6.5%)
> No. of cities considered in ranking: 5

Wisconsin: Racine
> Households receiving SNAP benefits: 25.7% (Wisconsin: 10.2%)
> Poverty rate: 20.7% (Wisconsin: 11.0%)
> Median household income: $44,346 (Wisconsin: $63,293)
> Unemployment rate: 5.5% (Wisconsin: 3.5%)
> No. of cities considered in ranking: 34
[in-text-ad-2]
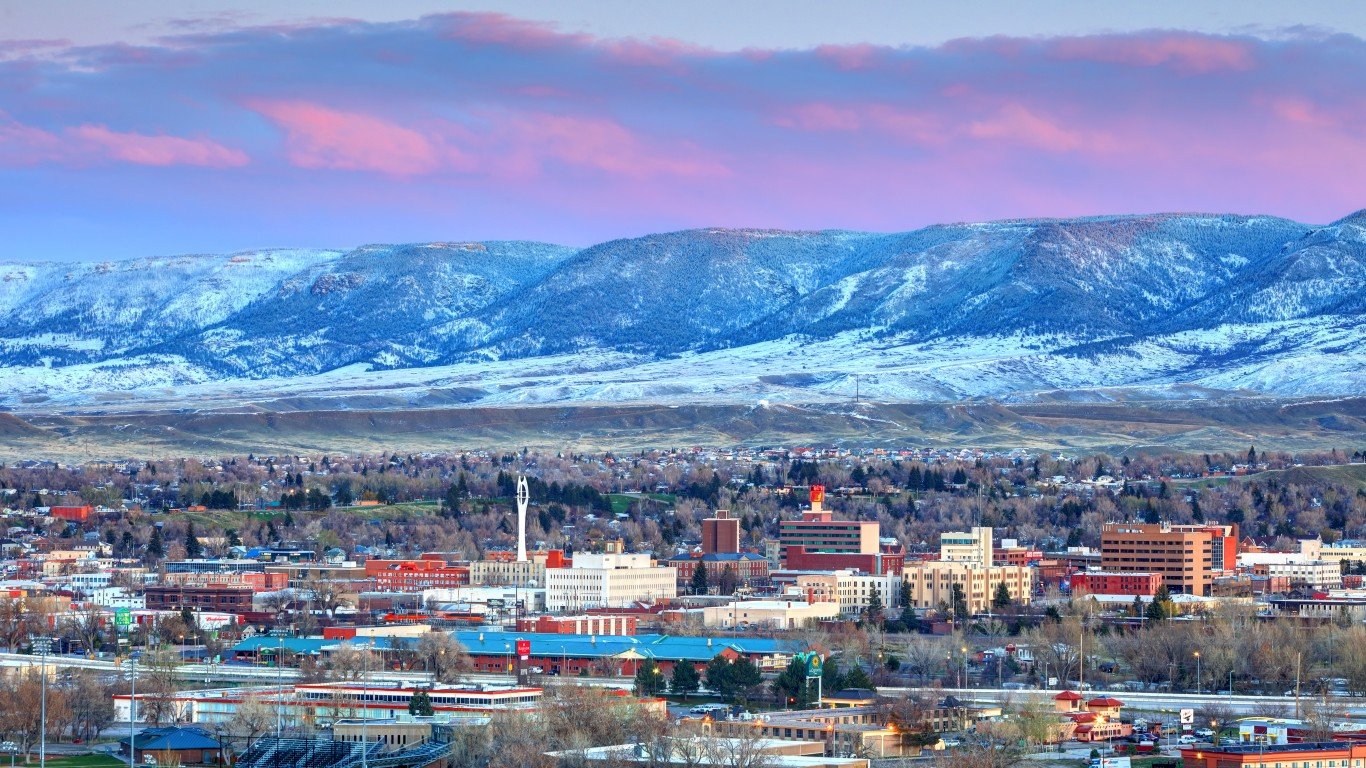
Wyoming: Casper
> Households receiving SNAP benefits: 7.0% (Wyoming: 5.3%)
> Poverty rate: 10.5% (Wyoming: 10.8%)
> Median household income: $59,412 (Wyoming: $65,304)
> Unemployment rate: 4.0% (Wyoming: 4.3%)
> No. of cities considered in ranking: 4
Methodology
To determine the city with the highest SNAP recipiency rate in every state, 24/7 Wall St. reviewed five-year estimates of the share of households that received SNAP benefits in the 12 months prior to the survey from the U.S. Census Bureau’s 2020 American Community Survey.
We used Census “place” geographies — a category that includes incorporated legal entities and Census-designated statistical entities. We defined cities based on a population threshold – Census places needed to have a population of at least 25,000 to be considered.
Cities were excluded if the SNAP recipiency rate was not available in the 2020 ACS, if there were fewer than 500 households, or if the sampling error associated with a city’s data was deemed too high.
The sampling error was defined as too high if the coefficient of variation — a statistical assessment of how reliable an estimate is — for a city’s SNAP recipiency rate was above 15% and greater than two standard deviations above the mean CV for all cities’ SNAP recipiency rates. We similarly excluded cities that had a sampling error too high for their population, using the same definition.
Cities were ranked based on the share of households that received SNAP benefits in the past 12 months. To break ties, we used the number of households that received SNAP benefits in the past 12 months.
Additional information on poverty rate, median household income, and unemployment rate are also five-year estimates from the 2020 ACS. Because the Census Bureau didn’t release one-year estimates for 2020 due to data collection issues caused by the COVID-19 pandemic, all ACS data are five-year estimates.
Contact [email protected] for any questions or corrections.