
The unemployment rate is perhaps the most frequently cited economic indicator in the United States. It measures the share of workers in the labor force who are jobless and looking for work, and it typically tracks closely with the economy’s overall strength. However, the unemployment rate does not provide a complete snapshot of the U.S. labor market — and can even be misleading.
[in-text-ad]
For example, some workers have been unemployed for so long that they become discouraged and give up looking work. Such workers are not factored in to the unemployment rate. Similarly, workers who want a full-time job but are only able to find a part-time position are also not considered unemployed. The unemployment rate is therefore often criticized for expressing an unrealistically rosey economic picture.
The underemployment rate, however, takes all these scenarios into account and provides a more comprehensive assessment of the American labor market.
As of May 2018, the U.S. unemployment was 3.8%, the lowest it has been in nearly two decades. Meanwhile, the underemployment rate as of the end of the first quarter stands at 8.3%, more than double the unemployment rate. Partially because state economies are expanding and contracting at varying rates, underemployment also varies considerably from state to state.
24/7 Wall St. reviewed the underemployment rate in each state to identify the states where it is hardest to find full-time work. States are ranked by underemployment rate from lowest to highest.
Click here to see the states where it is hardest to find full-time work.
Click here to see our detailed findings and methodology.
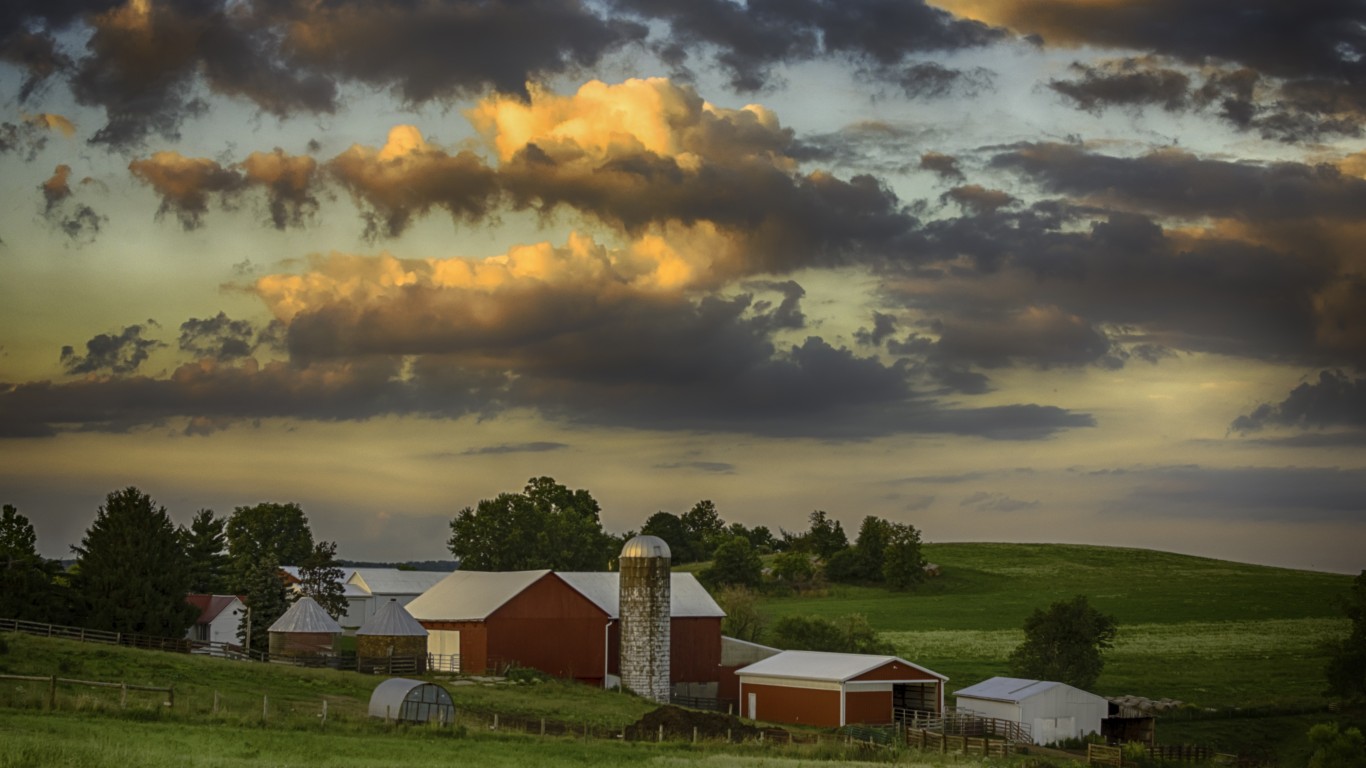
50. North Dakota
> Underemployment rate: 5.1%
> May unemployment: 2.6% (2nd lowest)
> 5-yr. employment growth: +5.8% (25th highest)
> Average annual wage: $50,313 (21st highest)
Full-time work is easier to find in North Dakota than in any other state. The state’s unemployment rate of 2.6% is second lowest in the country and the underemployment rate of 5.1% is the lowest. In comparison, 8.3% of the U.S. workforce are similarly underemployed.
The availability of full-time work in the state is largely the result of the energy boom North Dakota has enjoyed spurred by new drilling techniques used in the state’s Bakken shale region. The state produced over 380 million barrels of crude oil in 2016, nearly 10 times 2006’s production. Between 2010 and 2017, the state reported one the largest population growth rates, largely due to jobs created by resource extraction. Currently, oil and gas extraction is the largest contributor to economic growth in North Dakota.
[in-text-ad]

49. Hawaii
> Underemployment rate: 5.7%
> May unemployment: 2.0% (the lowest)
> 5-yr. employment growth: +10.1% (12th highest)
> Average annual wage: $49,679 (23rd highest)
As the U.S. economy has improved since the end of the Great Recession, underemployment has fallen considerably in Hawaii. As recently as 2011, 16.0% of the labor force in Hawaii were underemployed. Since then, the share of out of work, discouraged, or marginally attached workers has fallen every year to a low of 5.7% as of the end of the first quarter of 2018.
In addition to having the nation’s second lowest underemployment rate, Hawaii has the lowest unemployment rate at just 2.0%, well below the May U.S. unemployment rate of 3.8%. Contributing to the improved unemployment and underemployment is Hawaii’s rapid overall employment growth. Total employment climbed 10.1% in Hawaii over the last five years, well above the U.S. employment growth rate of 7.6% over that time.

48. Iowa
> Underemployment rate: 5.8%
> May unemployment: 2.7% (4th lowest)
> 5-yr. employment growth: +3.7% (17th lowest)
> Average annual wage: $46,073 (15th lowest)
Iowa is one of only three states where less than 6% of the workforce is underemployed. The health care and social assistance, manufacturing, and retail trade sectors employed the largest share of workers in the state, accounting for 14.5%, 14.0%, and 11.8% of all jobs, respectively.
The state’s strong employment figures are due in part to a diminishing workforce. The number of adults working or looking for work in the state fell by 1.1% in the last year, even as the total U.S. workforce grew by 0.7%.

47. Colorado (tied)
> Underemployment rate: 6.1%
> May unemployment: 2.8% (9th lowest)
> 5-yr. employment growth: +12.9% (3rd highest)
> Average annual wage: $56,916 (9th highest)
Few states are adding jobs as rapidly as Colorado. Total employment jumped 12.9% in the last half-decade, the third fastest employment growth among states after only Utah and Nevada. In the last year alone, total employment in Colorado climbed by 3.6%, the second highest increase of any state and more than double national employment growth of 1.3% over the same period. Job growth is closely tied to economic growth, and Colorado’s GDP grew 3.6% last year, second highest among states. The real estate, rental, and leasing industry was one of the largest drivers of economic growth in the state last year.

46. Minnesota (tied)
> Underemployment rate: 6.1%
> May unemployment: 3.1% (12th lowest)
> 5-yr. employment growth: +6.0% (23rd highest)
> Average annual wage: $56,131 (11th highest)
Just 6.1% of Minnesota’s workforce is underemployed to some degree, one of the smallest shares among states. Home to the Mayo Clinic, Minnesota’s largest sector by employment is health care and social assistance, which accounts for 17.1% of all jobs.
A healthy job market has positive ripple effects on other socioeconomic measures. For example, most Americans with health insurance are insured through their employer, and in Minnesota just 4.1% of residents are uninsured, one of the smallest shares among states and less than half the U.S. uninsured rate of 8.6%. High employment also reduces the likelihood of widespread serious financial hardship, and Minnesota is one of only six states where fewer than one in 10 residents live below the poverty line.
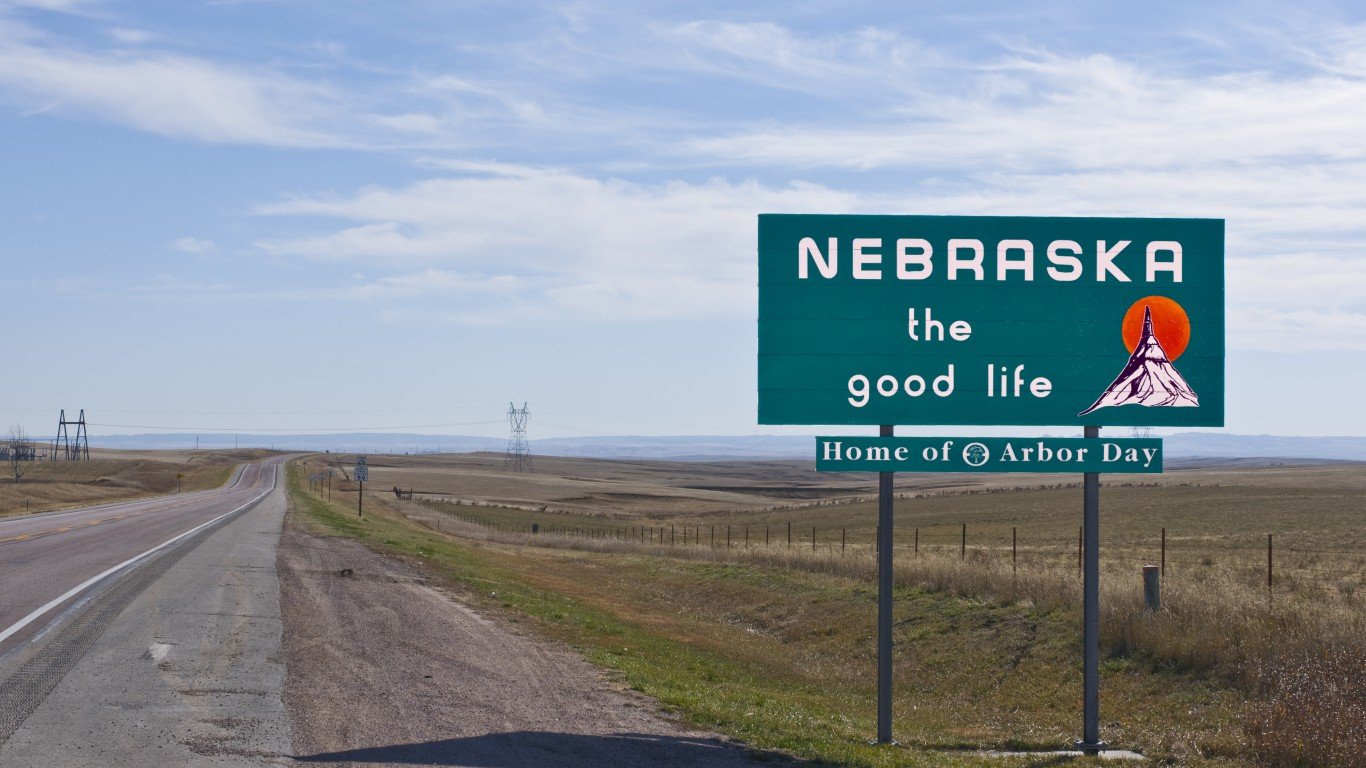
45. Nebraska (tied)
> Underemployment rate: 6.1%
> May unemployment: 2.8% (9th lowest)
> 5-yr. employment growth: +0.8% (6th lowest)
> Average annual wage: $44,851 (10th lowest)
Nebraska is one of several Midwestern states with a relatively healthy job market. Just 6.1% of workers in the state are underemployed. For reference, 8.3% of American workers are similarly underemployed. Employment in the state remains high despite relatively weak growth in recent years. Total employment slipped 0.3% in Nebraska last year, but this likely had little effect on the state’s unemployment rate as the state’s labor force shrank at a similar rate over the same period. Still, over the last half decade, employment in Nebraska climbed by just 0.8%, well below the 7.6% national growth rate over that time.
[in-text-ad]

44. Wisconsin
> Underemployment rate: 6.2%
> May unemployment: 2.8% (9th lowest)
> 5-yr. employment growth: +6.1% (22nd highest)
> Average annual wage: $47,239 (21st lowest)
Just 6.2% of the workforce in Wisconsin are unemployed or underemployed, the sixth smallest share among states. As is the case in many states with a strong job market, labor force participation is relatively high in Wisconsin. Some 66.1% of working-age state residents are working or looking for work compared to 60.1% of the working-age U.S. population.
Most Americans get their health insurance through work, and the low underemployment in Wisconsin helps reduce the share of residents without insurance coverage. Just 5.3% of Wisconsin residents lack health insurance, one of the smallest shares of any state and well below the 8.6% national uninsured rate.

43. New Hampshire (tied)
> Underemployment rate: 6.3%
> May unemployment: 2.7% (4th lowest)
> 5-yr. employment growth: +3.9% (20th lowest)
> Average annual wage: $55,133 (14th highest)
New Hampshire is tied with Vermont for the lowest underemployment rate among New England states. Just 6.3% of the state’s labor force are unemployed, discouraged from looking for work, or forced to take a part time or temporary job. The strong job market partially explains the relative lack of serious financial hardship in the state. Just 7.3% of New Hampshire residents live in poverty, the lowest poverty rate of any state in the country. The retail trade sector provides the most jobs in the state, accounting for 14.8% of total employment, followed by the health care and social assistance sector and manufacturing, which employ 14.7% and 10.6% of the state’s labor force, respectively
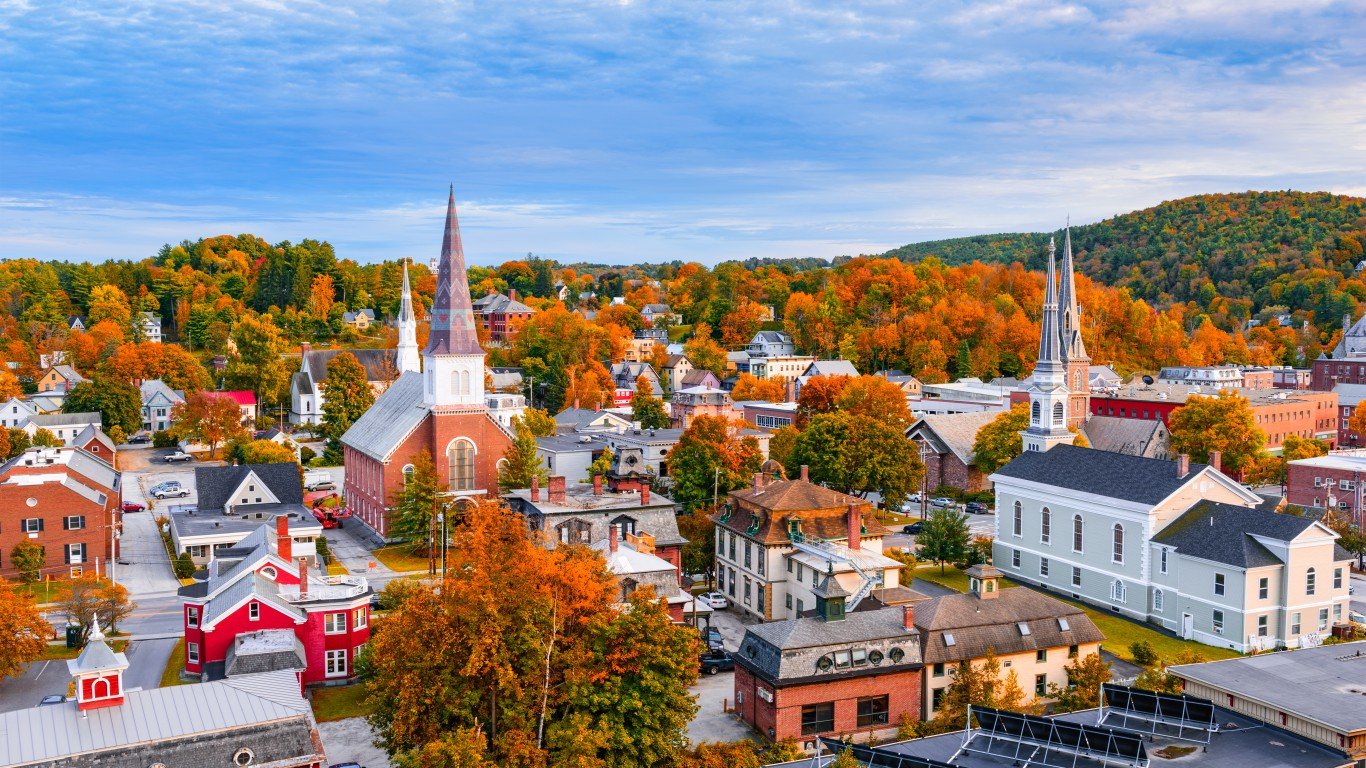
42. Vermont (tied)
> Underemployment rate: 6.3%
> May unemployment: 2.8% (9th lowest)
> 5-yr. employment growth: -1.1% (3rd lowest)
> Average annual wage: $46,121 (16th lowest)
Vermont has struggled with some of the weakest job growth in the country in recent years. Total employment fell by 1.1% over the last half decade, even as U.S. employment climbed 7.6% over the same period. The wholesale trade, utilities, and construction industries detracted most from overall GDP growth in the state last year, contributing to slower than average 1.1% economic expansion across the state.
Despite some weak economic indicators, Vermont’s job market remains among the healthiest in the country. Just 6.3% of the state’s labor force is unemployed, underemployed, or discouraged from looking for work, well below the 8.3% national underemployment rate.
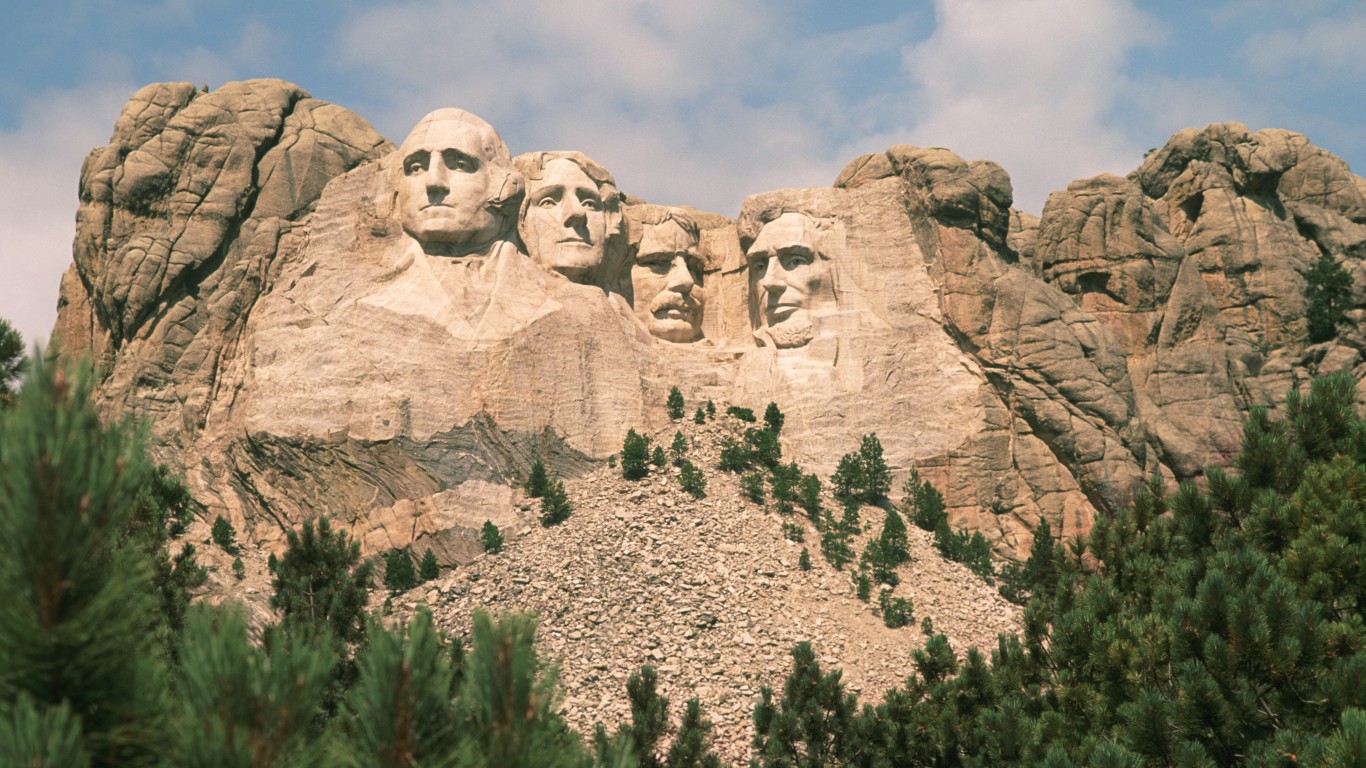
41. South Dakota
> Underemployment rate: 6.4%
> May unemployment: 3.3% (15th lowest)
> 5-yr. employment growth: +4.0% (21st lowest)
> Average annual wage: $42,424 (4th lowest)
Some 66.9% of South Dakota’s working-age residents work or are actively looking for work, the third highest labor force participation rate among states and well above the nationwide rate of 60.1%. The accomodation and food service industry is a major employer in the state, providing some 40,600 jobs, or about 10% of total employment. South Dakota is home to several national parks, monuments, and memorials — including Mount Rushmore — as well as Sturgis, a mecca for motorcyclists. The 13.9 million visitors to the state in 2017 spent a total of $3.9 billion.
40. Utah
> Underemployment rate: 6.5%
> May unemployment: 3.0% (11th lowest)
> 5-yr. employment growth: +16.5% (the highest)
> Average annual wage: $46,572 (20th lowest)
Utah’s economy outperformed that of nearly every other state by several measures in recent years. Employment grew by 16.5% in the last half decade, the largest five-year improvement of all states and more than double the U.S. job growth of 7.6% over that time. Additionally, Utah’s economy expanded by 3.1% last year, outpacing the 2.1% U.S. GDP growth.
Due in part to rapid growth, just 6.5% of workers in Utah are unemployed or underemployed, well below the 8.3% of unemployed or underemployed workers nationwide. Underemployment remains low in the state despite rapidly climbing demand for jobs. Utah’s labor force grew by 3.4% last year, the largest increase of any state.
[in-text-ad]

39. Kansas
> Underemployment rate: 6.7%
> May unemployment: 3.4% (16th lowest)
> 5-yr. employment growth: +1.9% (8th lowest)
> Average annual wage: $45,117 (11th lowest)
Kansas’s 3.9% annual unemployment rate is half a percentage point below the comparable 2017 U.S. unemployment rate of 4.4%. However, including those who are forced to take part-time work due to a lack of job availability and those discouraged from looking for work or otherwise marginally attached, the state’s job market looks even better than that of the U.S. as a whole. Just 6.7% of Kansas’s labor force is underemployed compared to 8.3% of the U.S. labor force.
The state’s health care and social assistance, manufacturing, and retail trade sectors provide the most jobs, accounting for 14.8%, 11.8%, and 10.8% of total employment, respectively.
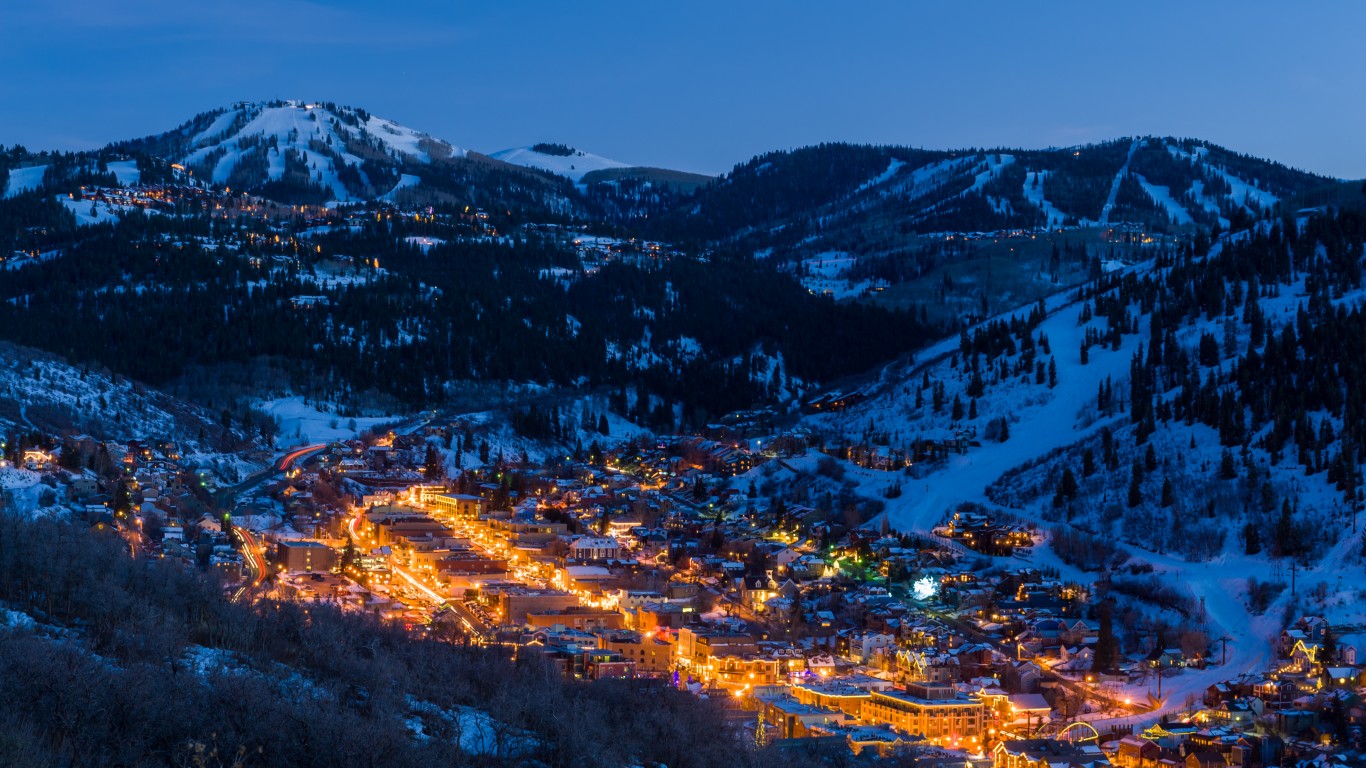
38. Idaho (tied)
> Underemployment rate: 6.8%
> May unemployment: 2.9% (10th lowest)
> 5-yr. employment growth: +11.8% (6th highest)
> Average annual wage: $41,330 (2nd lowest)
Idaho has one of the fastest growing economies in the United States. The state’s 2.7% GDP growth last year topped that of all but six other states as well as the overall 2.1% growth nationwide. Both the durable and nondurable goods manufacturing sectors drove economic expansion in the state and also helped fuel job growth. Overall employment climbed 2.7% last year, more than double the U.S. job growth rate of 1.3% over that time.
Due in part to strong employment growth, just 6.8% of the Idaho’s labor force is unemployed, underemployed, or marginally attached, compared to 8.3% of the U.S. labor force.
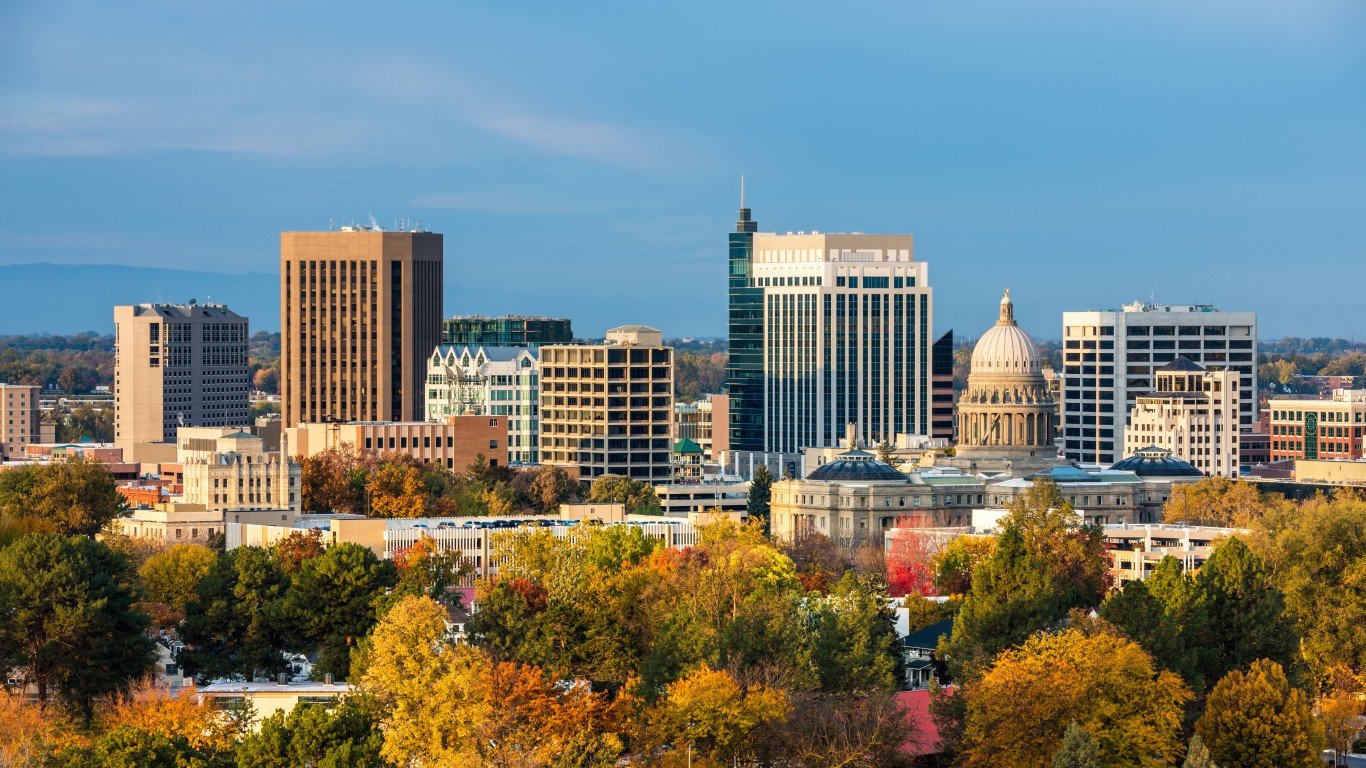
37. Indiana (tied)
> Underemployment rate: 6.8%
> May unemployment: 3.2% (14th lowest)
> 5-yr. employment growth: +9.5% (14th highest)
> Average annual wage: $46,190 (17th lowest)
Indiana’s underemployment rate reached a post-recession peak of 18.1% at the end of the first quarter of 2010, well above the U.S. rate of 16.7% at the time. Since then, the state’s job market has improved considerably. Just 6.8% of workers are now underemployed, a smaller share than the comparable 8.3% of workers nationwide.
Indiana’s economy is heavily dependent on the manufacturing sector. The state is home to a number of manufacturing operations, including a Toyota plant in Princeton and a Cummins Inc. automotive parts plant in Columbus. Manufacturing employs more people than any other industry in the state, at about 17.6% of the workforce, and the industry drove Indiana’s GDP growth last year.
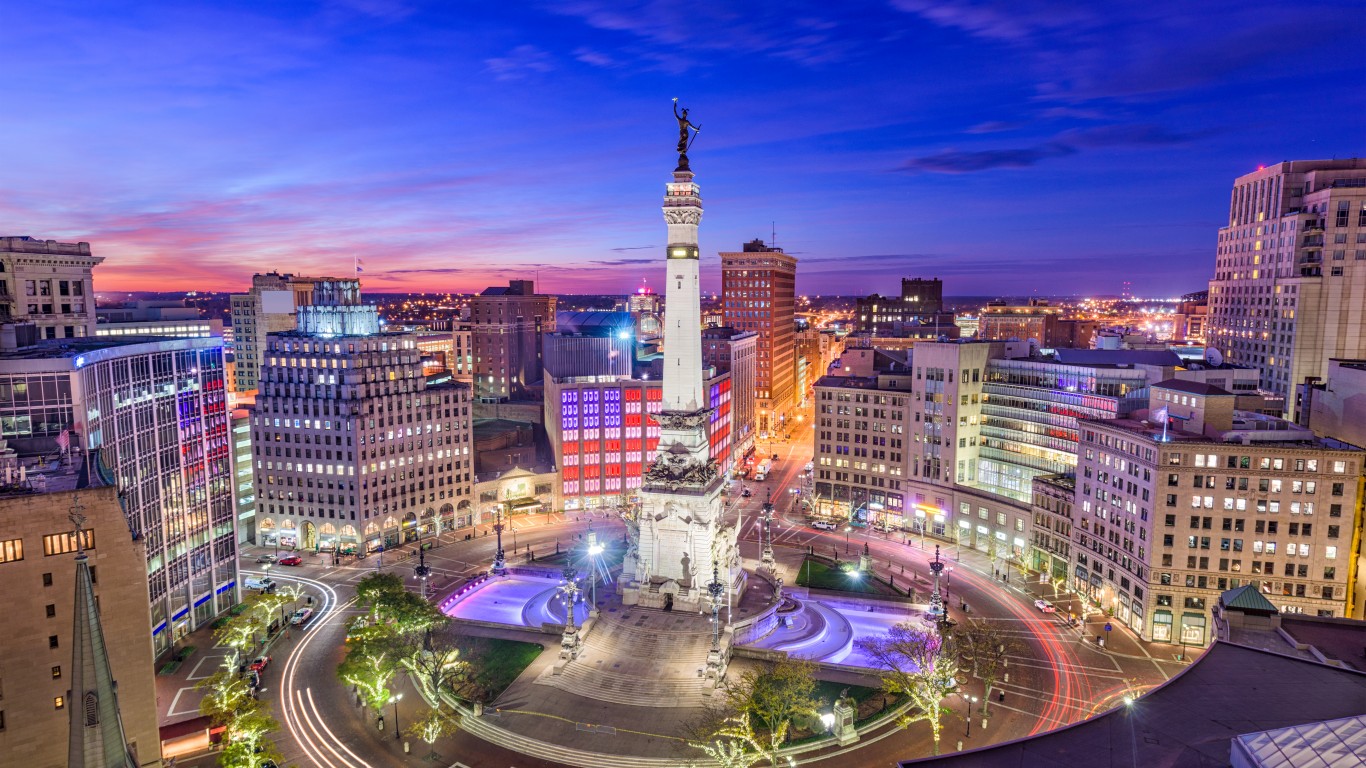
36. Missouri
> Underemployment rate: 7.1%
> May unemployment: 3.6% (19th lowest)
> 5-yr. employment growth: +4.3% (22nd lowest)
> Average annual wage: $47,354 (22nd lowest)
Missouri’s annual unemployment rate fell from 4.4% in 2016 to 4.1% in 2017. The decline in the state’s unemployment rate is not due to job creation but rather a lower labor force participation. Overall employment in the state fell by 0.7% last year as the state’s labor force shrank by 0.9%.
Still, Missouri’s job market is faring better than most. Just 7.1% of Missouri’s workforce are underemployed to some degree, a smaller share than the 8.3% of American workers nationwide. The state’s health care and social assistance, retail trade, and manufacturing sectors provide the most jobs, accounting for 16.6%, 11.3%, and 9.6% of total employment, respectively.

35. Maine
> Underemployment rate: 7.2%
> May unemployment: 2.8% (9th lowest)
> 5-yr. employment growth: +4.3% (23rd lowest)
> Average annual wage: $43,906 (8th lowest)
By several measures, Maine’s job market is improving faster than that of any other New England state. For example, total employment in Maine climbed by 2.8% last year, more than in any other state in the region. At the same time, Maine’s labor force expanded by 2.3% — also the fastest of any New England state. The industries contributing most to economic growth in Maine last year were health care and social assistance, retail trade, and finance and insurance.
Currently, 7.2% of Maine’s labor force are underemployed to some degree, below the 8.3% share of workers nationwide, and it ranks among the top half of New England states.
[in-text-ad]
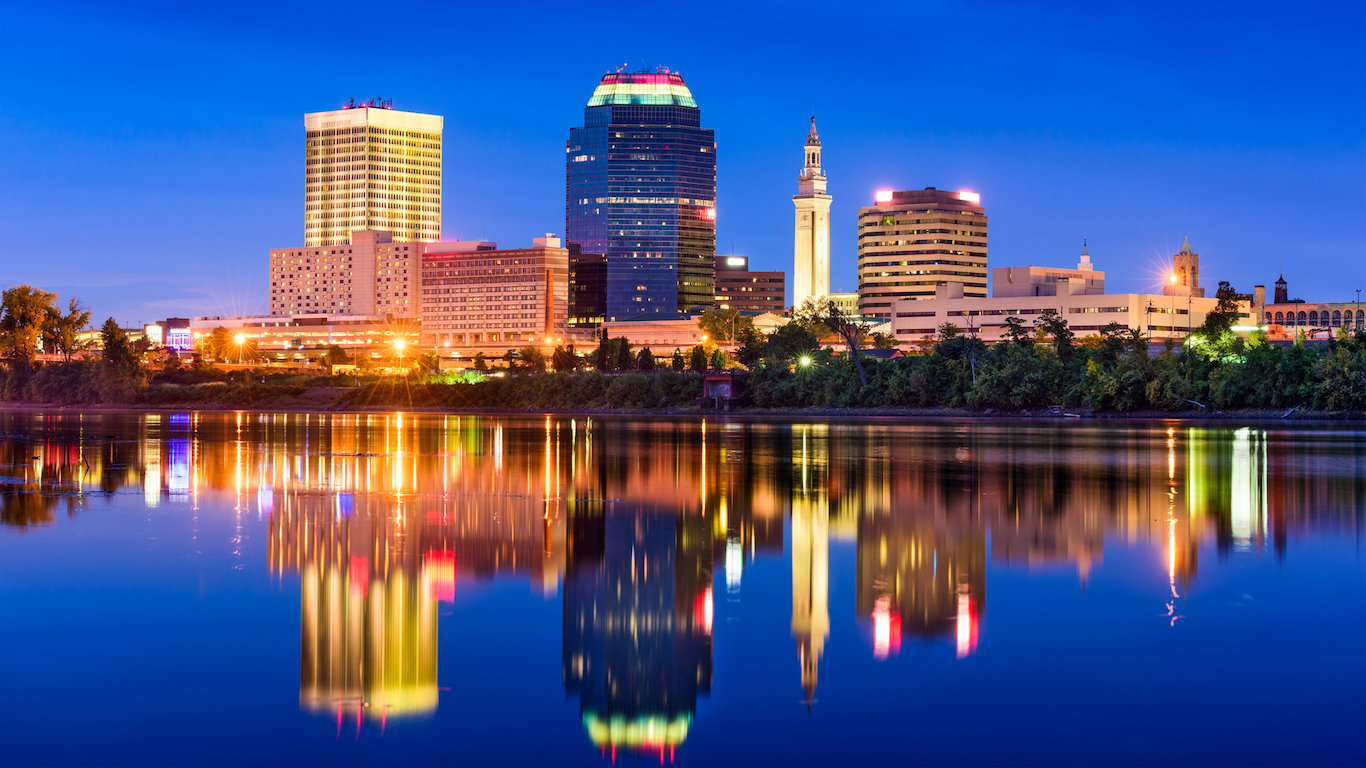
34. Massachusetts
> Underemployment rate: 7.4%
> May unemployment: 3.5% (18th lowest)
> 5-yr. employment growth: +8.2% (18th highest)
> Average annual wage: $69,942 (2nd highest)
Some 42.7% of adults in Massachusetts have a bachelor’s degree or higher, the largest share of any state and well above the 31.3% of adults nationwide. With the best educated labor force in the country, Massachusetts is an attractive place for employers. Due to a range of factors — not the least of which were lucrative tax incentives — industrial conglomerate General Electric moved its headquarters from Fairfield, Connecticut, to Boston in 2016 in a highly publicized shift.
Total employment grew by 8.2% in Massachusetts in the last five years, faster than most states and the 7.6% U.S. employment growth. Currently, 7.4% of workers in the state are underemployed to some degree, a smaller share than the 8.3% of workers nationwide.

33. Arkansas (tied)
> Underemployment rate: 7.5%
> May unemployment: 3.8% (22nd lowest)
> 5-yr. employment growth: +3.1% (14th lowest)
> Average annual wage: $42,955 (5th lowest)
After declining every year since 2012, Arkansas’s underemployment rate climbed slightly in the year ending with the first quarter of 2018. Underemployment in Arkansas fell from 14.2% in 2012 to 7.2% in 2017 and now stands at 7.5%, still below the U.S. rate of 8.3%.
Economic growth has been relatively slow in the state in recent years. Total employment climbed by just 3.1% in the last five years, less than half the U.S. employment growth of 7.3% over that time. Additionally, Arkansas’s economy grew by just 1.1% last year compared to the 2.1% U.S. GDP growth. Resource extraction and government sectors were a drag on overall economic growth in the state.

32. Oklahoma (tied)
> Underemployment rate: 7.5%
> May unemployment: 4.0% (24th highest)
> 5-yr. employment growth: +2.8% (9th lowest)
> Average annual wage: $45,124 (13th lowest)
Historically, underemployment has been less of a problem in Oklahoma than in most states. Based on annual rates from the second quarter through the first quarter of the following year, post-recession underemployment peaked in the United States at 16.7% in 2010. It peaked in Oklahoma at a much lower 11.1% rate the same year. Since then, underemployment improved considerably nationwide, and today Oklahoma’s 7.5% underemployment rate remains below the 8.3% national rate. The gap, however, has closed considerably.
The lower underemployment in Oklahoma is partially the result of low labor force participation. Just 58.2% of Oklahoma’s working-age population either work or actively look for work, a smaller share than in most states and the 60.1% U.S. labor force participation rate.

31. South Carolina (tied)
> Underemployment rate: 7.6%
> May unemployment: 4.0% (24th highest)
> 5-yr. employment growth: +11.8% (7th highest)
> Average annual wage: $44,238 (9th lowest)
Economic growth has been strong in South Carolina in recent years. Over the last half decade, employment in the state expanded by 11.8%, more than all but half a dozen other states and well above the national employment growth of 7.6% over that time. Rapid job creation has helped improve unemployment and underemployment. South Carolina’s underemployment rate was among the highest in the nation at 19.7% a recently as 2010, and higher than the national underemployment rate of 16.7% that year. Since that post-recession peak, underemployment has fallen considerably in the state, now standing at 7.6% — lower than the national underemployment rate of 8.3%.
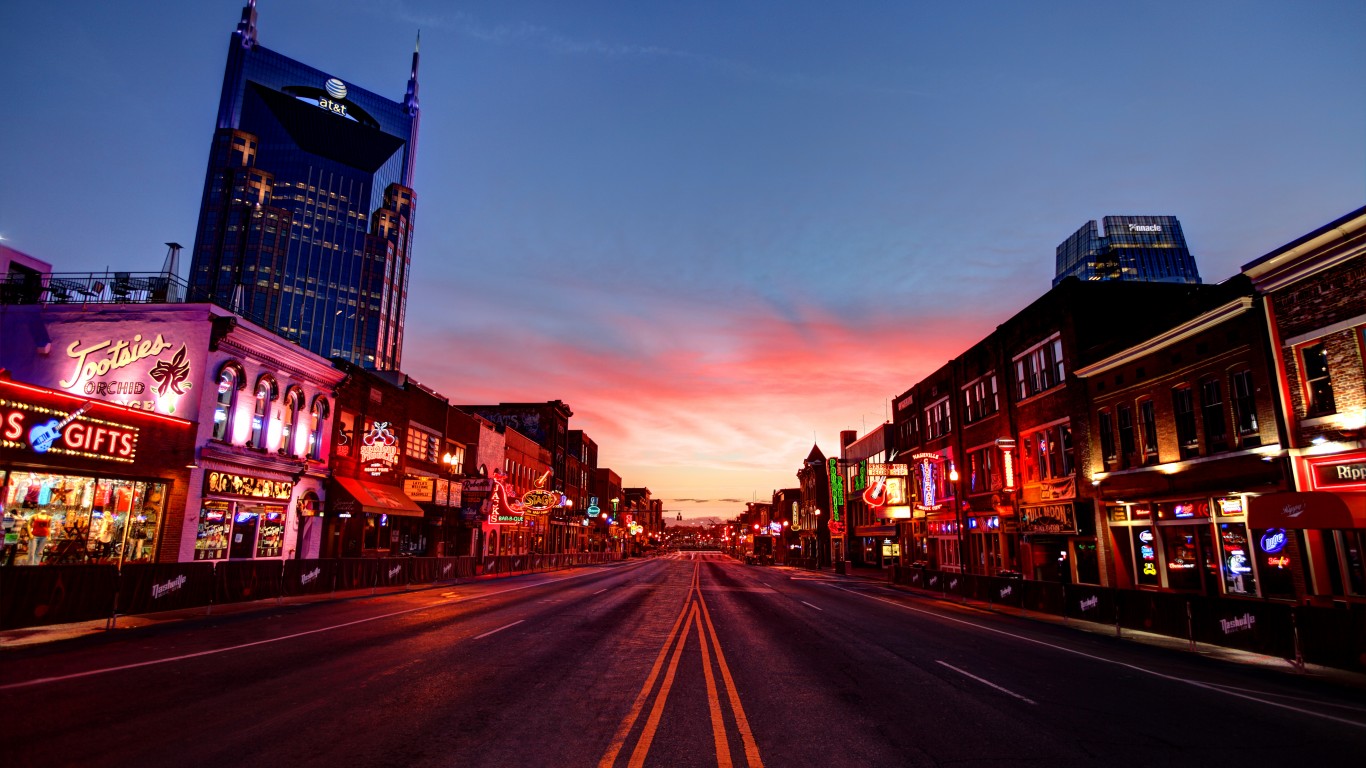
30. Tennessee (tied)
> Underemployment rate: 7.6%
> May unemployment: 3.5% (18th lowest)
> 5-yr. employment growth: +5.9% (24th highest)
> Average annual wage: $48,814 (25th lowest)
Tennessee has one of the fastest growing work forces in the country. The number of workers in the state increased by 2.7% last year, far outpacing the 0.7% U.S. labor force uptick. Job growth is keeping pace with labor force growth as total employment climbed 2.9% in Tennessee last year. This resulted in a decline in the unemployment rate from 4.8% to 4.5%. Underemployment — which includes the unemployed — also fell from 9.5% to 7.6% over roughly the same period.
Tennessee’s health care and social assistance sector employs the most people in the state, followed by manufacturing and retail trade.
[in-text-ad]

29. Virginia (tied)
> Underemployment rate: 7.6%
> May unemployment: 3.2% (14th lowest)
> 5-yr. employment growth: +3.7% (16th lowest)
> Average annual wage: $56,506 (10th highest)
Some 7.6% of workers in Virginia are underemployed to some degree, including some 173,000 who are unemployed. A considerable share of underemployed workers (3.2%) are employed in part-time positions because they could not secure a full-time job. With one of the best educated workforces in the country, competition for more advanced full-time positions in the state may be tight. Some 38.1% of adults in Virginia have a bachelor’s degree or higher, well above the 31.3% national share.
The largest industries by total employment in the state are health care and social services and professional and technical services.
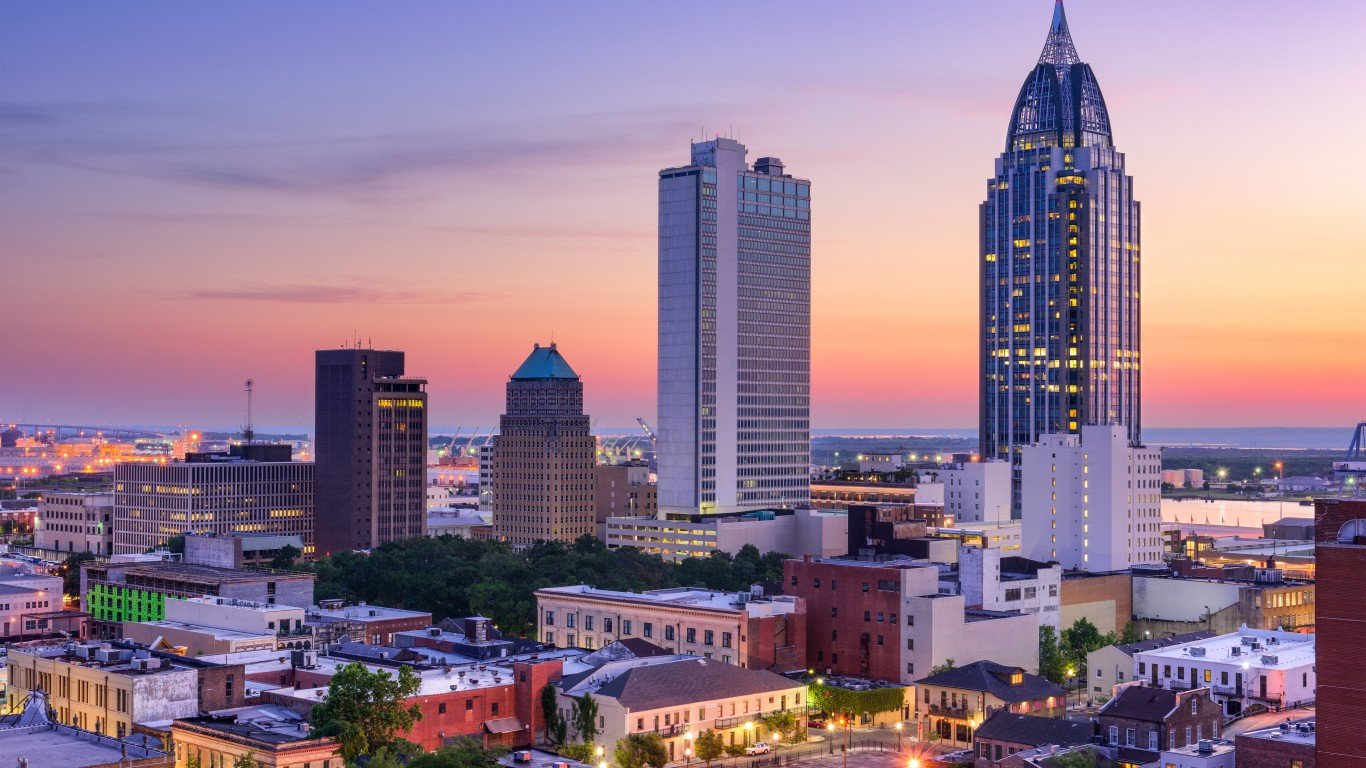
28. Alabama (tied)
> Underemployment rate: 7.7%
> May unemployment: 3.9% (24th lowest)
> 5-yr. employment growth: +3.0% (12th lowest)
> Average annual wage: $45,995 (14th lowest)
The 1.1% overall employment growth in Alabama over the last year was nearly double the state’s labor force growth over the same period. Over roughly the same time period, the state’s underemployment rate fell from 9.9%, worse than the nationwide rate of 9.5% that year, to 7.7%, which is below the 8.3% U.S. rate. The state’s mining, quarrying, and gas extraction sector, as well as health care and social assistance contributed the most to economic growth in 2017.
Alabama also has a sizeable manufacturing sector. Some 263,500 people in the state, or about 13.6% of the workforce, hold manufacturing jobs. Automotive plants in the state, including those run by Honda, Mercedez, and Toyota, rolled over 1 million new vehicles off assembly lines in 2017.

27. North Carolina (tied)
> Underemployment rate: 7.7%
> May unemployment: 4.3% (15th highest)
> 5-yr. employment growth: +10.8% (8th highest)
> Average annual wage: $48,919 (25th highest)
Overall employment climbed 10.8% in North Carolina over the last half decade, faster than in most states and the 7.6% national employment growth over that time. The rapid job growth has had a meaningful impact on the state’s workforce, as underemployment fell from a quarter one post-recession peak of 17.6% in 2012 to a its current post-recession low of 7.7%.
About one in every 10 workers in North Carolina are employed in the growing manufacturing sector. North Carolina is home to a number of chemical and plastics manufacturers, including Georgia Pacific, BASF, and DowDuPont. Chemical manufacturing is the manufacturing industry’s largest subsector in the state.

26. Texas
> Underemployment rate: 7.8%
> May unemployment: 4.1% (21st highest)
> 5-yr. employment growth: +9.5% (15th highest)
> Average annual wage: $55,801 (13th highest)
The largest energy producer in the country, Texas is home to over a third of the nation’s proved crude oil reserves. Mining, quarrying, and natural gas extraction contributed more to economic growth in the state over the last year than any other industry. Over the same period, employment climbed by 1.6%, slightly faster than 1.3% national employment growth.
Still, employment growth was not enough to keep up with demand for jobs. Over the same period, Texas’s labor force grew by 2.0%, which helped drive annual unemployment up in the state from 4.5% to 4.8%. Still, the state’s 7.8% underemployment rate, which includes the unemployed, remains below the 8.3% national underemployment rate.
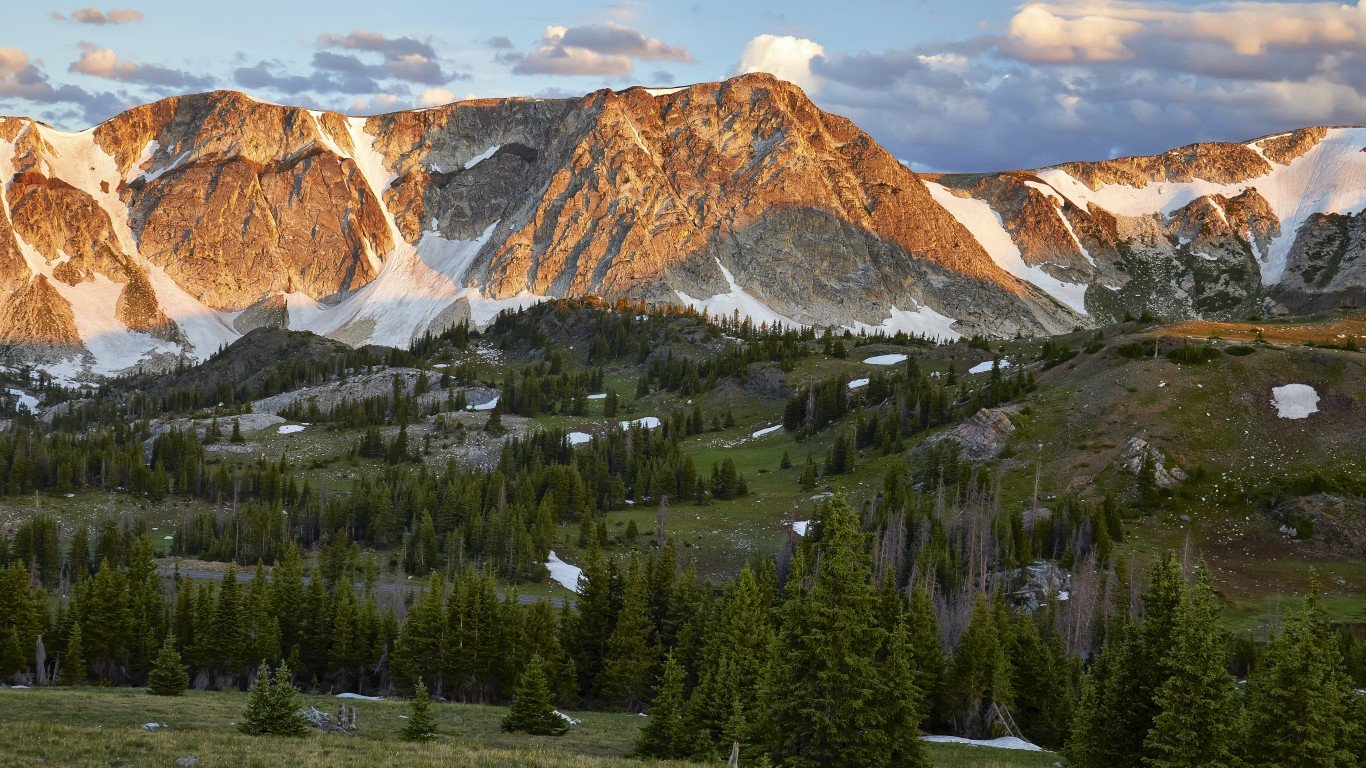
25. Wyoming
> Underemployment rate: 7.9%
> May unemployment: 3.7% (20th lowest)
> 5-yr. employment growth: -3.1% (the lowest)
> Average annual wage: $46,250 (18th lowest)
No state lost jobs faster than Wyoming in recent years. Overall employment fell by 3.1% over the last half decade in the state, even as employment climbed 7.6% nationwide over the same period. Last year alone, employment in the state fell by 2.2%. Still, employment declines were offset by even steeper declines in the labor force. Partially as a result, unemployment fell in Wyoming from 5.1% in 2016 to 4.7% in 2017.
Annual underemployment in the state, which includes the unemployed, fell for the first time in three years, from 9.7% in the first quarter 2017 to 7.9% in 2018. Nationwide, underemployment fell from 9.5% to 8.3% over the same period.
[in-text-ad]
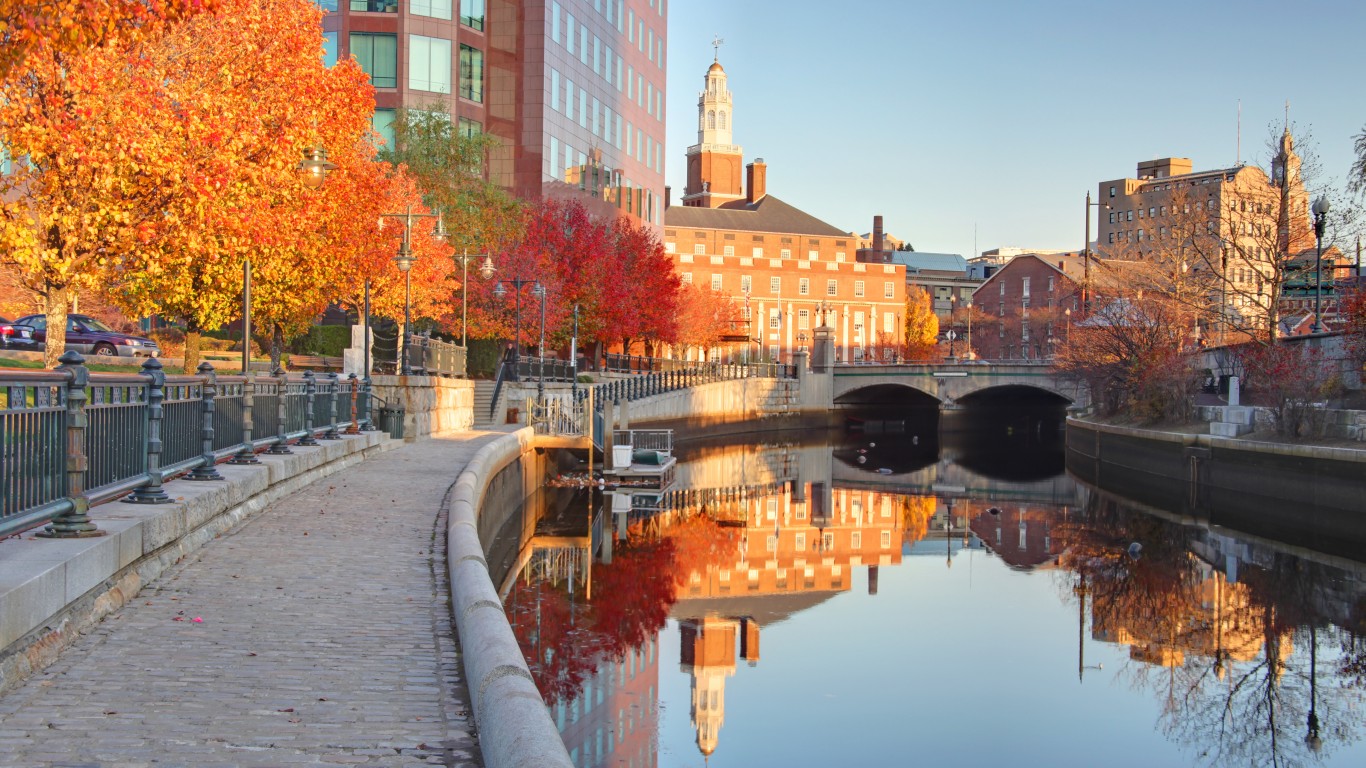
24. Rhode Island
> Underemployment rate: 8.0%
> May unemployment: 4.4% (13th highest)
> 5-yr. employment growth: +6.2% (20th highest)
> Average annual wage: $52,820 (17th highest)
As recently as 2012, 19.0% of workers in Rhode Island were underemployed to some degree, the third largest share of any state at the end of the first quarter that year. Conditions have improved considerably since. Now, just 8.0% of workers in the state are underemployed, a slightly smaller share than the 8.3% of workers nationwide.
The finance and insurance sector and durable goods manufacturing sector drove economic growth in the state last year. Over the same period, modest employment growth coupled with a shrinking labor force helped drive the state’s annual unemployment rate down from 5.5% to 4.6%.
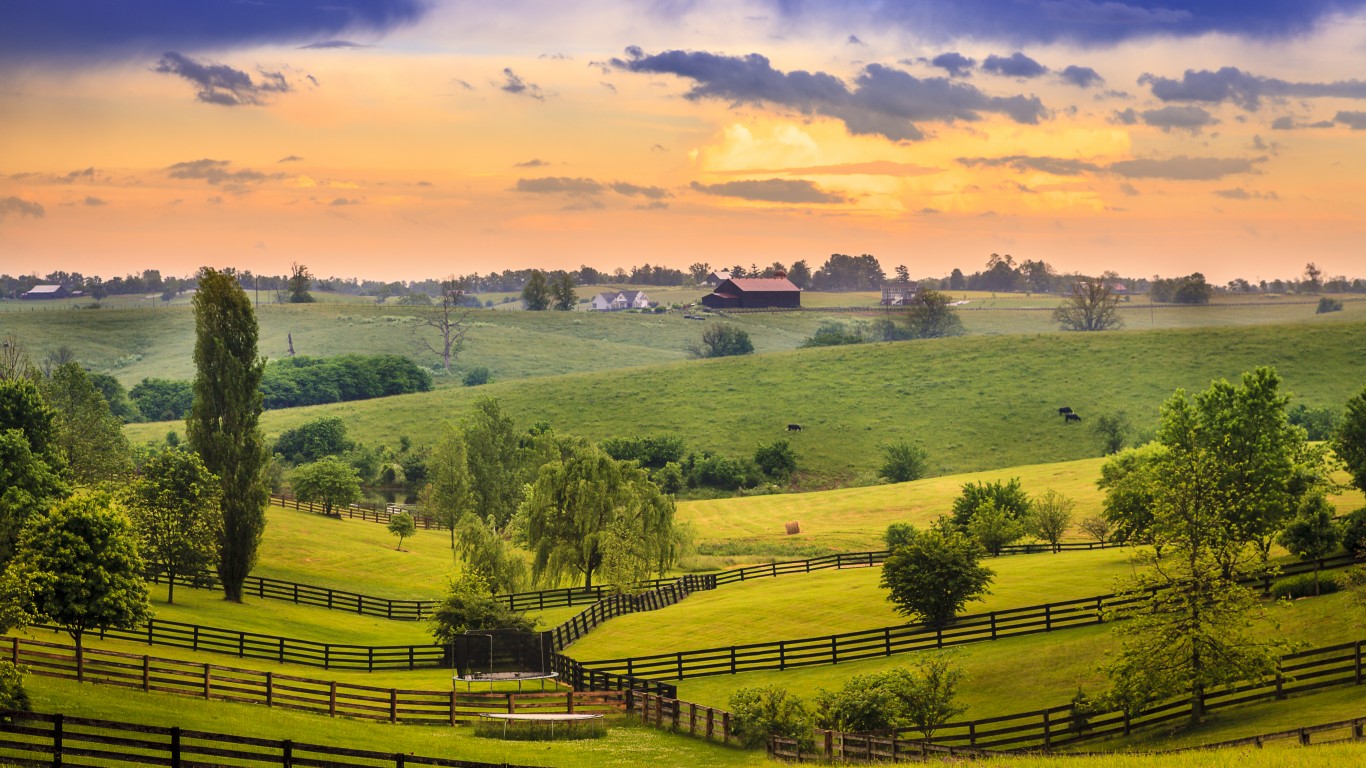
23. Kentucky (tied)
> Underemployment rate: 8.1%
> May unemployment: 4.1% (21st highest)
> 5-yr. employment growth: +3.0% (11th lowest)
> Average annual wage: $45,119 (12th lowest)
The underemployment in three states — Maryland, Montana, and Kentucky — is 8.1%, slightly below the nationwide underemployment rate of 8.3%. In Kentucky, the relatively low underemployment is due in part to lower competition for jobs. Just 55.8% of the state’s working-age population is in the labor force, one of the lowest participation rates of any state and well below the comparable 60.1% share nationwide.
Though the state’s employment figures are relatively strong, Kentucky is one of the poorest states in the country. The average annual wage among all working residents is $45,119, about $10,000 below the national average. Additionally, 18.5% of the population lives in poverty, compared to the U.S. poverty rate of 14.0%.

22. Maryland (tied)
> Underemployment rate: 8.1%
> May unemployment: 4.3% (15th highest)
> 5-yr. employment growth: +6.2% (21st highest)
> Average annual wage: $59,591 (7th highest)
Competition for jobs in Maryland is steeper than in much of the rest of the country. With a bachelor’s degree attainment rate of 39.3%, well above the 31.3% national rate, Maryland has one of the best educated labor pools of all states. Additionally, 64.6% of the working-age population participates in the labor force, well above the 60.1% national participation rate. Still, 8.1% of workers in the state are underemployed, a slightly smaller share than 8.3% of workers nationwide. The health care and social assistance sector, followed by retail trade, employ the largest shares of workers in Maryland.

21. Montana (tied)
> Underemployment rate: 8.1%
> May unemployment: 3.9% (24th lowest)
> 5-yr. employment growth: +6.4% (19th highest)
> Average annual wage: $42,042 (3rd lowest)
Job growth has been modest in Montana, climbing by just over half a percent last year. Over roughly the same time period, underemployment fell slightly from 8.3% to 8.1%.
The state’s economy is dominated by industries that are not especially well paying. For example, 12.9% of the state’s labor force works in retail, and 11.6% work in accomodation and food services — each larger shares than the average nationwide. Partially as a result, the average annual wage among all those working in Montana is just $42,042, well below the national average wage of $55,375.
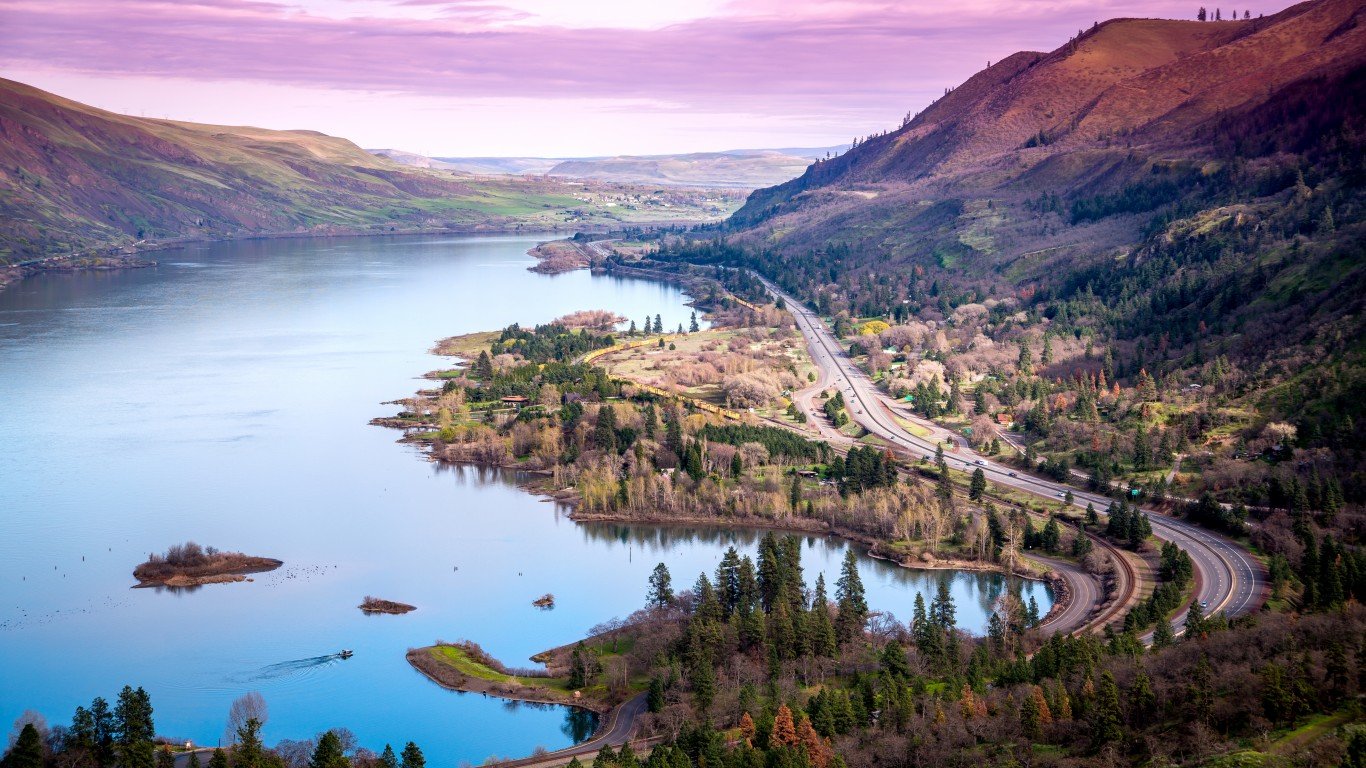
20. Oregon
> Underemployment rate: 8.3%
> May unemployment: 4.1% (21st highest)
> 5-yr. employment growth: +10.3% (11th highest)
> Average annual wage: $51,134 (20th highest)
Though Oregon’s 4.2% annual unemployment rate is slightly below the 4.4% U.S. rate, 8.3% of workers in the state — including the unemployed — are underemployed to some degree, the same underemployment rate as the country as a whole. Part of the reason is the relatively large share workers in the state unable to find full-time work and forced to take a part-time position. Some 3.4% of workers in Oregon are involuntarily working part-time compared to 3.2% of workers nationwide.
Oregon’s underemployment rate has improved considerably in recent years. In 2010, 20.5% of workers in the state were underemployed, the third highest share of any state in the first quarter of that year.
[in-text-ad]
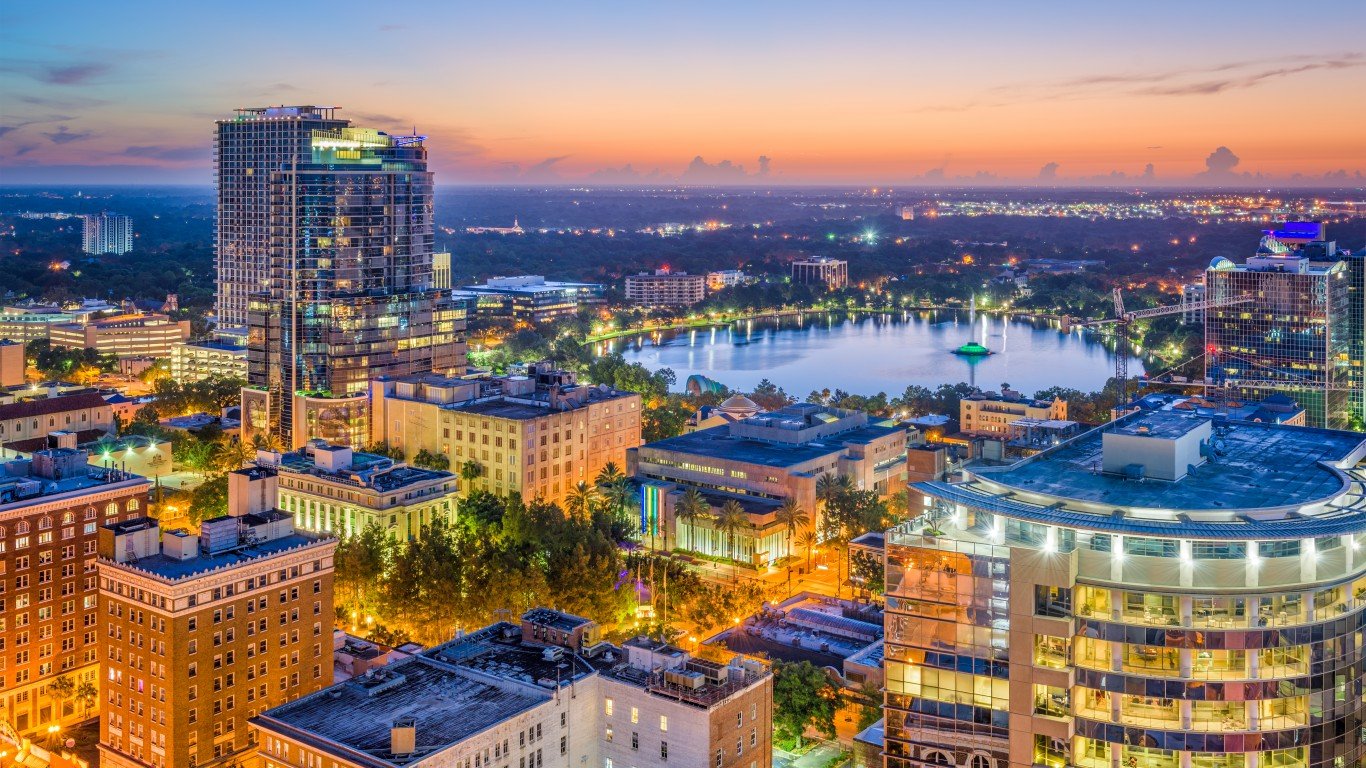
19. Florida (tied)
> Underemployment rate: 8.6%
> May unemployment: 3.8% (22nd lowest)
> 5-yr. employment growth: +12.4% (4th highest)
> Average annual wage: $48,439 (24th lowest)
As is the case in Georgia, its neighbor to the north, Florida’s underemployment rate is 8.6%. Underemployment in the state is driven up by the 3.7% of workers who want full-time work but are unable to find it and are forced to take a part-time job.
Though slightly higher than the national average, Florida’s 8.6% underemployment rate is a marked improvement from a year ago, when it stood at 10.3% — the 10th highest of any state in the country at the time. Last year, Florida had some of the strongest job growth in the country, with total employment climbing 3.3% — more than enough to keep pace with the state’s 2.9% labor force growth.

18. Georgia (tied)
> Underemployment rate: 8.6%
> May unemployment: 4.2% (19th highest)
> 5-yr. employment growth: +9.9% (13th highest)
> Average annual wage: $52,162 (19th highest)
The number of workers in Georgia increased by a near nationleading 3.3% last year, more than quadruple the national labor force growth. Job growth in the state was more than enough to meet rising demand for work. Total employment climbed by 3.6% in Georgia in the last year, faster than in all but three states and double the 1.3% employment growth nationwide. Partially as a result, underemployment in the state fell from 9.8% to 8.6%. Economic growth in Georgia was driven by the information sector as well as nondurable goods manufacturing and transportation and warehousing industries.

17. New York (tied)
> Underemployment rate: 8.7%
> May unemployment: 4.5% (10th highest)
> 5-yr. employment growth: +5.2% (25th lowest)
> Average annual wage: $70,538 (the highest)
Job growth in New York has been relatively weak in recent years. Employment in the state climbed by just 5.2% in the last five years, well below the 7.6% employment growth rate nationwide over that time. Last year, employment in the state fell by 0.1% while national employment climbed by 1.3%. Job losses were offset by a diminishing labor force, however, and New York’s annual unemployment rate fell from 4.9% to 4.7%. Currently, some 8.7% of New York’s workforce are underemployed, down from 9.2% last year but still a slightly larger share than the 8.3% of underemployed workers nationwide.
16. Ohio (tied)
> Underemployment rate: 8.7%
> May unemployment: 4.3% (15th highest)
> 5-yr. employment growth: +3.5% (15th lowest)
> Average annual wage: $49,149 (24th highest)
Ohio’s labor force grew by a modest 0.6% last year, and the number of available jobs did not keep pace. Partially as a result, the state’s annual unemployment rate climbed from 4.9% in 2016 to 5.2% in 2017. Despite rising joblessness, the total share of workers who were either unemployed, discourage from looking for work, or forced to take a part-time job instead of a full-time job fell from 9.5% to 8.7% over the past year. The state’s underemployment rate improvement was smaller than the national improvement as nationwide underemployment fell from 9.5% to 8.3% over the same period.

15. Delaware (tied)
> Underemployment rate: 9.0%
> May unemployment: 4.0% (24th highest)
> 5-yr. employment growth: +9.4% (16th highest)
> Average annual wage: $55,822 (12th highest)
In a break with the national trend, underemployment has been on the rise in Delaware. As of the end of the first quarter of 2017, 8.8% of Delaware’s workforce were underemployed, a smaller share than the 9.5% share of American workers at the time. In the year since, underemployment in the state climbed to 9.0%, while nationwide it fell to 8.3%.
Delaware’s modest GDP growth rate of 1.6% last year was slower than the national economic growth rate of 2.1%. The state’s wholesale trade and accomodation and food services sectors were the largest drag on the economy last year.
[in-text-ad]

14. Michigan (tied)
> Underemployment rate: 9.0%
> May unemployment: 4.6% (8th highest)
> 5-yr. employment growth: +9.2% (17th highest)
> Average annual wage: $52,470 (18th highest)
For the two years beginning with the second quarter of 2008 through the first quarter of 2010, Michigan had the highest underemployment rate of any state, peaking at 21.7%. Since Michigan’s post-recession first-quarter high in the beginning of 2010, annual underemployment has declined every year and currently stands at 9.0%, slightly higher than the 8.3% national underemployment rate.
The dramatic improvement is attributable in part to rapid job growth. Over the last five years, employment climbed 9.2% in Michigan, far faster than the five-year employment growth nationwide of 7.6%.

13. Washington (tied)
> Underemployment rate: 9.0%
> May unemployment: 4.7% (5th highest)
> 5-yr. employment growth: +10.3% (10th highest)
> Average annual wage: $62,090 (6th highest)
Washington has one of the highest unemployment rates in the country. As of May 2018, 4.7% of the state’s labor force was out of a job, the fifth highest state unemployment rate in the country. Due in part to a high jobless rate, a larger share of workers in the state are underemployed. Some 9.0% of state workers are underemployed to some degree — including those who are unemployed — well above the 8.3% U.S. underemployment rate.
Many of those who are working in the state are well compensated. The average salary among all workers in Washington is $62,090, nearly $7,000 more than the average annual wage of all working Americans.
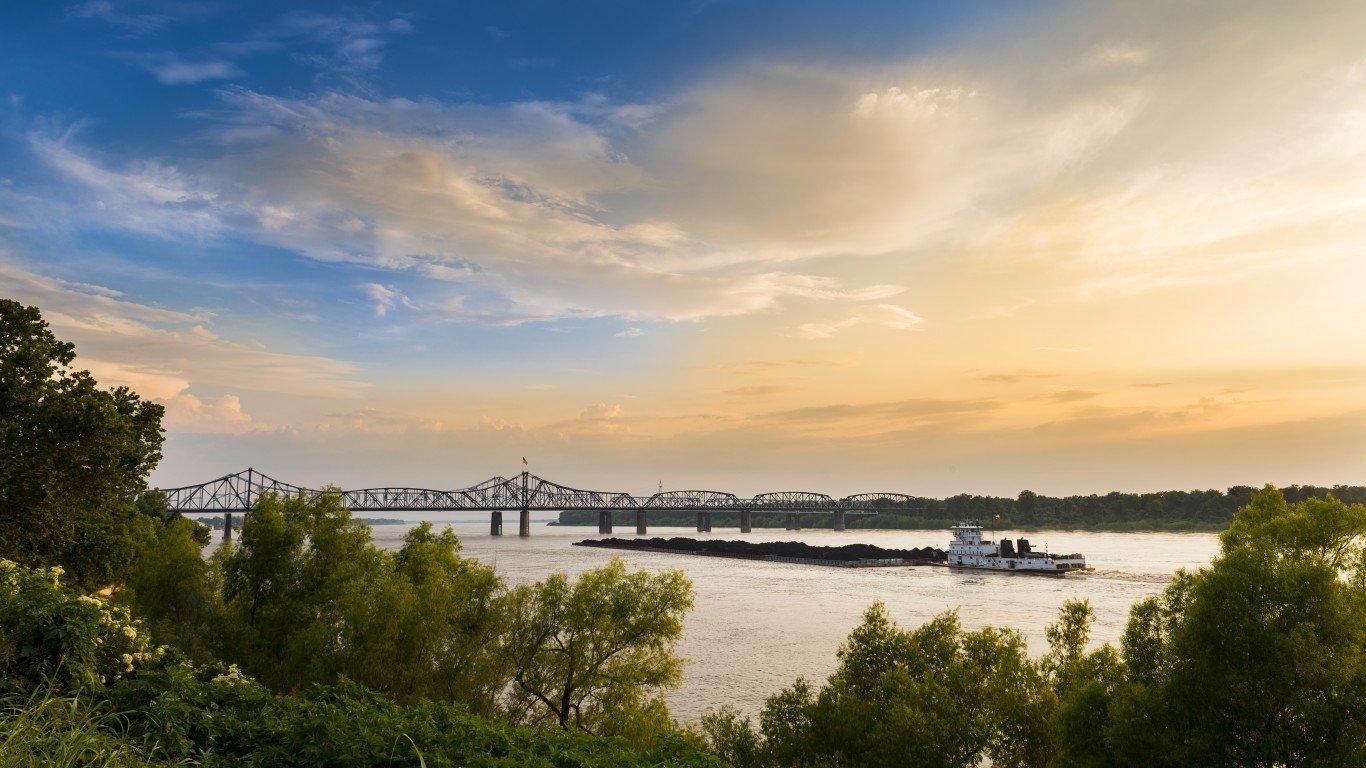
12. Mississippi (tied)
> Underemployment rate: 9.1%
> May unemployment: 4.7% (5th highest)
> 5-yr. employment growth: +0.3% (5th lowest)
> Average annual wage: $38,789 (the lowest)
In Mississippi, 9.1% of the labor force is underemployed to some degree, well above the 8.3% share of workers nationwide. The high underemployment is largely the result of near flat job growth in the state in recent years. Total employment grew by just 0.3% over the last half decade. For reference, overall employment climbed 7.6% nationwide over the same period.
Many of those who are working in Mississippi are still likely struggling financially. The average annual wage in the state is just $38,789, the lowest of any state and about $16,600 less than the national average. Additionally, more than one in every five Mississippi residents live in poverty, the highest poverty rate of any state.
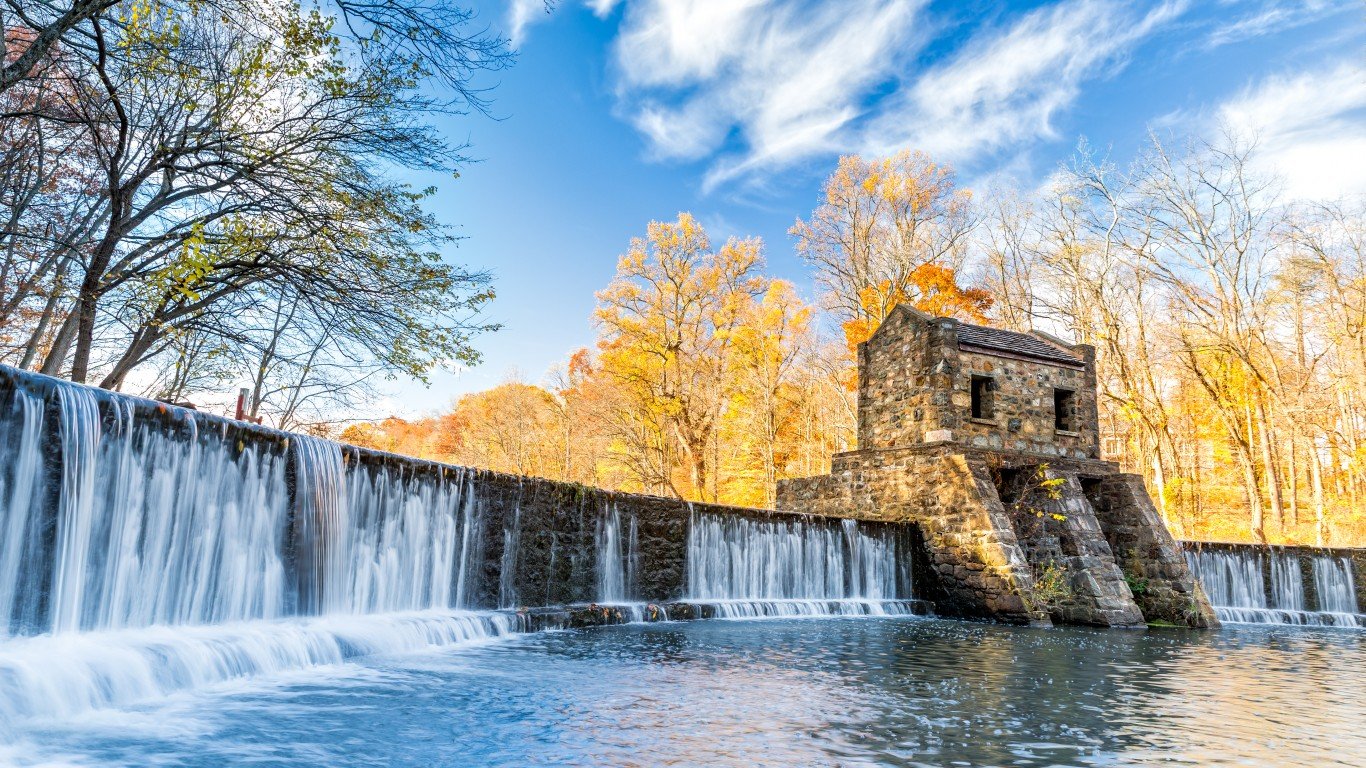
11. New Jersey (tied)
> Underemployment rate: 9.1%
> May unemployment: 4.4% (13th highest)
> 5-yr. employment growth: +3.8% (19th lowest)
> Average annual wage: $64,015 (5th highest)
New Jersey’s labor force contracted by 0.2% over the last year. At the same time, employment rose by 0.2%. Partially as a result, the state’s annual unemployment rate fell from 5.0% in 2016 to 4.6% in 2017. Unemployment is one component of the underemployment rate, and over roughly the same period, underemployment in the state fell from 9.7% to 9.1%.
While full-time employment may be harder to come by in New Jersey than in most other states, many of those working in the Garden State are well compensated. The average annual wage is $64,015, or $8,600 more than the average wage among all working Americans.

10. Illinois
> Underemployment rate: 9.2%
> May unemployment: 4.3% (15th highest)
> 5-yr. employment growth: +3.0% (13th lowest)
> Average annual wage: $57,980 (8th highest)
Underemployment has been more common in Illinois than the U.S. as a whole since the end of the recession. Currently, 9.2% of the state’s workforce are underemployed, well above the 8.3% U.S. underemployment rate. Weak job growth is partially to blame. Employment climbed by a modest 3.0% over the last five years, a much slower pace than the nationwide employment growth of 7.6% over the same period.
While joblessness and underemployment are considerable problems in Illinois, conditions appear to be improving rapidly. The state’s 2017 unemployment rate of 5.2% is nearly a full percentage point below the 2016 unemployment rate of 6.1%. And the state’s unemployment rate for May 2018 stands at an even lower 4.3%.
[in-text-ad]

9. Arizona (tied)
> Underemployment rate: 9.3%
> May unemployment: 4.7% (5th highest)
> 5-yr. employment growth: +12.3% (5th highest)
> Average annual wage: $50,164 (22nd highest)
Over the last year, Arizona’s labor force grew by 2.6%, more than the comparable growth rate in all but a handful of other states. Job growth more than kept pace with demand for work as employment climbed by 3.2% over the same period. Meanwhile, Arizona’s economy expanded by 3.2%, far faster than national GDP growth of 2.1% last year.
Due in part to rapid economic growth and job creation in the state, underemployment fell considerably from 10.9% to 9.3% over the past year. Still, underemployment remains a bigger problem in Arizona than the U.S. as whole as just 8.3% of the U.S. workforce are underemployed.
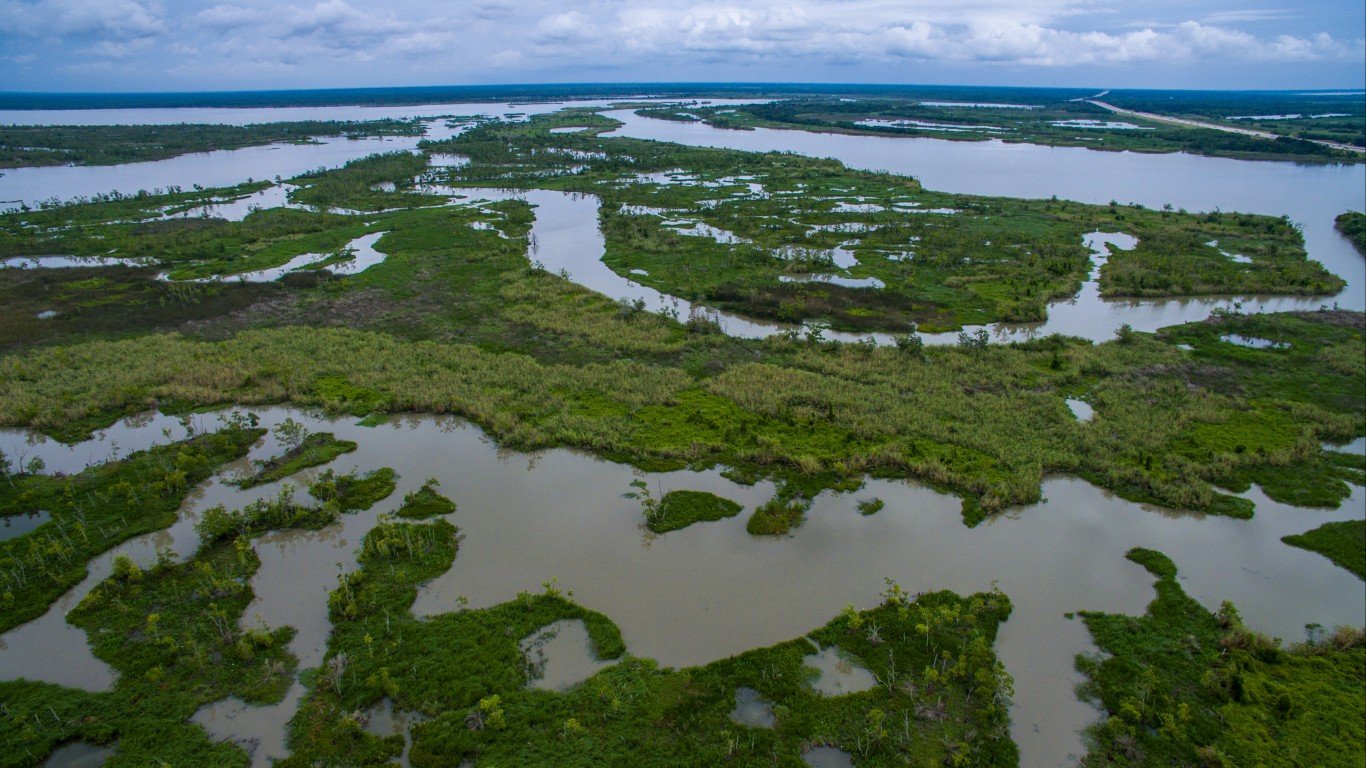
8. Louisiana (tied)
> Underemployment rate: 9.3%
> May unemployment: 4.6% (8th highest)
> 5-yr. employment growth: +3.8% (18th lowest)
> Average annual wage: $46,498 (19th lowest)
Annual underemployment remained relatively low in Louisiana following the recession. However, as the U.S. job market rapidly improved in recent years, Louisiana’s remained relatively stagnant. Now at 9.3%, Louisiana’s underemployment rate is higher than in all but six other states. Over the last five years, employment in the state grew by a modest 3.8%, half the comparable national growth.
Last year, employment in the state actually fell by 1.2%. The same year, Louisiana’s economy contracted by 0.2%, dragged down largely by the nondurable goods manufacturing sector as well as transportation and warehousing.
7. Pennsylvania (tied)
> Underemployment rate: 9.3%
> May unemployment: 4.5% (10th highest)
> 5-yr. employment growth: +2.9% (10th lowest)
> Average annual wage: $54,000 (15th highest)
Pennsylvania’s 9.3% underemployment rate is more than double its current unemployment rate of 4.5% and a full percentage point above the U.S. underemployment rate of 8.3%. Job growth has been weak in the state in recent years. Employment climbed by just 2.9% in Pennsylvania over the last half decade, slower than in most states and well below the 7.6% U.S. employment growth over that time.
Underemployment in the state is driven up by the relatively large share of workers forced to take a part-time job in lieu of full-time work. Some 3.4% of workers fall into that category and are not captured by the traditional unemployment rate. For reference, nationwide, 3.2% of workers are forced to take a part-time job.

6. California
> Underemployment rate: 9.4%
> May unemployment: 4.2% (19th highest)
> 5-yr. employment growth: +10.7% (9th highest)
> Average annual wage: $65,811 (4th highest)
California has the largest workforce in the United States and one of the largest shares of underemployed workers. Some 9.4% of the state’s 19.2 million workers are underemployed, a larger share than the 8.3% of worker’s nationwide. Underemployment is high in the state despite lower competition for jobs. Just 58.9% of all working-age Californians participate in the labor force, lower than the nationwide labor force participation rate of 60.1%.
Underemployment in California is driven largely by a high share of workers forced to take a part-time job in lieu of full-time work. Some 4.0% of workers in the state fall into that category, the largest share of any state and well above the comparable 3.2% share of workers nationwide.

5. Connecticut
> Underemployment rate: 9.6%
> May unemployment: 4.5% (10th highest)
> 5-yr. employment growth: +4.7% (24th lowest)
> Average annual wage: $66,648 (3rd highest)
Connecticut’s 9.6% underemployment rate is the highest in New England and fifth highest nationwide. Job growth in the state has been modest, with total employment climbing 4.7% in the last half decade, slower than the 7.6% national average employment growth over that time. Along with Kansas and Louisiana, the state was one of only three nationwide with a shrinking economy. GDP fell by 0.2% in Connecticut last year.
Many of those who are able to find a job in Connecticut are well paid. The average annual wage across all workers in the state is $66,648, nearly $11,300 more than the national average.
[in-text-ad]

4. West Virginia
> Underemployment rate: 10.1%
> May unemployment: 5.4% (2nd highest)
> 5-yr. employment growth: -1.4% (2nd lowest)
> Average annual wage: $43,424 (6th lowest)
West Virginia is one of only four states with a double digit underemployment rate. The state’s weak job market is partially the product of long-term decline in the state. Over the last half decade, total employment fell by 1.4% in West Virginia, the second worst decline in the country. The high underemployment rate likely contributes to the large share of residents dependent on government assistance programs to meet their basic needs. Some 17.9% of West Virginians receive SNAP benefits — formerly known as food stamps — the highest recipiency rate of any state.
Across the state, the nondurable goods manufacturing industry and the government sector were the largest drags on economic growth last year.

3. Nevada
> Underemployment rate: 10.4%
> May unemployment: 4.8% (4th highest)
> 5-yr. employment growth: +13.3% (2nd highest)
> Average annual wage: $48,126 (23rd lowest)
Some 10.4% of workers in Nevada are underemployed, the third highest underemployment rate of any state. Nevada’s economy was hit especially hard by the Great Recession, and despite an overall weak labor market, this year’s underemployment rate represents a marked improvement from recent years. Employment climbed 13.3% in Nevada over the last half decade, outpacing the 7.6% national job growth over that time. Nevada’s underemployment rate from the second quarter of 2010 through the first quarter of 2011 was 23.7%, the highest of any state. The annual rate remained highest in the nation — measuring from the second quarter through the first quarter — for each of the following five years.

2. New Mexico
> Underemployment rate: 10.5%
> May unemployment: 5.1% (3rd highest)
> 5-yr. employment growth: +0.9% (7th lowest)
> Average annual wage: $43,535 (7th lowest)
New Mexico’s 2017 unemployment rate of 6.5% is the second highest in the country and little improved from the 2016 unemployment rate of 6.6%. Due to high unemployment, and the relatively high 3.9% of workers forced to take part-time work, in addition to those workers who have given up looking for a job, New Mexico’s 10.5% underemployment rate is the second highest of any state.
The weak job market has ripple effects in the state that extend to other aspects of the economy. For example, most Americans with health insurance are insured through work. In New Mexico, the high underemployment likely contributes to the state’s higher than average 9.2% uninsured rate.

1. Alaska
> Underemployment rate: 13.5%
> May unemployment: 7.2% (the highest)
> 5-yr. employment growth: -0.5% (4th lowest)
> Average annual wage: $53,740 (16th highest)
In a break from the national trend, Alaska’s underemployment rate has been on the rise, climbing in each of the last three years. Currently, the state’s 13.5% underemployment rate is by far the highest in the country, exceeding the rate in New Mexico by 3.0 percentage points. Joblessness is largely to blame as the state’s 7.2% unemployment rate is also the highest of any state. Over the last five years, total employment fell by 0.5% in the state, declining by 0.3% in the last year alone. The government sector, as well as nondurable goods manufacturing and construction were the biggest economic drags in the state last year.
Detailed Findings
In addition to the unemployed, the underemployment rate includes those who have involuntarily taken a part-time job and those who have become too discouraged to continue looking for work, or workers are otherwise marginally attached to the labor force.
A state’s underemployment rate can have ripple effects throughout the economy. For example, a high underemployment rate may lead to a larger than typical share of the population struggling financially. Indeed, states with healthier job markets tend to also have low poverty rates. Each of the 10 states with the lowest underemployment rates also have poverty rates below the 14.0% national rate.
Meanwhile, in half of the 10 states with the highest underemployment rates, poverty is more common than it is nationwide.
While health insurance coverage rates are also subject to a range of other public policy factors, they also appear to be closely tied to a state’s job market. Most Americans with health insurance are insured through their job or the job of a family member. Only one of the 10 states with the lowest underemployment rates has a larger uninsured rate than the U.S. as a whole compared to five of the 10 states with worst underemployment rates.
In the states with the best job markets, residents are more likely to participate in the labor force. Nationwide, 60.1% of the working-age population participated in the labor force in 2017. In seven of the 10 states with the highest underemployment rates, the labor force participation rate is lower than it is nationwide. In stark contrast, labor force participation exceeds the national rate in each of the 10 states with the lowest underemployment rates.
Not surprisingly, underemployment figures track closely with unemployment figures. States with low unemployment generally have lower than average underemployment, and vice-versa. Still, the underemployment rate is almost always roughly double the state’s unemployment rate.
Methodology
To determine the hardest states to find full-time work, 24/7 Wall St. reviewed average underemployment rates for the 12 months through the first quarter of this year as measured by the Bureau of Labor Statistics. The underemployment rate is the total number of unemployed job seekers, discouraged and other marginally attached workers, and people settling for part-time jobs as a share of the labor force. We also considered the official unemployment rate as of May 2018. Also from the BLS, we reviewed average annual wages, employment, employment growths, and the size of the labor force from 2016 through 2017. Socioeconomic indicators, including poverty and educational attainment rates came from the U.S. Census Bureau’s 2016 American Community Survey. GDP growth and contribution to GDP growth by industry came from the Bureau of Economic Analysis and is for the period 2016 to 2017.
Contact [email protected] for any questions or corrections.