
U.S. high school graduation rates have risen steadily over the past five years, reaching 84% for the 2015-2016 school year. Encouragingly, rates rose across all income levels, and even among groups that traditionally underperform, including some minority groups, low-income students, and those with disabilities.
The importance of graduating from high school has long been emphasized by public policy experts and lawmakers. Those who graduate can expect better paying jobs and more job opportunities. The average annual income for Americans is $36,810, but it is just $20,924 for those with less than a high school diploma. Those with a high school diploma are also more likely to report better health outcomes. Of course, a high school diploma is also a prerequisite for college.
While education levels have improved on the national level, many metropolitan areas fall far behind the United States average when it comes to ensuring the success of the high school students. In some cities, graduation rates fall well below 70%.
Using data from County Health Rankings & Roadmaps, 24/7 Wall St. identified the metro areas with the lowest graduation rates. 24/7 Wall St. reviewed the 25 metropolitan statistical areas with the smallest reported graduation rate for the class that graduated during the 2014-2015 school year.
Click here to see the cities where the fewest people graduate high school.
Click here to see the cities where the most people graduate high school.
Click here to see our detailed findings and methodology.
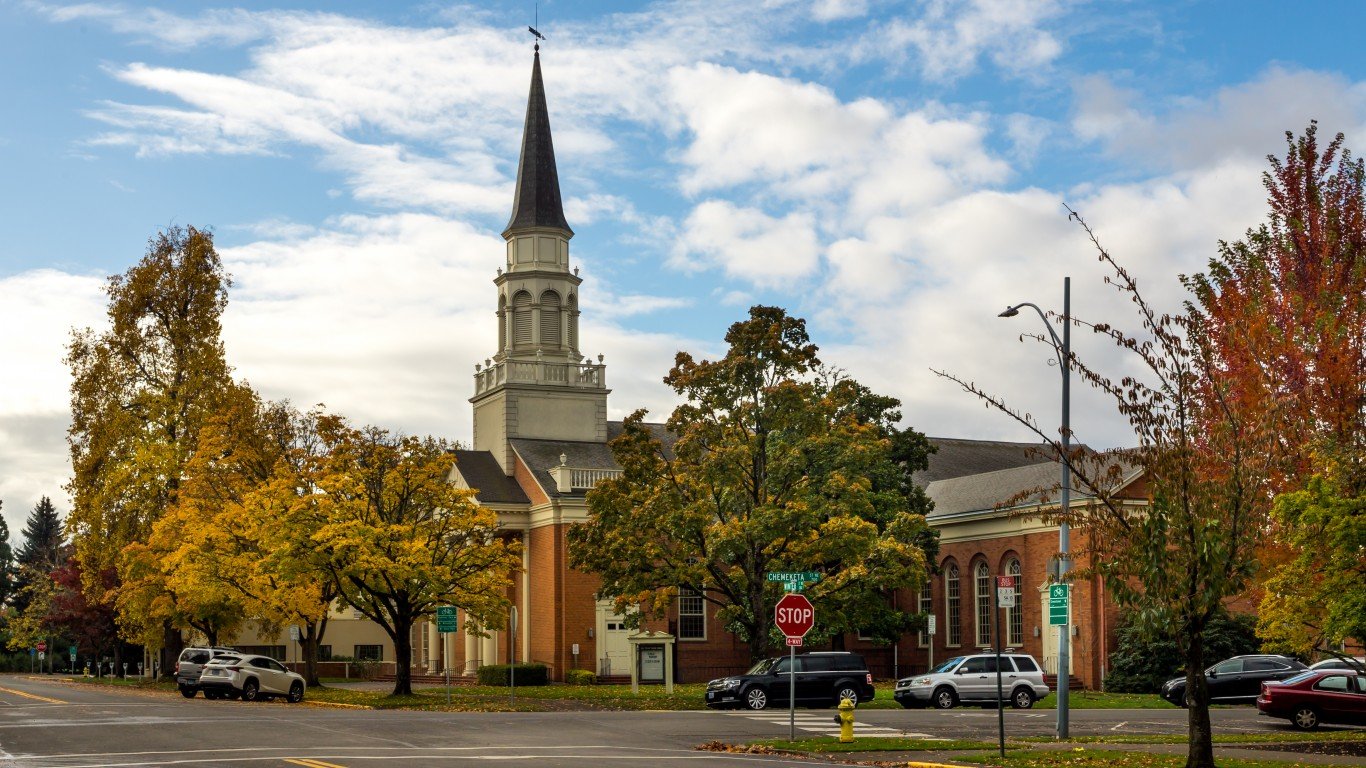
25. Salem, OR
> High school graduation rate: 74.7%
> May unemployment rate: 4.0%
> Median income, less than high school graduate: $20,474
> Percent of adults with a college degree: 24.0%
[in-text-ad]

24. Hammond, LA
> High school graduation rate: 74.0%
> May unemployment rate: 5.2% (highest 25%)
> Median income, less than high school graduate: $20,495
> Percent of adults with a college degree: 20.1% (bottom 25%)
[recirclink id=444492]
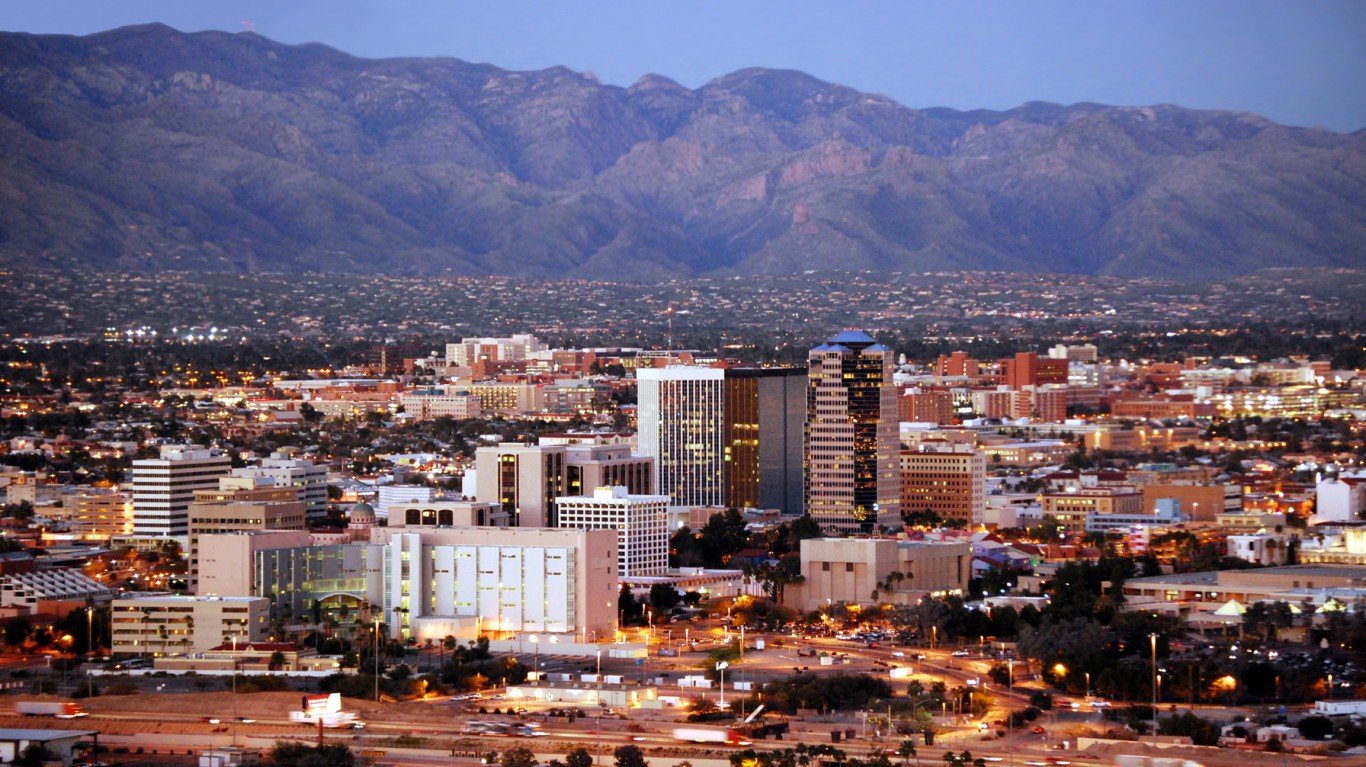
23. Tucson, AZ
> High school graduation rate: 73.9%
> May unemployment rate: 4.0%
> Median income, less than high school graduate: $17,936 (bottom 25%)
> Percent of adults with a college degree: 31.9%
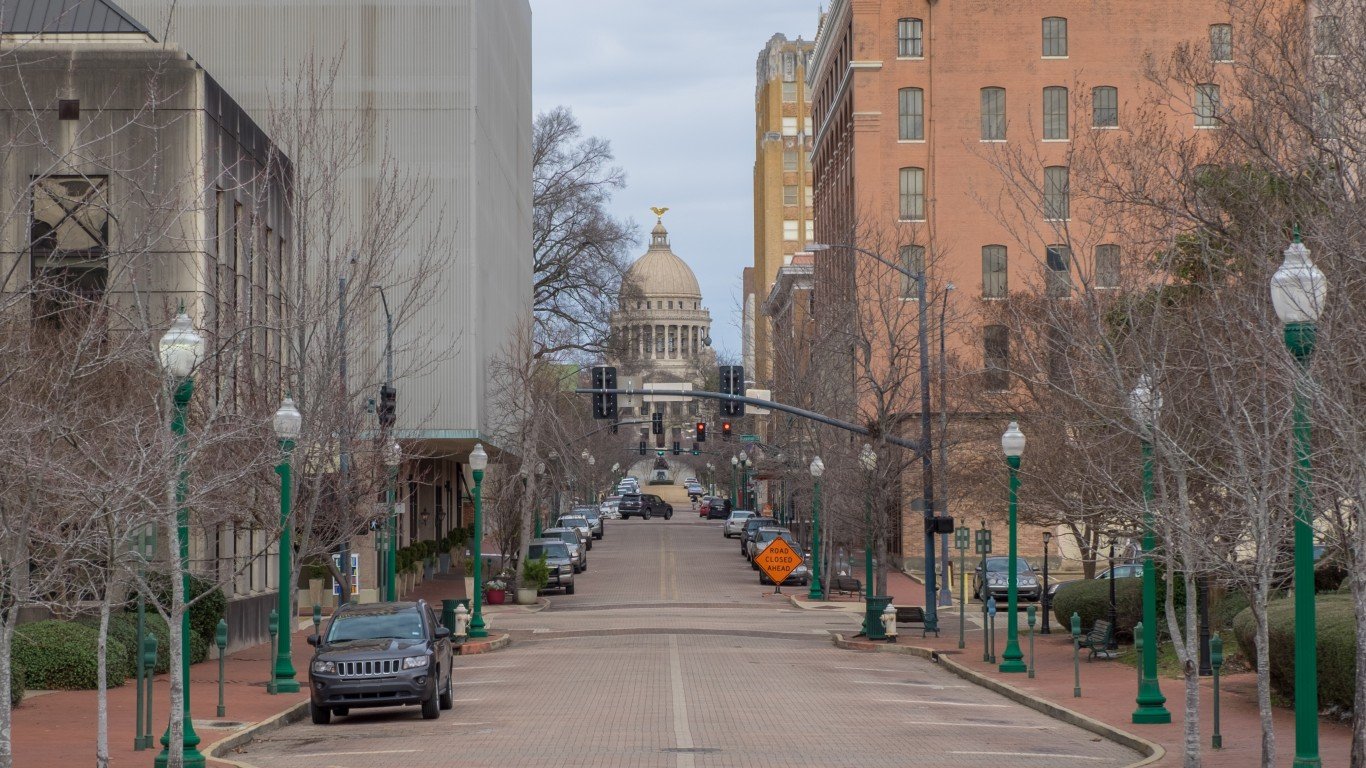
22. Jackson, MS
> High school graduation rate: 73.6%
> May unemployment rate: 4.2%
> Median income, less than high school graduate: $18,681 (bottom 25%)
> Percent of adults with a college degree: 29.9%
[in-text-ad-2]

21. Columbus, OH
> High school graduation rate: 73.2%
> May unemployment rate: 3.7%
> Median income, less than high school graduate: $20,020
> Percent of adults with a college degree: 36.0% (top 25%)

20. Yakima, WA
> High school graduation rate: 73.1%
> May unemployment rate: 6.4% (highest 10%)
> Median income, less than high school graduate: $20,413
> Percent of adults with a college degree: 15.9% (bottom 10%)
[in-text-ad]
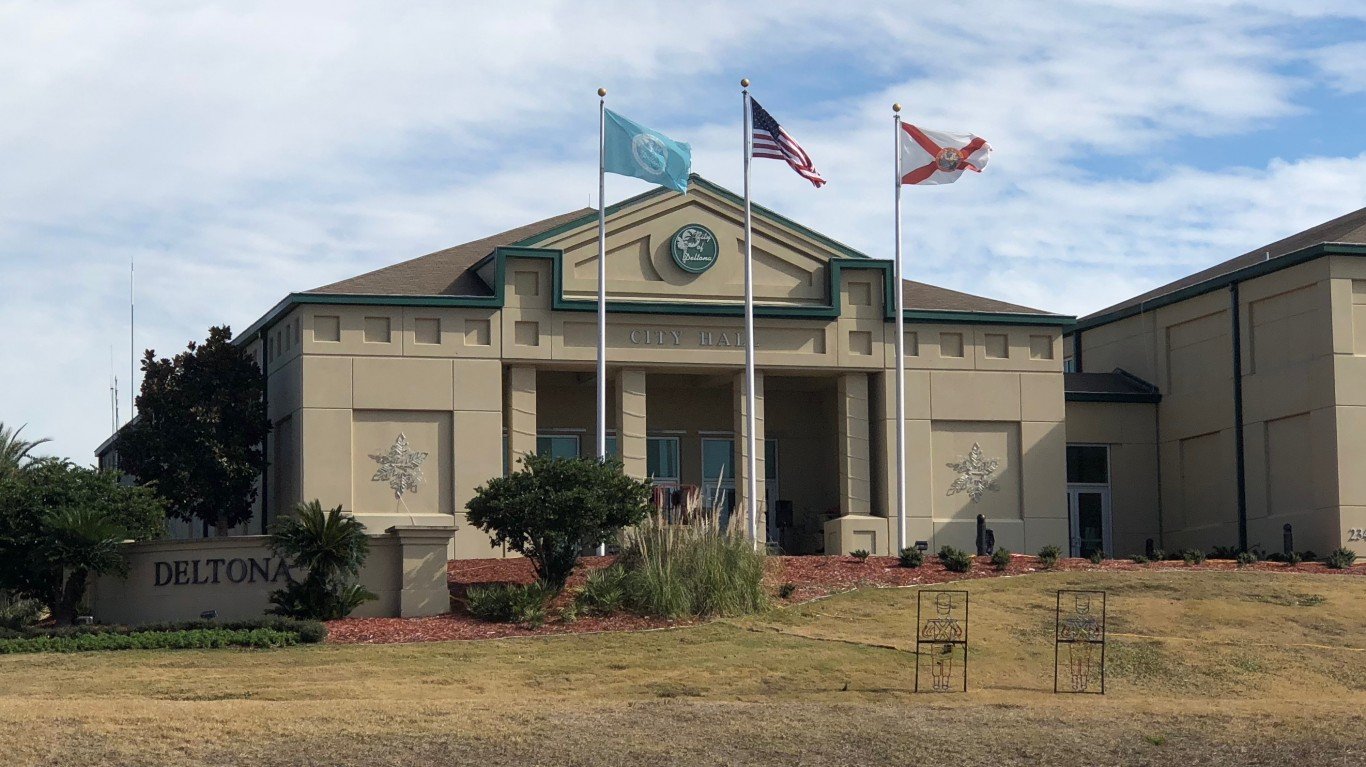
19. Deltona-Daytona Beach-Ormond Beach, FL
> High school graduation rate: 72.9%
> May unemployment rate: 3.8%
> Median income, less than high school graduate: $20,914
> Percent of adults with a college degree: 23.9%
[recirclink id=444468]
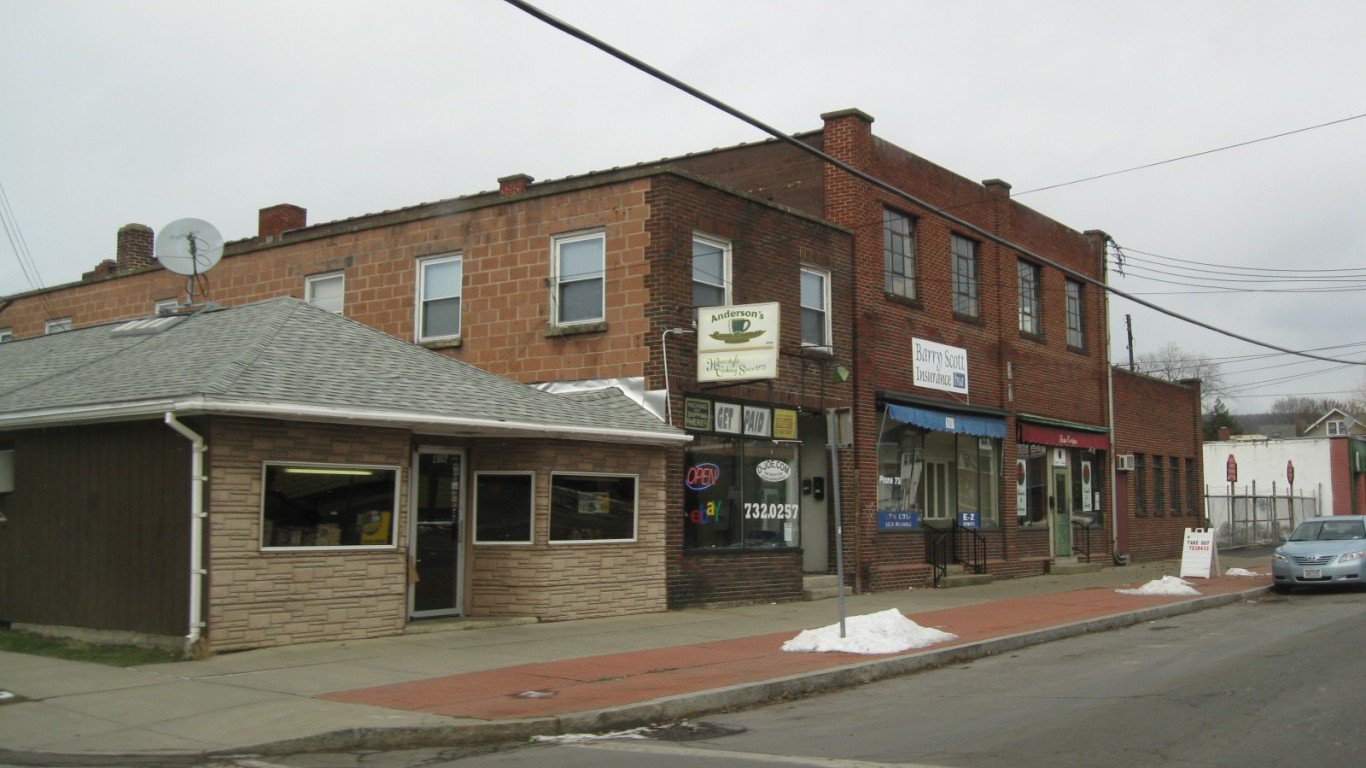
18. Elmira, NY
> High school graduation rate: 72.8%
> May unemployment rate: 5.0% (highest 25%)
> Median income, less than high school graduate: $20,172
> Percent of adults with a college degree: 27.5%
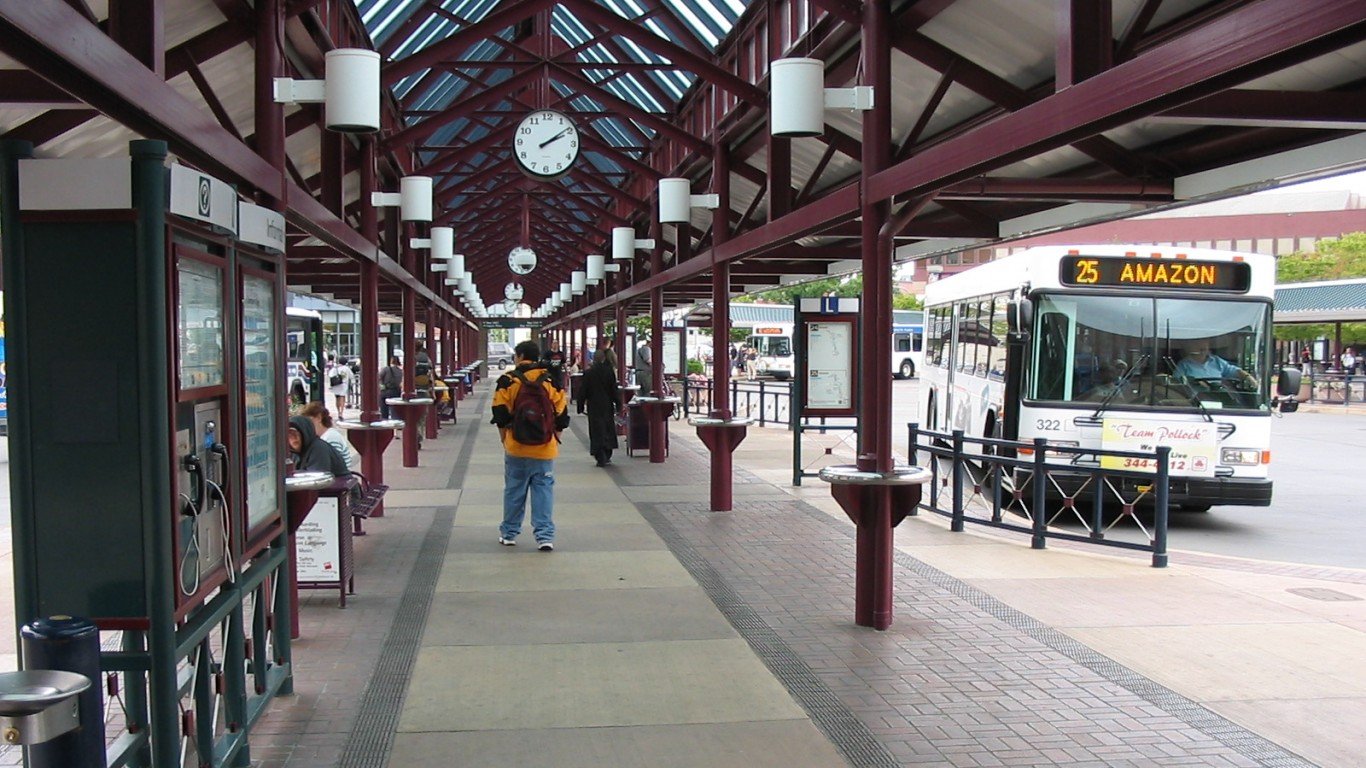
17. Eugene, OR
> High school graduation rate: 72.1%
> May unemployment rate: 4.1%
> Median income, less than high school graduate: $21,970
> Percent of adults with a college degree: 28.8%
[in-text-ad-2]

16. Las Vegas-Henderson-Paradise, NV
> High school graduation rate: 72.0%
> May unemployment rate: 4.7% (highest 25%)
> Median income, less than high school graduate: $25,036 (top 10%)
> Percent of adults with a college degree: 23.3%
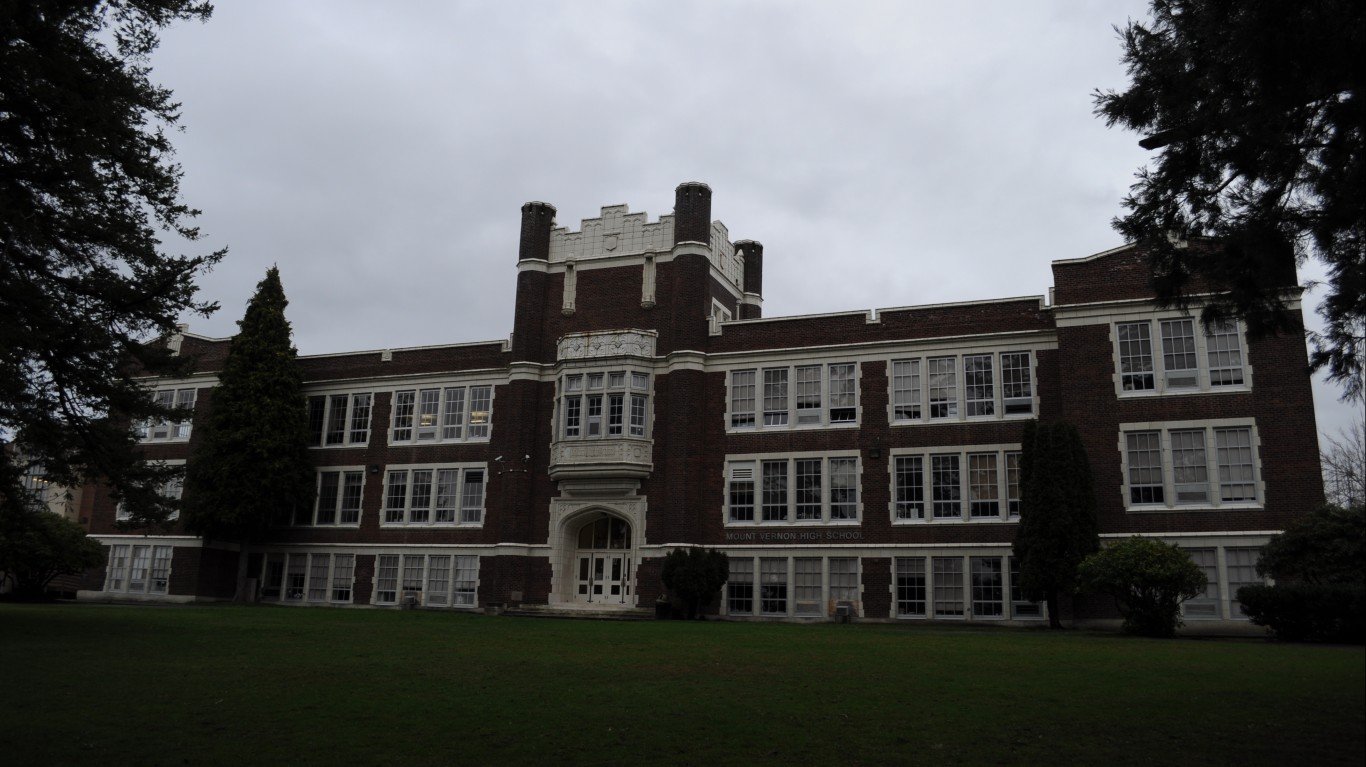
15. Mount Vernon-Anacortes, WA
> High school graduation rate: 72.0%
> May unemployment rate: 5.3% (highest 10%)
> Median income, less than high school graduate: $22,965 (top 25%)
> Percent of adults with a college degree: 24.4%
[in-text-ad]
14. Farmington, NM
> High school graduation rate: 71.8%
> May unemployment rate: 4.9% (highest 25%)
> Median income, less than high school graduate: $21,869
> Percent of adults with a college degree: 16.6% (bottom 10%)
[recirclink id=444391]
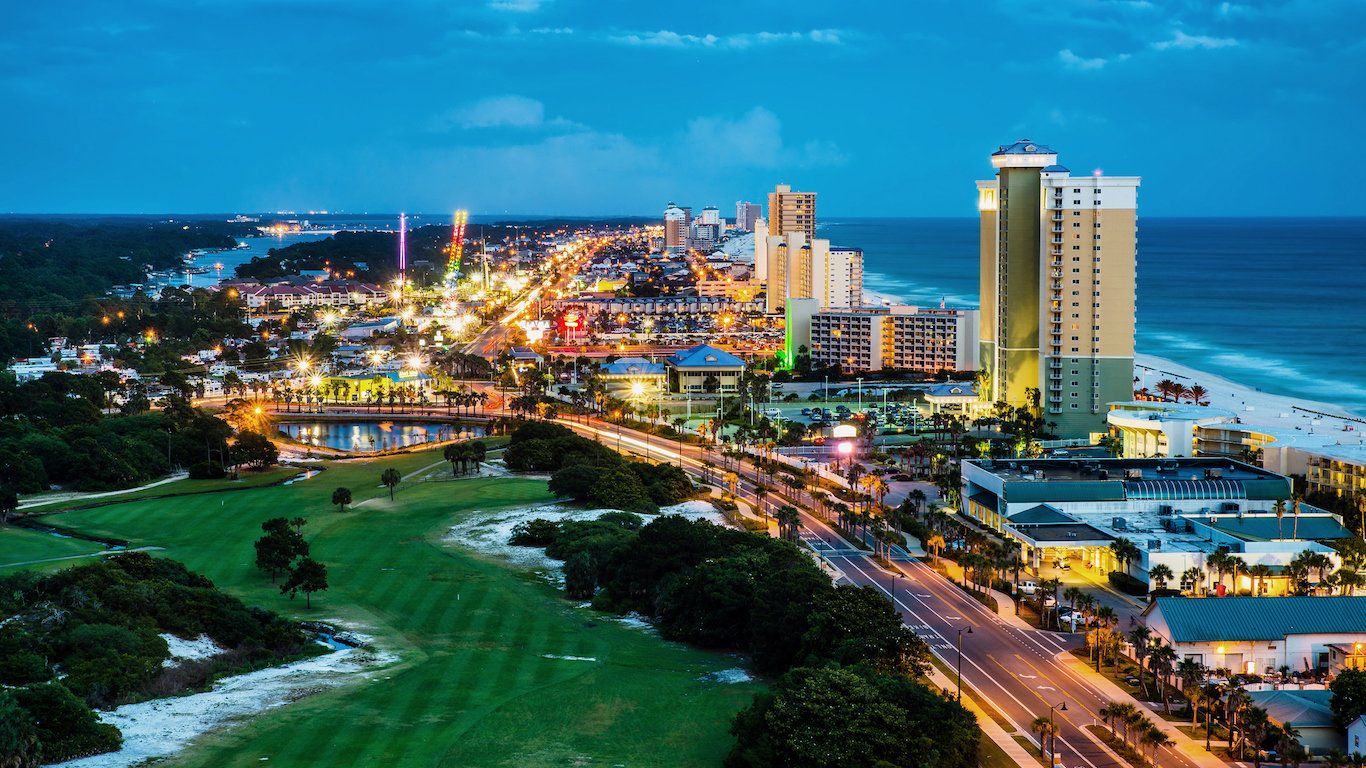
13. Panama City, FL
> High school graduation rate: 71.8%
> May unemployment rate: 3.4%
> Median income, less than high school graduate: $17,960 (bottom 25%)
> Percent of adults with a college degree: 22.8%

12. Columbia, SC
> High school graduation rate: 71.3%
> May unemployment rate: 3.1% (lowest 25%)
> Median income, less than high school graduate: $18,998
> Percent of adults with a college degree: 32.9%
[in-text-ad-2]

11. Myrtle Beach-Conway-North Myrtle Beach, SC-NC
> High school graduation rate: 71.1%
> May unemployment rate: 4.2%
> Median income, less than high school graduate: $17,512 (bottom 25%)
> Percent of adults with a college degree: 23.8%
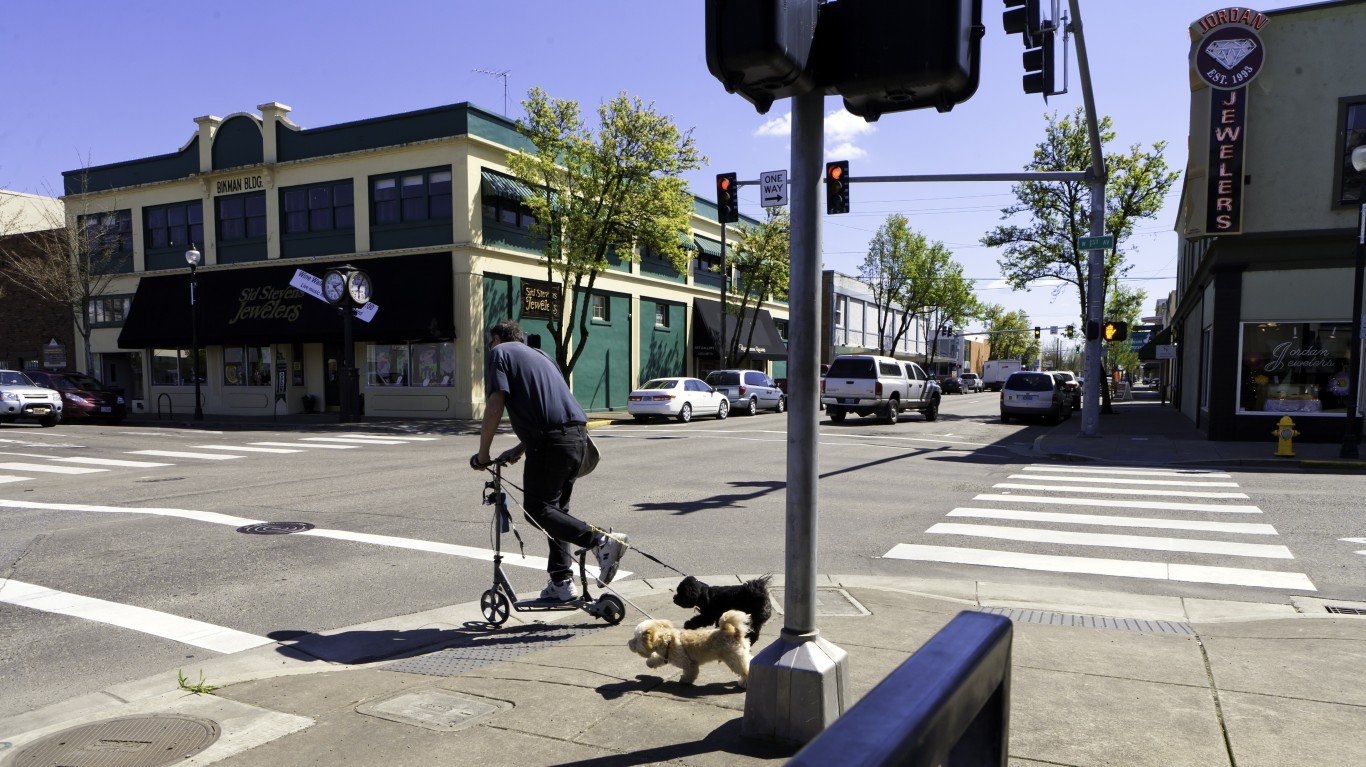
10. Albany, OR
> High school graduation rate: 70.9%
> May unemployment rate: 4.3%
> Median income, less than high school graduate: $20,537
> Percent of adults with a college degree: 21.7%
[in-text-ad]
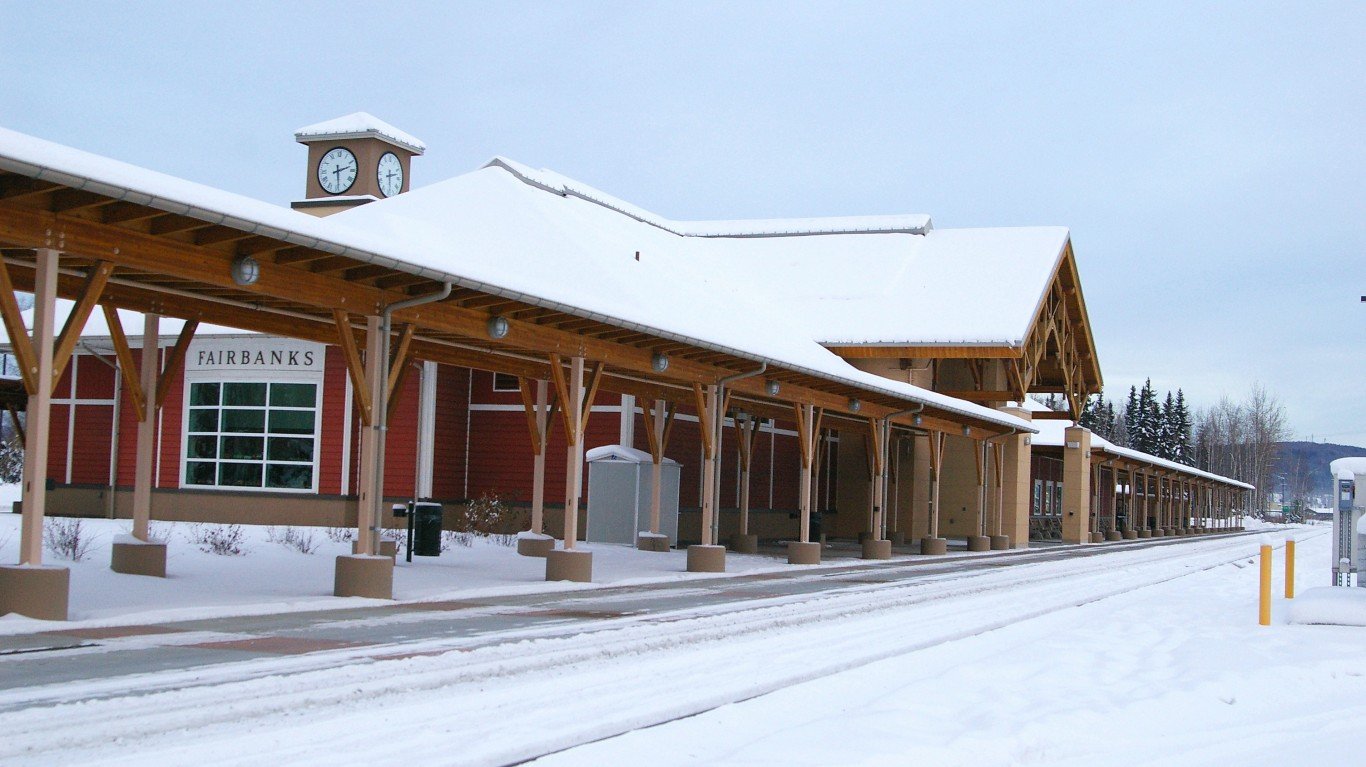
9. Fairbanks, AK
> High school graduation rate: 69.5%
> May unemployment rate: 6.5% (highest 10%)
> Median income, less than high school graduate: $29,068 (top 10%)
> Percent of adults with a college degree: 31.5%
[recirclink id=444326]
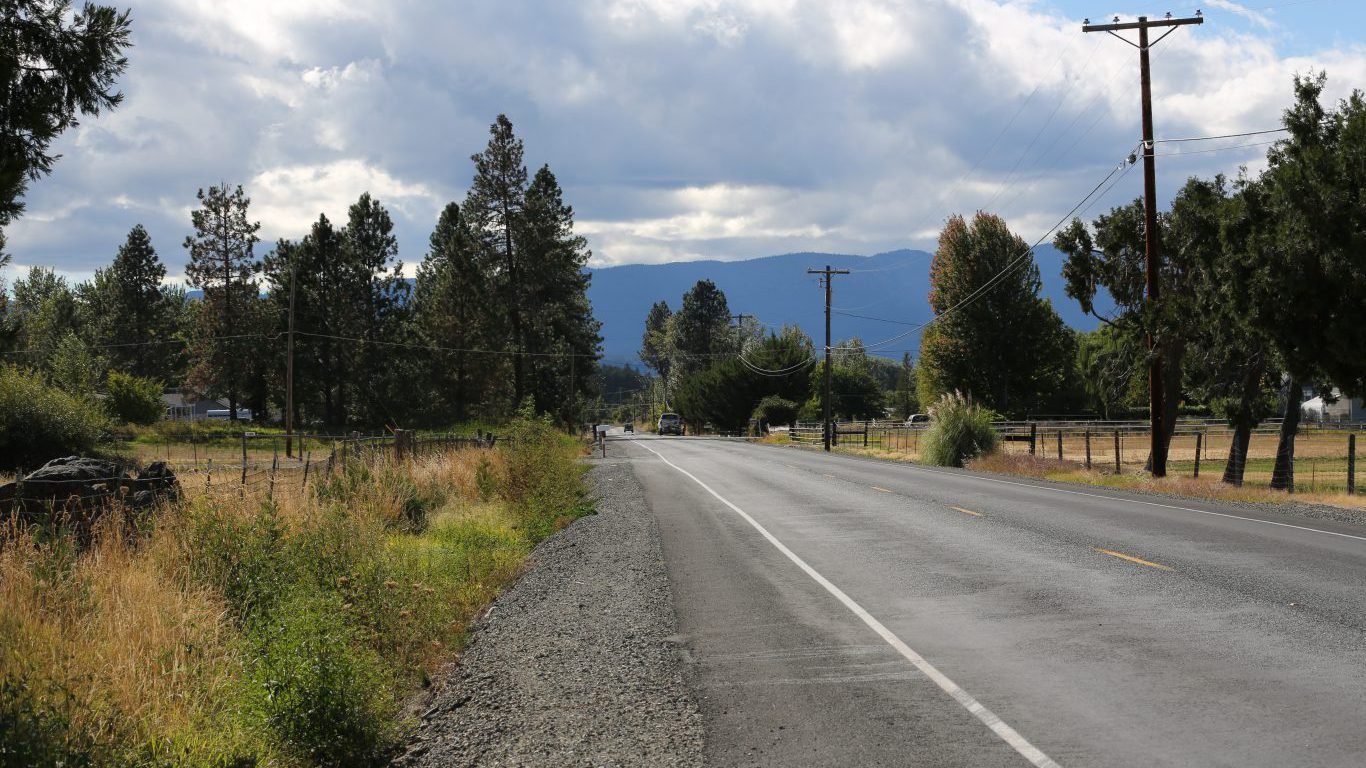
8. Grants Pass, OR
> High school graduation rate: 69.0%
> May unemployment rate: 5.2% (highest 25%)
> Median income, less than high school graduate: $20,110
> Percent of adults with a college degree: 19.5% (bottom 25%)

7. Lakeland-Winter Haven, FL
> High school graduation rate: 69.0%
> May unemployment rate: 4.1%
> Median income, less than high school graduate: $20,263
> Percent of adults with a college degree: 20.1% (bottom 25%)
[in-text-ad-2]

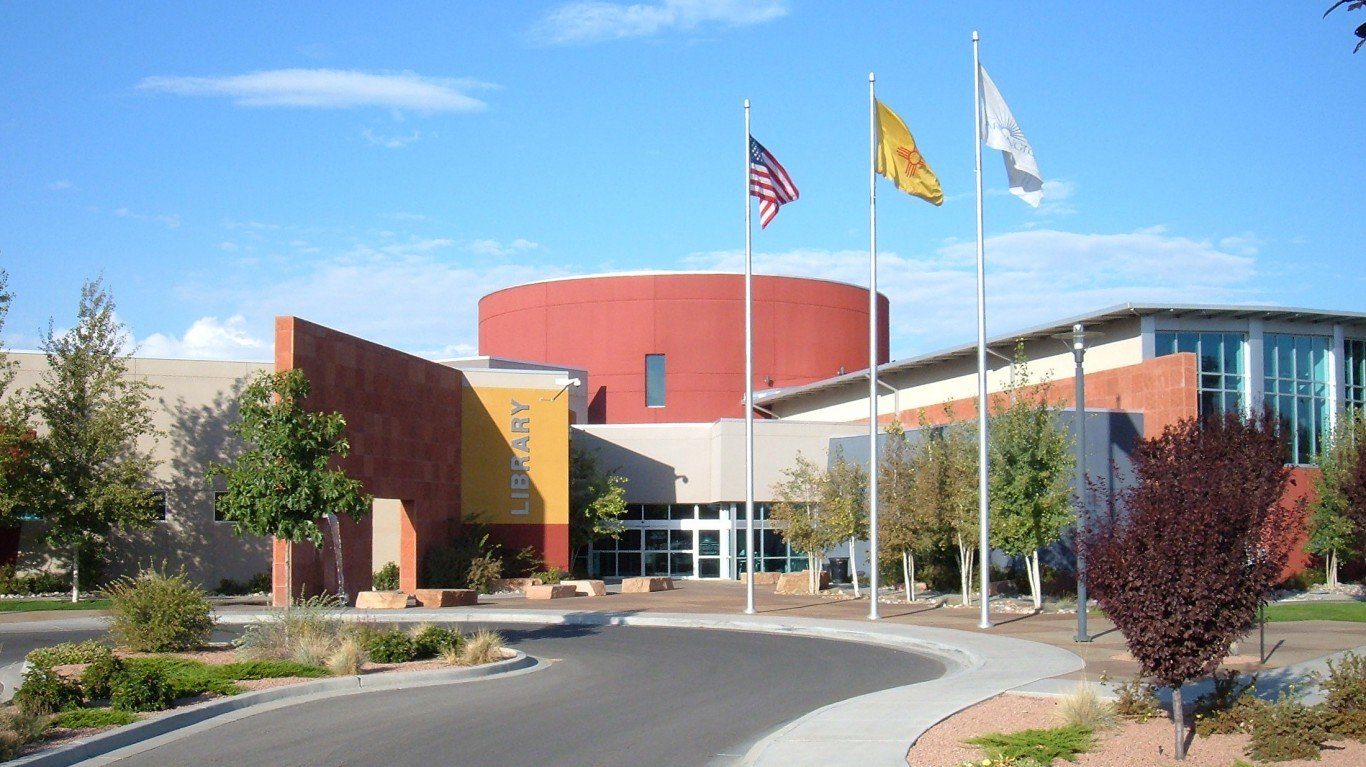
6. Santa Fe, NM
> High school graduation rate: 68.6%
> May unemployment rate: 3.8%
> Median income, less than high school graduate: $20,901
> Percent of adults with a college degree: 41.7% (top 10%)
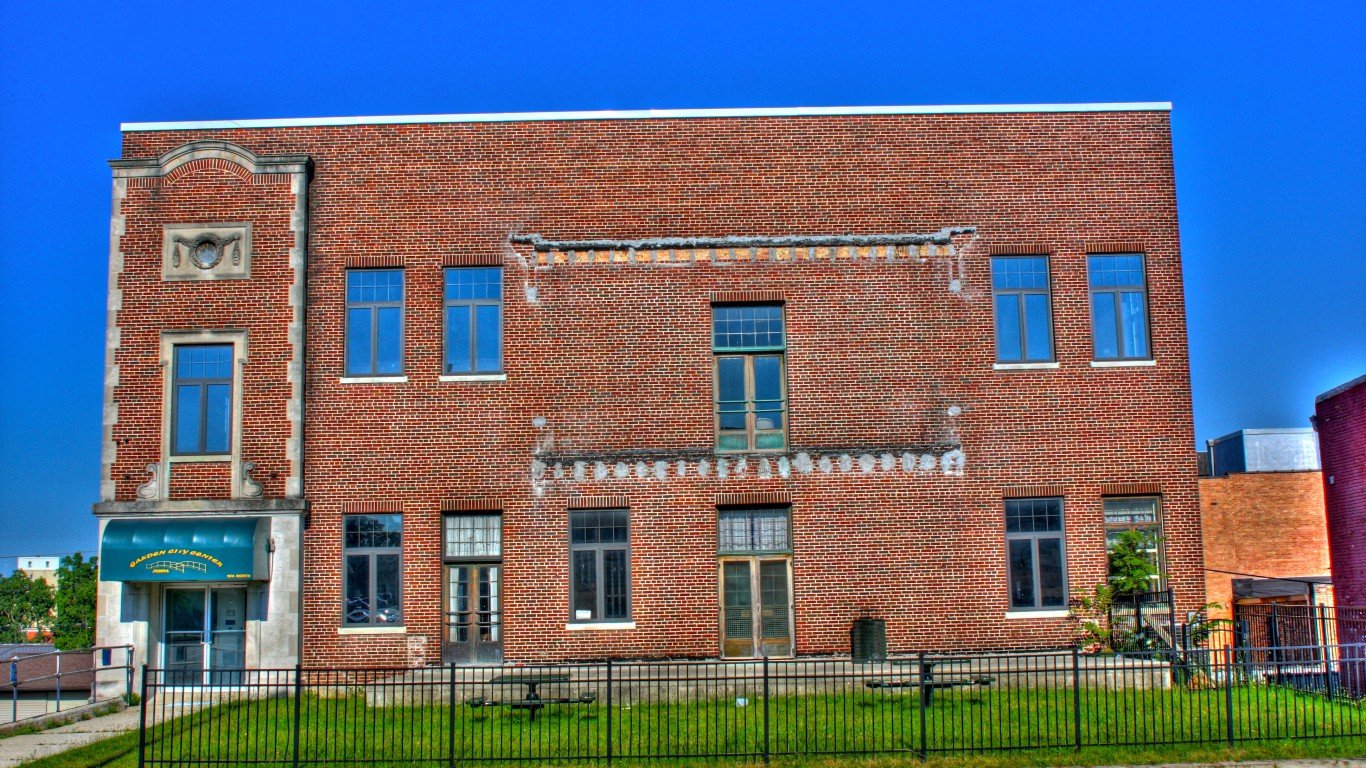
5. Niles-Benton Harbor, MI
> High school graduation rate: 68.2%
> May unemployment rate: 4.5%
> Median income, less than high school graduate: $16,822 (bottom 10%)
> Percent of adults with a college degree: 28.3%
[in-text-ad]
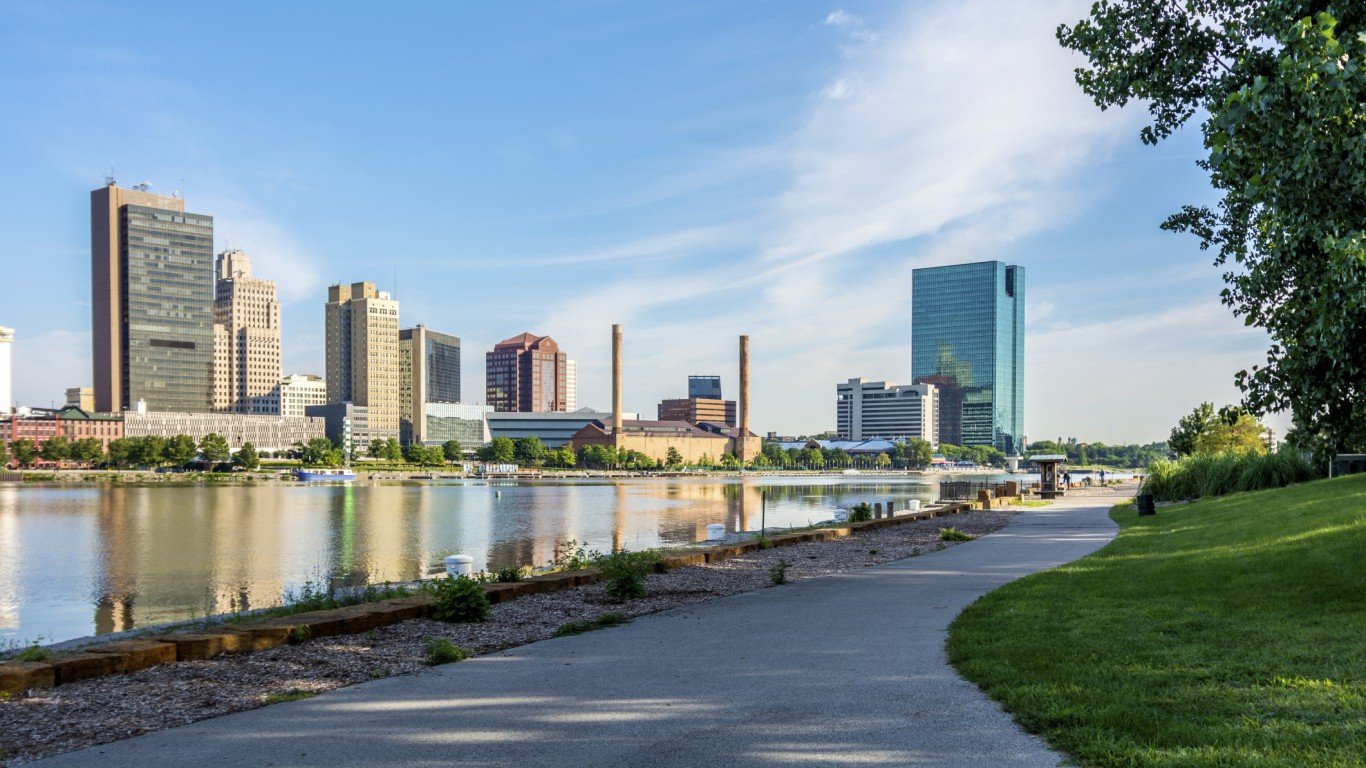
4. Toledo, OH
> High school graduation rate: 67.2%
> May unemployment rate: 4.9% (highest 25%)
> Median income, less than high school graduate: $19,618
> Percent of adults with a college degree: 27.1%
[recirclink id=444046]
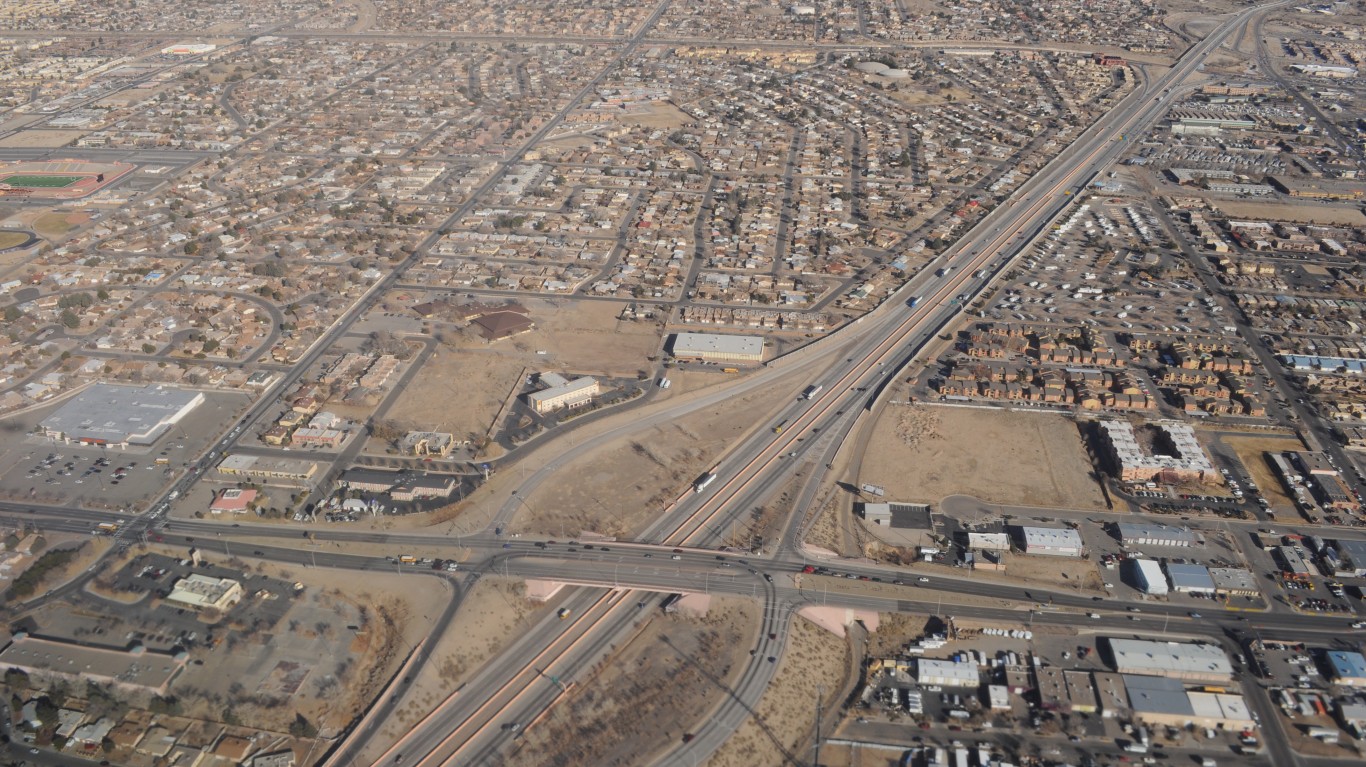
3. Albuquerque, NM
> High school graduation rate: 66.1%
> May unemployment rate: 4.2%
> Median income, less than high school graduate: $19,116
> Percent of adults with a college degree: 31.8%
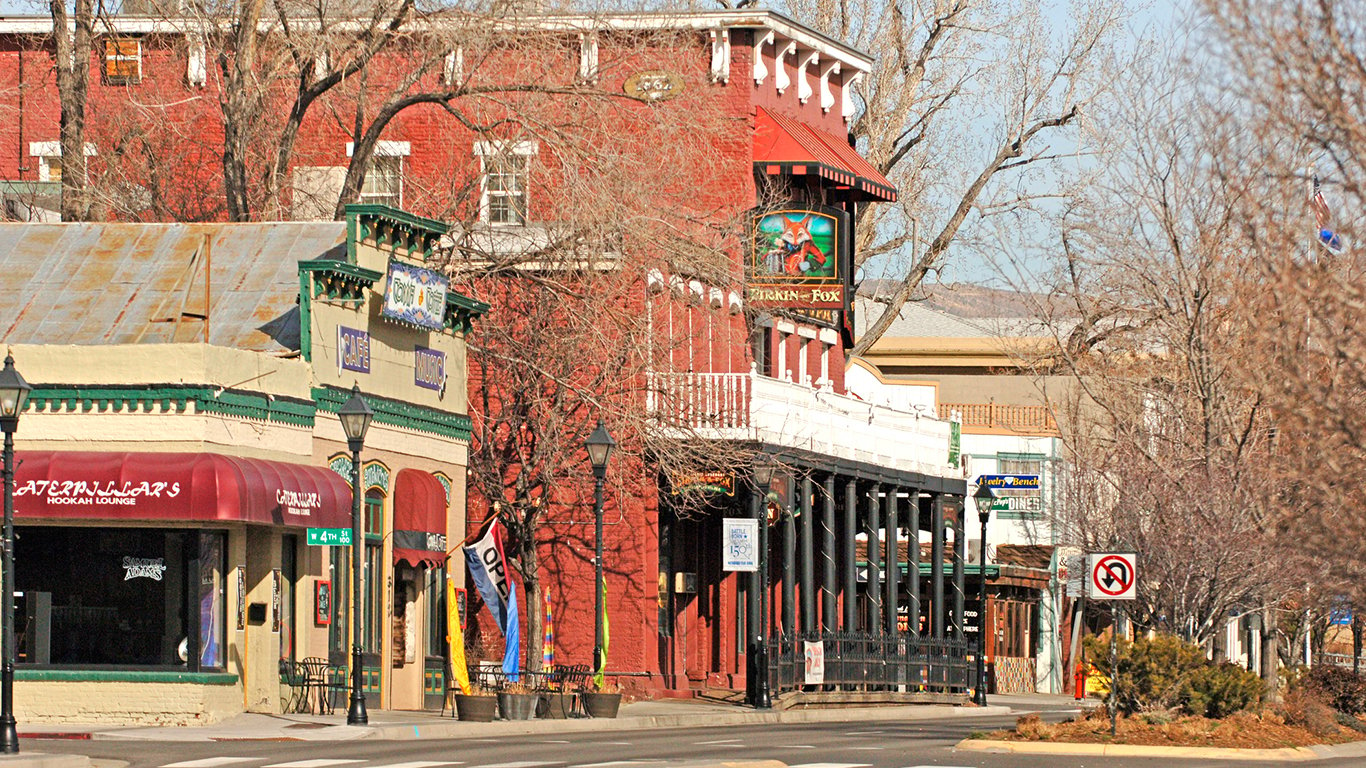
2. Carson City, NV
> High school graduation rate: 65.3%
> May unemployment rate: 4.6% (highest 25%)
> Median income, less than high school graduate: $20,918
> Percent of adults with a college degree: 20.4% (bottom 25%)
[in-text-ad-2]
1. Sebring, FL
> High school graduation rate: 64.0%
> May unemployment rate: 5.2% (highest 25%)
> Median income, less than high school graduate: $16,803 (bottom 10%)
> Percent of adults with a college degree: 13.0% (bottom 10%)
Detailed Findings
Sterling Lloyd, assistant director of the Education Week Research Center, explained that the reasons certain metropolitan areas have higher graduation rates are varied and complicated. Every school is unique, and states have different policies and standards, including the age for which school attendance is compulsory. All of these, Lloyd noted, may have an impact on regional graduation rates.
He added that demographic factors are often a strong indicator for graduation rates. “Research indicates that students with certain characteristics are at greater risk of dropping out,” Lloyd said. “[P]overty is certainly a factor, and you see that some regions have higher poverty rates than others. In general, regions that struggle with poverty also struggle with low graduation rates.“
School success has been shown to be determined in part by factors like poverty as well as parent education levels. Indeed, in the majority of metro areas with the lowest graduation rates, a larger share of residents live in poverty and a lower share of adults has at least a high school diploma. However, this relationship is far from the only factor affecting graduation rates, and many of the metro areas with the highest graduation rates also have above average poverty and below average adult high school attainment rates.
One sign of the effects of low graduation rates, may be relatively high unemployment rates in many of these metro areas. Of the 25 metropolitan areas with the lowest graduation rates, 20 have above average unemployment rates as of May 2018.
Methodology
To determine the graduation rates of U.S. metro areas, 24/7 Wall St. reviewed data from the County Health Rankings & Roadmaps program, a collaboration between the Robert Wood Johnson Foundation and the University of Wisconsin Population Health Institute. High school graduation rates are defined as the percentage of the ninth-grade cohort that graduates in four years. The data represents students graduating on time in the 2014-2015 school year and is the most recent provided. The estimate of the median income for adults with less than a high school diploma and the percentage of people with at least a bachelor’s degree come from the 2016 U.S. Census Bureau’s American Community Survey. The May 2018 unemployment rate comes from the Bureau of Labor Statistics. County cohort and graduation rate were imputed with the population of 15-19 year olds in the each of the metro area’s counties, provided by the U.S Census Bureau’s American Community Survey, in order to account for counties where a cohort was not provided. Metro areas that did not have at least 80% of their graduating population represented in the county data were excluded from consideration.
Contact [email protected] for any questions or corrections.