 [cnxvideo id=”507123″ placement=”ros”]More Americans today hold academic degrees than ever before. The percentage of U.S. adults who completed a four-year college degree has steadily increased over the past 75 years — from 5.0% in 1940 to 30.6% in 2015, according to new data released Wednesday by the U.S. Census Bureau.
The college attainment rate increased in 19 states in 2015. Only Iowa reported a statistically significant decline. Most states reported no change in the education levels of their population.
[in-text-ad]
The likelihood of having attained a bachelor’s degree varies considerably by demographic and social characteristics such as age and sex as well as — notably — by geography. The college attainment rate ranges from 41.5% in Massachusetts to 19.6% in West Virginia.
Click here to see the most (and least) educated states.
States with well-educated populations tend to share certain socioeconomic characteristics. Because holding a bachelor’s degree grants access to a wider range of higher-paying jobs, states with the highest college attainment tend also to report relatively high incomes. Nationally, the typical college-educated worker earns $50,930 a year, about $14,000 more than the median wage for all U.S. workers with any education.
In the 10 most educated states, the typical household earns an annual income well above the national median of $55,775 a year. The opposite is the case in the 10 states with the lowest college attainment rates.
To identify America’s most and least educated states, 24/7 Wall St. reviewed the percentages of adults who have completed at least a bachelor’s degree in each state from the U.S. Census Bureau’s 2015 American Community Survey (ACS). The percentage of adults who have completed at least high school or its equivalent also come from the 2015 ACS. Median household income, health insurance coverage rates, employment by industry, food stamp recipiency, poverty rates, and income inequality also come from the 2015 ACS. Income inequality is measured by the Gini coefficient, which is measured on a scale from 0 to 1, with 0 representing perfect equality and 1 representing total inequality. The Gini is also published by U.S. Census Bureau. We also reviewed annual average unemployment data from the Bureau of Labor Statistics (BLS) for 2014 and 2015.
These are the most (and least) educated states in the country.
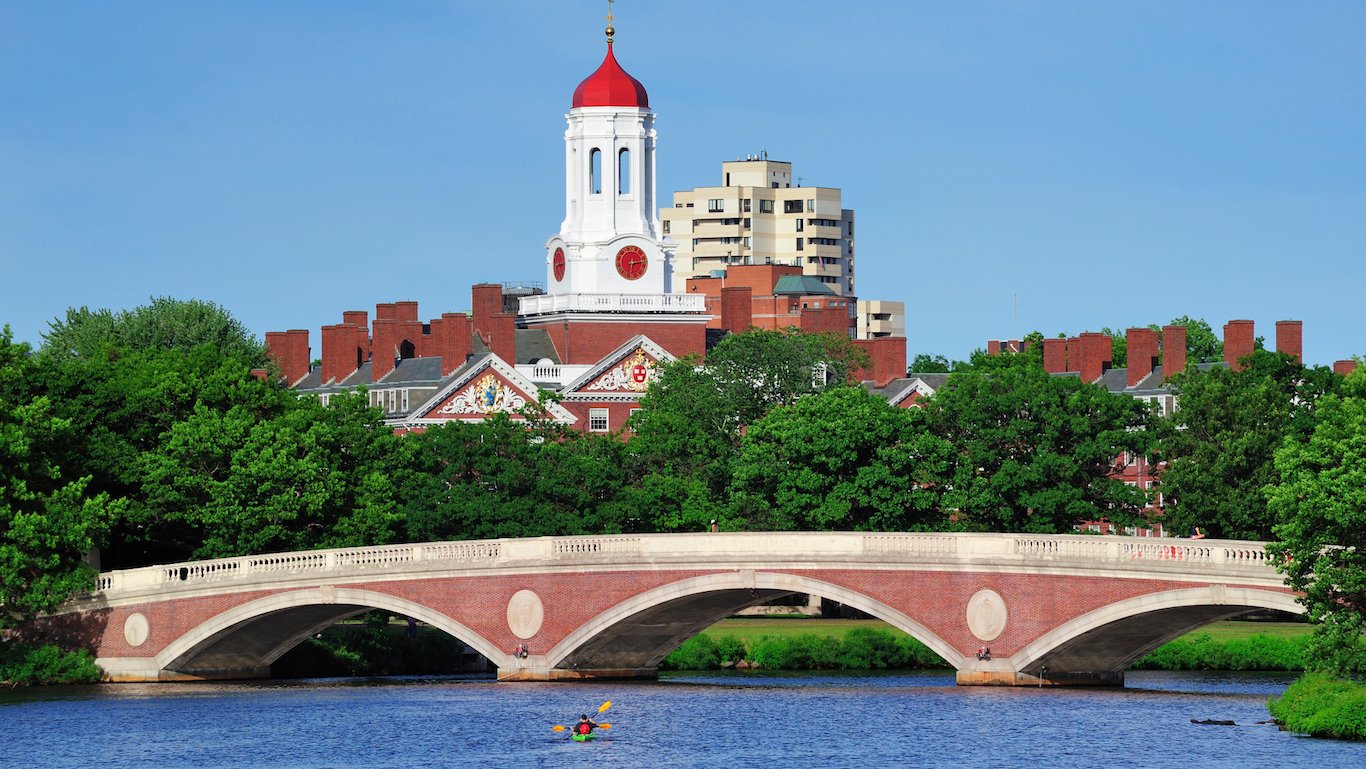
1. Massachusetts
> Pct. of adults with at least a bachelor’s degree: 41.5%
> Pct. of adults with at least a high school diploma: 90.2%
> 2015 median household income: $70,628 (6th highest)
> Median earnings for bachelor degree holders: $57,285 (4th highest)
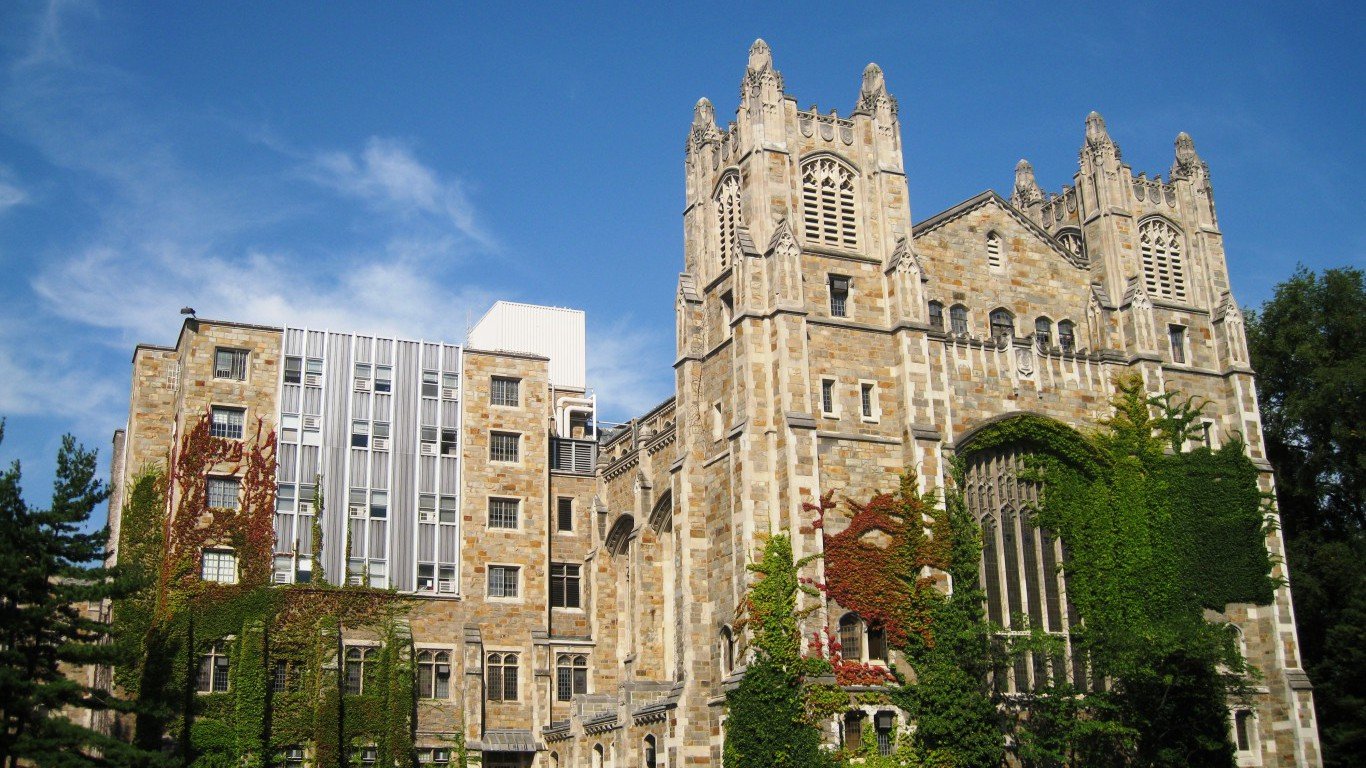
Home to some of the nation’s most prestigious universities, Massachusetts is the only state in which more than two in five adults have at least a bachelor’s degree. Because of their high educational levels many Massachusetts residents likely qualify for high-paying jobs that tend to require college degrees. For example, 13.5% of the Massachusetts workforce is employed in a professional, scientific, or management occupation, the fourth highest share in the country. Some of those employees may belong to the 10.0% of Massachusetts households earning $200,000 and higher a year. Only two other states have a higher share of households earning as much.
[in-text-ad]
2. Colorado
> Pct. of adults with at least a bachelor’s degree: 39.2%
> Pct. of adults with at least a high school diploma: 91.2%
> 2015 median household income: $63,909 (11th highest)
> Median earnings for bachelor degree holders: $50,196 (17th highest)
In Colorado, 39.2% of adults have at least a bachelor’s degree, the second largest share of any state. States with high college attainment rates tend to have strong high school attainment as well. In Colorado, 91.2% of adults have at least graduated from high school — one of the larger such shares in the country. Both the high school and college attainments rates increased by about a percentage point last year. A greater share of adults with a college degree likely means more residents have access to high-paying jobs. The median household income in the state is $63,909, far higher than the $55,775 the typical American household earns a year.
[nativounit]

3. Maryland
> Pct. of adults with at least a bachelor’s degree: 38.8%
> Pct. of adults with at least a high school diploma: 89.6%
> 2015 median household income: $75,847 (the highest)
> Median earnings for bachelor degree holders: $60,745 (3rd highest)
In Maryland, 38.8% of adults have at least a bachelor’s degree, the third largest share in the country. The high level of educational attainment helps explain the state’s high median income. The typical Maryland household earns $75,847 a year, approximately $20,000 more than the typical American household’s income of $55,775. A large share of Maryland residents likely earn their high incomes in fields that require college education. For example, 15.5% of the state workforce is employed in a professional, scientific, or management occupation, the highest share nationwide.
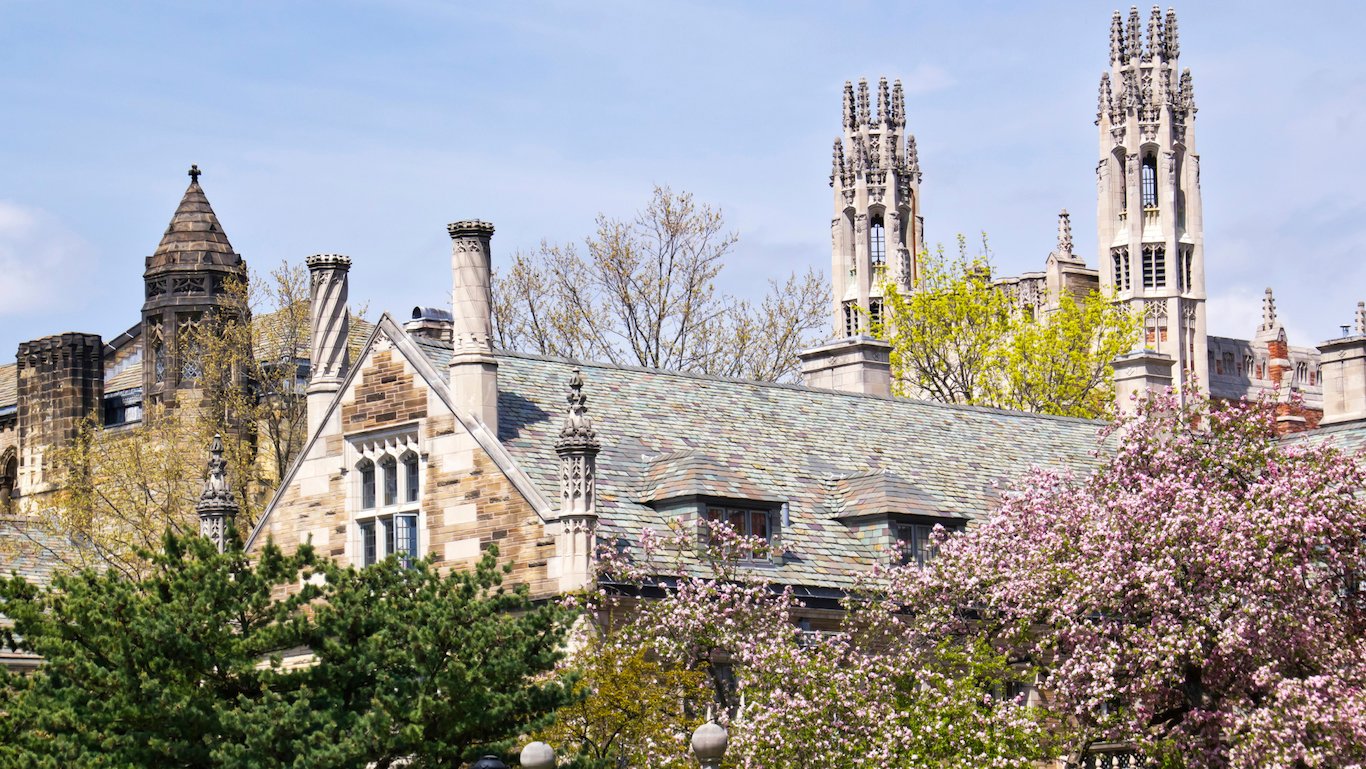
4. Connecticut
> Pct. of adults with at least a bachelor’s degree: 38.3%
> Pct. of adults with at least a high school diploma: 90.2%
> 2015 median household income: $71,346 (5th highest)
> Median earnings for bachelor degree holders: $61,071 (the highest)
In Connecticut, 38.3% of adults have at least a bachelor’s degree, the fourth highest college attainment rate nationwide. A college education goes a long way in Connecticut, where the typical adult with a bachelor’s degree earns $61,071 annually, the highest median earnings for college graduates of any state. College graduates likely account for the bulk of Connecticut households earnings more than $200,000 annually. The 10.3% of households earnings such high incomes is the second highest share in the country.
[recirclink id=352573]
5. New Jersey
> Pct. of adults with at least a bachelor’s degree: 37.6%
> Pct. of adults with at least a high school diploma: 89.1%
> 2015 median household income: $72,222 (4th highest)
> Median earnings for bachelor degree holders: $60,935 (2nd highest)
In New Jersey, 37.6% of adults have at least a bachelor’s degree, a larger share than the 30.6% national college attainment rate. College graduates are compensated particularly well in New Jersey. The typical adult with a bachelor’s degree in the state earns $60,935 annually, the second highest such figure of any state. College graduates likely comprise a large share of the New Jersey households earning more than $200,000 a year. The 10.9% of state households earnings such high incomes is the highest such share nationwide.

6. Virginia
> Pct. of adults with at least a bachelor’s degree: 37.0%
> Pct. of adults with at least a high school diploma: 88.9%
> 2015 median household income: $66,262 (8th highest)
> Median earnings for bachelor degree holders: $55,799 (6th highest)
Of adults in Virginia, 37.0% have at least a bachelor’s degree, the sixth highest college attainment rate of any state. Given the state’s high educational levels, it is not surprising that a large share of Virginia residents work in high-paying jobs that tend to require college degrees. For example, 14.7% of the state’s workforce is employed in a professional, scientific, or management position, the second highest share of any state. The typical Virginia household has an income of $66,262 annually, far more than the $55,775 national median household income.
[in-text-ad]
7. Vermont
> Pct. of adults with at least a bachelor’s degree: 36.9%
> Pct. of adults with at least a high school diploma: 91.7%
> 2015 median household income: $56,990 (20th highest)
> Median earnings for bachelor degree holders: $40,348 (3rd lowest)
In Vermont, 36.9% of adults have at least a bachelor’s degree, the seventh highest share in the nation, and a 2 percentage point increase compared to the previous year. While higher education tends to lead to higher incomes, the typical adult with at least a bachelor’s degree in Vermont earns just $40,348 a year, the third lowest figure of any state and not much more than the median earnings for all Vermont workers. Still, like other states with the highest college attainment rates, the poverty rate of 10.2% in Vermont is far less than the 14.7% national poverty rate.
[nativounit]
8. New Hampshire
> Pct. of adults with at least a bachelor’s degree: 35.7%
> Pct. of adults with at least a high school diploma: 93.1%
> 2015 median household income: $70,303 (7th highest)
> Median earnings for bachelor degree holders: $51,426 (14th highest)
In New Hampshire, 35.7% of adults have at least a bachelor’s degree, higher than the 30.6% of Americans with similar educational attainment. States with high college attainment rates tend to have strong high school attainment as well. In New Hampshire, 93.1% of adults have at least graduated from high school, the second highest in the country. Those residents with college education are more likely to have jobs with higher incomes. The typical New Hampshire household earns $70,303 annually, the seventh highest median household income of any state.
9. New York
> Pct. of adults with at least a bachelor’s degree: 35.0%
> Pct. of adults with at least a high school diploma: 86.0%
> 2015 median household income: $60,850 (15th highest)
> Median earnings for bachelor degree holders: $55,360 (8th highest)
Over the last year, the share of New York adults with at least a bachelor’s degree increased slightly from 34.5% to 35.0%, today the ninth highest share of any state. In that same time, the median household income in the state increased by roughly $2,000. The typical New Yorker with a bachelor’s degree earns $55,360 a year, the eighth highest such figure of any state and roughly $14,000 more than the median earnings for all workers in the state. This discrepancy in earnings may be one reason behind the high income inequality in New York, which according to the Gini coefficient is the worst of any state.
[wallst_email_signup]
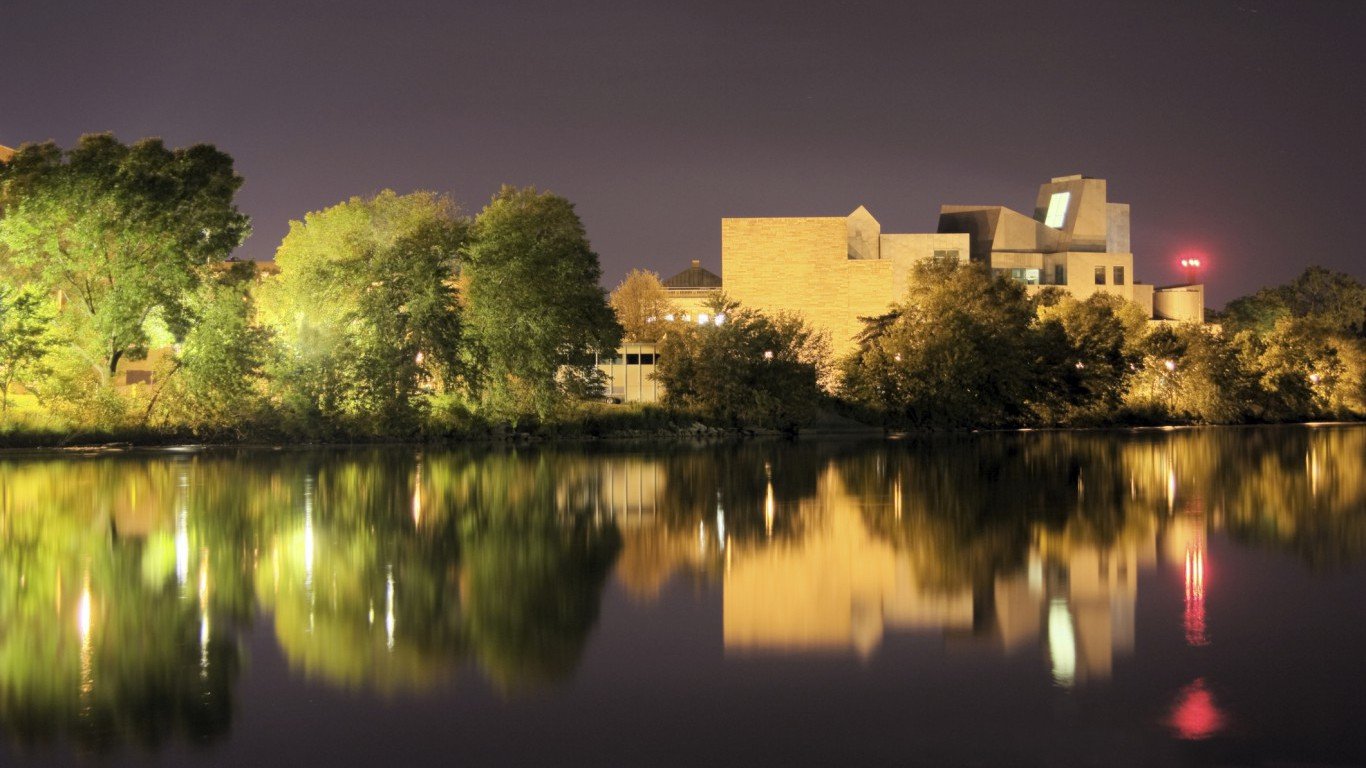
10. Minnesota
> Pct. of adults with at least a bachelor’s degree: 34.7%
> Pct. of adults with at least a high school diploma: 92.8%
> 2015 median household income: $63,488 (12th highest)
> Median earnings for bachelor degree holders: $51,601 (13th highest)
In Minnesota, 34.7% of adults have at least a bachelor’s degree, a larger share than the 30.6% of American adults with similar educational backgrounds. States with high college attainment rates tend to have strong high school attainment as well. In Minnesota, 92.8% of adults have at least graduated from high school, the third highest in the country. Educational achievement tends to coincide with higher pay, and Minnesota is no exception. The typical household in the state earns $63,488 a year, about $8,000 more than the $55,775 national median household income.
11. Washington
> Pct. of adults with at least a bachelor’s degree: 34.2%
> Pct. of adults with at least a high school diploma: 90.8%
> 2015 median household income: $64,129 (10th highest)
> Median earnings for bachelor degree holders: $55,795 (7th highest)
Over the last year, the share of adults in Washington with at least a high school diploma rose from 90.4% to 90.8%, one of the highest educational attainment rates in the country. A college education goes a long way in Washington. The typical worker with a bachelor’s degree earns $55,795 a year, the seventh most in the nation and nearly $15,000 more than the median earnings for all workers in the state. College graduates are likely among state households earnings at least $200,000 annually. The 6.8% of households earnings such high incomes is one of the largest shares of any state.
[in-text-ad]

12. Illinois
> Pct. of adults with at least a bachelor’s degree: 32.9%
> Pct. of adults with at least a high school diploma: 88.6%
> 2015 median household income: $59,588 (18th highest)
> Median earnings for bachelor degree holders: $52,369 (10th highest)
In Illinois, 32.9% of adults have at least a bachelor’s degree, one of the larger shares nationwide. Because of their high educational levels many Illinois residents likely qualify for high-paying jobs that often require college degrees. For example, 7.3% of workers are employed in a finance or insurance position, and 11.7% are employed in a professional, scientific, and management occupation, both larger shares than in the corresponding national workforce composition. The typical Illinois worker with a bachelor’s degree earns $52,369, the 10th highest such figure of any state, and about $12,200 more than the typical state individual earnings.
[recirclink id=352208]
13. Rhode Island
> Pct. of adults with at least a bachelor’s degree: 32.7%
> Pct. of adults with at least a high school diploma: 87.7%
> 2015 median household income: $58,073 (19th highest)
> Median earnings for bachelor degree holders: $50,880 (15th highest)
Over the last year, the share of adults in Rhode Island with at least a bachelor’s degree rose from 30.4% to 32.7%, one of the largest shares in the country today. With more college-educated adults, more workers likely quality for better-paying jobs. Rhode Island’s unemployment rate fell from 7.7% in 2014 to 6.0% in 2015, the most substantial improvement of any state in that time other than Michigan. The median household income in the state also increased from $54,978 in 2014 to $58,073 a year, one of the higher incomes of any state.
14. California
> Pct. of adults with at least a bachelor’s degree: 32.3%
> Pct. of adults with at least a high school diploma: 82.2%
> 2015 median household income: $64,500 (9th highest)
> Median earnings for bachelor degree holders: $57,282 (5th highest)
In California, 32.3% of adults have at least a bachelor’s degree, one of the highest educational attainment rates in the country. While strong college attainment rates tend to coincide with strong high school attainment, in California just 82.2% of adults have a high school diploma, the smallest share of any state. The high college attainment rate in California may largely be the result of a large volume of college graduates moving to the state. The typical college graduate in the state earns $57,282 annually, the fifth most of any state and nearly $20,000 more than California residents of all educational backgrounds.
[nativounit]
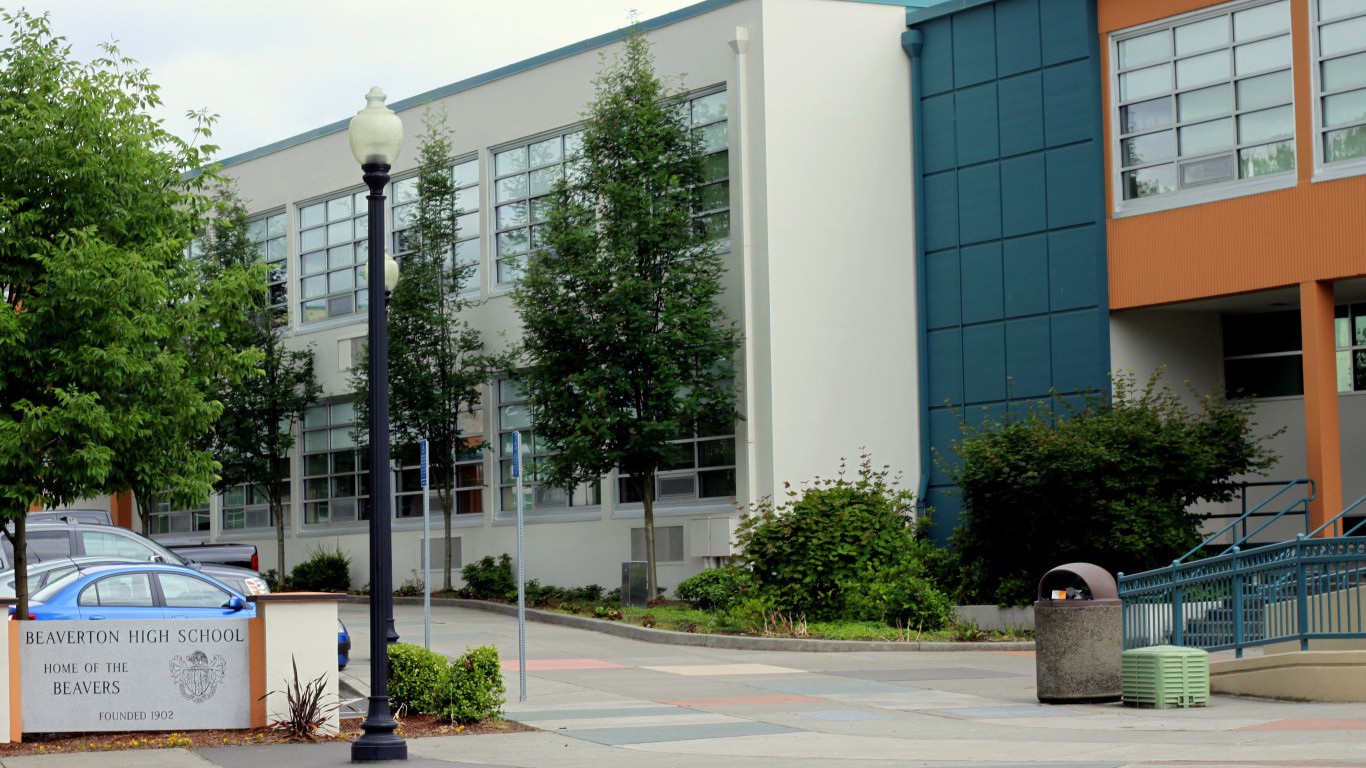 15. Oregon
15. Oregon
> Pct. of adults with at least a bachelor’s degree: 32.2%
> Pct. of adults with at least a high school diploma: 90.0%
> 2015 median household income: $54,148 (25th lowest)
> Median earnings for bachelor degree holders: $44,049 (12th lowest)
In Oregon, 32.2% of adults have at least a bachelor’s degree compared to 30.6% of American adults with similar educational attainment. While higher levels of education tend to lead to higher incomes, in Oregon the typical college graduate earns just $44,049 a year, about $7,000 less than the typical American with a bachelor’s degree. One reason for the relatively low earnings among college graduates in Oregon may be the relatively large share of unemployed workers in the state. At 5.7%, Oregon’s unemployment rate is among the higher jobless rates in the country.

16. Utah
> Pct. of adults with at least a bachelor’s degree: 31.8%
> Pct. of adults with at least a high school diploma: 91.5%
> 2015 median household income: $62,912 (13th highest)
> Median earnings for bachelor degree holders: $46,255 (22nd lowest)
In Utah, 31.8% of adults have at least a bachelor’s degree, one of the higher such shares in the country. States with high college attainment rates tend to have strong high school attainment as well. In Utah, 91.5% of adults have at least graduated from high school, the 10th highest in the country. Some college graduates in the state may work in professional, scientific, and management occupations, which are high paying and often require college degrees. In Utah, such professions account for 11.9% of the workforce — one of the largest shares of any state.
[in-text-ad]
17. Kansas
> Pct. of adults with at least a bachelor’s degree: 31.7%
> Pct. of adults with at least a high school diploma: 90.3%
> 2015 median household income: $53,906 (24th lowest)
> Median earnings for bachelor degree holders: $46,436 (24th lowest)
In Kansas, 31.7% of adults have at least a bachelor’s degree, a somewhat larger share than the 30.6% of Americans with similar educational attainment. While higher educational attainment tends to lead to higher incomes, the typical Kansas household earns about $2,000 less than the typical household nationwide.
[wallst_email_signup]

18. Hawaii
> Pct. of adults with at least a bachelor’s degree: 31.4%
> Pct. of adults with at least a high school diploma: 90.9%
> 2015 median household income: $73,486 (2nd highest)
> Median earnings for bachelor degree holders: $46,167 (20th lowest)
In Hawaii, 31.4% of adults have at least a bachelor’s degree, a larger share than most states. One would expect Hawaii’s college attainment rate to be much higher given that its high school attainment rate, at nearly 91%, is one of the highest of all states. It is possible that poor financial incentives the state fail to attract and keep college graduates. Nearly 91% of Hawaiian adults have at least a high school diploma, one of the highest such figures.
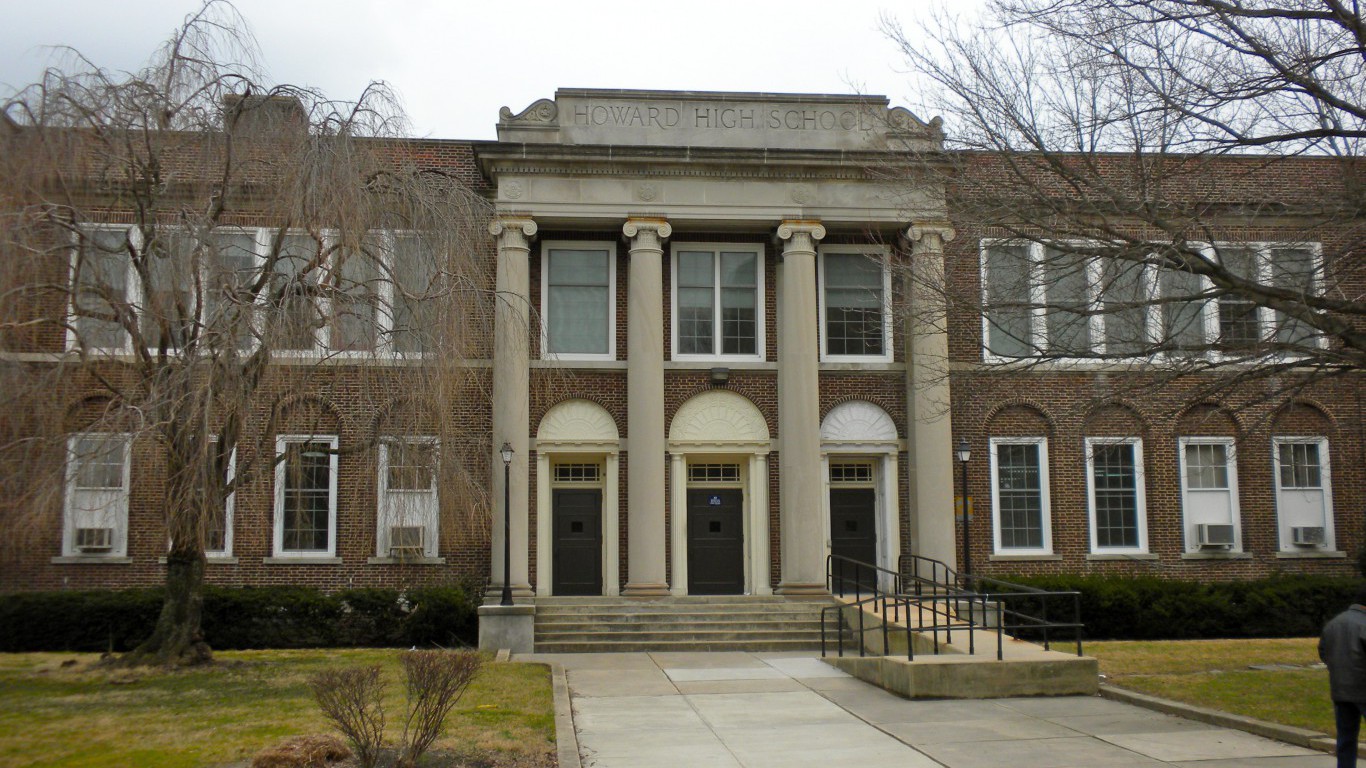
19. Delaware
> Pct. of adults with at least a bachelor’s degree: 30.9%
> Pct. of adults with at least a high school diploma: 88.9%
> 2015 median household income: $61,255 (14th highest)
> Median earnings for bachelor degree holders: $52,261 (11th highest)
Of adults in Delaware, 30.9% have at least a bachelor’s degree, roughly equivalent to the 30.6% national college attainment rate. While the state’s educational attainment rate is similar to the national one, the typical Delaware household earns roughly $5,500 more than the typical American household. One reason for the relatively high incomes may be the large share of workers in high-paying fields that often require college degrees. Nearly one in 10 Delaware workers are employed in finance and insurance fields, the highest such proportion of any state.
[nativounit]

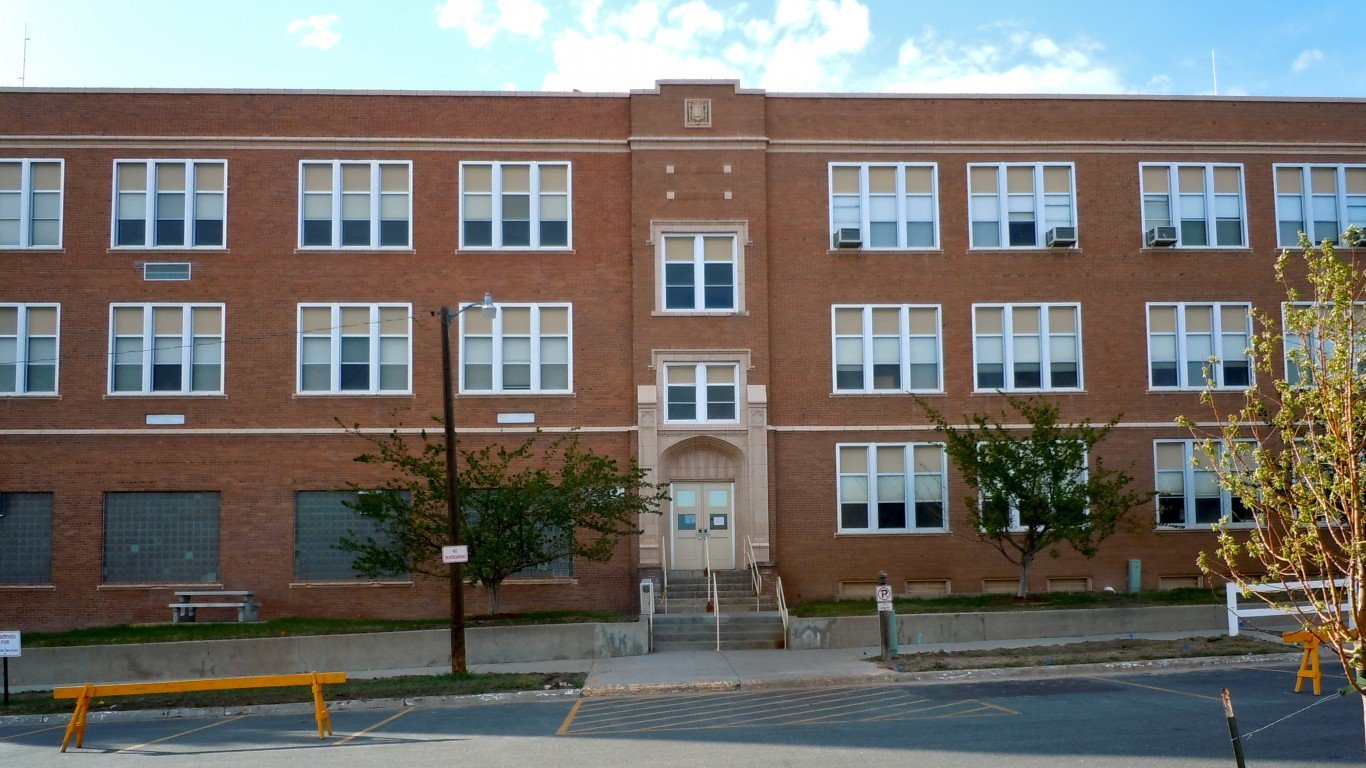
20. Montana
> Pct. of adults with at least a bachelor’s degree: 30.6%
> Pct. of adults with at least a high school diploma: 93.5%
> 2015 median household income: $49,509 (14th lowest)
> Median earnings for bachelor degree holders: $39,292 (the lowest)
In both Montana and the nation as a whole, 30.6% of adults have at least a bachelor’s degree. The typical college graduate in Montana earns just $39,292 a year, the least of any state and only $7,444 more than the median earnings for all educational backgrounds in Montana. One would expect Montana’s college attainment rate to be much higher given that its high school attainment rate, at nearly 94%, is one of the highest of all states. It is likely that due to poor financial incentives college graduates leave the state to find better-paying jobs elsewhere, or are less likely to move to the state.
21. Nebraska
> Pct. of adults with at least a bachelor’s degree: 30.2%
> Pct. of adults with at least a high school diploma: 91.0%
> 2015 median household income: $54,996 (24th highest)
> Median earnings for bachelor degree holders: $46,833 (24th highest)
In Nebraska, 30.2% of adults have at least a bachelor’s degree, slightly less than the 30.6% national attainment rate. Despite similar educational attainment, the typical college graduate in Nebraska earns roughly $4,000 less than the typical American college graduate. The cost of living is relatively low in Nebraska, however, and college graduates may be able to afford lifestyles similar to those in the rest of the country.
[in-text-ad]
22. Maine
> Pct. of adults with at least a bachelor’s degree: 30.1%
> Pct. of adults with at least a high school diploma: 91.7%
> 2015 median household income: $51,494 (21st lowest)
> Median earnings for bachelor degree holders: $41,214 (4th lowest)
In Maine, 30.1% of adults have at least a bachelor’s degree, slightly less than the 30.6% national share. While Maine’s 91.7% high school attainment rate is the seventh highest in the country, the state’s economic prospects may not attract many college graduates to the area. The typical worker with a bachelor’s degree in Maine earns just $41,214 a year, the fourth lowest of any state. Also, just 8.3% of Maine workers hold high-paying professional, scientific, and management positions, one of the smaller shares in the country.
[nativounit]
23. Georgia
> Pct. of adults with at least a bachelor’s degree: 29.9%
> Pct. of adults with at least a high school diploma: 86.1%
> 2015 median household income: $51,244 (19th lowest)
> Median earnings for bachelor degree holders: $49,696 (21st highest)
Roughly 30% of Georgia adults have at least a bachelor’s degree, slightly less than the national share. The typical college graduate in Georgia earns $49,696 a year, also slightly less than the national median earnings for Americans with a bachelor’s degree. While Georgians share similar educational outcomes to the country as a whole, the state is one of the poorest in the nation. The 17.0% poverty rate is the ninth highest in the country, and the 8.0% of households earning less than $10,000 a year is one of the larger shares of any state.
24. Pennsylvania
> Pct. of adults with at least a bachelor’s degree: 29.7%
> Pct. of adults with at least a high school diploma: 89.7%
> 2015 median household income: $55,702 (21st highest)
> Median earnings for bachelor degree holders: $50,791 (16th highest)
The college attainment rate remained unchanged in most states last year. In Pennsylvania, however, the share of adults with at least a bachelor’s degree rose slightly from 29.0% to its current level of 29.7%. Educational attainment tends to reflect incomes in a state, and in addition to having slightly below average college attainment, income levels in Pennsylvania are also slightly below the median.
[recirclink id=351971]
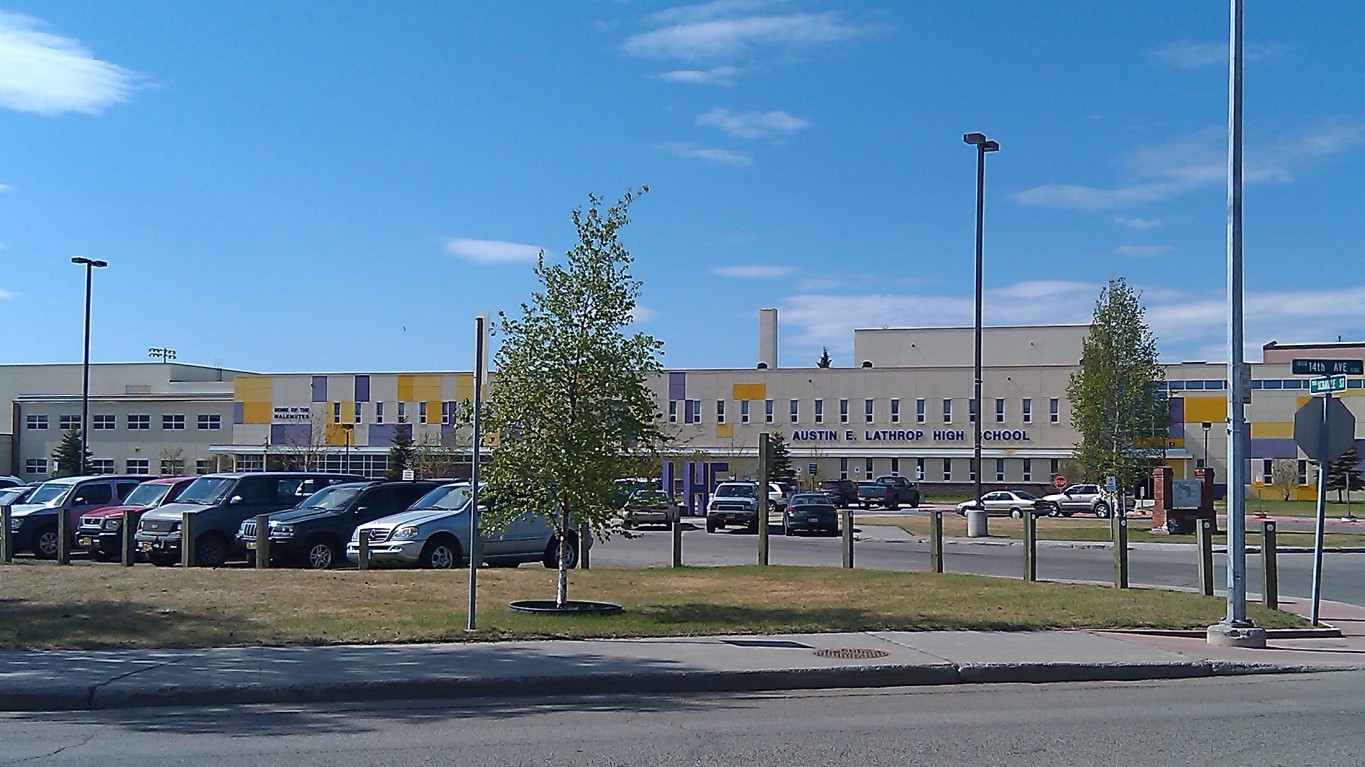
25. Alaska
> Pct. of adults with at least a bachelor’s degree: 29.7%
> Pct. of adults with at least a high school diploma: 92.6%
> 2015 median household income: $73,355 (3rd highest)
> Median earnings for bachelor degree holders: $52,885 (9th highest)
The percentage of Alaskan adults who have at least a bachelor’s degree increased by 1.7 percentage points last year, one of the largest such growths of any state. Still, at 29.7%, the state’s college attainment rate is slightly below the national rate. Unlike most states where people are less likely to have a bachelor’s degree than adults nationwide, Alaskans are quite wealthy. The median household income of $73,355 is the third highest in the nation.
26. North Carolina
> Pct. of adults with at least a bachelor’s degree: 29.4%
> Pct. of adults with at least a high school diploma: 86.6%
> 2015 median household income: $47,830 (10th lowest)
> Median earnings for bachelor degree holders: $46,171 (21st lowest)
The share of North Carolina’s adults with a bachelor’s degree increased by 0.7 percentage points last year to 29.7%, but it still falls short of the national corresponding rate of 30.6%. The state is similarly behind the nation in high school attainment, as 86.6% of North Carolina’s adults have a high school diploma compared to 87.1% of Americans 25 and over. For a state with just slightly lower educational attainment rates compared to nationwide rates, North Carolina has disproportionately lower incomes. The typical household earns $47,830 annually, the 10th lowest median household income among states.
[in-text-ad]
27. North Dakota
> Pct. of adults with at least a bachelor’s degree: 29.1%
> Pct. of adults with at least a high school diploma: 92.5%
> 2015 median household income: $60,557 (16th highest)
> Median earnings for bachelor degree holders: $45,787 (17th lowest)
Even with recent signs of weakness due to depressed oil prices, North Dakota continues to have among the most favorable job markets in the country. The state’s 2015 unemployment rate of 2.7% was the lowest of any state. The energy boom that largely explains North Dakota’s recent economic growth, and has offered jobs that do not typically require a bachelor’s degree. Even so, North Dakota’s college attainment rate of 29.1% rose significantly from last year while in most states education levels remained flat.
[nativounit]
28. Florida
> Pct. of adults with at least a bachelor’s degree: 28.4%
> Pct. of adults with at least a high school diploma: 87.6%
> 2015 median household income: $49,426 (13th lowest)
> Median earnings for bachelor degree holders: $42,714 (10th lowest)
Florida’s college attainment increased by 1.1 percentage point last year, more than in most states. Still, the state’s rate remains more than 2 percentage points below the national rate of 30.6%. College degrees tend to create opportunities for higher incomes, but the typical Floridian worker with a bachelor’s degree earns $42,714 a year, more than $8,000 below the median earnings for college graduates nationwide. Compared to earnings of state residents with any education background, however, Floridian bachelor’s degree holders earn $11,052 more a year.

29. Wisconsin
> Pct. of adults with at least a bachelor’s degree: 28.4%
> Pct. of adults with at least a high school diploma: 91.4%
> 2015 median household income: $55,638 (23rd highest)
> Median earnings for bachelor degree holders: $47,383 (22nd highest)
Because one requires the other, states tend to rank similarly compared to the nation in both college and high school attainment among adults. Wisconsin breaks from this trend, however. The state’s college attainment rate is 2.2 percentage points below the national share of 30.6%, while its high school attainment rate of 91.4% is more than 4 percentage points above the national rate. While both educational attainment rates increased in a number of states, they remained effectively unchanged in Wisconsin.
[wallst_email_signup]
30. Texas
> Pct. of adults with at least a bachelor’s degree: 28.4%
> Pct. of adults with at least a high school diploma: 82.4%
> 2015 median household income: $55,653 (22nd highest)
> Median earnings for bachelor degree holders: $51,887 (12th highest)
Even for a state with a relatively low college attainment rate, the percentage of adults with at least a high school diploma, at 82.4%, is unusually low. Only California has a lower high school attainment rate. High educational attainment tends to mirror other encouraging socioeconomic measures. However, the relatively low percentage of adults in Texas with at least a bachelor’s degree and the state’s low health insurance coverage do not fit this pattern. The 17.1% of uninsured residents is by far the highest such rate of any state.

31. Missouri
> Pct. of adults with at least a bachelor’s degree: 27.8%
> Pct. of adults with at least a high school diploma: 88.9%
> 2015 median household income: $50,238 (15th lowest)
> Median earnings for bachelor degree holders: $45,607 (16th lowest)
Missouri’s high school and bachelor’s attainment levels effectively stayed the same last year. The state remains several points below the corresponding national rates. States with fewer adults holding college degrees also tend to have lower incomes, and Missouri is no exception. The typical state household income of $50,238 a year is more than $5,000 below the national median household income of $55,775.
[in-text-ad]
32. Michigan
> Pct. of adults with at least a bachelor’s degree: 27.8%
> Pct. of adults with at least a high school diploma: 90.1%
> 2015 median household income: $51,084 (18th lowest)
> Median earnings for bachelor degree holders: $49,839 (19th highest)
Michigan’s annual unemployment rate fell by 1.9 percentage points in 2015 compared to 2014, the largest improvement of any state. The 2015 jobless rate of 5.4% was still just in line with the national rate of 5.3%. The percentage of Michigan adults with at least a bachelor’s degree also increased slightly over that time. At 27.8%, the college attainment rate still trails the national percentage of 30.6%.
[recirclink id=351872]

33. Arizona
> Pct. of adults with at least a bachelor’s degree: 27.7%
> Pct. of adults with at least a high school diploma: 86.1%
> 2015 median household income: $51,492 (20th lowest)
> Median earnings for bachelor degree holders: $49,801 (20th highest)
At 27.7%, Arizona’s share of adults with a bachelor’s degree is nearly 3 percentage points below the national rate of 30.6%. For many, a college degree creates opportunities to higher paying jobs, and Arizona is a case in point. The typical Arizona worker earns $35,016 a year. The median earnings of those workers who have a bachelor’s degree, however, is nearly $50,000 a year. That close to $15,000 difference is one of the largest of any state.
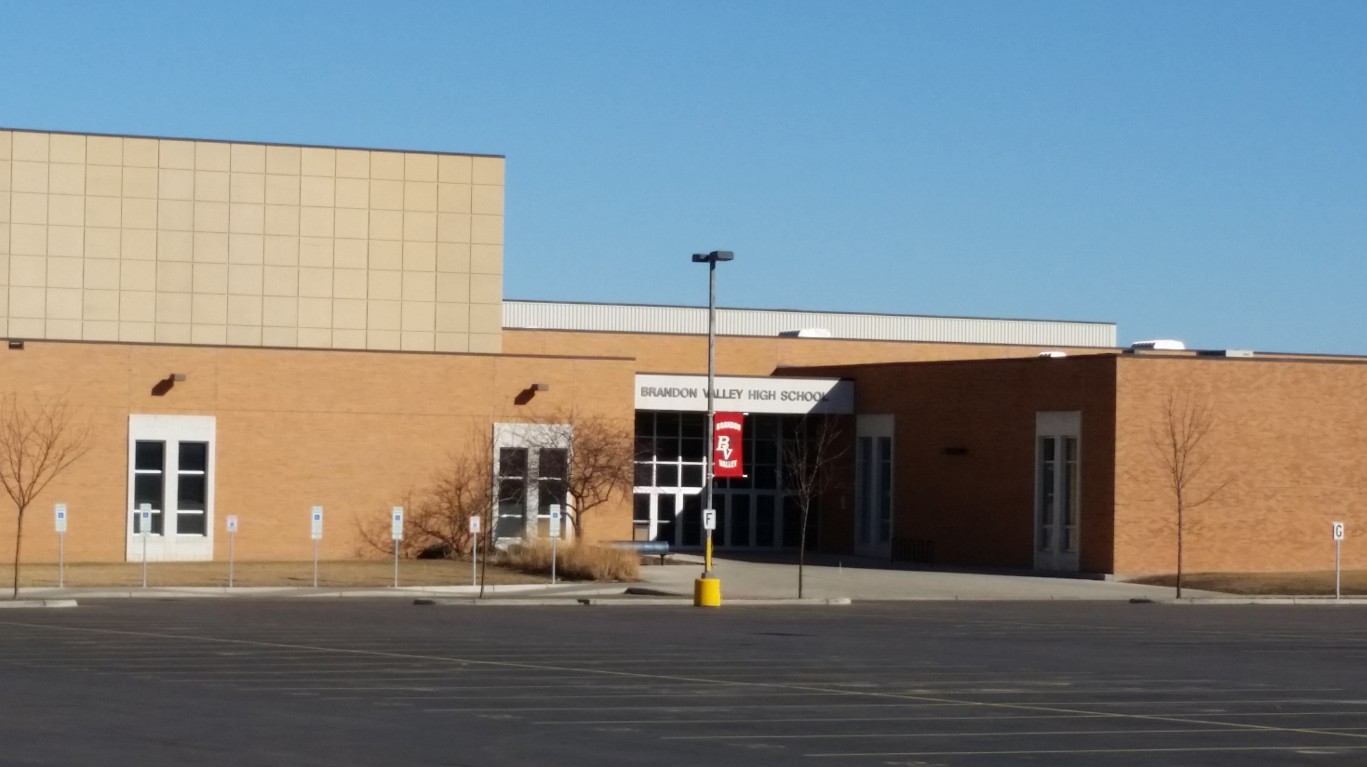
34. South Dakota
> Pct. of adults with at least a bachelor’s degree: 27.5%
> Pct. of adults with at least a high school diploma: 91.1%
> 2015 median household income: $53,017 (23rd lowest)
> Median earnings for bachelor degree holders: $41,273 (5th lowest)
College level educational attainment tends to be higher in states where earnings for workers with higher education are also relatively high. In South Dakota, the typical bachelor’s degree holder earns $41,273 annually, only around $7,000 more than the median wage of a typical South Dakota worker with any level of education. The difference is nearly the smallest of any state, which could partially explain the state’s relatively low college attainment rate — there appears to be relatively little to be gained, at least financially, from a college degree.
[nativounit]
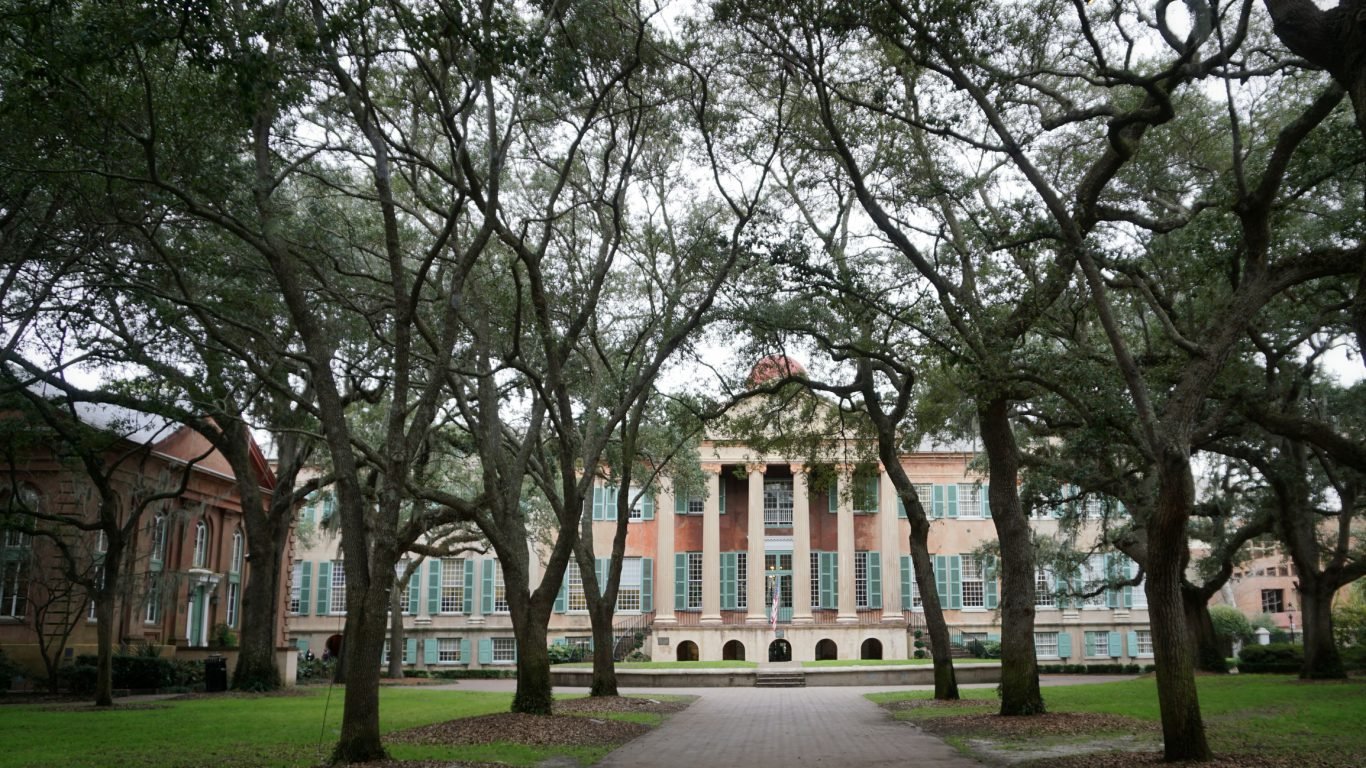
35. South Carolina
> Pct. of adults with at least a bachelor’s degree: 26.8%
> Pct. of adults with at least a high school diploma: 86.3%
> 2015 median household income: $47,238 (8th lowest)
> Median earnings for bachelor degree holders: $44,151 (13th lowest)
Just 26.8% of South Carolina’s adults have a bachelor’s degree, 3.8 percentage points below the national figure. Educational attainment often reflects the types of jobs supported by a state economy. In South Carolina, a disproportionately high 13.9% of state workers are employed in retail, a sector that is much less likely to require a college degree as a prerequisite for employment. The typical person with a college degree tends to earn more, and those workers in the state who have a degree earn roughly $12,000 more a year than the typical state worker with any education level.
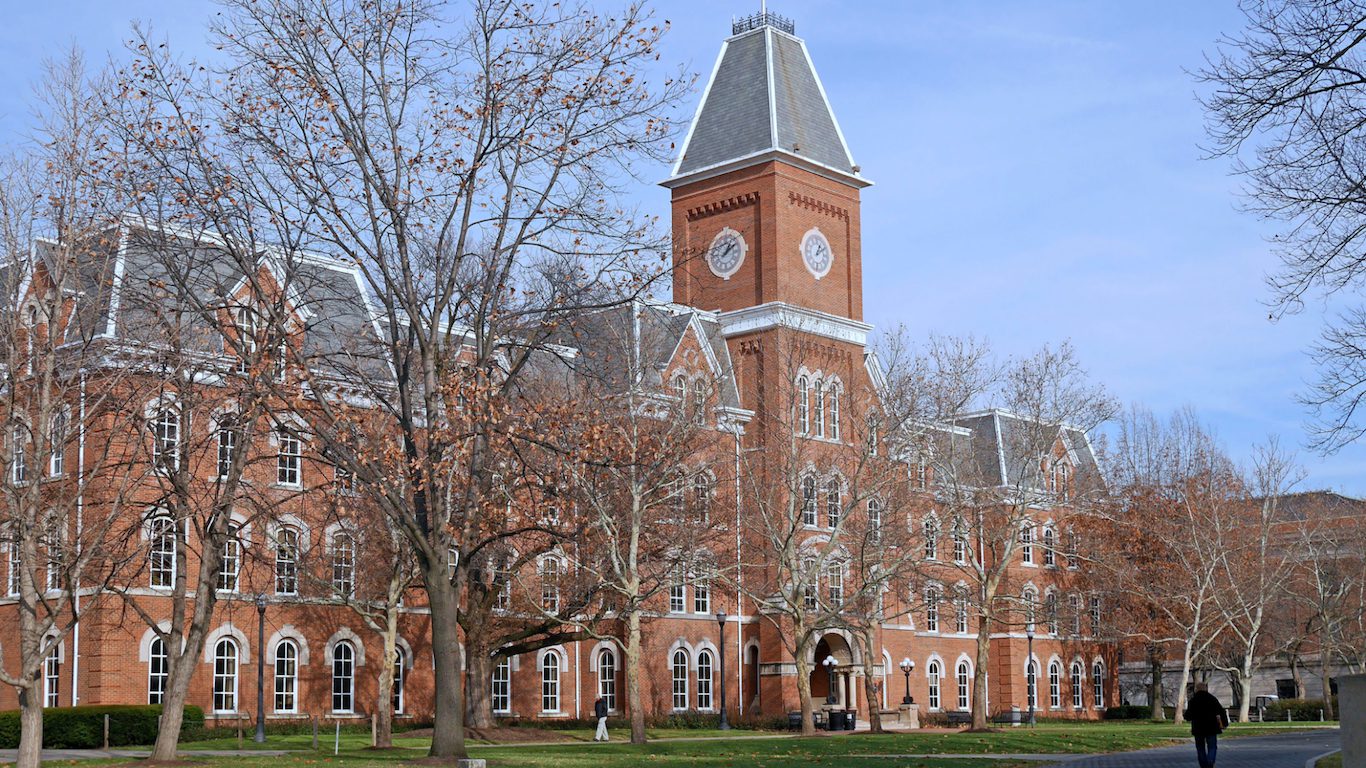
36. Ohio
> Pct. of adults with at least a bachelor’s degree: 26.8%
> Pct. of adults with at least a high school diploma: 89.7%
> 2015 median household income: $51,075 (17th lowest)
> Median earnings for bachelor degree holders: $50,191 (18th highest)
The median earnings for an individual Ohio worker and the median income for Ohio households are each below the corresponding national figures. However, the typical earnings for a bachelor’s degree holder in the state is $50,191 a year, higher than in most states. However, the percentage of adults with at least a bachelor’s degree, at 26.8%, is among the lower rates.
[in-text-ad]
37. Iowa
> Pct. of adults with at least a bachelor’s degree: 26.8%
> Pct. of adults with at least a high school diploma: 91.7%
> 2015 median household income: $54,736 (25th highest)
> Median earnings for bachelor degree holders: $46,518 (25th lowest)
Not only is Iowa’s college attainment rate one of the lower rates in the nation, but also it fell last year — the only state to report such a decline. States with relatively low levels of higher education attainment usually share certain social and economic characteristics, including low health insurance coverage. Just 5% of Iowans go without health insurance, however, nearly the lowest uninsured rate of any state.
[wallst_email_signup]

38. New Mexico
> Pct. of adults with at least a bachelor’s degree: 26.5%
> Pct. of adults with at least a high school diploma: 84.6%
> 2015 median household income: $45,382 (6th lowest)
> Median earnings for bachelor degree holders: $42,423 (8th lowest)
New Mexico’s college attainment rate of 26.5% is well below the nationwide rate. Because of the relationship between the two measures, states tend to rank similarly in both college and high school attainment. However, even considering its low share of adults with college degrees, New Mexico has a disproportionately low high school attainment rate. Just 84.6% of state adults have a high school diploma, the fifth lowest share in the country. States with lower educational attainment tend to have larger employment representation in industries that prominently feature low-skill work. New Mexico has above average shares of workers employed in the construction industry, as well as in agriculture.
39. Wyoming
> Pct. of adults with at least a bachelor’s degree: 26.2%
> Pct. of adults with at least a high school diploma: 92.2%
> 2015 median household income: $60,214 (17th highest)
> Median earnings for bachelor degree holders: $46,092 (19th lowest)
The educational attainment of a population often reflects the employment composition of the area as some industries have a greater demand for college graduates than others. This phenomenon likely partially explains Wyoming’s relatively low 26.2% share of adults with a bachelor’s degree. Those employed in the construction and transportation industries — each of which are less likely to require a college degree for employment — make up a relatively large share of Wyoming’s workforce compared to other states.
[nativounit]

40. Idaho
> Pct. of adults with at least a bachelor’s degree: 26.0%
> Pct. of adults with at least a high school diploma: 90.0%
> 2015 median household income: $48,275 (11th lowest)
> Median earnings for bachelor degree holders: $42,661 (9th lowest)
As is the case in most states with low educational attainment rates, Idaho residents are not especially wealthy. The typical household in Idaho earns $48,275 annually, the typical worker earns $36,469 a year, and the typical college-educated worker earns $42,661 a year — each among the lowest incomes of any state.
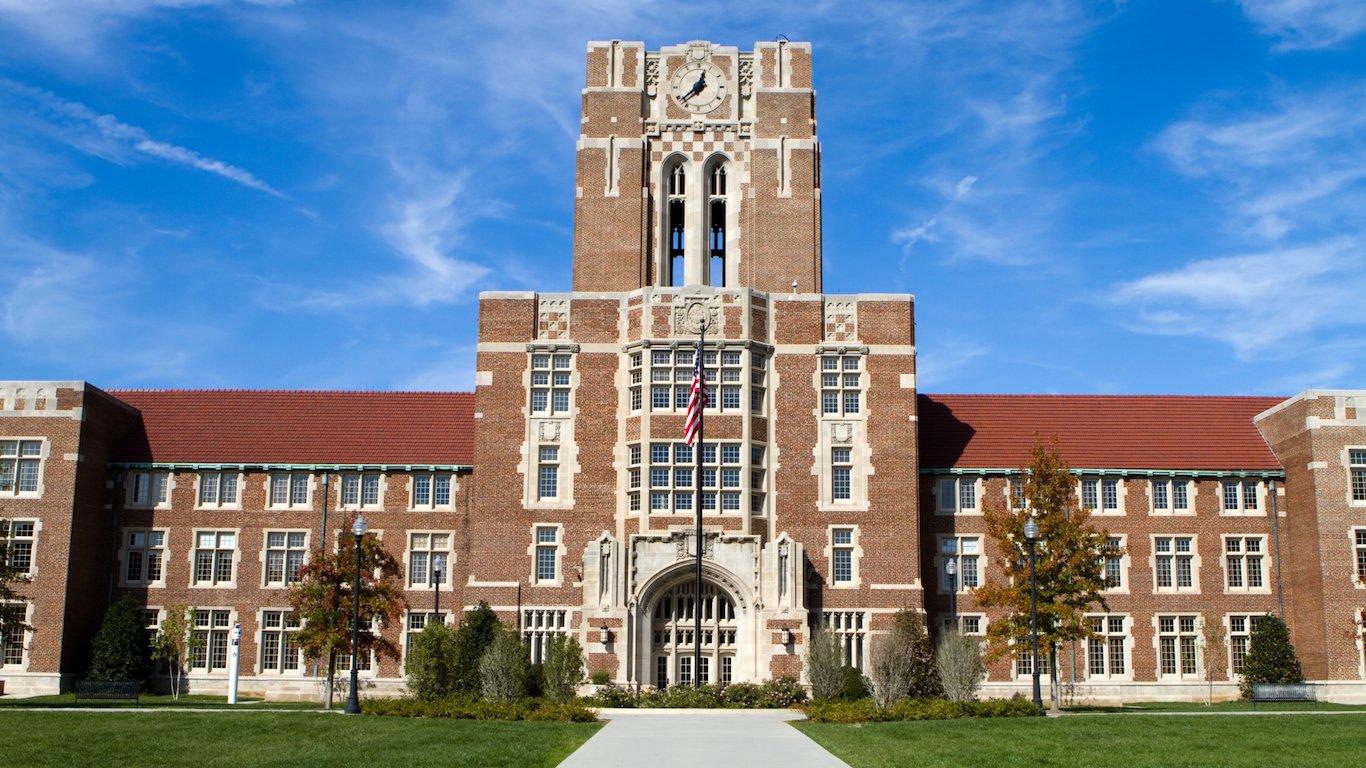
41. Tennessee
> Pct. of adults with at least a bachelor’s degree: 25.7%
> Pct. of adults with at least a high school diploma: 86.1%
> 2015 median household income: $47,275 (9th lowest)
> Median earnings for bachelor degree holders: $45,600 (15th lowest)
Tennessee’s college attainment rate remained effectively unchanged last year, and at 25.7% is 10th lowest of all states. Educational attainment often reflects the workforce composition of a given state. States with a disproportionately low share of adults who have earned a college degree tend to have more workers employed in low-skilled jobs that are less likely to require post high school training. Of Tennessee’s workers, 12.3% are employed in retail and 6.5% in the transportation and warehousing industry, each in the top five shares among all states. These two industries provide jobs that do not typically require a college degree.
[in-text-ad]

42. Indiana
> Pct. of adults with at least a bachelor’s degree: 24.9%
> Pct. of adults with at least a high school diploma: 88.2%
> 2015 median household income: $50,532 (16th lowest)
> Median earnings for bachelor degree holders: $46,884 (23rd highest)
Indiana’s adults are slightly more likely than American adults to have graduated from high school. However, just 24.9% of Indiana’s adults have a college degree, more than 5 percentage points lower than the national figure of 30.6%. States with lower college attainment rates tend to share certain characteristics, including generally lower wages and, consequently, lower home values. Indiana’s median household income of $50,532 a year is more than $5,000 below the median income nationwide. The typical Indiana home is valued at $131,000, about $63,000 below the national median home value.
[nativounit]
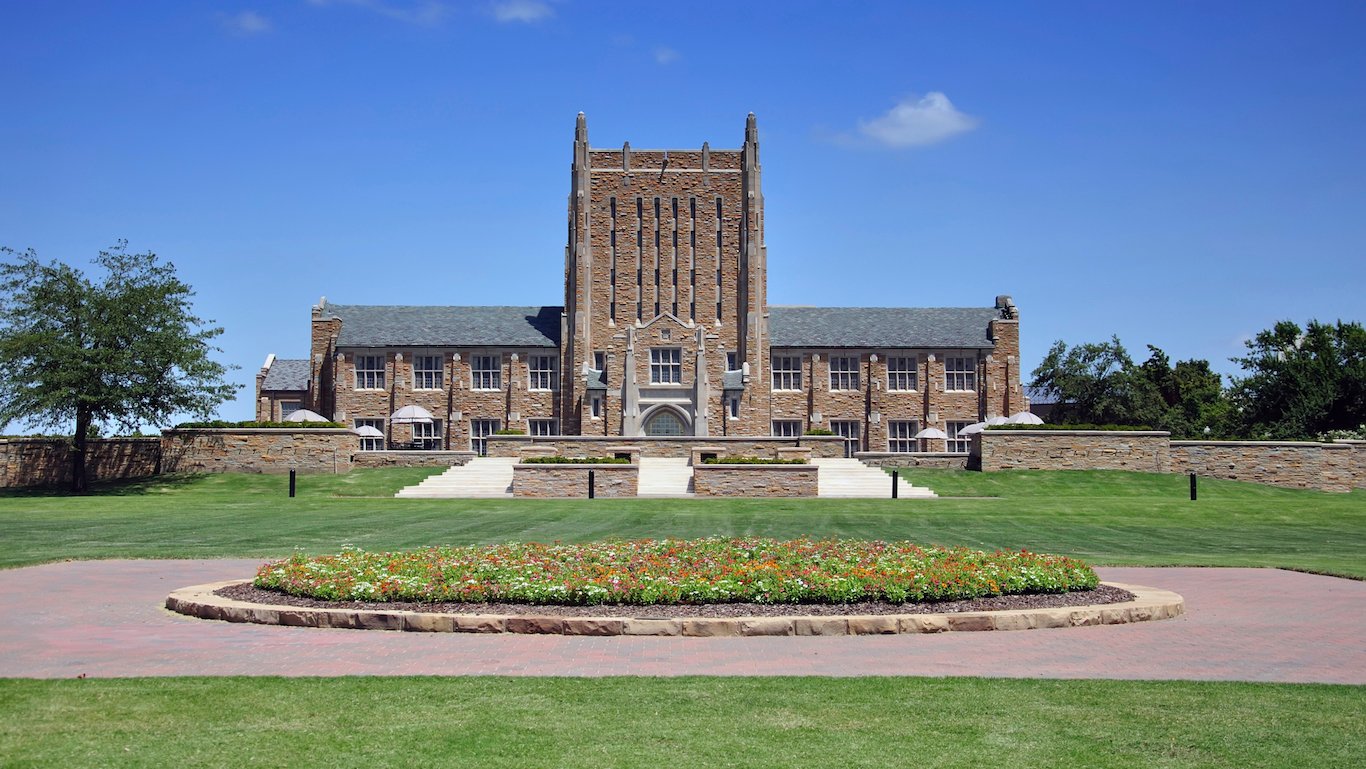
43. Oklahoma
> Pct. of adults with at least a bachelor’s degree: 24.6%
> Pct. of adults with at least a high school diploma: 87.3%
> 2015 median household income: $48,568 (12th lowest)
> Median earnings for bachelor degree holders: $42,195 (7th lowest)
Fewer than one in every four Oklahoma adults have a bachelor’s degree versus the national proportion of close to one in three. Most states with the lowest bachelor attainment rates also have relatively high unemployment rates. For job seekers without college degrees, a certain number of opportunities are simply inaccessible. Oklahoma’s job market does not mirror this trend, however. The state’s 2015 unemployment rate of 4.2% is well below the national jobless rate of 5.3%.
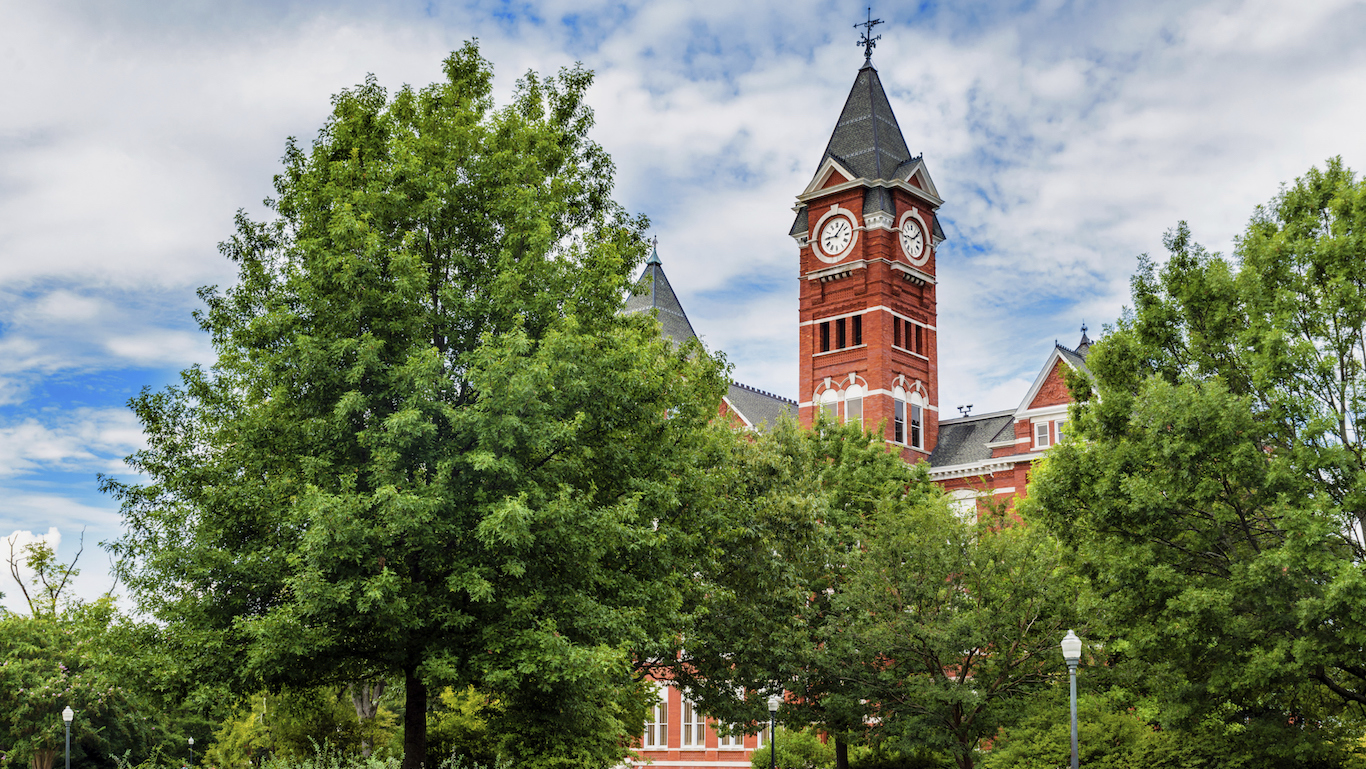
44. Alabama
> Pct. of adults with at least a bachelor’s degree: 24.2%
> Pct. of adults with at least a high school diploma: 84.9%
> 2015 median household income: $44,765 (4th lowest)
> Median earnings for bachelor degree holders: $46,740 (25th highest)
Alabama’s bachelor’s attainment rate increased slightly last year, from 23.5% in 2014 to 24.2% in 2015. However, Alabama remains the state with the seventh lowest bachelor’s attainment. Those relatively few Alabama adults who have a college degree benefit significantly, earning $46,740 a year, or $14,272 more than the statewide median earnings.
[recirclink id=351747]
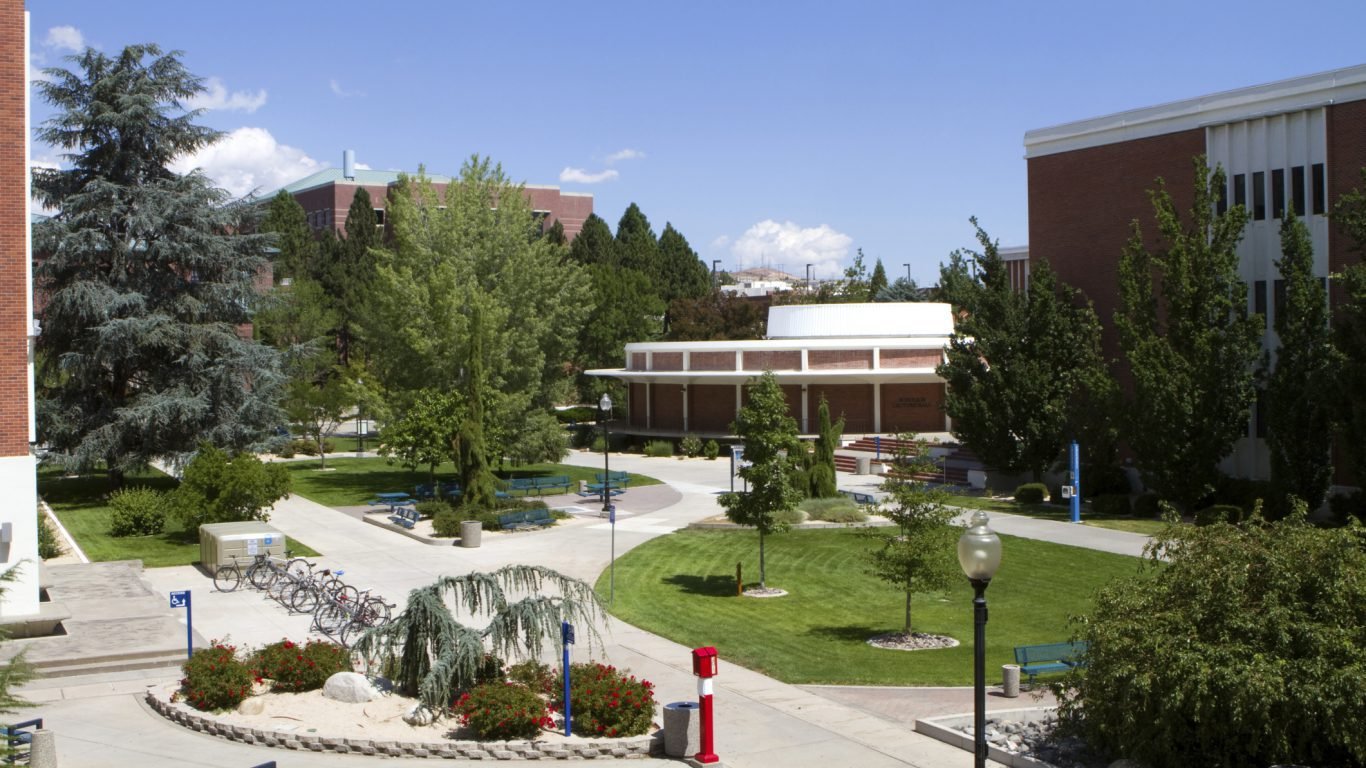
45. Nevada
> Pct. of adults with at least a bachelor’s degree: 23.6%
> Pct. of adults with at least a high school diploma: 85.6%
> 2015 median household income: $52,431 (22nd lowest)
> Median earnings for bachelor degree holders: $45,977 (18th lowest)
Nevada has by far the largest arts, entertainment and recreation, and accommodation and food services sector. The industry employs more than 25% of all workers in the state, in stark contrast with the less than 10% of workers employed by the industry nationwide. Jobs found in the sector do not typically require a college degree, which helps explain Nevada’s relatively low college attainment rate. At 23.6%, the rate is nearly the lowest in the country.
46. Kentucky
> Pct. of adults with at least a bachelor’s degree: 23.3%
> Pct. of adults with at least a high school diploma: 85.1%
> 2015 median household income: $45,215 (5th lowest)
> Median earnings for bachelor degree holders: $45,058 (14th lowest)
The share of adults in Kentucky with a bachelor’s degree increased by 1.1 percentage points last year, more than in most other states. This improvement, however, was not enough to move the state out of the bottom five for college attainment. Most states with low educational attainment rates share certain socioeconomic characteristics, including low incomes and high poverty, and this is certainly the case in Kentucky as well. The state’s poverty rate of 18.5% is the fifth highest in the country, and the median household income of $45,215 a year in the state is the fifth lowest.
[in-text-ad]

47. Louisiana
> Pct. of adults with at least a bachelor’s degree: 23.2%
> Pct. of adults with at least a high school diploma: 84.6%
> 2015 median household income: $45,727 (7th lowest)
> Median earnings for bachelor degree holders: $46,367 (23rd lowest)
The latest Census reveals broad social and economic improvements across the nation. For example, the national poverty rate fell fell consecutively for the first time since the Census began collecting these data through the American Community Survey in 2005. Poverty in Louisiana, on the other hand, did not decline meaningfully. Nearly 20% of people in the state live in poverty, roughly equal to 2014. Poverty creates a vicious circle. People living in poverty are less likely to pursue high education, which in turn would — in all probability — improve their incomes.
[nativounit]
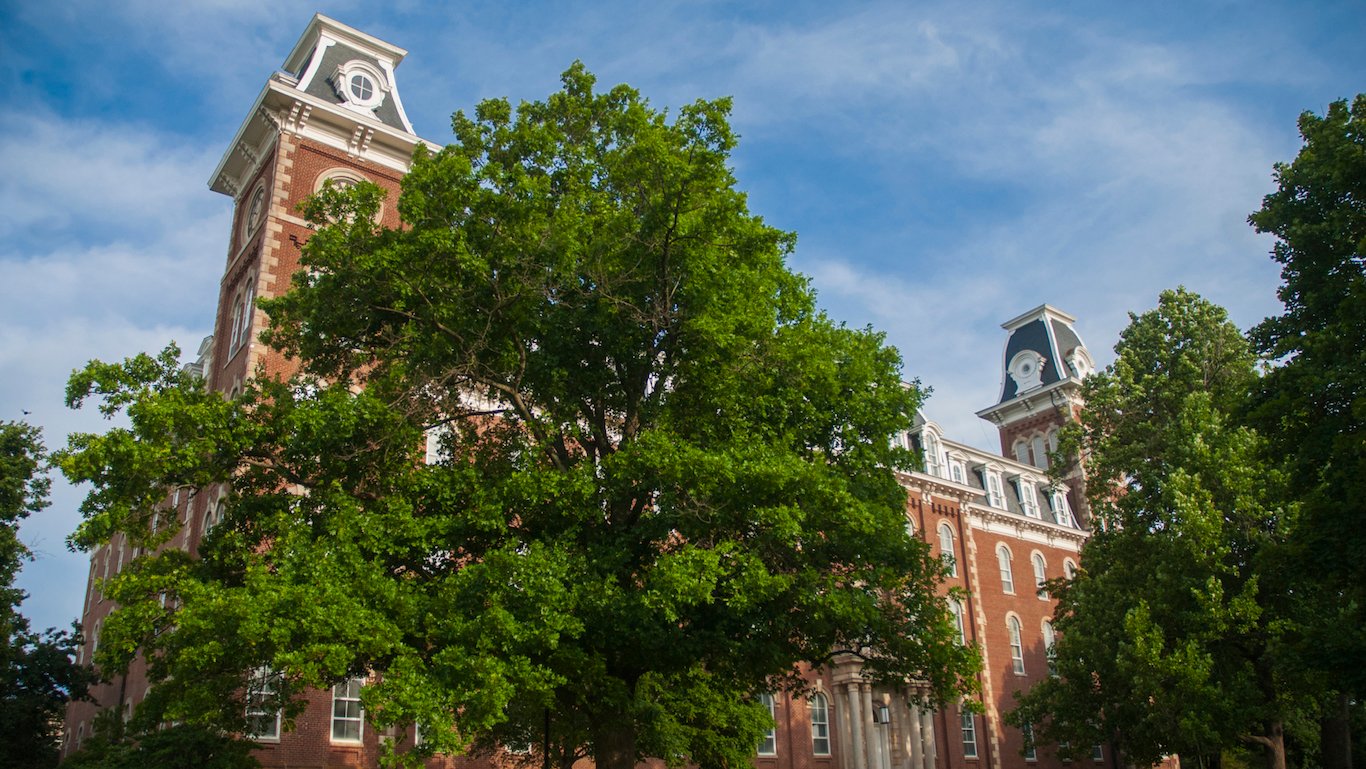
48. Arkansas
> Pct. of adults with at least a bachelor’s degree: 21.8%
> Pct. of adults with at least a high school diploma: 85.4%
> 2015 median household income: $41,995 (2nd lowest)
> Median earnings for bachelor degree holders: $42,828 (11th lowest)
Arkansas has the third lowest college attainment rate in the country at just 21.8%, close to 9 percentage points below the national rate. As is often the case, the state’s relatively small share of adults with a college degree is reflected in its low median income. The typical Arkansas household earns just $41,995 a year, the second lowest figure of any state and about $14,000 less than the national median income. States with fewer high-skilled workers tend to have a high share of low-skilled jobs. In Arkansas, 13.8% are employed in retail — an industry in which jobs do not typically require a college degree — the highest share of any state.
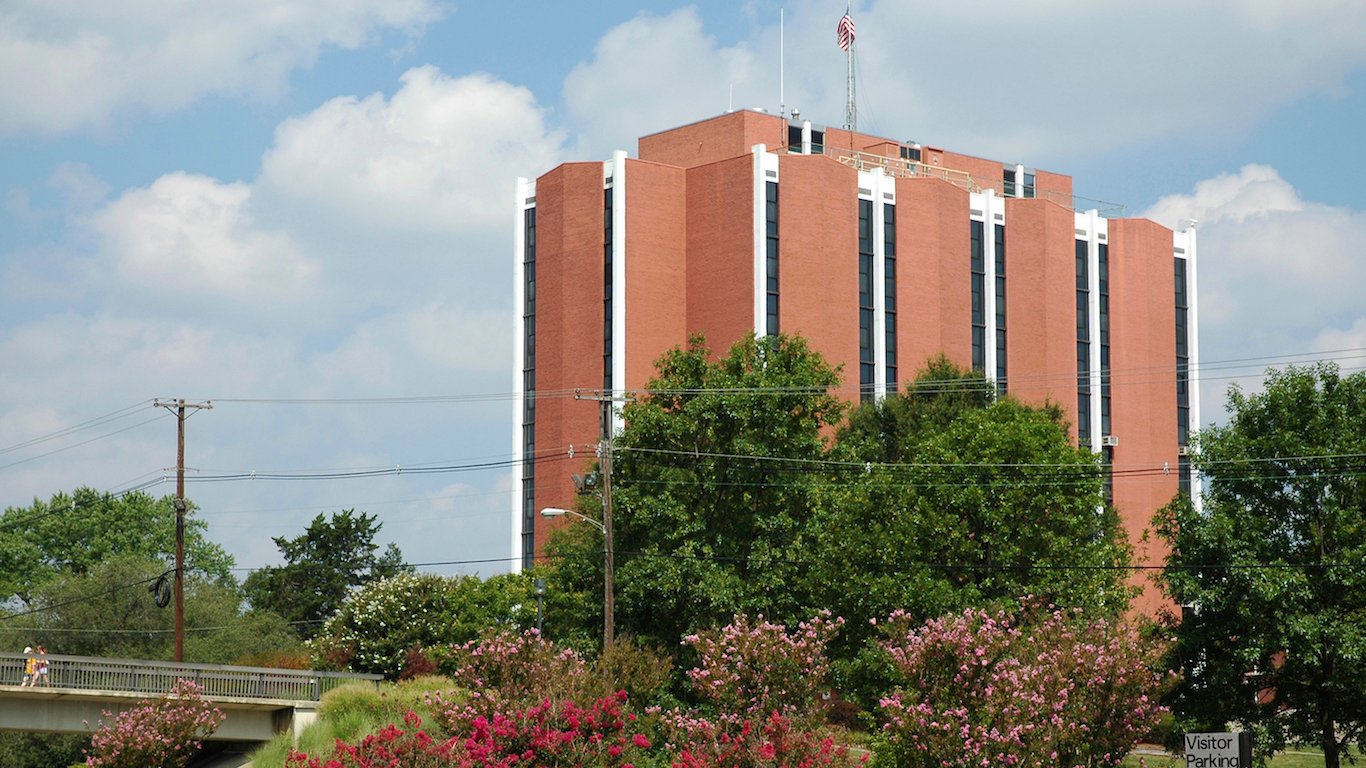
49. Mississippi
> Pct. of adults with at least a bachelor’s degree: 20.8%
> Pct. of adults with at least a high school diploma: 83.5%
> 2015 median household income: $40,593 (the lowest)
> Median earnings for bachelor degree holders: $39,960 (2nd lowest)
Only 20.8% of Mississippi’s adults have a bachelor’s degree, nearly 10 percentage points below the national college attainment rate of 30.6%. The state has a similarly low high school attainment rate, as just 83.5% of the state’s adults have a diploma. The state’s low college attainment rate may be at least in part due to the relatively small benefit it affords. On a national level, the typical college graduate earns $50,930 a year, or about $14,000 more than the typical American worker. In Mississippi, those with bachelor’s degrees earn less than $40,000 a year, or just $8,900 more than the typical Mississippi worker earnings, a smaller gap than in most states.
[wallst_email_signup]
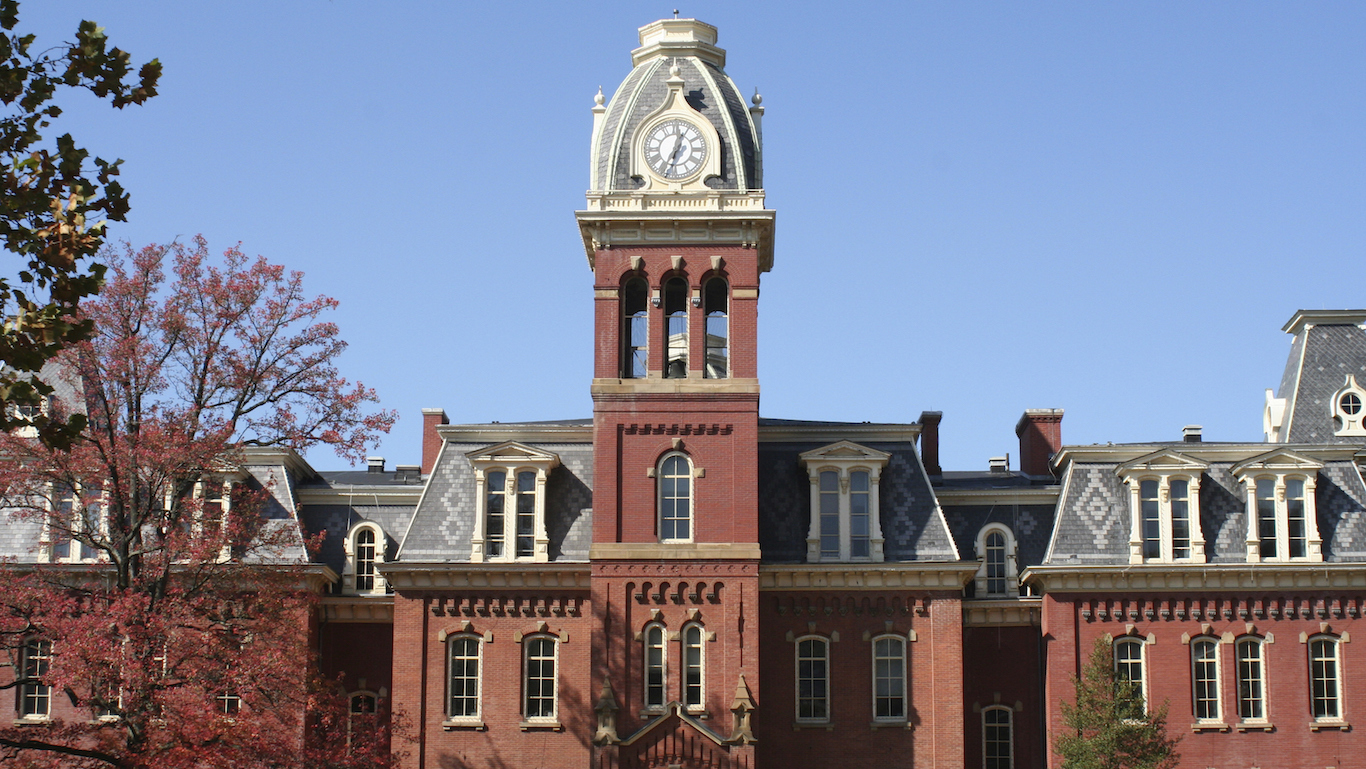
50. West Virginia
> Pct. of adults with at least a bachelor’s degree: 19.6%
> Pct. of adults with at least a high school diploma: 86.0%
> 2015 median household income: $42,019 (3rd lowest)
> Median earnings for bachelor degree holders: $41,512 (6th lowest)
Fewer than 20% of adults in West Virginia have a college degree, effectively unchanged from the 2014 share and the lowest college attainment rate of any state in the country. Residents with less than a college degree are considerably more likely to earn lower incomes than more educated residents — across states and within West Virginia. With the least educated workforce nationwide, the typical West Virginia worker earns $31,634 a year, and the typical household brings in $42,0219 annually — each among the lowest income levels of any state.
For West Virginia residents, while college level qualifications certainly help ensure higher wages, the advantage is smaller than in other states. The median wage for workers with a bachelor’s degree is $41,512 a year, the sixth lowest such income of any state but still about $10,000 more than the typical worker.
Contact [email protected] for any questions or corrections.