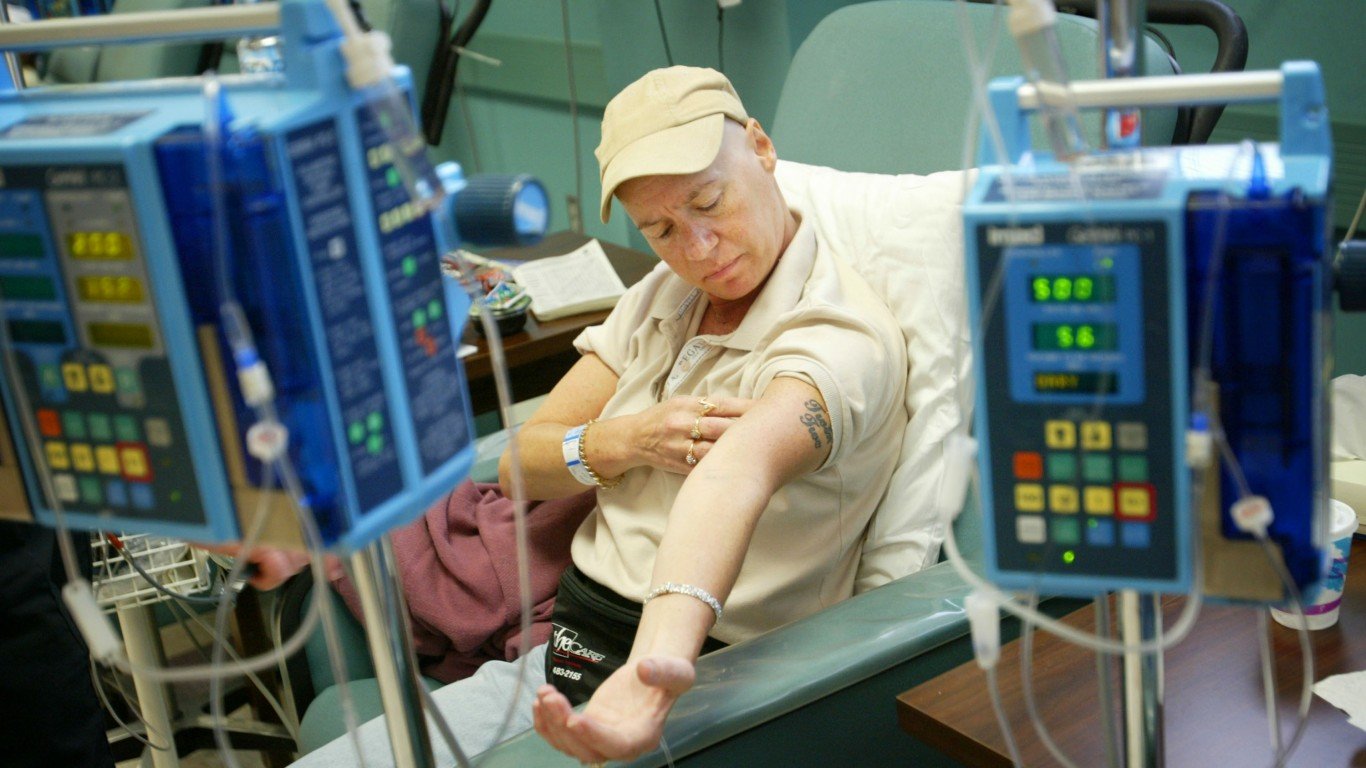
[cnxvideo id=”625490″ placement=”ros”]Skin cancer is the most common form of cancer in the United States. While death rates from melanoma have been stable or falling because of advancements in treatment and diagnosis, the number of new cases of skin cancer has been rising steadily for decades.
Cases of melanoma — one of the most common and deadly forms of skin cancer — doubled in the United States between 1982 and 2011. The annual cost of treating skin cancers was $8.1 billion from 2007 to 2011, more than twice the annual cost in the previous five years.
According to the National Cancer Institute, there will be an estimated 91,270 new cases of melanoma and 9,320 deaths from the disease nationwide in 2018, compared to 65,647 new cases and 9,128 deaths in 2011.
A number of geographical variables can change the risk of skin cancer considerably. According to a statement emailed to 24/7 Wall St. by the US Environmental Protection Agency, because UV radiation is stronger the less atmosphere it must travel through, the risk of increased exposure is higher closer to the equator, in the summer, and around noon.
In addition, according to the EPA: “the higher you are in the mountains, the less atmosphere there is between you and the sun, and UV exposure risk is higher the greater the elevation. Local factors also come into play, as clouds or trees might provide some shade from UV rays, but water, glass buildings, or white sand can reflect UV rays and increase people’s total UV exposure.”
The incidence of melanoma varies between states. To determine which states have the highest rates of melanoma, 24/7 reviewed data from the Centers for Disease Control and Prevention.
Click here to see the states with the most skin cancer.
While geographical variables can affect UV levels, different factors contribute to a state’s melanoma rate. Because more than 90% of melanoma cases are diagnosed in non-Hispanic whites, states with larger shares of light-skinned residents tend to report a greater incidence of melanoma. Nine of the 10 states with the highest rates of melanoma have populations with higher proportions of white residents than the nation as a whole. This is true for only four of the 10 states with the lowest rates of melanoma.
Exposure to ultraviolet light from the sun, particularly to the point of sunburn, increases the risk of melanoma. However, sunny, Southern states do not have higher rates of melanoma. This could be attributed to greater awareness in sunny areas to the risks and to how residents protect themselves from the sun, rather than how much time they spend in sunlight. For example, residents living in cloudier areas may not use sunscreen as much as a resident living in sunny areas, even though the majority of the ultraviolet radiation penetrates the clouds.
To identify the states with the highest rates of skin cancer, 24/7 Wall St. reviewed melanoma diagnosis and death rates per 100,000 people from the Centers for Disease Control and Prevention. Figures are for 2014, the most current available. Percentages of state populations who are white came from the U.S. Census Bureau’s 2016 American Community Survey.

50. Texas
> Annual skin cancer diagnoses: 12.6 per 100,000 residents
> Annual skin cancer death rate: 2.2 per 100,000 residents (4th lowest)
> White population: 42.0% (4th lowest)
[in-text-ad]
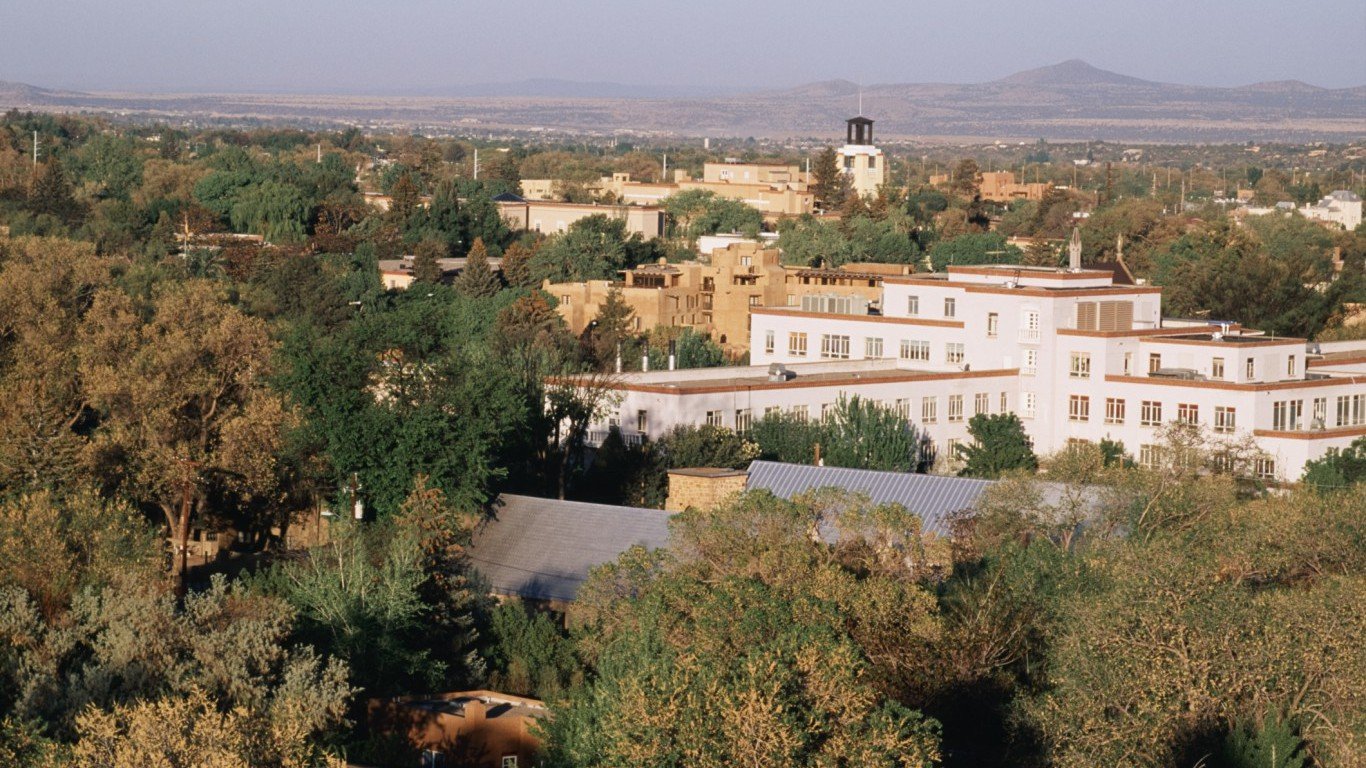
49. New Mexico
> Annual skin cancer diagnoses: 14.6 per 100,000 residents
> Annual skin cancer death rate: 2.5 per 100,000 residents (15th lowest)
> White population: 38.7% (3rd lowest)
[recirclink id=444492]
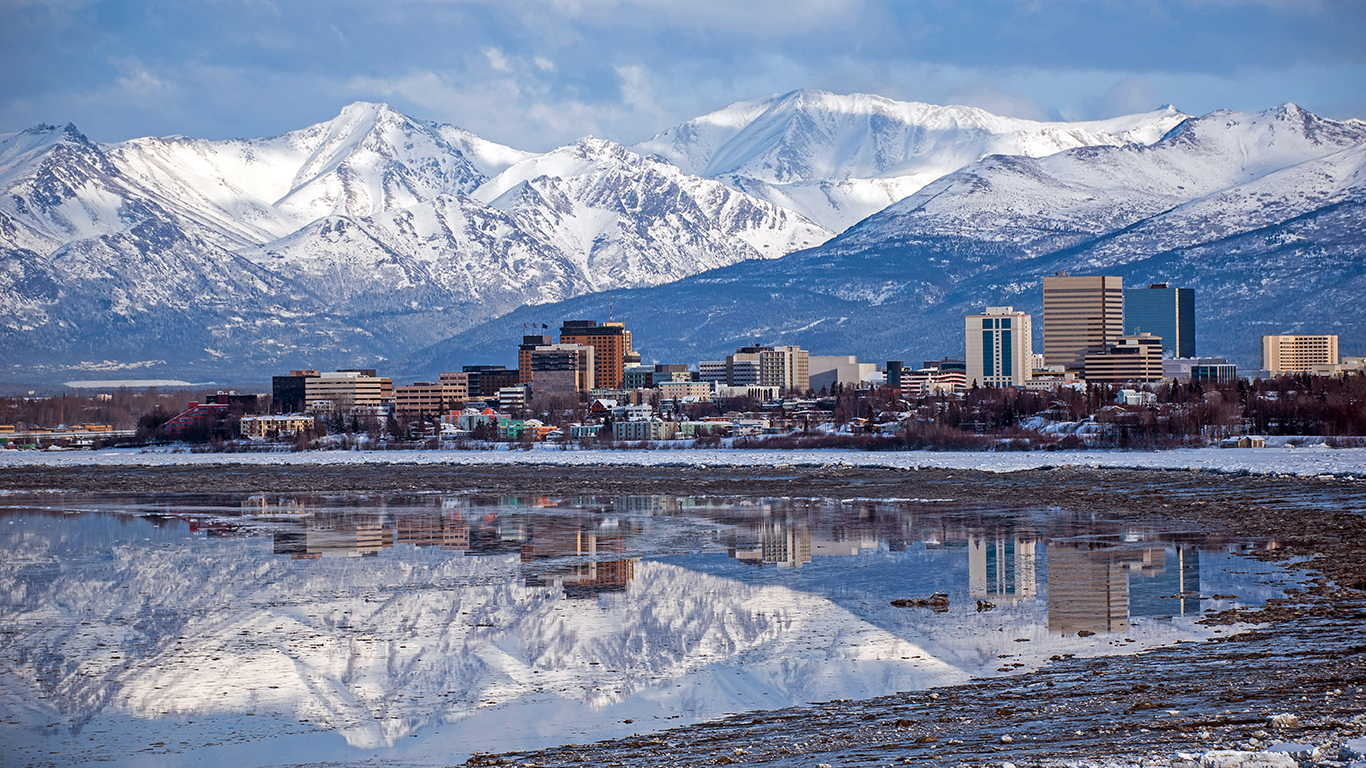
48. Alaska
> Annual skin cancer diagnoses: 14.9 per 100,000 residents
> Annual skin cancer death rate: 2.5 per 100,000 residents (17th lowest)
> White population: 61.5% (14th lowest)
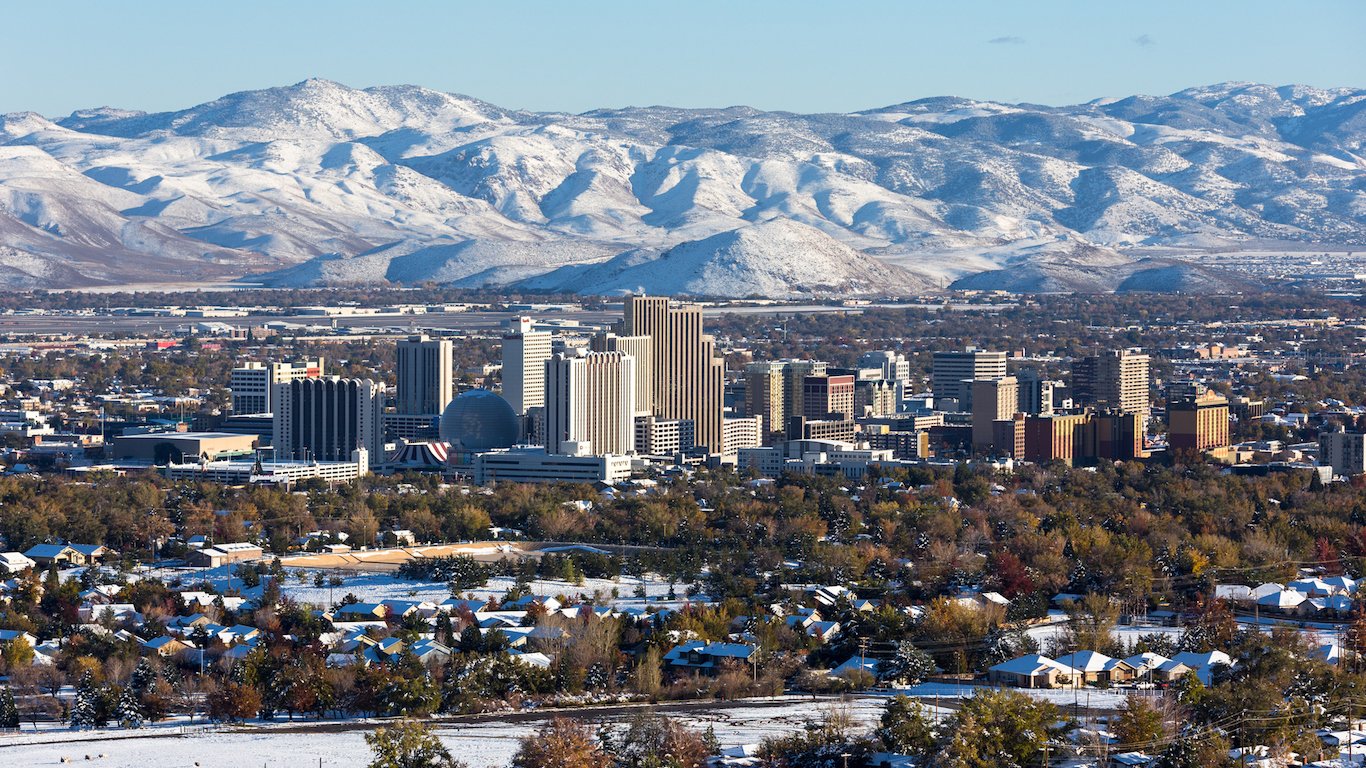
47. Nevada
> Annual skin cancer diagnoses: 15.1 per 100,000 residents
> Annual skin cancer death rate: 2.9 per 100,000 residents (13th highest)
> White population: 49.5% (5th lowest)
[in-text-ad-2]
46. Mississippi
> Annual skin cancer diagnoses: 17.1 per 100,000 residents
> Annual skin cancer death rate: 2.4 per 100,000 residents (9th lowest)
> White population: 57.2% (12th lowest)

45. Louisiana
> Annual skin cancer diagnoses: 17.3 per 100,000 residents
> Annual skin cancer death rate: 2.1 per 100,000 residents (3rd lowest)
> White population: 58.8% (13th lowest)
[in-text-ad]

44. New York
> Annual skin cancer diagnoses: 17.7 per 100,000 residents
> Annual skin cancer death rate: 2.1 per 100,000 residents (2nd lowest)
> White population: 56.3% (10th lowest)
[recirclink id=444468]

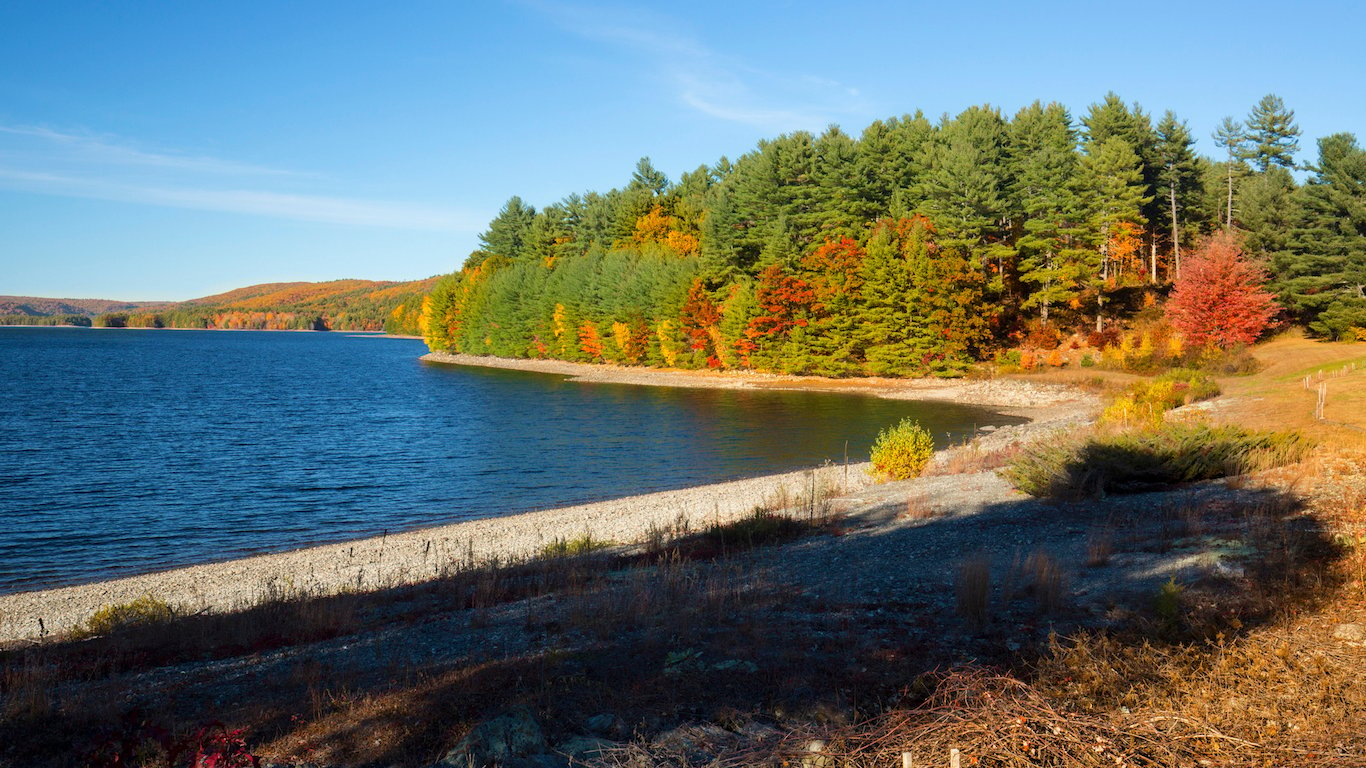
43. Massachusetts
> Annual skin cancer diagnoses: 18.4 per 100,000 residents
> Annual skin cancer death rate: 2.8 per 100,000 residents (25th highest)
> White population: 73.0% (25th highest)
42. Michigan
> Annual skin cancer diagnoses: 18.7 per 100,000 residents
> Annual skin cancer death rate: 2.5 per 100,000 residents (13th lowest)
> White population: 75.6% (21st highest)
[in-text-ad-2]

41. Illinois
> Annual skin cancer diagnoses: 18.7 per 100,000 residents
> Annual skin cancer death rate: 2.5 per 100,000 residents (13th lowest)
> White population: 62.5% (18th lowest)

40. Tennessee
> Annual skin cancer diagnoses: 18.8 per 100,000 residents
> Annual skin cancer death rate: 3.1 per 100,000 residents (6th highest)
> White population: 73.4% (24th highest)
[in-text-ad]

39. Alabama
> Annual skin cancer diagnoses: 19.0 per 100,000 residents
> Annual skin cancer death rate: 2.7 per 100,000 residents (23rd lowest)
> White population: 65.9% (20th lowest)
[recirclink id=444391]

38. Missouri
> Annual skin cancer diagnoses: 19.1 per 100,000 residents
> Annual skin cancer death rate: 2.9 per 100,000 residents (12th highest)
> White population: 79.6% (16th highest)

37. Virginia
> Annual skin cancer diagnoses: 19.7 per 100,000 residents
> Annual skin cancer death rate: 2.7 per 100,000 residents (24th lowest)
> White population: 62.4% (17th lowest)
[in-text-ad-2]
36. Indiana
> Annual skin cancer diagnoses: 19.8 per 100,000 residents
> Annual skin cancer death rate: 2.9 per 100,000 residents (17th highest)
> White population: 79.7% (15th highest)
35. Arkansas
> Annual skin cancer diagnoses: 20.0 per 100,000 residents
> Annual skin cancer death rate: 2.7 per 100,000 residents (25th lowest)
> White population: 72.9% (25th lowest)
[in-text-ad]

34. West Virginia
> Annual skin cancer diagnoses: 20.0 per 100,000 residents
> Annual skin cancer death rate: 3.3 per 100,000 residents (3rd highest)
> White population: 93.2% (3rd highest)
[recirclink id=444326]

33. Hawaii
> Annual skin cancer diagnoses: 20.3 per 100,000 residents
> Annual skin cancer death rate: 1.6 per 100,000 residents (the lowest)
> White population: 22.1% (the lowest)
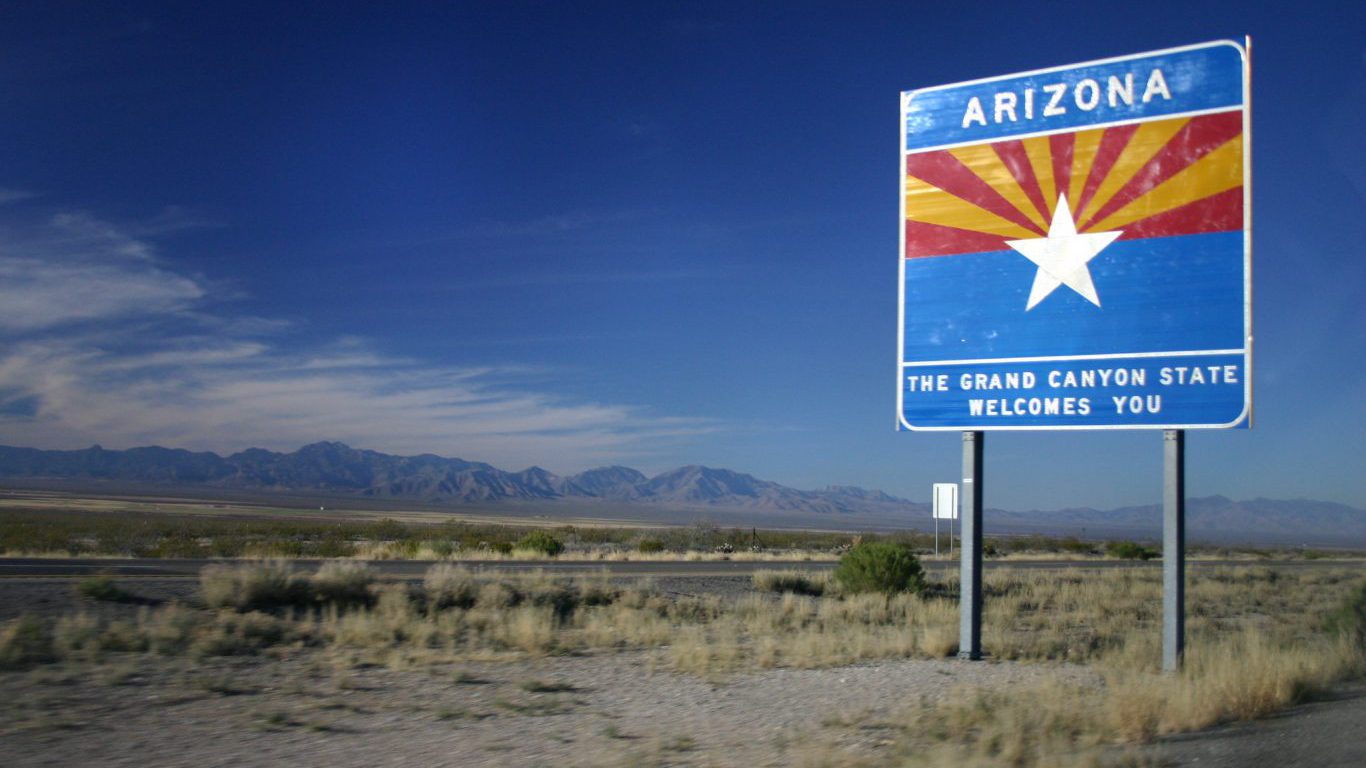
32. Arizona
> Annual skin cancer diagnoses: 20.6 per 100,000 residents
> Annual skin cancer death rate: 2.9 per 100,000 residents (17th highest)
> White population: 54.5% (9th lowest)
[in-text-ad-2]

31. South Carolina
> Annual skin cancer diagnoses: 20.7 per 100,000 residents
> Annual skin cancer death rate: 2.7 per 100,000 residents (22nd lowest)
> White population: 62.2% (15th lowest)
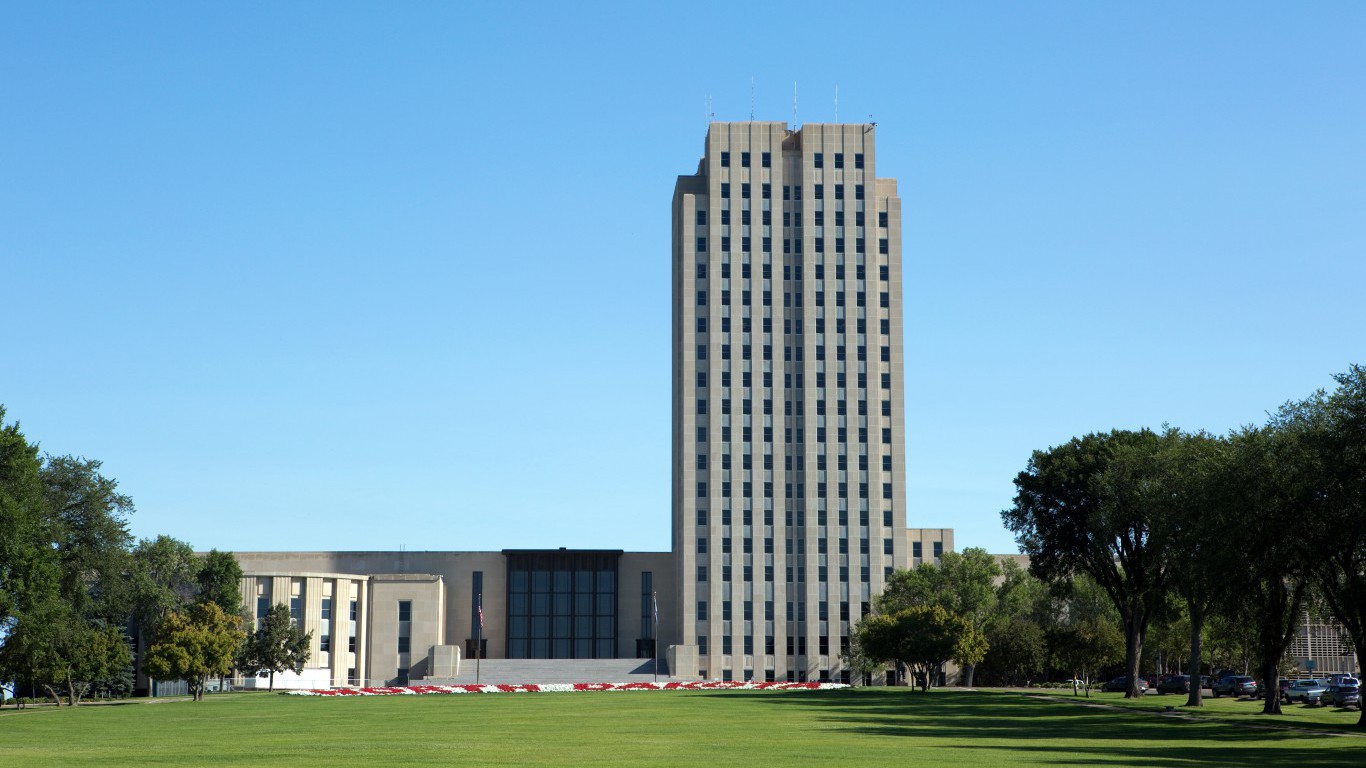
30. North Dakota
> Annual skin cancer diagnoses: 21.3 per 100,000 residents
> Annual skin cancer death rate: 2.3 per 100,000 residents (6th lowest)
> White population: 83.9% (9th highest)
[in-text-ad]
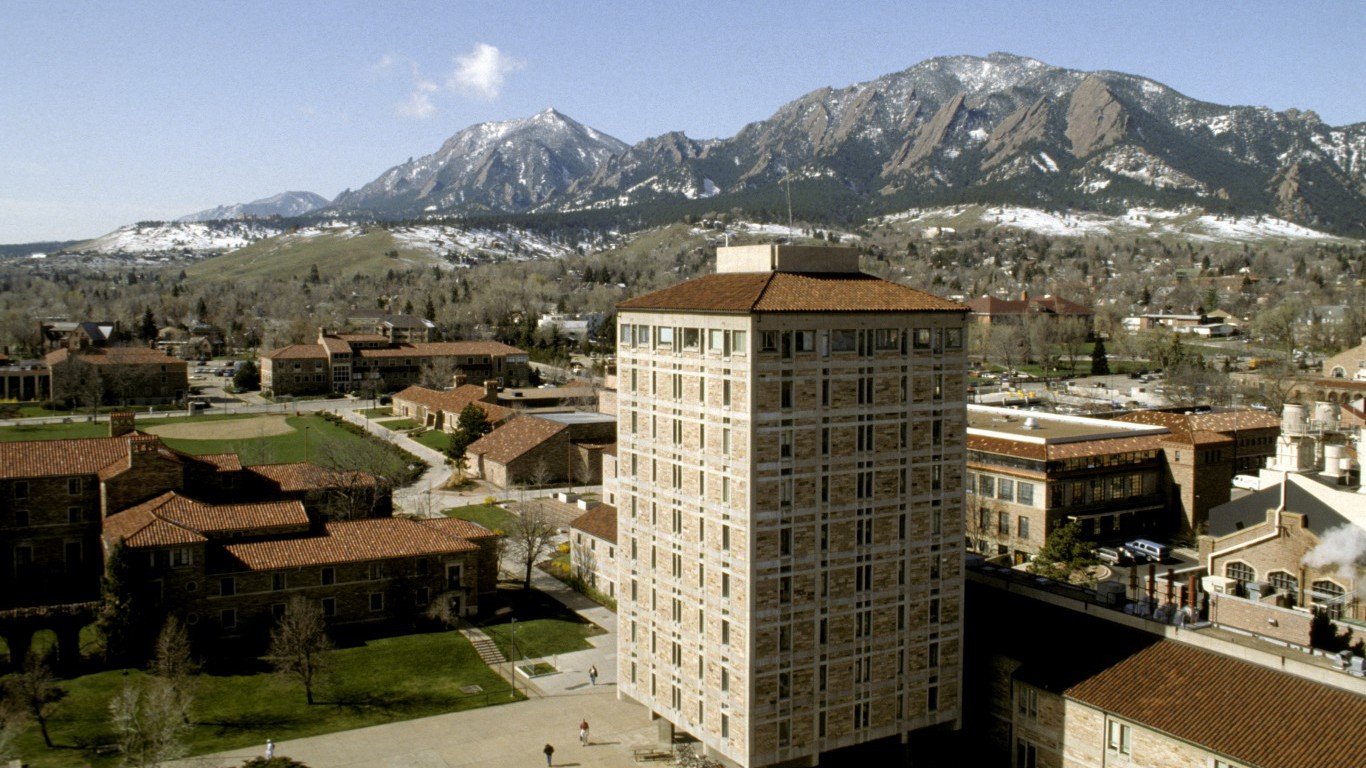
29. Colorado
> Annual skin cancer diagnoses: 21.4 per 100,000 residents
> Annual skin cancer death rate: 3.0 per 100,000 residents (8th highest)
> White population: 66.7% (22nd lowest)
[recirclink id=444046]

28. Oklahoma
> Annual skin cancer diagnoses: 21.8 per 100,000 residents
> Annual skin cancer death rate: 3.0 per 100,000 residents (7th highest)
> White population: 66.1% (21st lowest)

27. Maryland
> Annual skin cancer diagnoses: 21.9 per 100,000 residents
> Annual skin cancer death rate: 2.4 per 100,000 residents (8th lowest)
> White population: 52.0% (6th lowest)
[in-text-ad-2]
26. Connecticut
> Annual skin cancer diagnoses: 21.9 per 100,000 residents
> Annual skin cancer death rate: 2.3 per 100,000 residents (5th lowest)
> White population: 68.9% (24th lowest)

25. New Jersey
> Annual skin cancer diagnoses: 21.9 per 100,000 residents
> Annual skin cancer death rate: 2.4 per 100,000 residents (8th lowest)
> White population: 56.5% (11th lowest)
[in-text-ad]
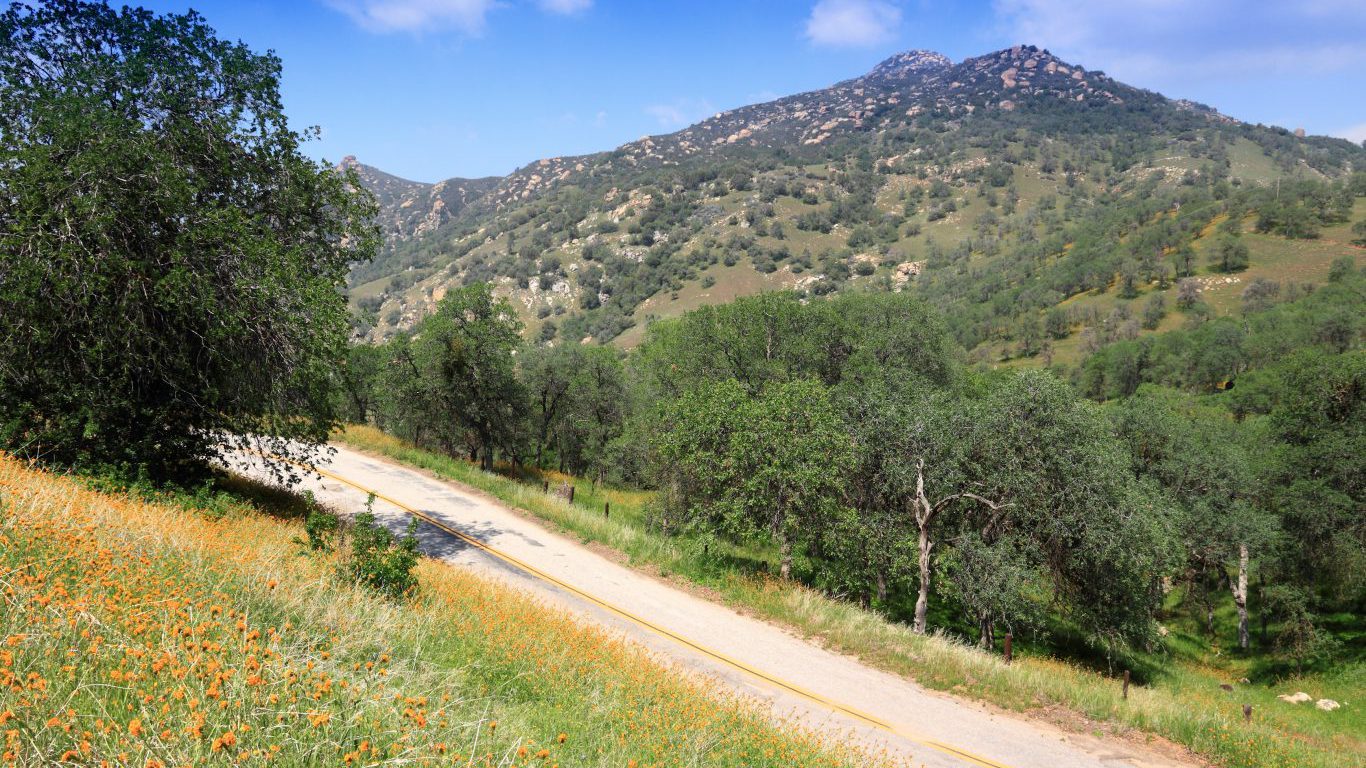
24. California
> Annual skin cancer diagnoses: 23.0 per 100,000 residents
> Annual skin cancer death rate: 2.4 per 100,000 residents (10th lowest)
> White population: 37.8% (2nd lowest)
[recirclink id=443940]

23. Ohio
> Annual skin cancer diagnoses: 23.1 per 100,000 residents
> Annual skin cancer death rate: 2.8 per 100,000 residents (23rd highest)
> White population: 79.8% (14th highest)

22. Florida
> Annual skin cancer diagnoses: 23.2 per 100,000 residents
> Annual skin cancer death rate: 2.9 per 100,000 residents (17th highest)
> White population: 53.8% (8th lowest)
[in-text-ad-2]

21. Nebraska
> Annual skin cancer diagnoses: 23.5 per 100,000 residents
> Annual skin cancer death rate: 3.0 per 100,000 residents (8th highest)
> White population: 79.2% (17th highest)

20. Wisconsin
> Annual skin cancer diagnoses: 23.8 per 100,000 residents
> Annual skin cancer death rate: 2.6 per 100,000 residents (20th lowest)
> White population: 81.8% (10th highest)
[in-text-ad]
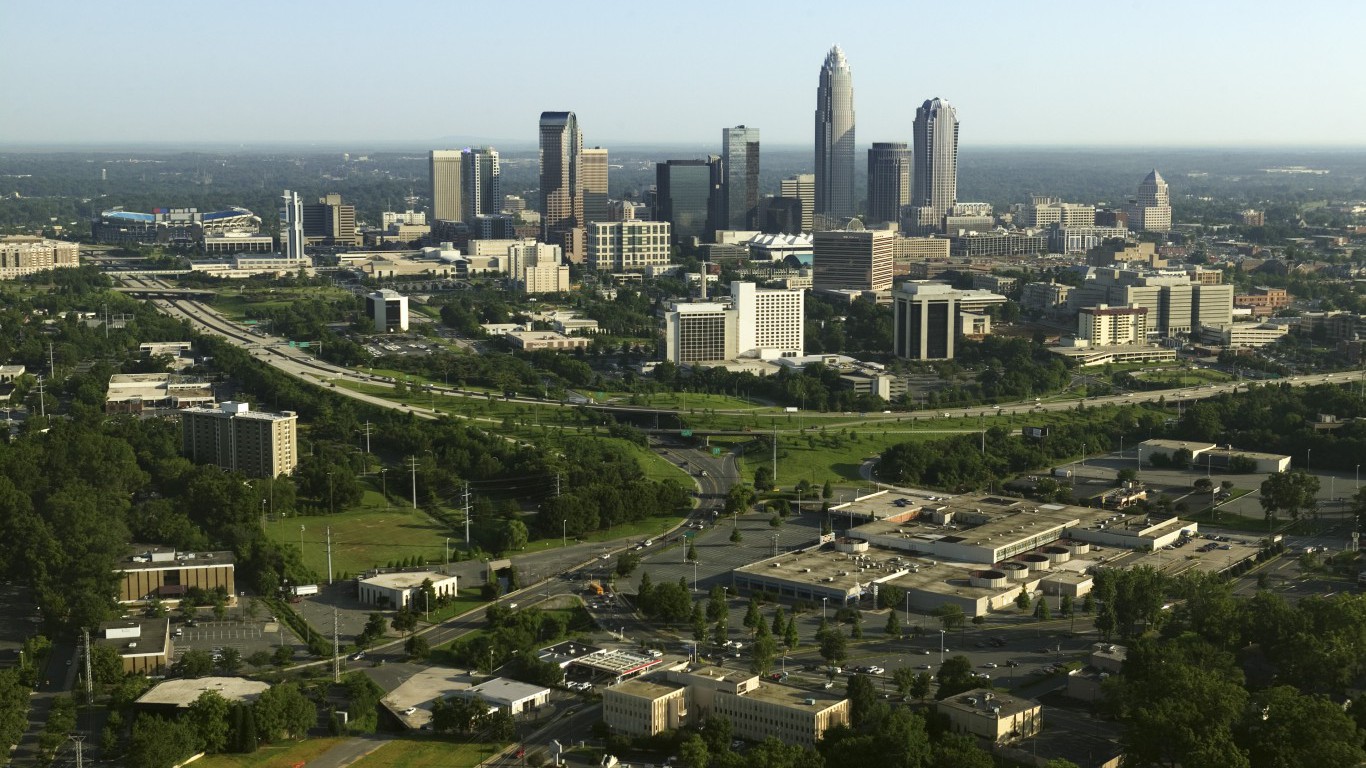
19. North Carolina
> Annual skin cancer diagnoses: 24.3 per 100,000 residents
> Annual skin cancer death rate: 2.7 per 100,000 residents (22nd lowest)
> White population: 62.7% (19th lowest)
[recirclink id=443564]

18. Kansas
> Annual skin cancer diagnoses: 24.3 per 100,000 residents
> Annual skin cancer death rate: 3.1 per 100,000 residents (5th highest)
> White population: 76.6% (20th highest)
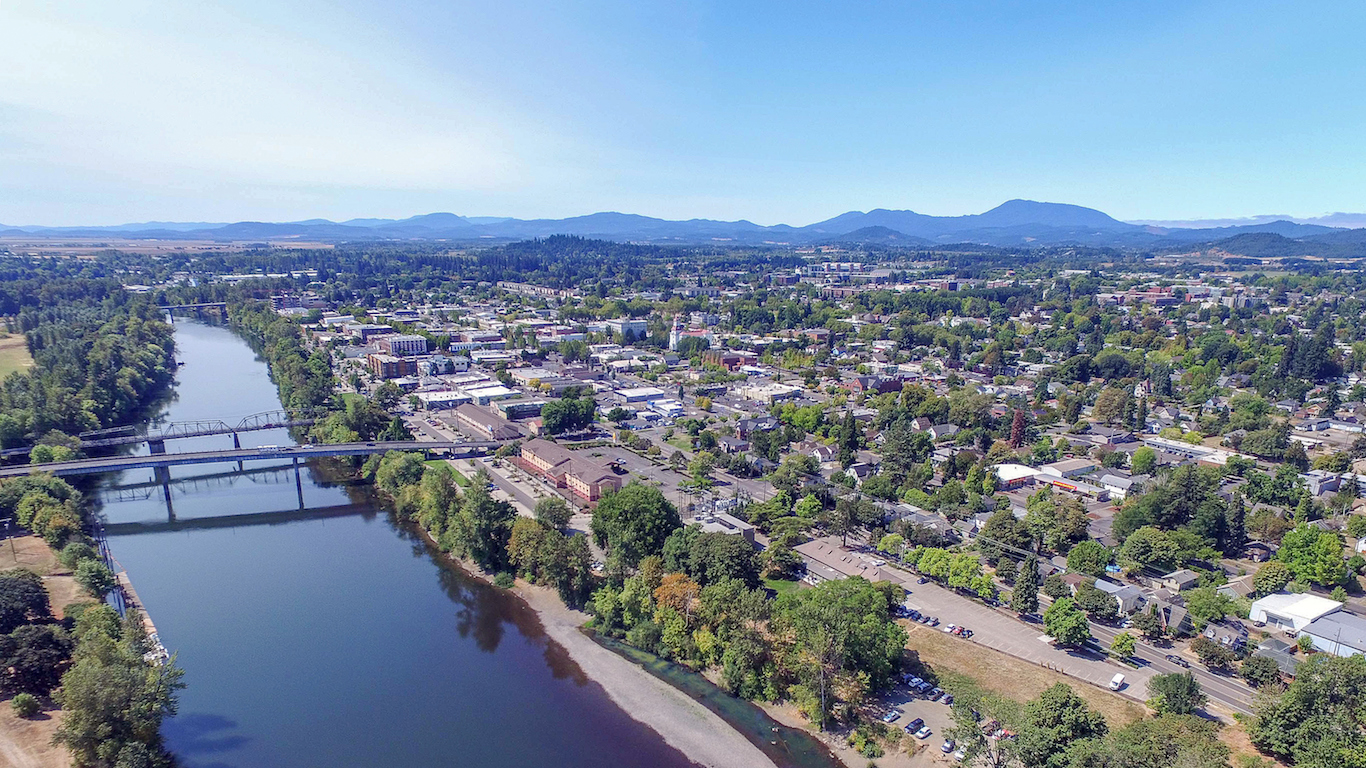
17. Oregon
> Annual skin cancer diagnoses: 24.6 per 100,000 residents
> Annual skin cancer death rate: 3.0 per 100,000 residents (10th highest)
> White population: 74.9% (22nd highest)
[in-text-ad-2]
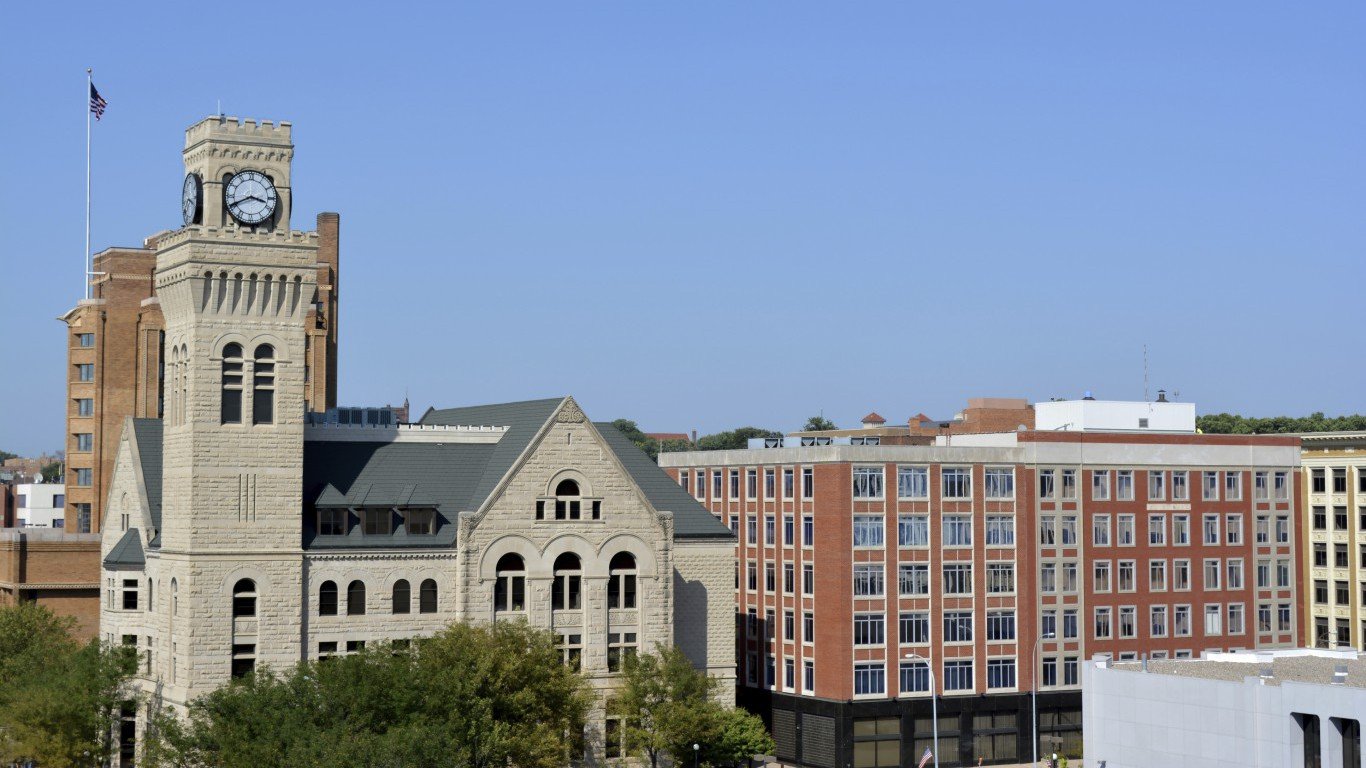
16. Iowa
> Annual skin cancer diagnoses: 24.9 per 100,000 residents
> Annual skin cancer death rate: 2.8 per 100,000 residents (22nd highest)
> White population: 86.2% (5th highest)
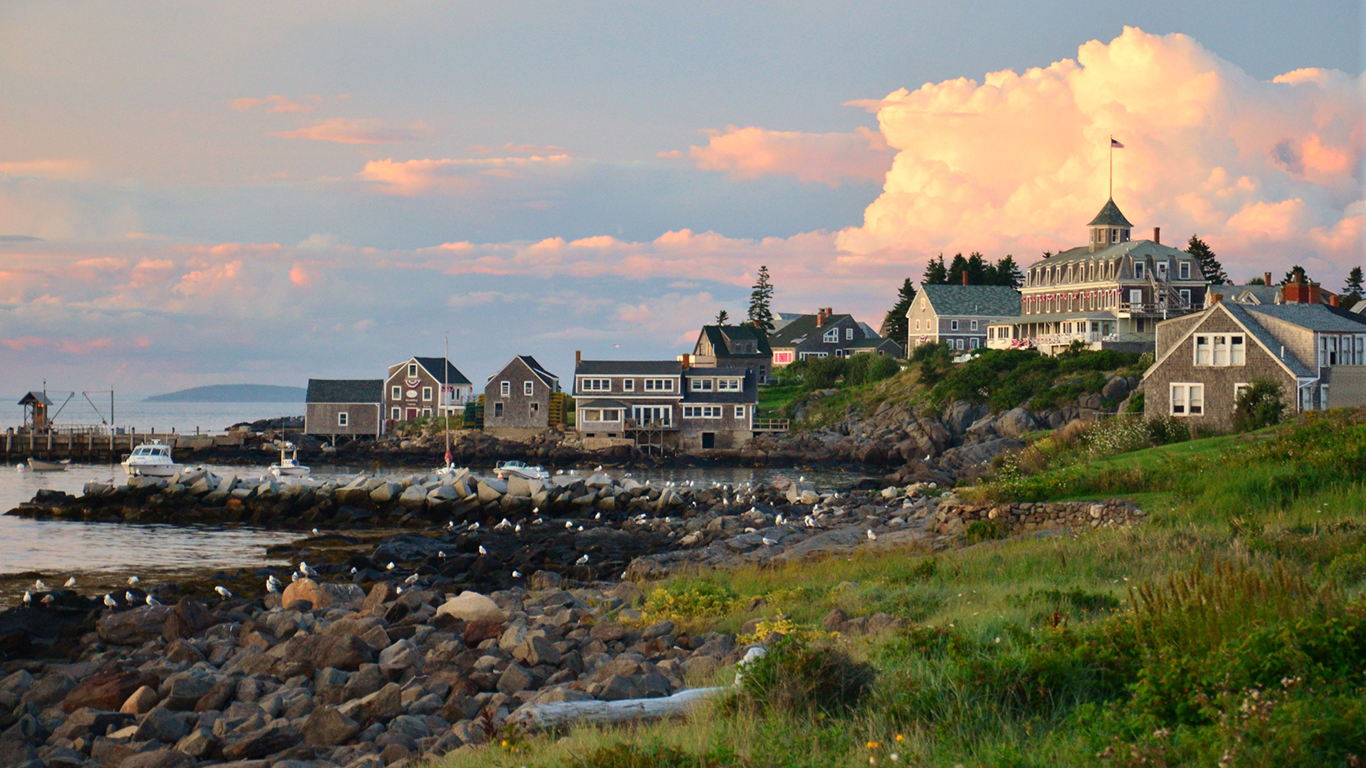
15. Maine
> Annual skin cancer diagnoses: 25.1 per 100,000 residents
> Annual skin cancer death rate: 2.9 per 100,000 residents (15th highest)
> White population: 93.6% (2nd highest)
[in-text-ad]
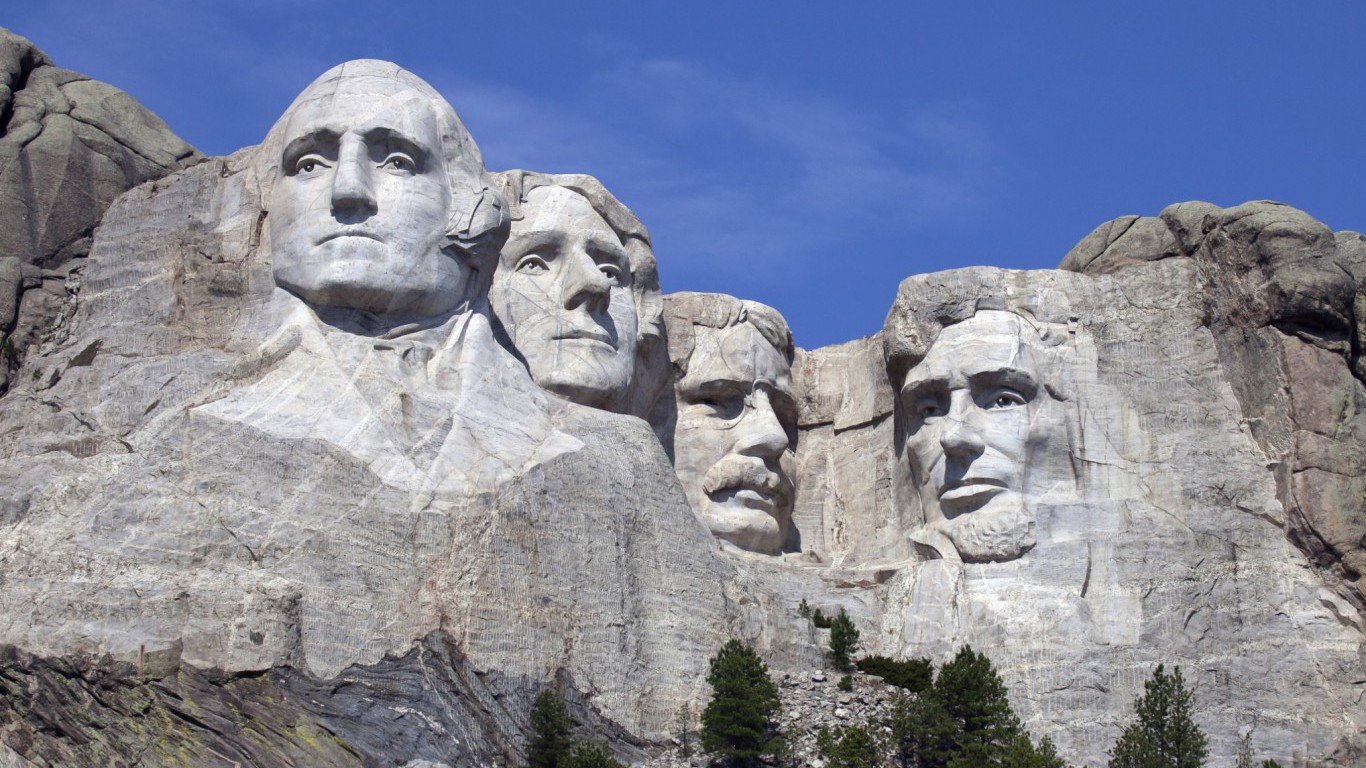
14. South Dakota
> Annual skin cancer diagnoses: 25.8 per 100,000 residents
> Annual skin cancer death rate: 2.5 per 100,000 residents (16th lowest)
> White population: 81.5% (11th highest)
[recirclink id=443882]
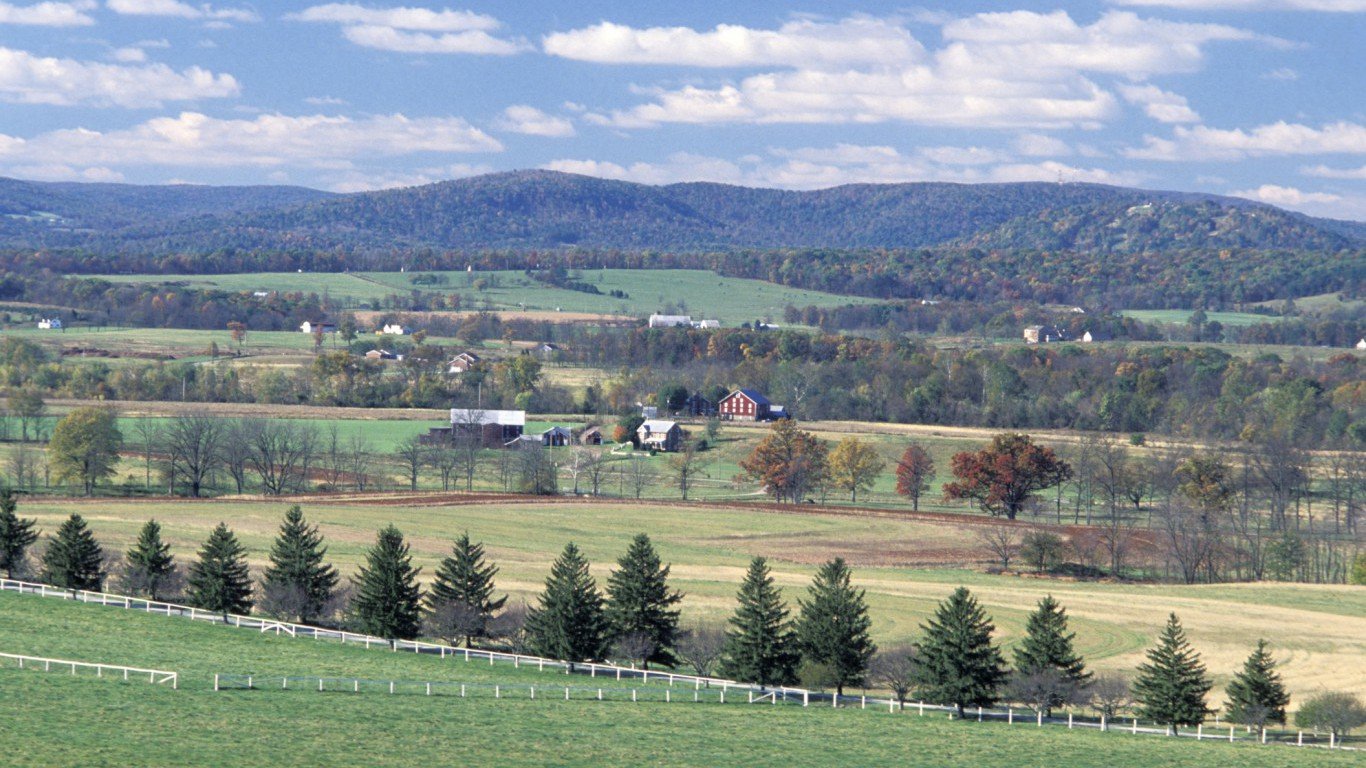
13. Pennsylvania
> Annual skin cancer diagnoses: 25.8 per 100,000 residents
> Annual skin cancer death rate: 2.8 per 100,000 residents (24th highest)
> White population: 77.7% (18th highest)
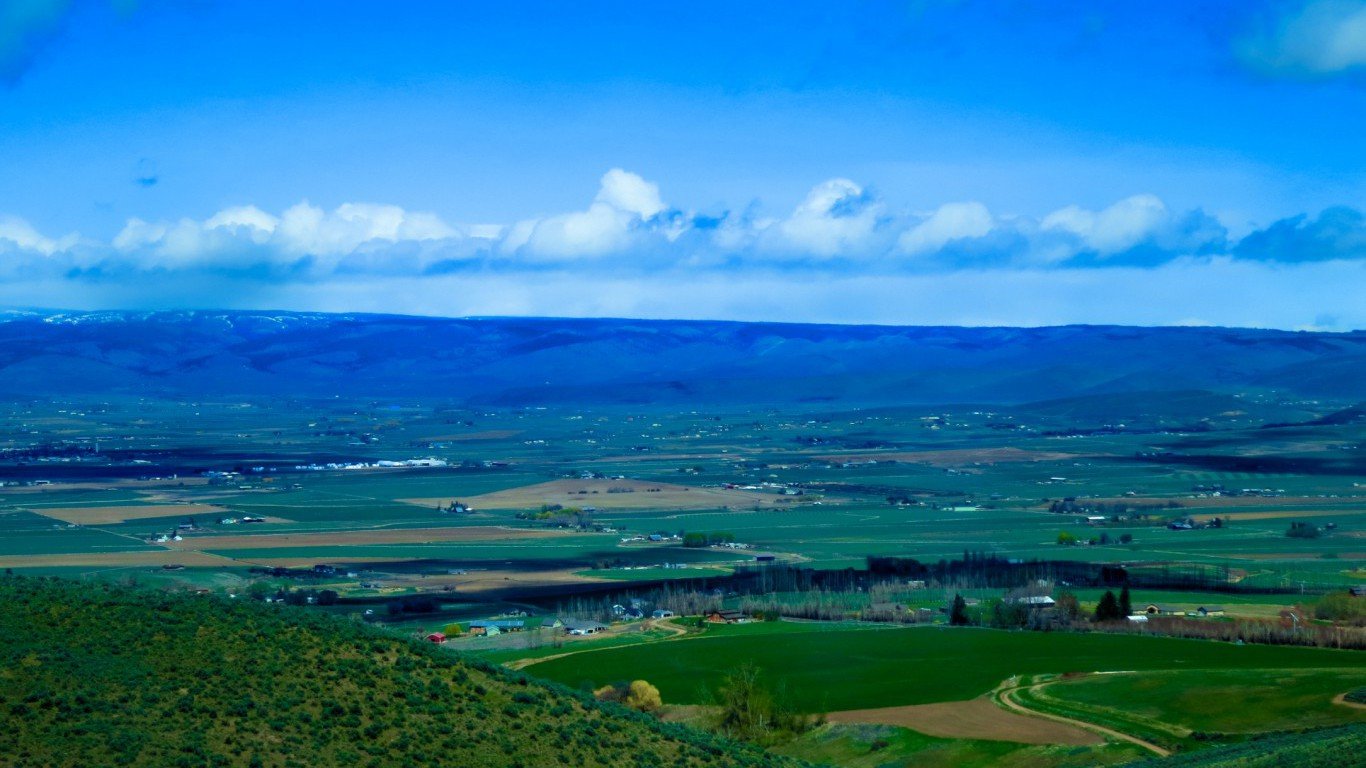
12. Washington
> Annual skin cancer diagnoses: 25.9 per 100,000 residents
> Annual skin cancer death rate: 2.9 per 100,000 residents (21st highest)
> White population: 68.3% (23rd lowest)
[in-text-ad-2]

11. Wyoming
> Annual skin cancer diagnoses: 26.6 per 100,000 residents
> Annual skin cancer death rate: 3.0 per 100,000 residents (11th highest)
> White population: 84.0% (8th highest)

10. Idaho
> Annual skin cancer diagnoses: 26.6 per 100,000 residents
> Annual skin cancer death rate: 3.5 per 100,000 residents (the highest)
> White population: 80.6% (12th highest)
[in-text-ad]

9. Rhode Island
> Annual skin cancer diagnoses: 26.7 per 100,000 residents
> Annual skin cancer death rate: 2.5 per 100,000 residents (13th lowest)
> White population: 73.9% (23rd highest)
[recirclink id=443620]
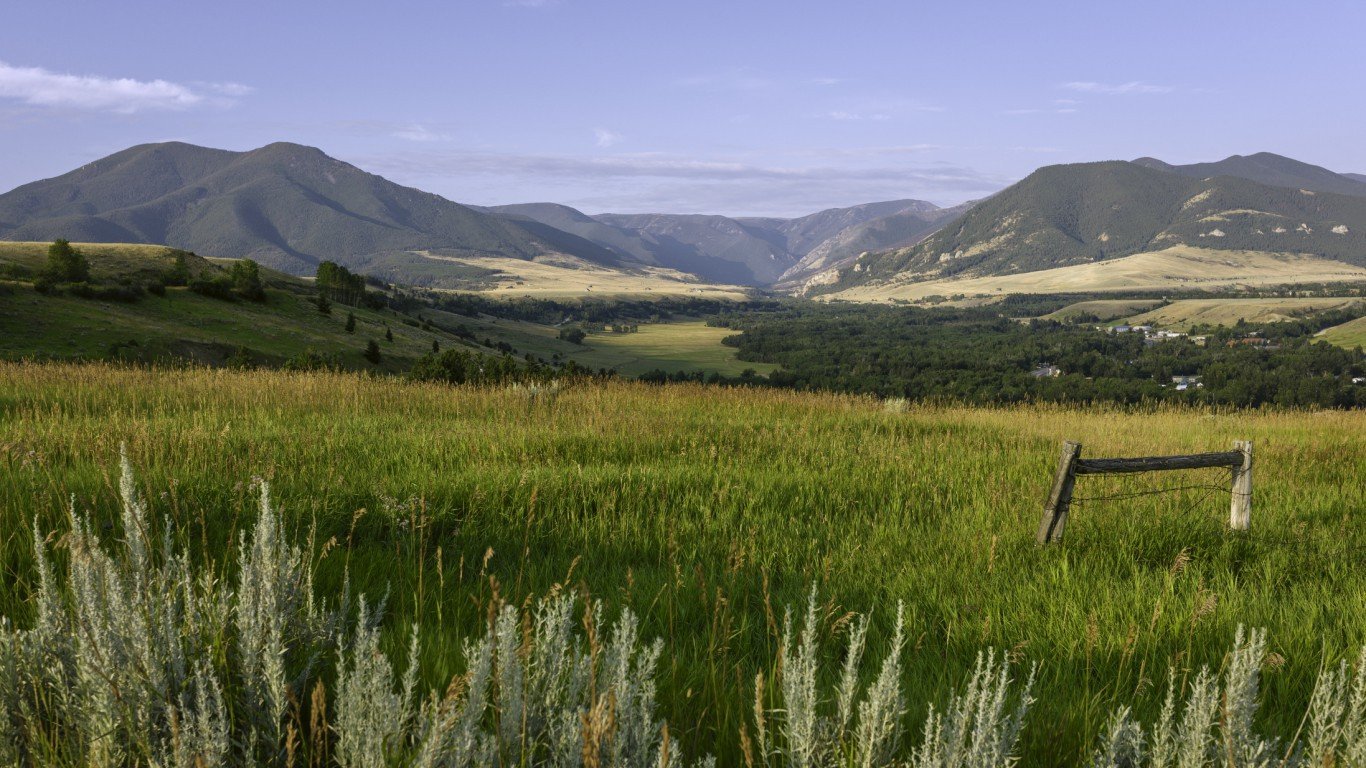
8. Montana
> Annual skin cancer diagnoses: 26.9 per 100,000 residents
> Annual skin cancer death rate: 2.9 per 100,000 residents (20th highest)
> White population: 85.2% (6th highest)

7. Kentucky
> Annual skin cancer diagnoses: 27.1 per 100,000 residents
> Annual skin cancer death rate: 3.3 per 100,000 residents (4th highest)
> White population: 84.9% (7th highest)
[in-text-ad-2]
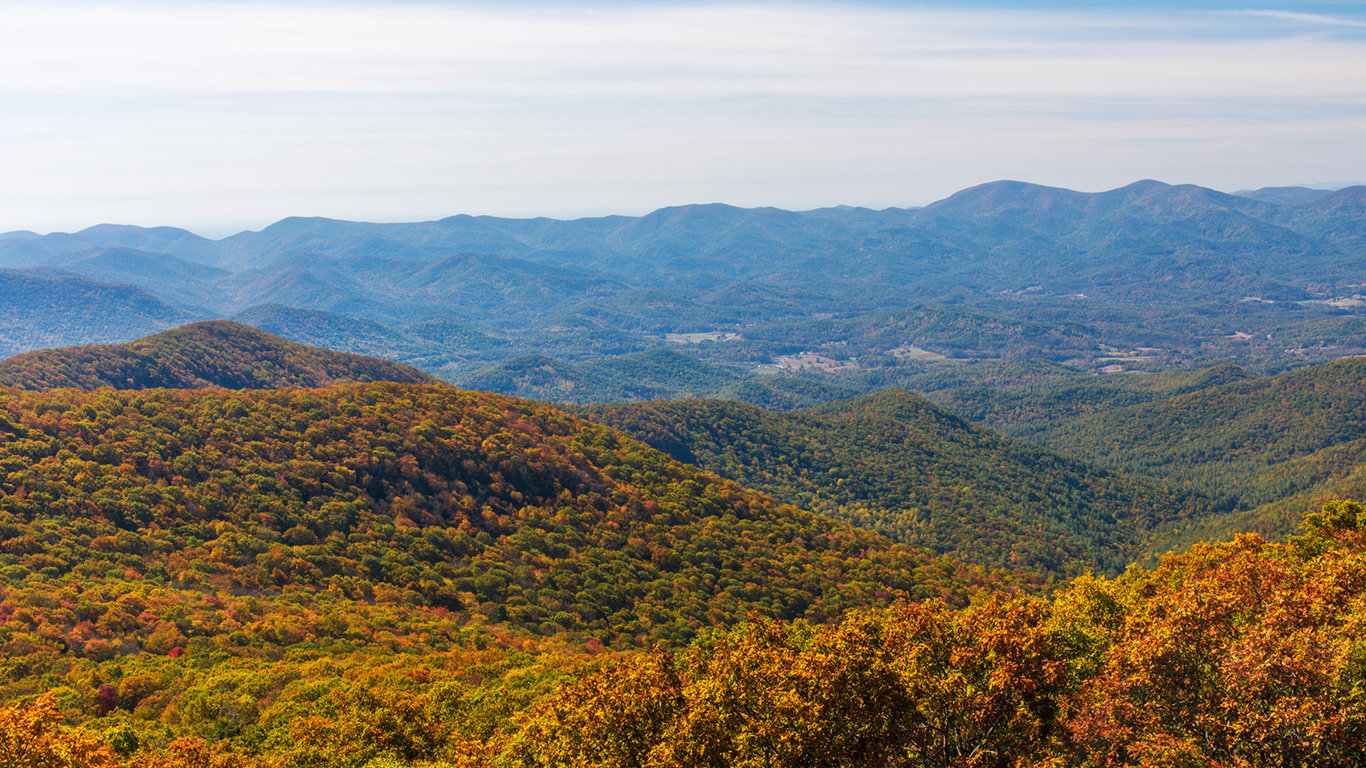
6. Georgia
> Annual skin cancer diagnoses: 27.4 per 100,000 residents
> Annual skin cancer death rate: 2.5 per 100,000 residents (14th lowest)
> White population: 53.0% (7th lowest)
5. Delaware
> Annual skin cancer diagnoses: 29.7 per 100,000 residents
> Annual skin cancer death rate: 2.9 per 100,000 residents (16th highest)
> White population: 62.3% (16th lowest)
[in-text-ad]

4. Minnesota
> Annual skin cancer diagnoses: 29.9 per 100,000 residents
> Annual skin cancer death rate: 2.6 per 100,000 residents (18th lowest)
> White population: 80.3% (13th highest)
[recirclink id=443575]

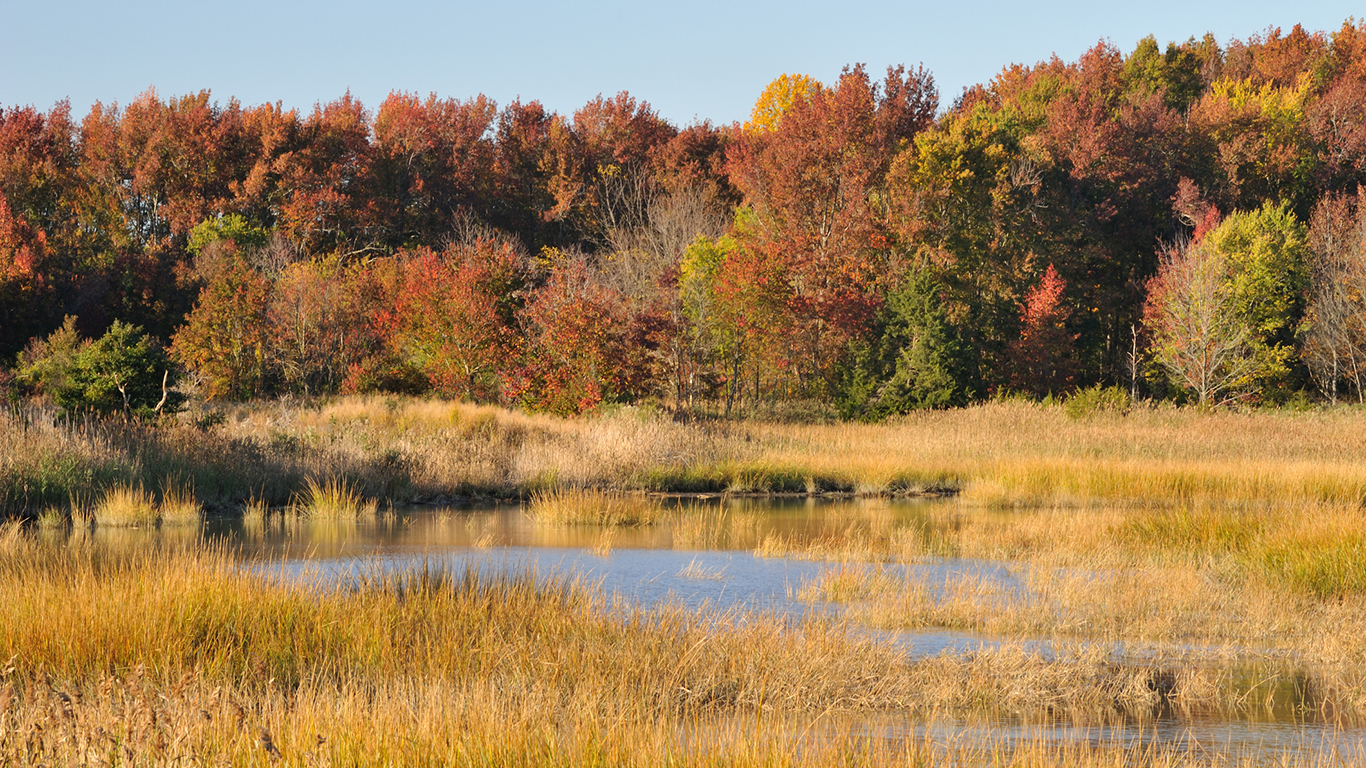
3. New Hampshire
> Annual skin cancer diagnoses: 32.5 per 100,000 residents
> Annual skin cancer death rate: 2.9 per 100,000 residents (14th highest)
> White population: 90.7% (4th highest)
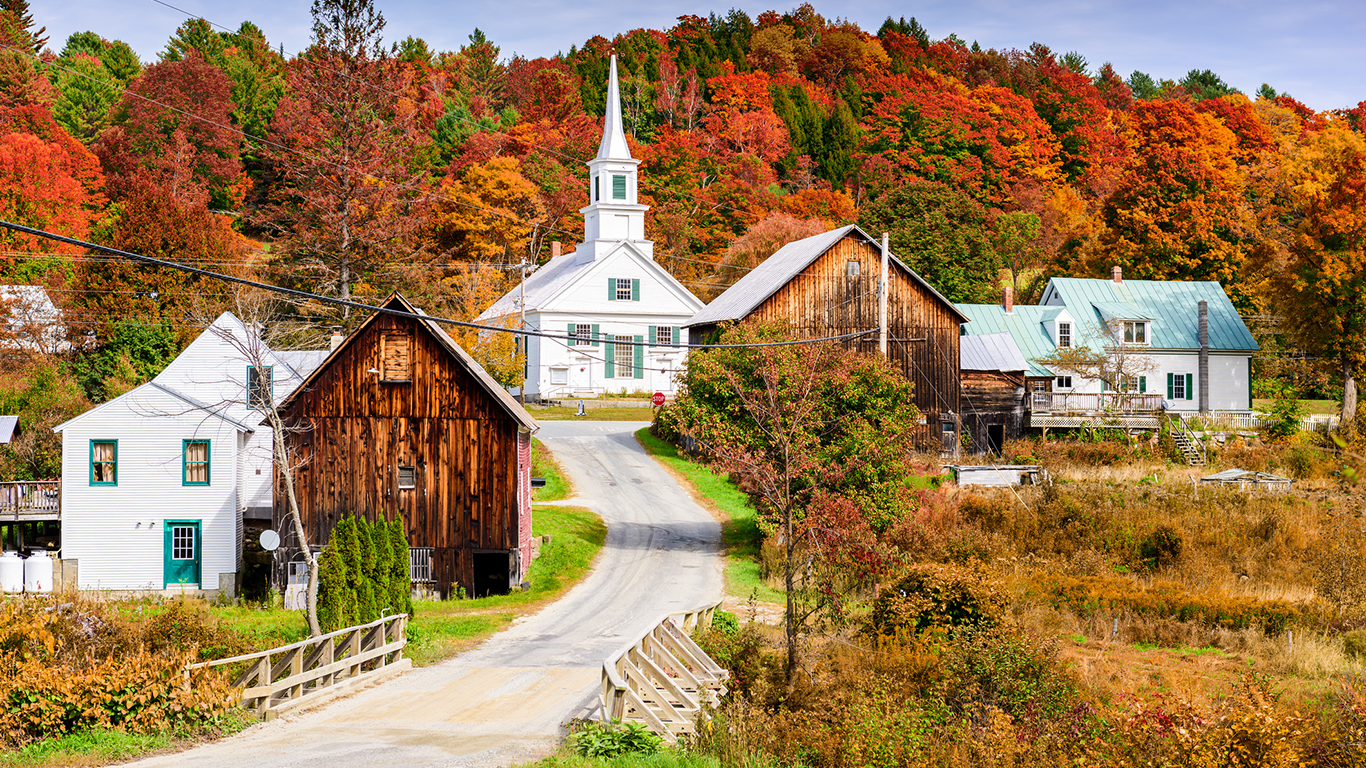
2. Vermont
> Annual skin cancer diagnoses: 35.7 per 100,000 residents
> Annual skin cancer death rate: 2.6 per 100,000 residents (19th lowest)
> White population: 93.7% (the highest)
[in-text-ad-2]
1. Utah
> Annual skin cancer diagnoses: 42.3 per 100,000 residents
> Annual skin cancer death rate: 3.5 per 100,000 residents (2nd highest)
> White population: 76.7% (19th highest)
Contact [email protected] for any questions or corrections.