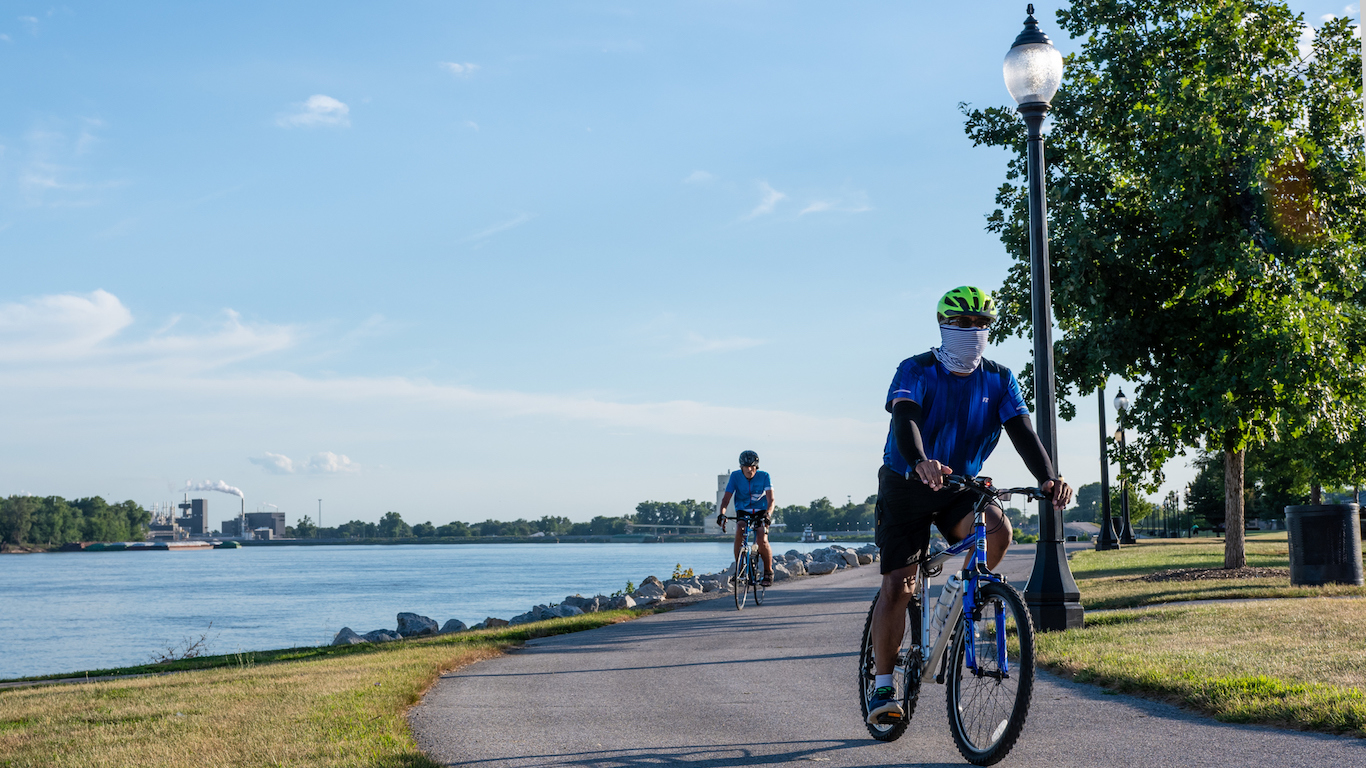
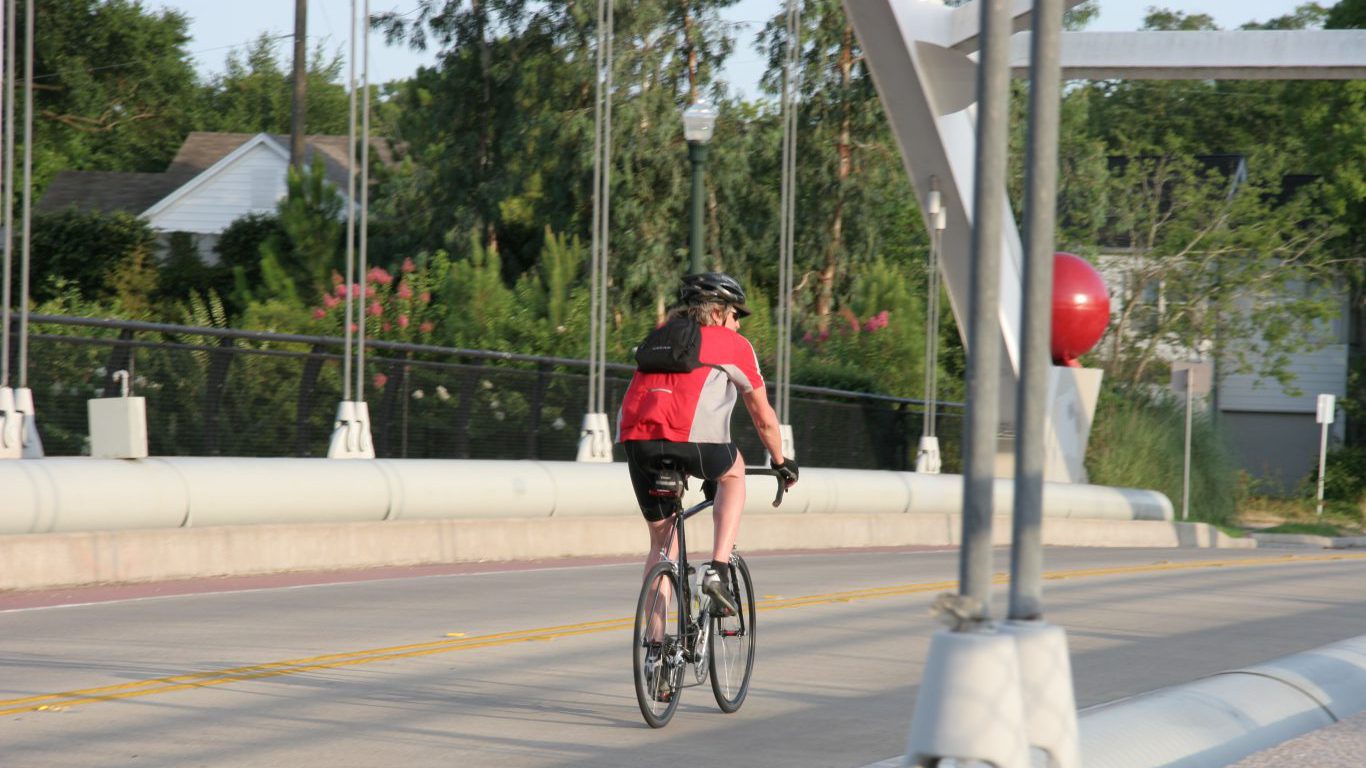
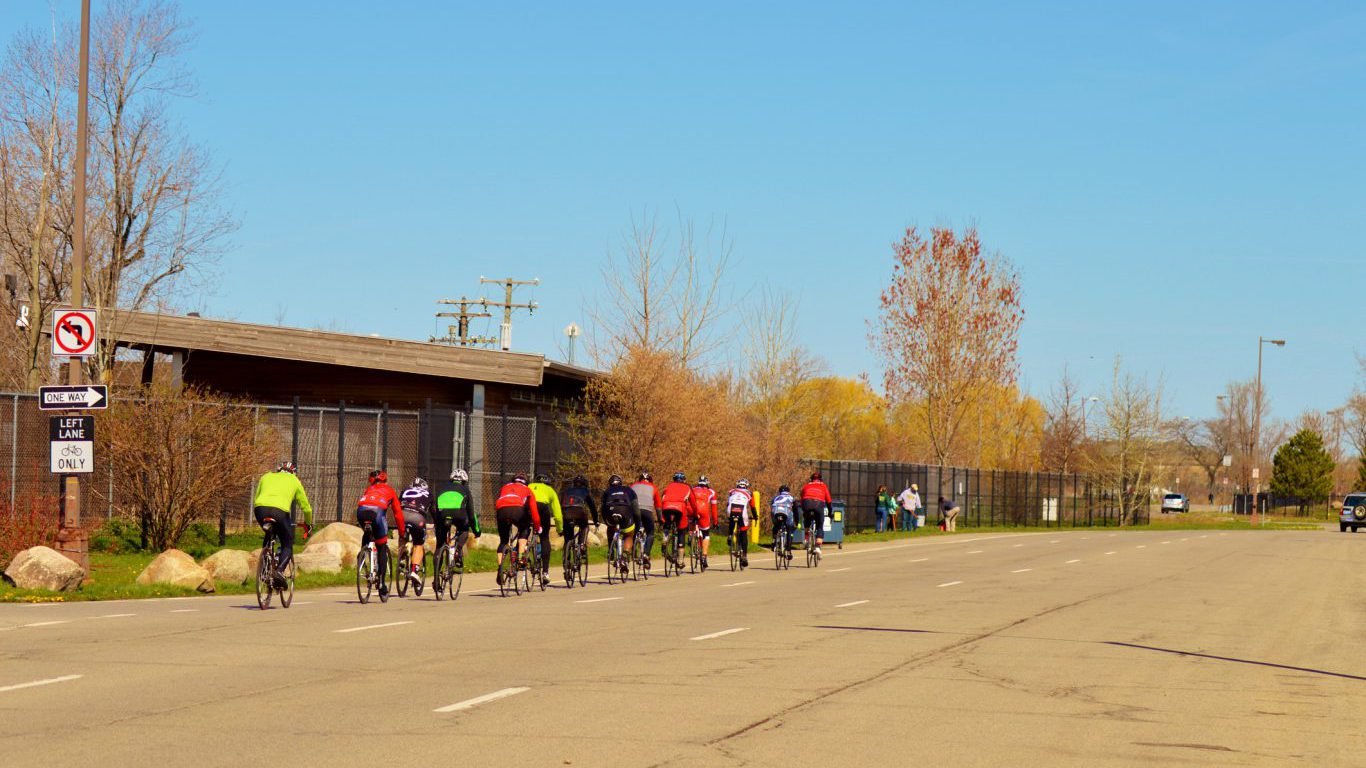
[cnxvideo id=”625457″ placement=”ros”]An increasing number of Americans are leaving their cars at home and turning to their bicycles to get around. According to the League of American Bicyclists, from 2000 to 2013, the rate of people commuting by bicycles increased 62% nationwide.
People start riding bicycles for many reasons, including exercise, environmental concerns, and the cost saving benefits that come with avoiding constant trips to the gas station.
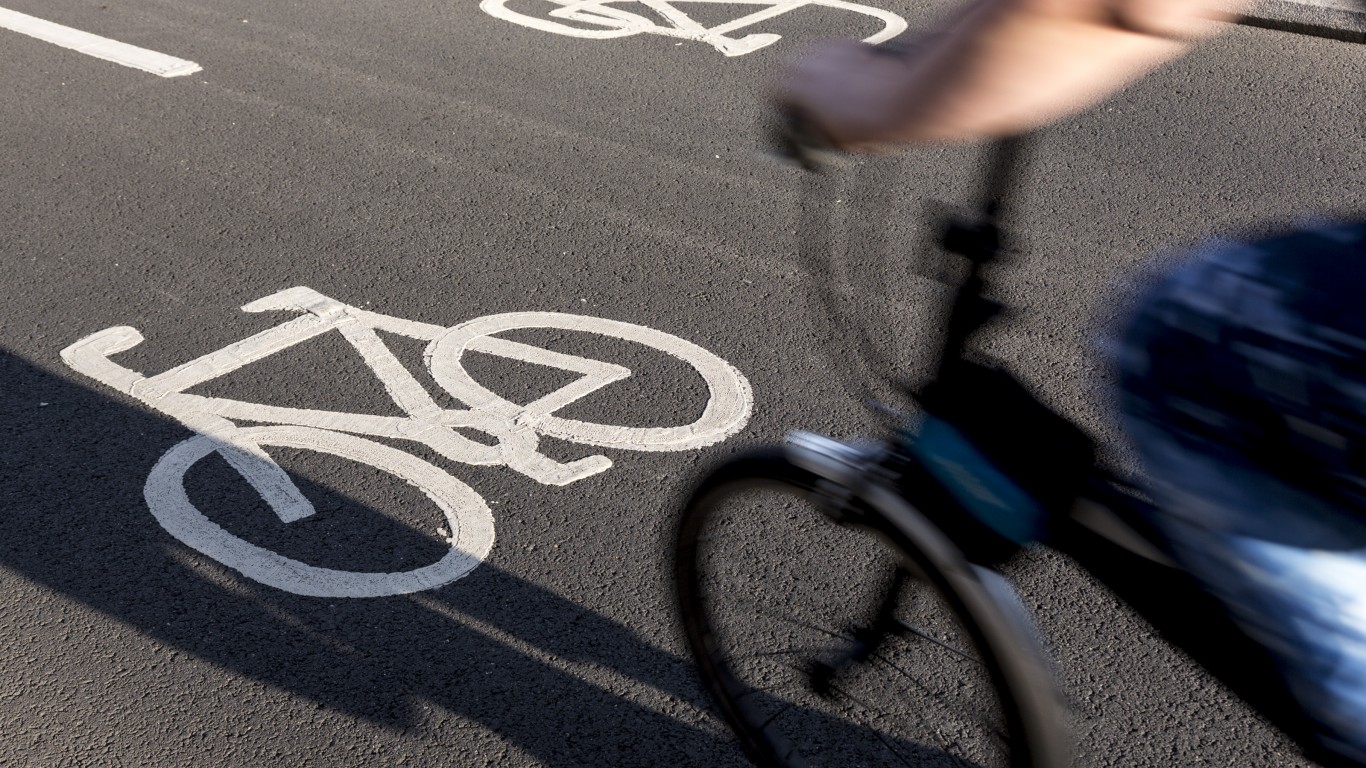
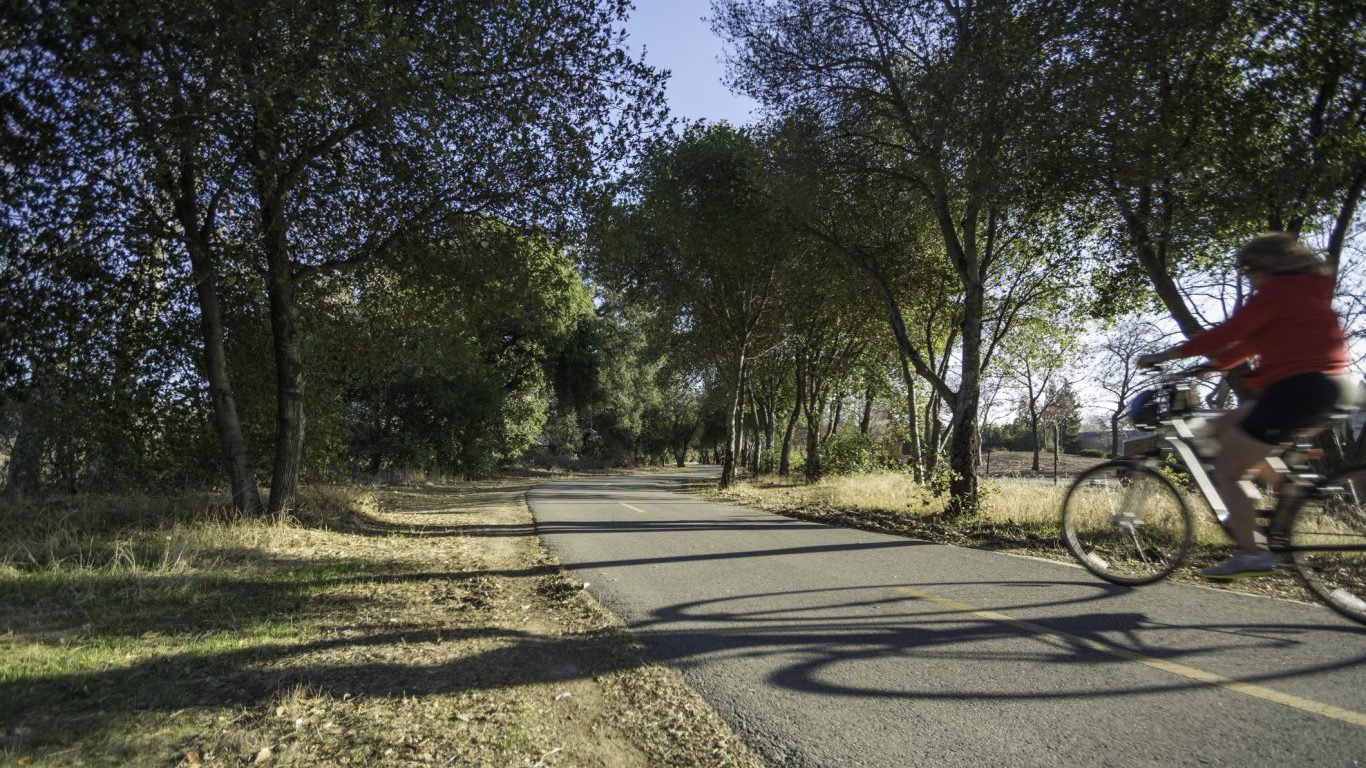
Yet the ability to begin cycling more regularly heavily depends on where one lives. Many American cities have gone to great lengths to promote bike-riding by taking steps such as installing bike lanes and implementing bike share programs. Others have neglected these measures, making it difficult for commuters to adopt cycling to their lifestyle.
24/7 Wall St. determined the best and worst cities in which to ride a bike by creating an index based on a number of metrics, including the amount of bike-friendly road miles, percentage of people commuting by bicycle, and cyclist fatality rates.
About 70% of fatal cyclist crashes occurred in urban areas. Because riding a bike is relatively more dangerous — and common — in large cities in particular, we limited our comparison to the 34 U.S. cities with populations of 500,000 or greater.
Click here to see the best and worst cities to ride a bike.
Click here to see our methodology.
The majority of the best cities for riding a bike – such as Boston, Seattle, and Portland, OR – have cooler climates than most of the worst cities, including Phoenix, Houston, and Memphis, TN. Of course, there are exceptions such as Tucson, which is located south of Phoenix and is one of the best cities on our list. So while weather is not a defining factor in whether cities build biking infrastructures, temperatures clearly play a role in whether residents even desire to ride their bike under a blistering sun.
Many of the worst cities to ride a bike are making efforts to improve their standing. Of the 17 worst cities on our list, six recently announced plans for bike share programs. Eight of the worst cities already have programs of this kind, yet fail in other areas.

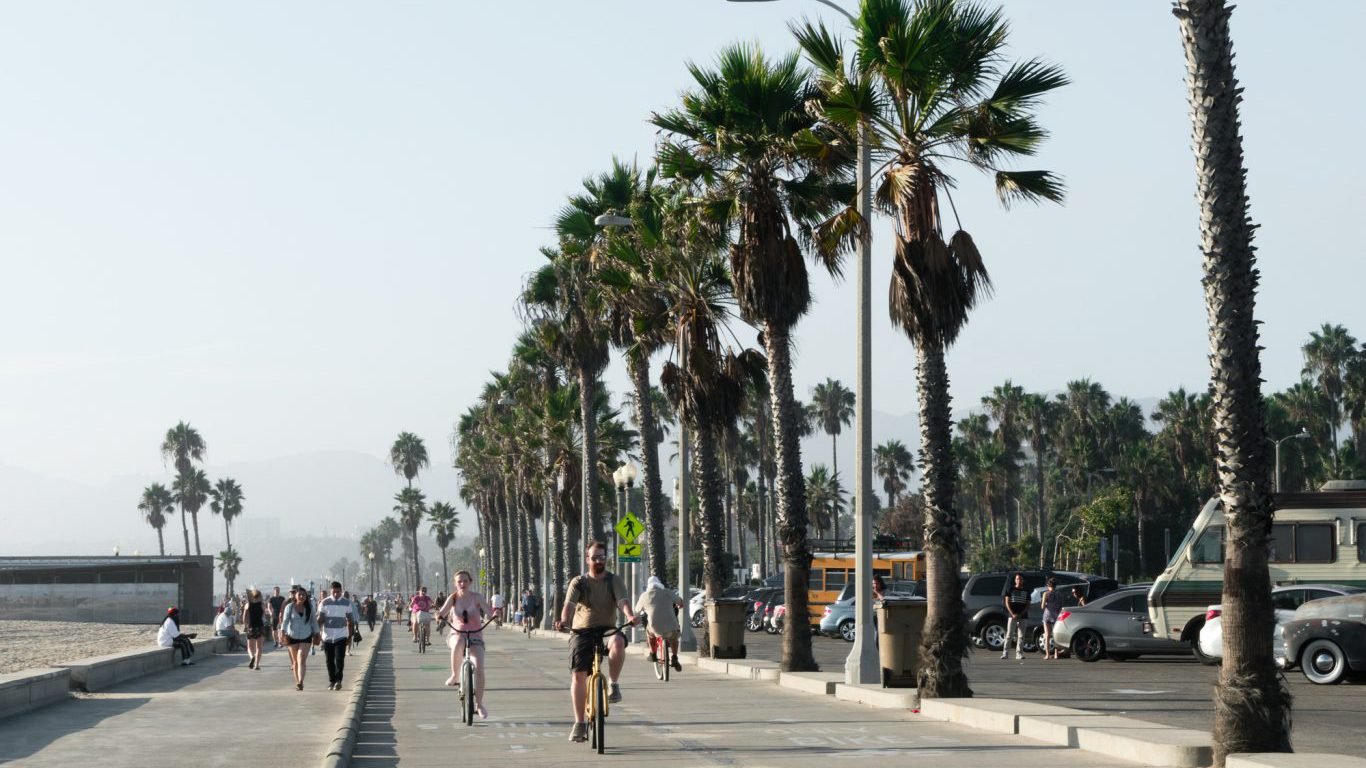
1. Portland, OR
> Bike infrastructure per sq. mile: 3.1
> Bicyclist fatalities: 2 (3.16 per 1 million people)
> Population: 632,309
> Working-age population commuting by bike: 6.3%
> No. of bike-share bikes: N/A
[in-text-ad]
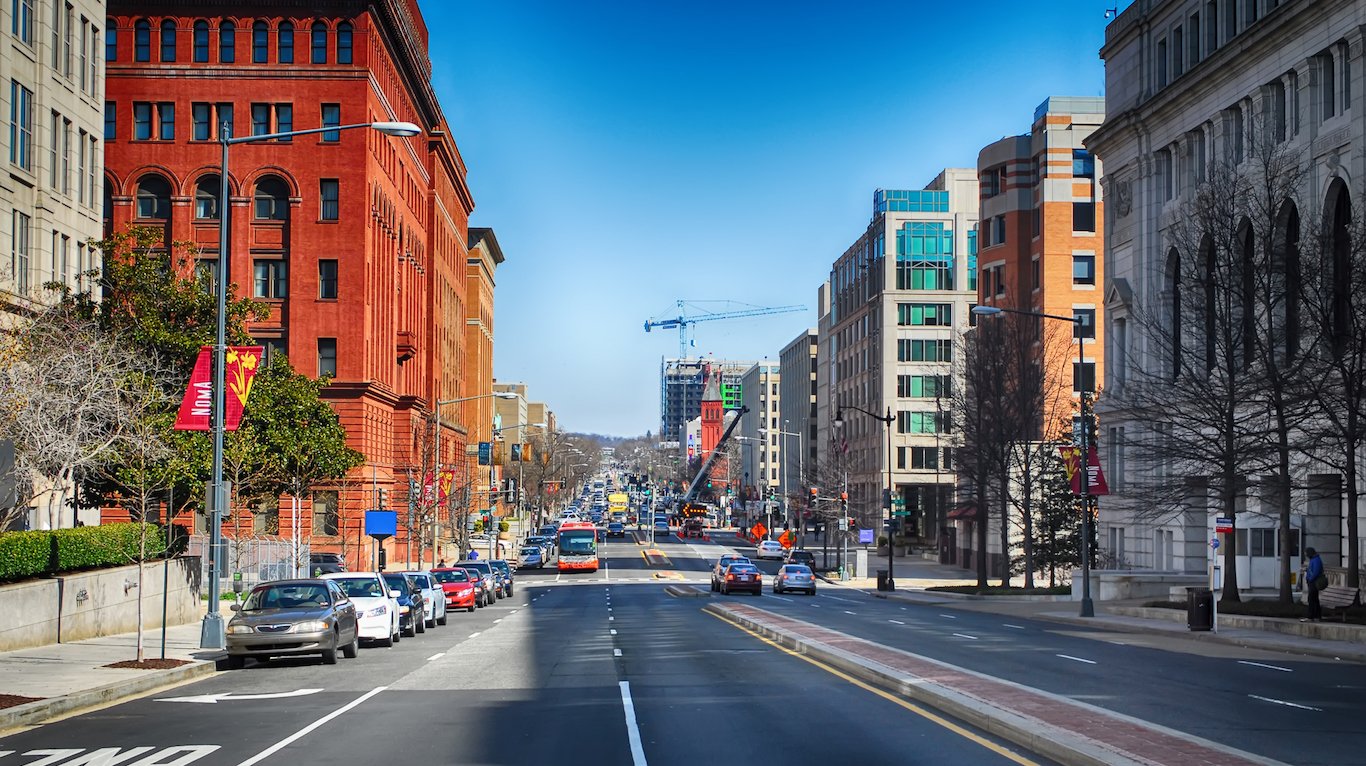
2. Washington, DC
> Bike infrastructure per sq. mile: 2.9
> Bicyclist fatalities: 1 (1.49 per 1 million people)
> Population: 672,228
> Working-age population commuting by bike: 4.6%
> No. of bike-share bikes: 463 per 100,000 people
[recirclink id=444492]

3. Boston, MA
> Bike infrastructure per sq. mile: 4.4
> Bicyclist fatalities: 0 (0 per 1 million people)
> Population: 667,137
> Working-age population commuting by bike: 2.4%
> No. of bike-share bikes: 205 per 100,000 people
[in-text-ad-2]

4. San Francisco, CA
> Bike infrastructure per sq. mile: 3.1
> Bicyclist fatalities: 4 (4.63 per 1 million people)
> Population: 864,816
> Working-age population commuting by bike: 3.9%
> No. of bike-share bikes: 42 per 100,000 people

5. Philadelphia, PA
> Bike infrastructure per sq. mile: 3.7
> Bicyclist fatalities: 7 (4.47 per 1 million people)
> Population: 1,567,442
> Working-age population commuting by bike: 2.2%
> No. of bike-share bikes: N/A

6. Seattle, WA
> Bike infrastructure per sq. mile: 1.9
> Bicyclist fatalities: 1 (1.46 per 1 million people)
> Population: 684,451
> Working-age population commuting by bike: 3.5%
> No. of bike-share bikes: 79 per 100,000 people
[recirclink id=444468]

7. Denver, CO
> Bike infrastructure per sq. mile: 2.6
> Bicyclist fatalities: 2 (2.93 per 1 million people)
> Population: 682,545
> Working-age population commuting by bike: 2.2%
> No. of bike-share bikes: 112 per 100,000 people

8. Chicago, IL
> Bike infrastructure per sq. mile: 2.1
> Bicyclist fatalities: 7 (2.57 per 1 million people)
> Population: 2,720,546
> Working-age population commuting by bike: 1.7%
> No. of bike-share bikes: 100 per 100,000 people

9. New York, NY
> Bike infrastructure per sq. mile: 2.4
> Bicyclist fatalities: 13 (1.52 per 1 million people)
> Population: 8,550,405
> Working-age population commuting by bike: 1.2%
> No. of bike-share bikes: 72 per 100,000 people
[in-text-ad]

10. Fresno, CA
> Bike infrastructure per sq. mile: 3.7
> Bicyclist fatalities: 1 (1.92 per 1 million people)
> Population: 520,052
> Working-age population commuting by bike: 0.7%
> No. of bike-share bikes: N/A
11. San Jose, CA
> Bike infrastructure per sq. mile: 3.1
> Bicyclist fatalities: 5 (4.87 per 1 million people)
> Population: 1,026,908
> Working-age population commuting by bike: 0.8%
> No. of bike-share bikes: 15 per 100,000 people

12. Tucson, AZ
> Bike infrastructure per sq. mile: 1.8
> Bicyclist fatalities: 4 (7.52 per 1 million people)
> Population: 531,641
> Working-age population commuting by bike: 2.5%
> No. of bike-share bikes: N/A
[recirclink id=444391]

13. Albuquerque, NM
> Bike infrastructure per sq. mile: 1.9
> Bicyclist fatalities: 5 (8.94 per 1 million people)
> Population: 559,121
> Working-age population commuting by bike: 1.6%
> No. of bike-share bikes: N/A

14. San Diego, CA
> Bike infrastructure per sq. mile: 2.2
> Bicyclist fatalities: 3 (2.15 per 1 million people)
> Population: 1,394,928
> Working-age population commuting by bike: 1.0%
> No. of bike-share bikes: 30 per 100,000 people
[in-text-ad-2]
15. Los Angeles, CA
> Bike infrastructure per sq. mile: 1.8
> Bicyclist fatalities: 16 (4.03 per 1 million people)
> Population: 3,971,883
> Working-age population commuting by bike: 1.1%
> No. of bike-share bikes: N/A
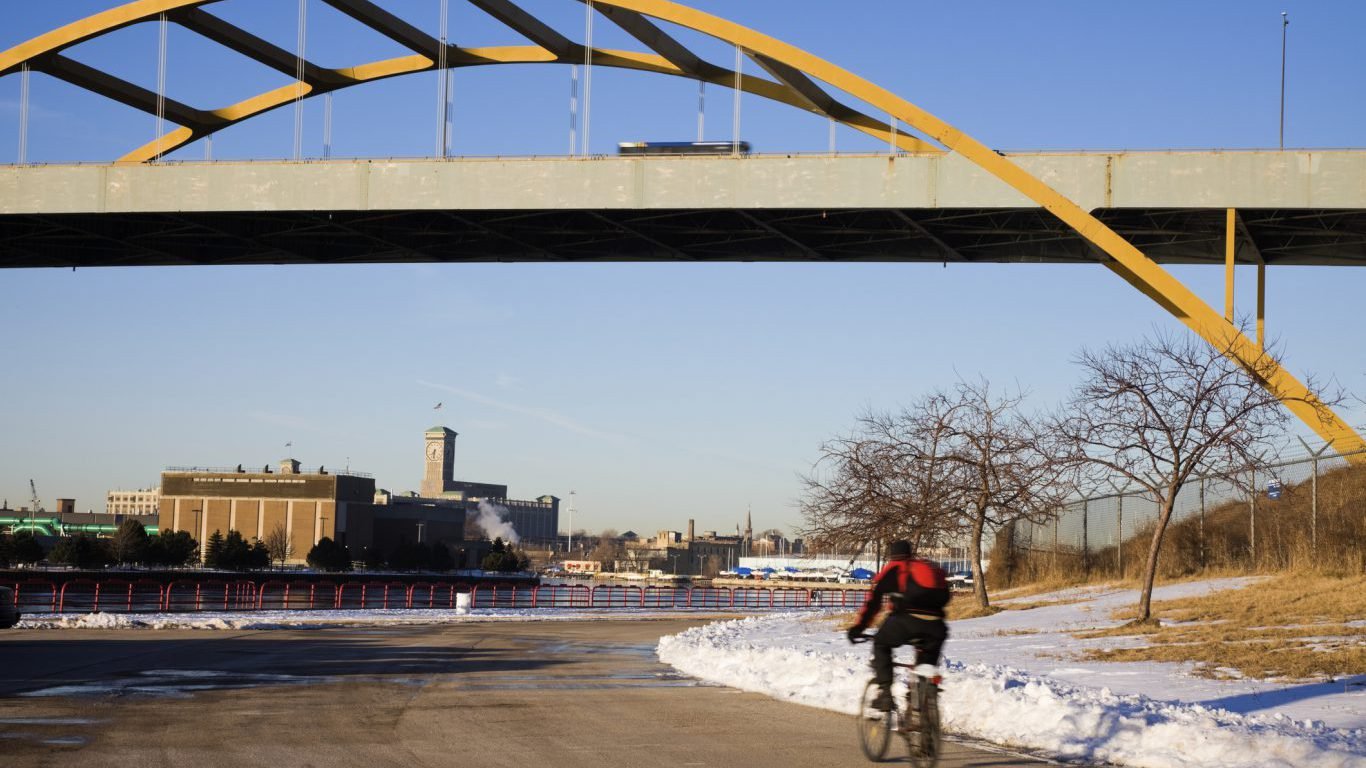
16. Milwaukee, WI
> Bike infrastructure per sq. mile: 2
> Bicyclist fatalities: 1 (1.67 per 1 million people)
> Population: 600,155
> Working-age population commuting by bike: 0.9%
> No. of bike-share bikes: 84 per 100,000 people
[in-text-ad]
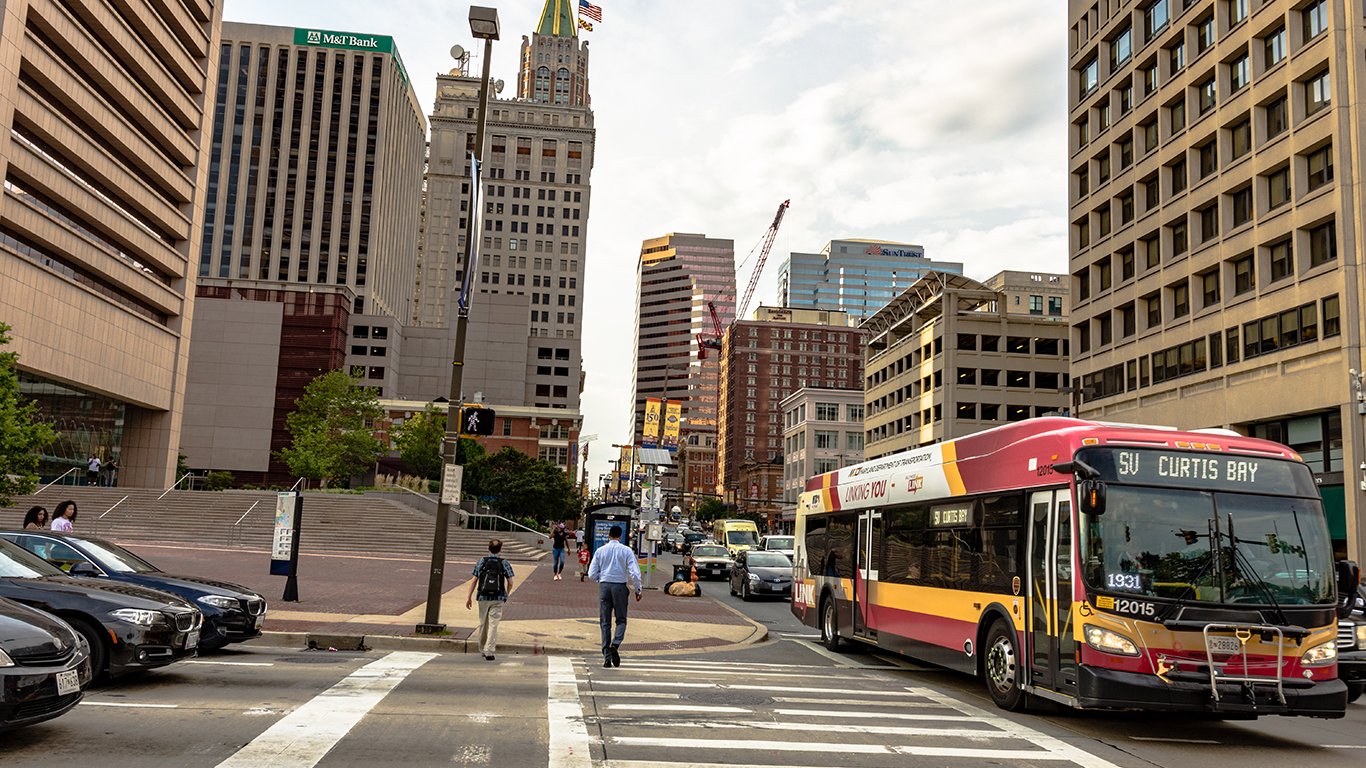
17. Baltimore, MD
> Bike infrastructure per sq. mile: 1.1
> Bicyclist fatalities: 1 (1.61 per 1 million people)
> Population: 621,849
> Working-age population commuting by bike: 1.0%
> No. of bike-share bikes: N/A
[recirclink id=444326]
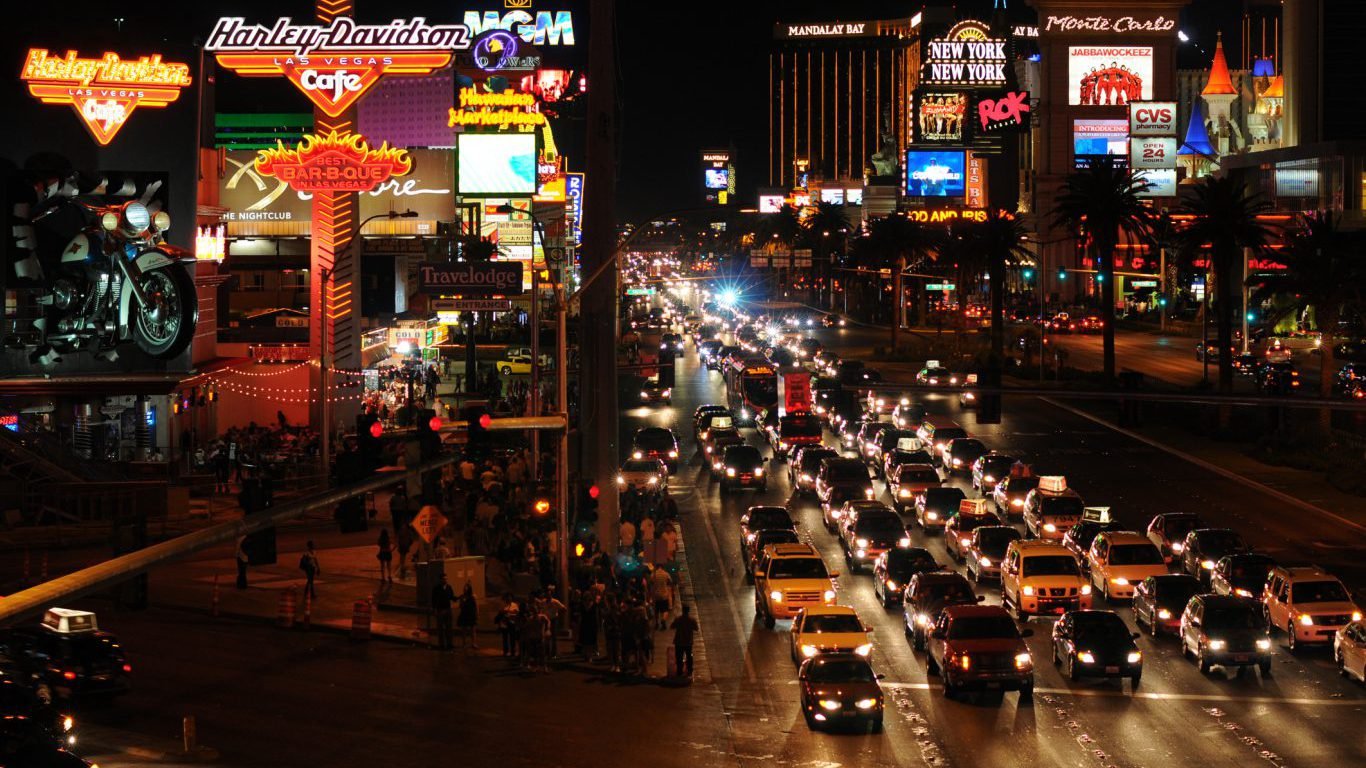
18. Las Vegas, NV
> Bike infrastructure per sq. mile: 3.6
> Bicyclist fatalities: 4 (6.41 per 1 million people)
> Population: 623,747
> Working-age population commuting by bike: 0.3%
> No. of bike-share bikes: N/A

19. Austin, TX
> Bike infrastructure per sq. mile: 0.8
> Bicyclist fatalities: 2 (2.15 per 1 million people)
> Population: 931,830
> Working-age population commuting by bike: 1.5%
> No. of bike-share bikes: 39 per 100,000 people
[in-text-ad]
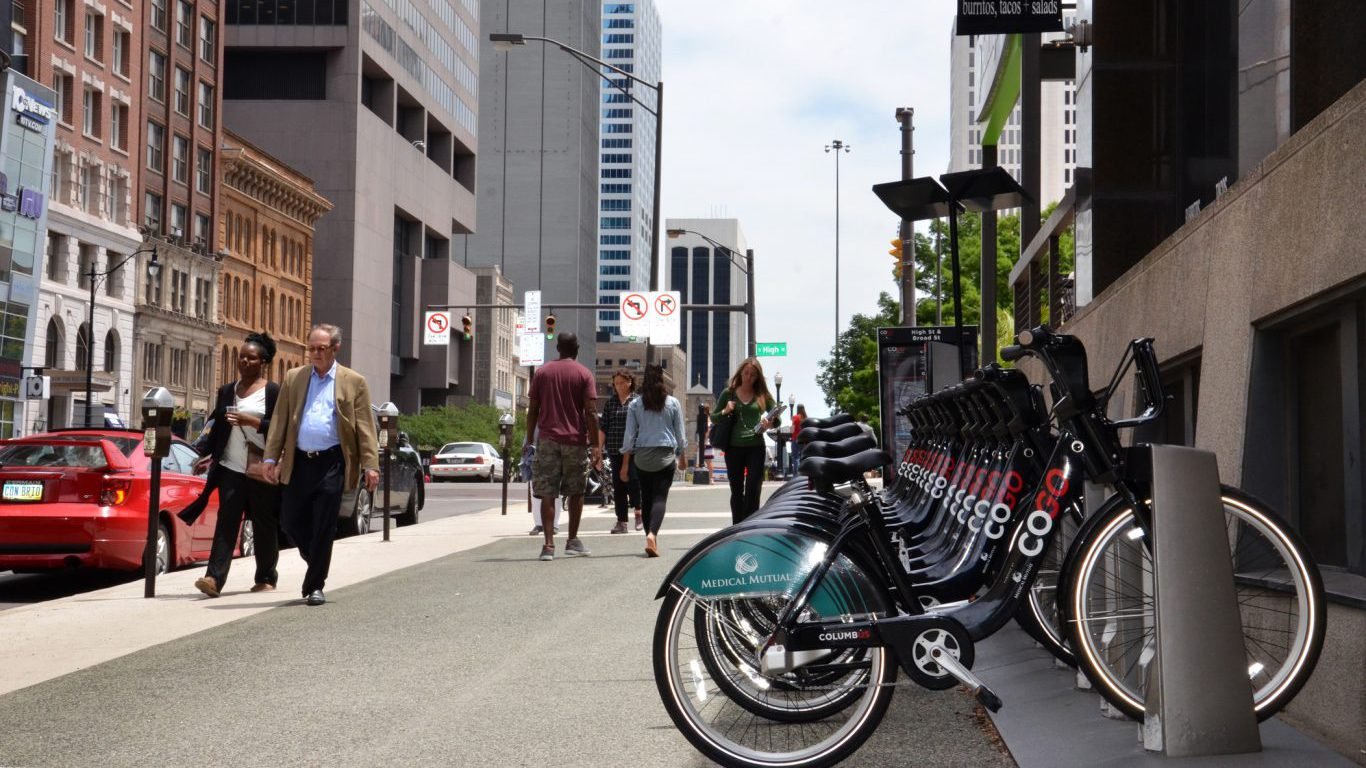
20. Columbus, OH
> Bike infrastructure per sq. mile: 1
> Bicyclist fatalities: 4 (4.71 per 1 million people)
> Population: 850,106
> Working-age population commuting by bike: 0.6%
> No. of bike-share bikes: 37 per 100,000 people

21. Phoenix, AZ
> Bike infrastructure per sq. mile: 0.9
> Bicyclist fatalities: 8 (5.12 per 1 million people)
> Population: 1,563,025
> Working-age population commuting by bike: 0.6%
> No. of bike-share bikes: N/A

22. Jacksonville, FL
> Bike infrastructure per sq. mile: 0.6
> Bicyclist fatalities: 3 (3.46 per 1 million people)
> Population: 868,031
> Working-age population commuting by bike: 0.7%
> No. of bike-share bikes: N/A
[recirclink id=444046]

23. El Paso, TX
> Bike infrastructure per sq. mile: 0.4
> Bicyclist fatalities: 0 (0 per 1 million people)
> Population: 681,124
> Working-age population commuting by bike: 0.4%
> No. of bike-share bikes: N/A

24. Nashville, TN
> Bike infrastructure per sq. mile: 0.7
> Bicyclist fatalities: 0 (0 per 1 million people)
> Population: 654,610
> Working-age population commuting by bike: 0.2%
> No. of bike-share bikes: 30 per 100,000 people
[in-text-ad-2]
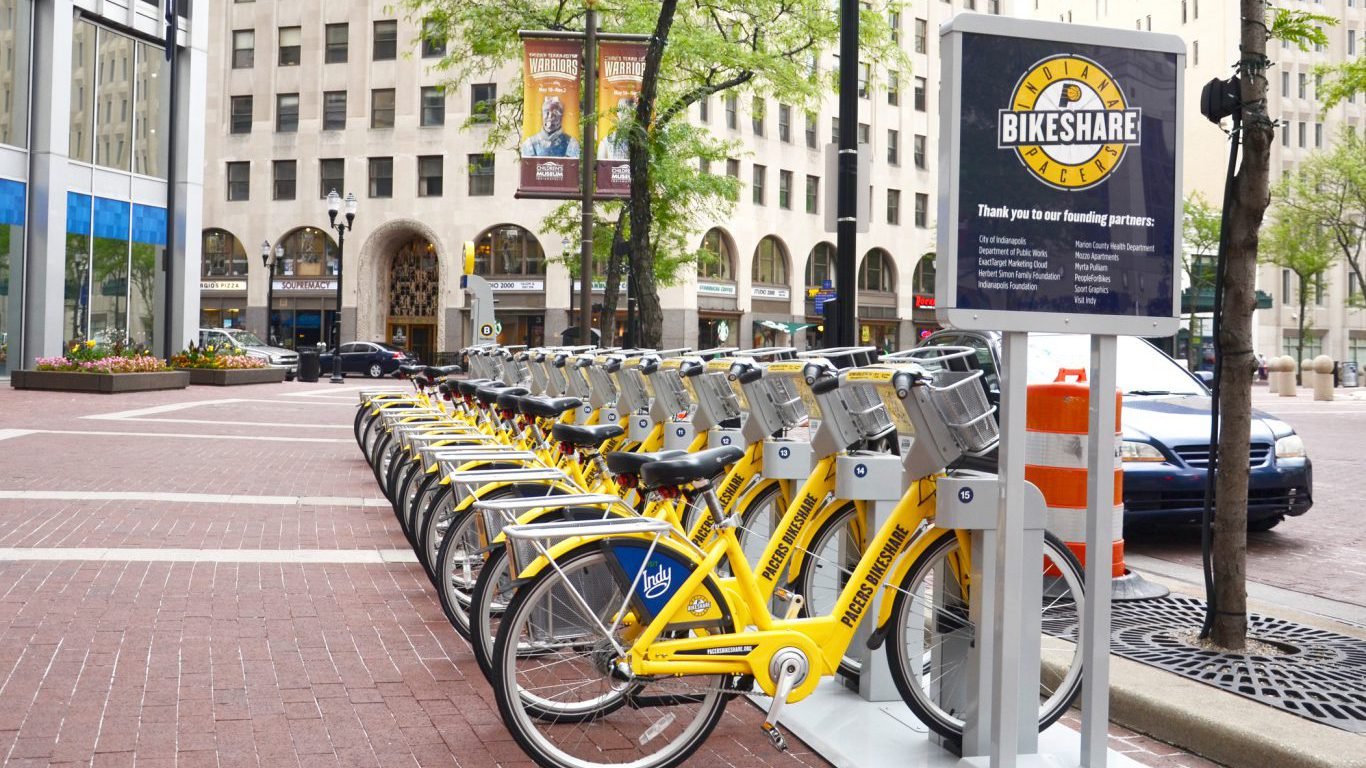
25. Indianapolis, IN
> Bike infrastructure per sq. mile: 0.4
> Bicyclist fatalities: 1 (1.17 per 1 million people)
> Population: 853,173
> Working-age population commuting by bike: 0.5%
> No. of bike-share bikes: 30 per 100,000 people
26. Houston, TX
> Bike infrastructure per sq. mile: 0.3
> Bicyclist fatalities: 5 (2.18 per 1 million people)
> Population: 2,296,224
> Working-age population commuting by bike: 0.5%
> No. of bike-share bikes: 10 per 100,000 people

27. San Antonio, TX
> Bike infrastructure per sq. mile: 0.7
> Bicyclist fatalities: 4 (2.72 per 1 million people)
> Population: 1,469,845
> Working-age population commuting by bike: 0.1%
> No. of bike-share bikes: 33 per 100,000 people
[recirclink id=443940]

28. Louisville, KY
> Bike infrastructure per sq. mile: 0.3
> Bicyclist fatalities: 2 (3.25 per 1 million people)
> Population: 615,366
> Working-age population commuting by bike: 0.4%
> No. of bike-share bikes: N/A

29. Fort Worth, TX
> Bike infrastructure per sq. mile: 0.4
> Bicyclist fatalities: 1 (1.2 per 1 million people)
> Population: 833,319
> Working-age population commuting by bike: 0.1%
> No. of bike-share bikes: 39 per 100,000 people
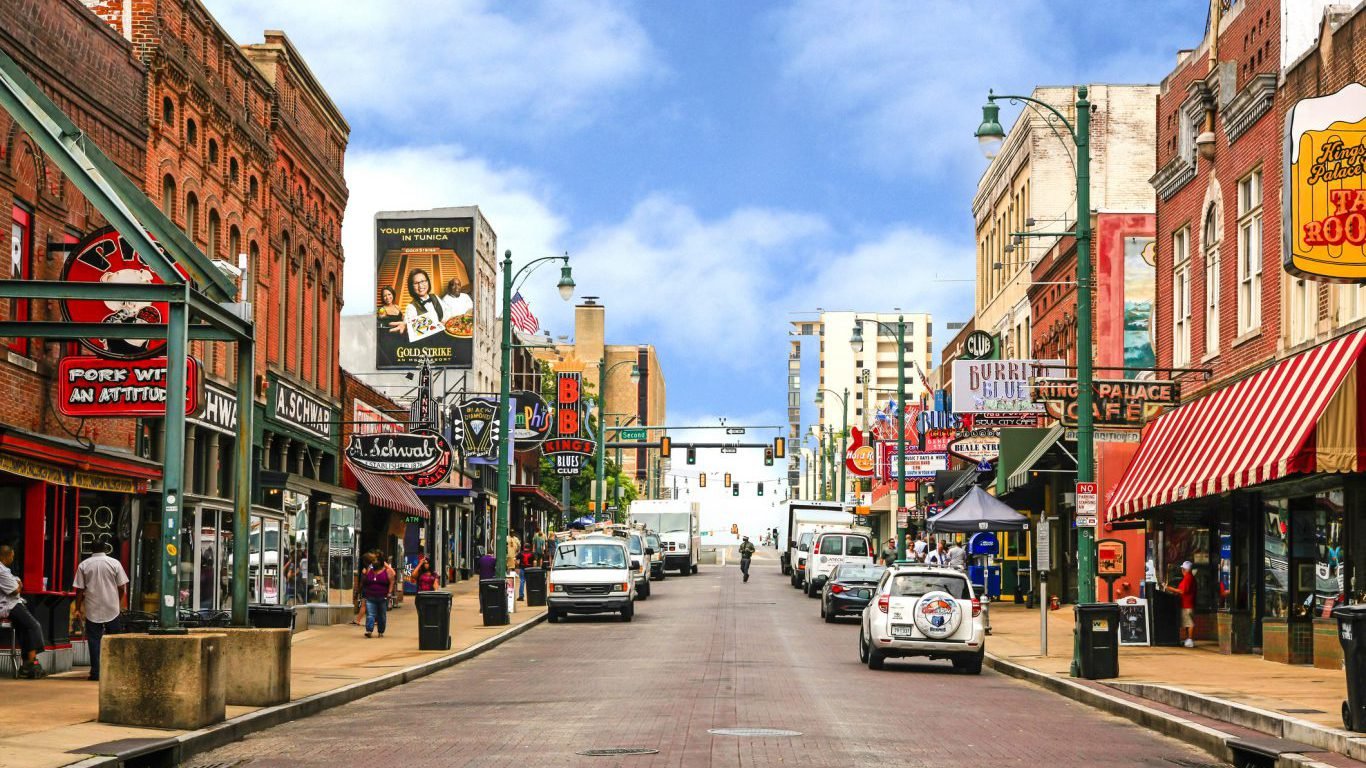
30. Memphis, TN
> Bike infrastructure per sq. mile: 0.6
> Bicyclist fatalities: 3 (4.57 per 1 million people)
> Population: 655,770
> Working-age population commuting by bike: 0.1%
> No. of bike-share bikes: N/A

31. Dallas, TX
> Bike infrastructure per sq. mile: 0.3
> Bicyclist fatalities: 1 (0.77 per 1 million people)
> Population: 1,300,092
> Working-age population commuting by bike: 0.2%
> No. of bike-share bikes: N/A
[in-text-ad]

32. Charlotte, NC
> Bike infrastructure per sq. mile: 0.7
> Bicyclist fatalities: 2 (2.42 per 1 million people)
> Population: 827,097
> Working-age population commuting by bike: 0.0%
> No. of bike-share bikes: 26 per 100,000 people
[recirclink id=443564]

33. Oklahoma City, OK
> Bike infrastructure per sq. mile: 0.2
> Bicyclist fatalities: 0 (0 per 1 million people)
> Population: 631,346
> Working-age population commuting by bike: 0.3%
> No. of bike-share bikes: 16 per 100,000 people
34. Detroit, MI
> Bike infrastructure per sq. mile: N/A
> Bicyclist fatalities: 1 (1.48 per 1 million people)
> Population: 677,116
> Working-age population commuting by bike: 1.0%
> No. of bike-share bikes: N/A
Methodology
To identify the best and worst cities to ride a bike, 24/7 Wall St. created an index based on access to bicycles and bike lanes, safety, and popularity of biking. The total bike miles of bicycle infrastructure per square mile came from the 2016 Walking Bicycling Benchmarking Report. The number of bike-share bikes per every 100,0000 people also came from the Benchmarking Report. We reviewed the number of bicyclists and riders of other pedal-driven vehicles who died in traffic crashes in 2015. The fatality rate is defined as the number of crashes per every 1 million people and was provided for the 34 U.S. cities with populations of 500,000 people or more from the National Highway Traffic Safety Administration. The percentage of residents commuting to work by bike came from the U.S. Census Bureau’s 2016 American Community Survey.
Contact [email protected] for any questions or corrections.