
[cnxvideo id=”506321″ placement=”prodege”]The strength of the U.S. economy is a favorite talking point of politicians, journalists, and business leaders. Indeed, there is plenty of evidence to suggest we are in a period of unprecedented prosperity. The economy has added jobs for a record-breaking 94 consecutive months and shows no signs of slowing; the unemployment rate is nearing its lowest point in decades; and the 19 million new jobs added since the Great Recession is more than double the nearly 8.7 million jobs lost in its wake.
Job growth in recent years has been driven largely by employment gains in major metropolitan areas. Employment in U.S. metro areas climbed 8.8% over the last half decade — nearly triple the comparable 3.2% job growth in the rest of the country.
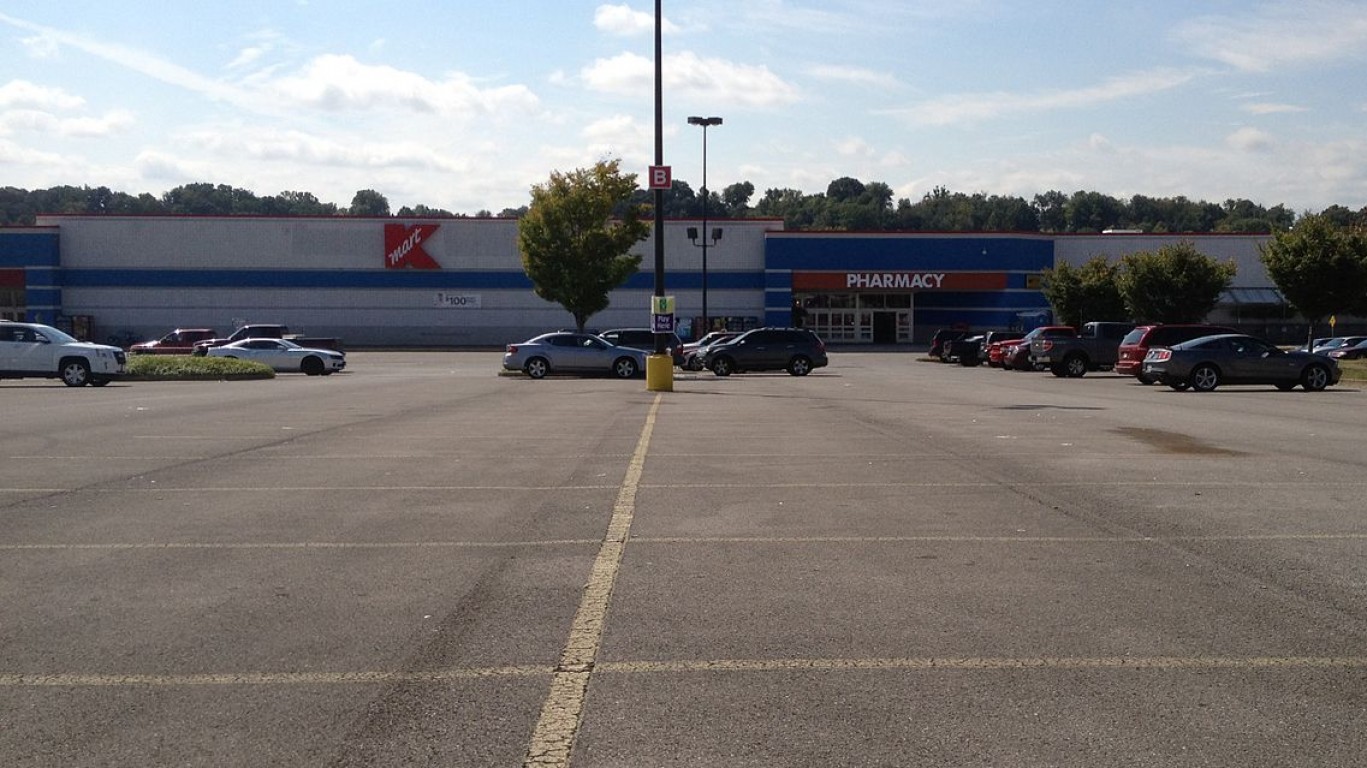
While American cities have generally been hiring hotbeds, driving overall employment growth, there are 43 metro areas nationwide that have fewer jobs now than five years ago. A number of these metro areas have shrinking populations and increasing poverty rates.
Nationwide, 20 states have at least one major metro area with fewer jobs now than five years ago. In the remaining states, there is at least one metro area where employment growth has been slower than the statewide average, the national average, or both over the last half decade.
24/7 Wall St. reviewed changes in total employment in 381 metro areas from May 2013 to May 2018 to identify the metro areas with the weakest job growth in every state.
Click here to see the cities with the weakest job growth in every state.
Click here to see the cities adding the most jobs in every state.
Click here to see our detailed findings and methodology.
Alabama: Anniston-Oxford-Jacksonville
> Employment chg. 2013-2018: -1.1% (44,606 to 44,126)
> State employment chg. 2013-2018: +3.9% (2.0 million to 2.1 million)
> June unemployment: 5.2%
> Industry with weakest job growth: Information
> Employment change in information: -33.3%

Alaska: Fairbanks
> Employment chg. 2013-2018: -2.4% (45,030 to 43,960)
> State employment chg. 2013-2018: -1.4% (340,553 to 335,748)
> June unemployment: 6.0%
> Industry with weakest job growth: Information
> Employment change in information: -20.0%
[recirclink id=444492]
Arizona: Sierra Vista-Douglas
> Employment chg. 2013-2018: -1.1% (46,699 to 46,194)
> State employment chg. 2013-2018: +15.5% (2.8 million to 3.2 million)
> June unemployment: 5.2%
> Industry with weakest job growth: Professional and business services
> Employment change in professional and business services: -16.7%

Arkansas: Pine Bluff
> Employment chg. 2013-2018: -6.7% (35,537 to 33,147)
> State employment chg. 2013-2018: +5.5% (1.2 million to 1.3 million)
> June unemployment: 5.1%
> Industry with weakest job growth: Government
> Employment change in government: -6.0%
California: Bakersfield
> Employment chg. 2013-2018: +0.7% (349,569 to 352,010)
> State employment chg. 2013-2018: +9.0% (17.0 million to 18.6 million)
> June unemployment: 8.4%
> Industry with weakest job growth: Mining and logging
> Employment change in mining and logging: -30.7%

Colorado: Grand Junction
> Employment chg. 2013-2018: +9.0% (67,587 to 73,692)
> State employment chg. 2013-2018: +16.8% (2.6 million to 3.0 million)
> June unemployment: 3.6%
> Industry with weakest job growth: Information
> Employment change in information: -25.0%
[in-text-ad]

Connecticut: Norwich-New London
> Employment chg. 2013-2018: +4.7% (132,244 to 138,505)
> State employment chg. 2013-2018: +5.8% (1.7 million to 1.8 million)
> June unemployment: 4.2%
> Industry with weakest job growth: Government
> Employment change in government: -9.4%
[recirclink id=444468]

Delaware: Dover
> Employment chg. 2013-2018: +12.1% (68,358 to 76,606)
> State employment chg. 2013-2018: +13.9% (410,908 to 468,143)
> June unemployment: 4.3%
> Industry with weakest job growth: Information
> Employment change in information: -40.0%

Florida: Homosassa Springs
> Employment chg. 2013-2018: +1.8% (45,265 to 46,064)
> State employment chg. 2013-2018: +12.4% (8.8 million to 9.9 million)
> June unemployment: 5.2%
> Industry with weakest job growth: Government
> Employment change in government: +9.5%
[in-text-ad-2]

Georgia: Columbus
> Employment chg. 2013-2018: +1.1% (119,459 to 120,795)
> State employment chg. 2013-2018: +13.2% (4.4 million to 5.0 million)
> June unemployment: 4.8%
> Industry with weakest job growth: Information
> Employment change in information: -18.8%

Hawaii: Urban Honolulu
> Employment chg. 2013-2018: +7.4% (431,162 to 463,249)
> State employment chg. 2013-2018: +9.1% (617,311 to 673,649)
> June unemployment: 2.0%
> Industry with weakest job growth: Government
> Employment change in government: +1.0%
[in-text-ad]

Idaho: Pocatello
> Employment chg. 2013-2018: +6.6% (39,481 to 42,099)
> State employment chg. 2013-2018: +14.6% (726,135 to 831,838)
> June unemployment: 2.7%
> Industry with weakest job growth: Transportation, warehousing, and utilities
> Employment change in transportation, warehousing, and utilities: None
[recirclink id=444391]

Illinois: Peoria
> Employment chg. 2013-2018: -1.3% (175,230 to 172,906)
> State employment chg. 2013-2018: +4.3% (6.0 million to 6.2 million)
> June unemployment: 5.0%
> Industry with weakest job growth: Transportation, warehousing, and utilities
> Employment change in transportation, warehousing, and utilities: -18.6%

Indiana: Michigan City-La Porte
> Employment chg. 2013-2018: +3.6% (44,890 to 46,516)
> State employment chg. 2013-2018: +11.6% (3.0 million to 3.3 million)
> June unemployment: 4.5%
> Industry with weakest job growth: Information
> Employment change in information: -33.3%
[in-text-ad-2]
Iowa: Waterloo-Cedar Falls
> Employment chg. 2013-2018: -3.1% (88,333 to 85,589)
> State employment chg. 2013-2018: +2.9% (1.6 million to 1.6 million)
> June unemployment: 2.7%
> Industry with weakest job growth: Financial activities
> Employment change in financial activities: -9.4%

Kansas: Topeka
> Employment chg. 2013-2018: -0.3% (114,085 to 113,738)
> State employment chg. 2013-2018: +1.6% (1.4 million to 1.4 million)
> June unemployment: 3.6%
> Industry with weakest job growth: Wholesale trade
> Employment change in wholesale trade: -8.8%
[in-text-ad]

Kentucky: Owensboro
> Employment chg. 2013-2018: +2.4% (53,111 to 54,393)
> State employment chg. 2013-2018: +4.1% (1.9 million to 2.0 million)
> June unemployment: 4.2%
> Industry with weakest job growth: Information
> Employment change in information: -25.0%
[recirclink id=444326]

Louisiana: Houma-Thibodaux
> Employment chg. 2013-2018: -10.1% (94,429 to 84,925)
> State employment chg. 2013-2018: +3.6% (2.0 million to 2.0 million)
> June unemployment: 5.2%
> Industry with weakest job growth: Mining and logging
> Employment change in mining and logging: -36.1%

Maine: Bangor
> Employment chg. 2013-2018: +0.3% (67,978 to 68,192)
> State employment chg. 2013-2018: +4.1% (655,565 to 682,267)
> June unemployment: 3.3%
> Industry with weakest job growth: Information
> Employment change in information: -36.4%
[in-text-ad-2]

Maryland: Cumberland
> Employment chg. 2013-2018: +0.4% (42,268 to 42,416)
> State employment chg. 2013-2018: +5.8% (2.9 million to 3.1 million)
> June unemployment: 5.8%
> Industry with weakest job growth: Government
> Employment change in government: -10.6%

Massachusetts: Pittsfield
> Employment chg. 2013-2018: +3.8% (40,451 to 41,997)
> State employment chg. 2013-2018: +12.1% (3.3 million to 3.7 million)
> June unemployment: 4.4%
> Industry with weakest job growth: Information
> Employment change in information: -16.7%
[in-text-ad]

Michigan: Bay City
> Employment chg. 2013-2018: -0.8% (48,859 to 48,450)
> State employment chg. 2013-2018: +9.2% (4.3 million to 4.7 million)
> June unemployment: 4.9%
> Industry with weakest job growth: Other services
> Employment change in other services: -18.8%
[recirclink id=444046]

Minnesota: Duluth
> Employment chg. 2013-2018: +3.7% (135,089 to 140,118)
> State employment chg. 2013-2018: +7.5% (2.8 million to 3.0 million)
> June unemployment: 3.7%
> Industry with weakest job growth: Information
> Employment change in information: -13.3%

Mississippi: Gulfport-Biloxi-Pascagoula
> Employment chg. 2013-2018: +1.9% (153,858 to 156,855)
> State employment chg. 2013-2018: +4.7% (1.2 million to 1.2 million)
> June unemployment: 5.2%
> Industry with weakest job growth: Transportation, warehousing, and utilities
> Employment change in transportation, warehousing, and utilities: -14.9%
[in-text-ad-2]

Missouri: Joplin
> Employment chg. 2013-2018: +0.3% (82,031 to 82,286)
> State employment chg. 2013-2018: +5.0% (2.8 million to 3.0 million)
> June unemployment: 2.7%
> Industry with weakest job growth: Government
> Employment change in government: -3.0%

Montana: Great Falls
> Employment chg. 2013-2018: +0.2% (36,554 to 36,626)
> State employment chg. 2013-2018: +4.1% (485,750 to 505,759)
> June unemployment: 3.4%
> Industry with weakest job growth: Professional and business services
> Employment change in professional and business services: -3.1%
[in-text-ad]

Nebraska: Grand Island
> Employment chg. 2013-2018: -2.5% (43,662 to 42,589)
> State employment chg. 2013-2018: +0.3% (985,755 to 988,458)
> June unemployment: 3.0%
> Industry with weakest job growth: Government
> Employment change in government: -5.6%
[recirclink id=443940]

Nevada: Carson City
> Employment chg. 2013-2018: +10.3% (22,831 to 25,182)
> State employment chg. 2013-2018: +14.9% (1.2 million to 1.4 million)
> June unemployment: 4.5%
> Industry with weakest job growth: Manufacturing
> Employment change in manufacturing: None

New Hampshire: Manchester-Nashua
> Employment chg. 2013-2018: +7.2% (107,809 to 115,569)
> State employment chg. 2013-2018: +4.8% (701,613 to 735,499)
> June unemployment: 2.5%
> Industry with weakest job growth: Government
> Employment change in government: -2.5%
[in-text-ad-2]

New Jersey: Atlantic City-Hammonton
> Employment chg. 2013-2018: -8.0% (121,811 to 112,012)
> State employment chg. 2013-2018: +2.3% (4.2 million to 4.3 million)
> June unemployment: 6.0%
> Industry with weakest job growth: Leisure and hospitality
> Employment change in leisure and hospitality: -23.7%

New Mexico: Farmington
> Employment chg. 2013-2018: -1.7% (51,205 to 50,333)
> State employment chg. 2013-2018: +4.0% (859,642 to 894,321)
> June unemployment: 4.8%
> Industry with weakest job growth: Government
> Employment change in government: -3.5%
[in-text-ad]
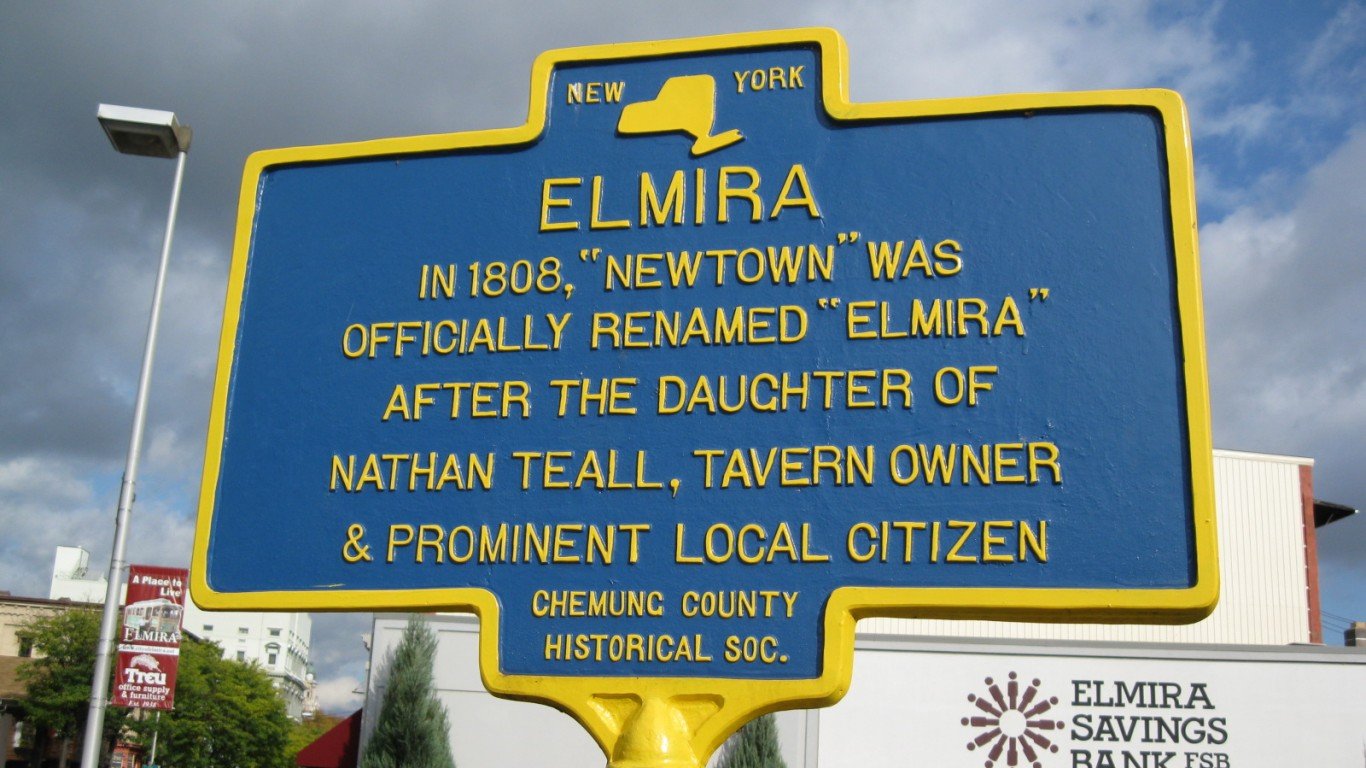
New York: Elmira
> Employment chg. 2013-2018: -9.1% (36,712 to 33,387)
> State employment chg. 2013-2018: +3.6% (9.0 million to 9.3 million)
> June unemployment: 4.9%
> Industry with weakest job growth: Professional and business services
> Employment change in professional and business services: -28.0%
[recirclink id=443564]

North Carolina: Rocky Mount
> Employment chg. 2013-2018: -0.3% (61,440 to 61,234)
> State employment chg. 2013-2018: +11.5% (4.3 million to 4.8 million)
> June unemployment: 5.9%
> Industry with weakest job growth: Professional and business services
> Employment change in professional and business services: -7.5%

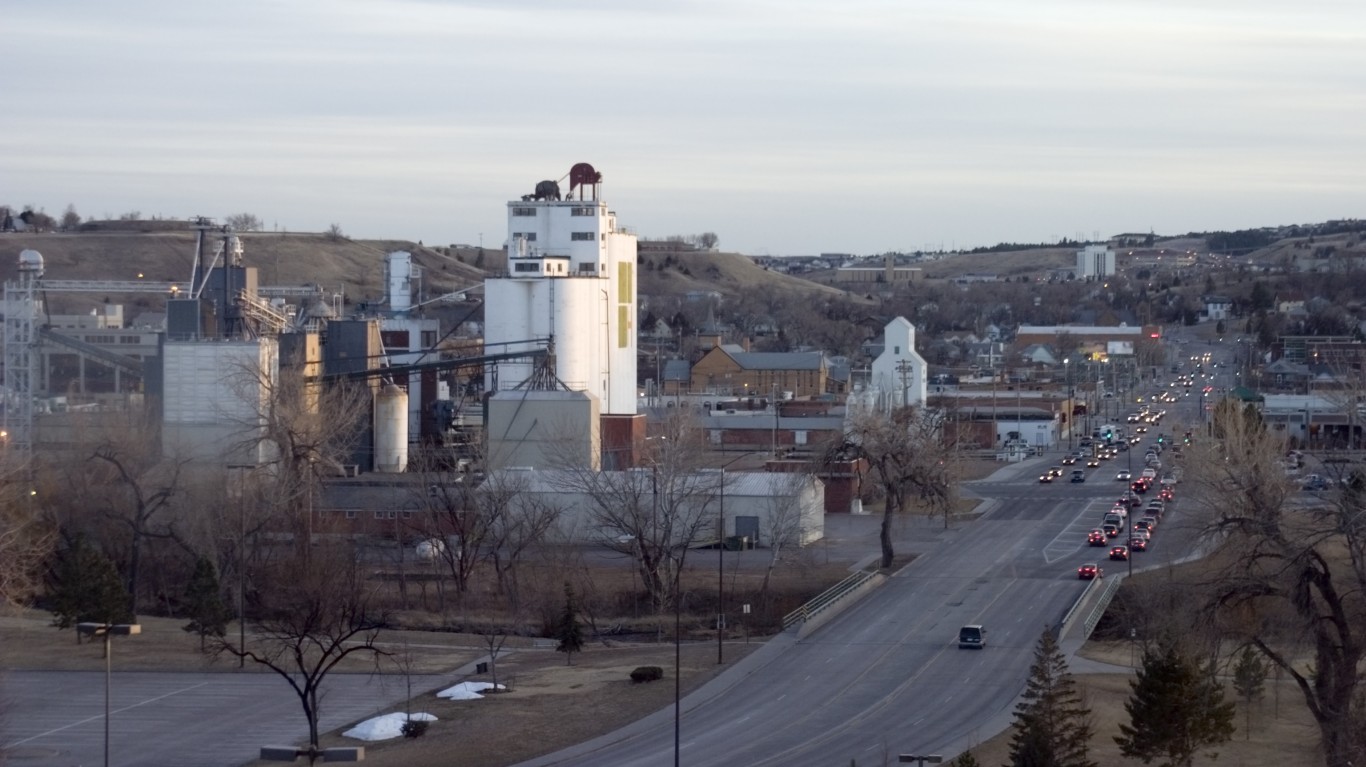
North Dakota: Bismarck
> Employment chg. 2013-2018: +4.9% (64,406 to 67,533)
> State employment chg. 2013-2018: +0.7% (396,546 to 399,161)
> June unemployment: 2.7%
> Industry with weakest job growth: Manufacturing
> Employment change in manufacturing: -23.8%
[in-text-ad-2]
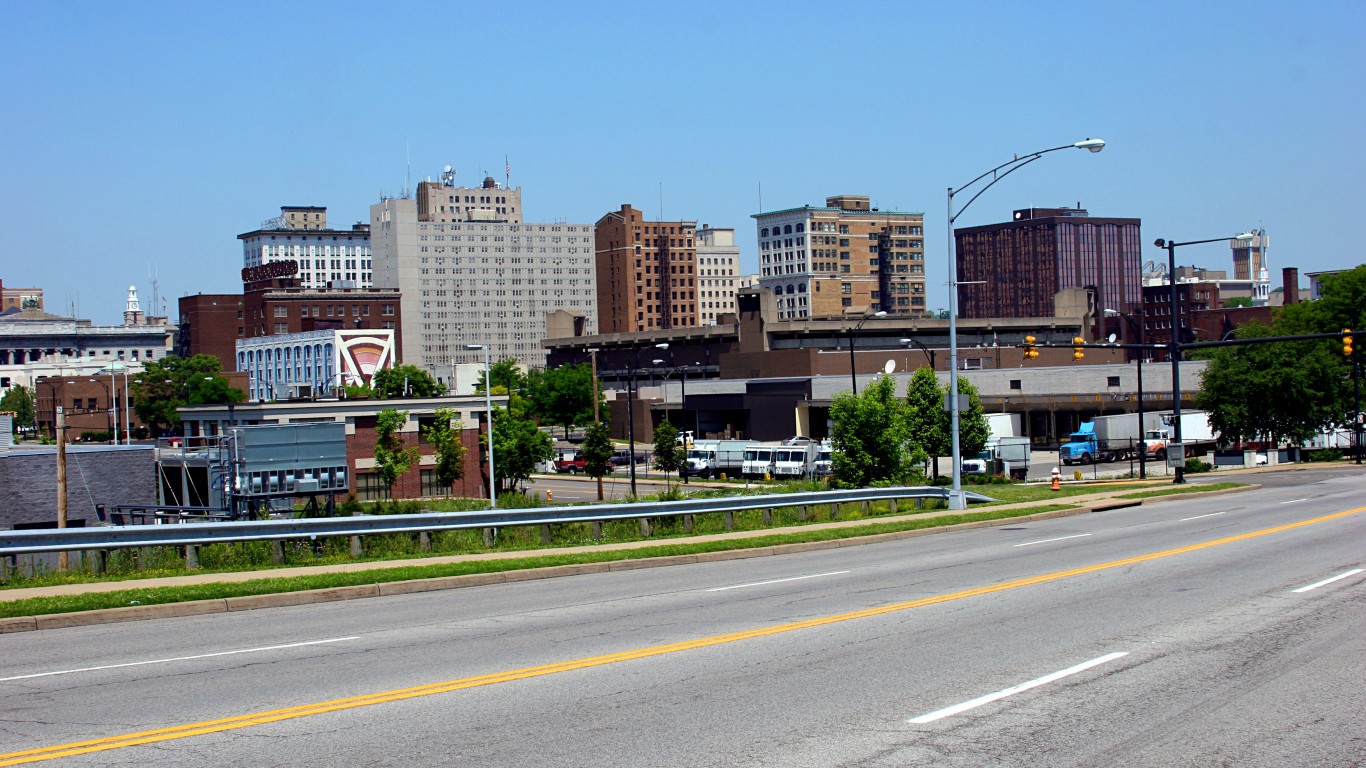
Ohio: Youngstown-Warren-Boardman
> Employment chg. 2013-2018: -3.6% (238,462 to 229,869)
> State employment chg. 2013-2018: +4.5% (5.3 million to 5.6 million)
> June unemployment: 5.8%
> Industry with weakest job growth: Professional and business services
> Employment change in professional and business services: -17.5%
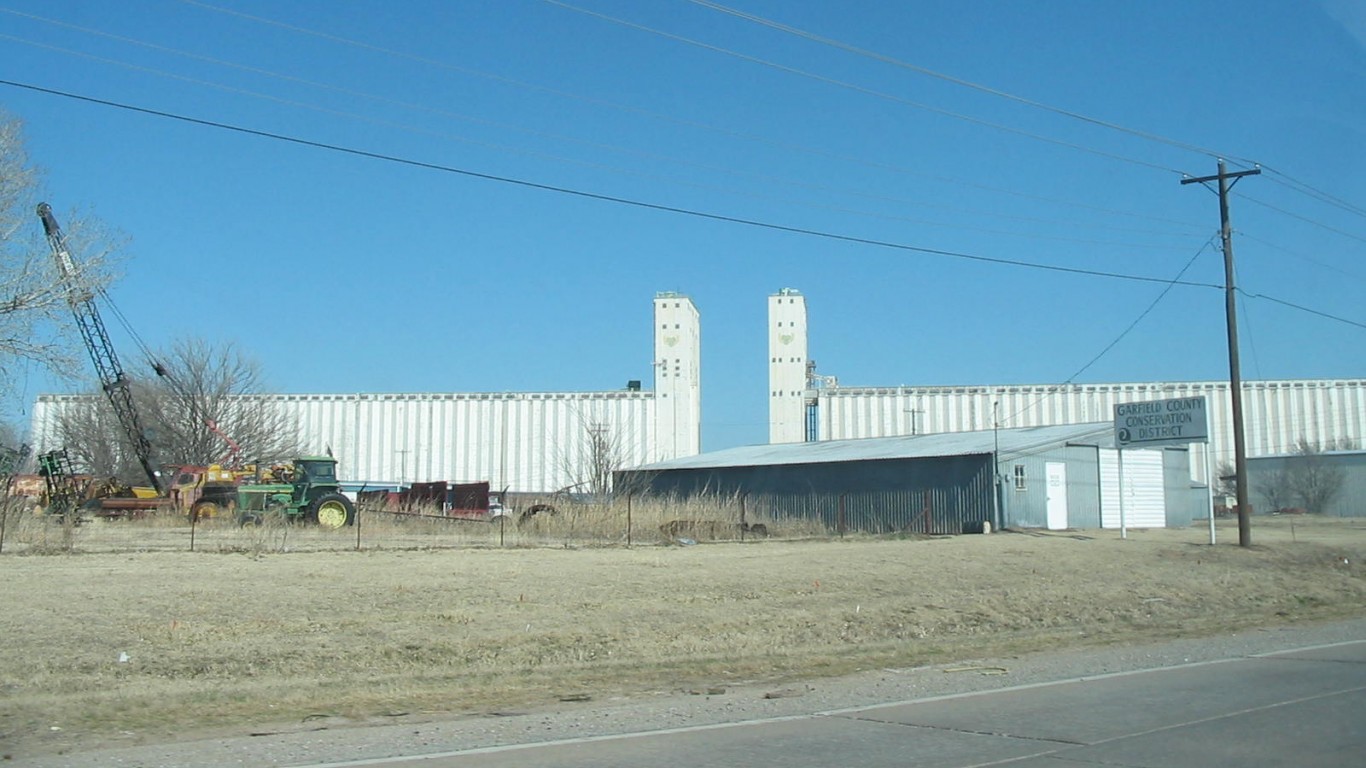
Oklahoma: Enid
> Employment chg. 2013-2018: -7.4% (28,507 to 26,400)
> State employment chg. 2013-2018: +4.5% (1.7 million to 1.8 million)
> June unemployment: 3.2%
> Industry with weakest job growth: Government
> Employment change in government: -5.1%
[in-text-ad]

Oregon: Corvallis
> Employment chg. 2013-2018: +12.2% (42,214 to 47,363)
> State employment chg. 2013-2018: +15.4% (1.8 million to 2.0 million)
> June unemployment: 2.9%
> Industry with weakest job growth: Information
> Employment change in information: -16.7%
[recirclink id=443882]

Pennsylvania: Williamsport
> Employment chg. 2013-2018: -7.2% (57,347 to 53,244)
> State employment chg. 2013-2018: +1.9% (6.0 million to 6.1 million)
> June unemployment: 4.5%
> Industry with weakest job growth: Trade, transportation, and utilities
> Employment change in trade, transportation, and utilities: -10.8%

Rhode Island: Providence-Warwick
> Employment chg. 2013-2018: +8.0% (616,857 to 665,982)
> State employment chg. 2013-2018: +6.9% (502,147 to 536,972)
> June unemployment: 4.0%
> Industry with weakest job growth: Information
> Employment change in information: -18.6%
[in-text-ad-2]
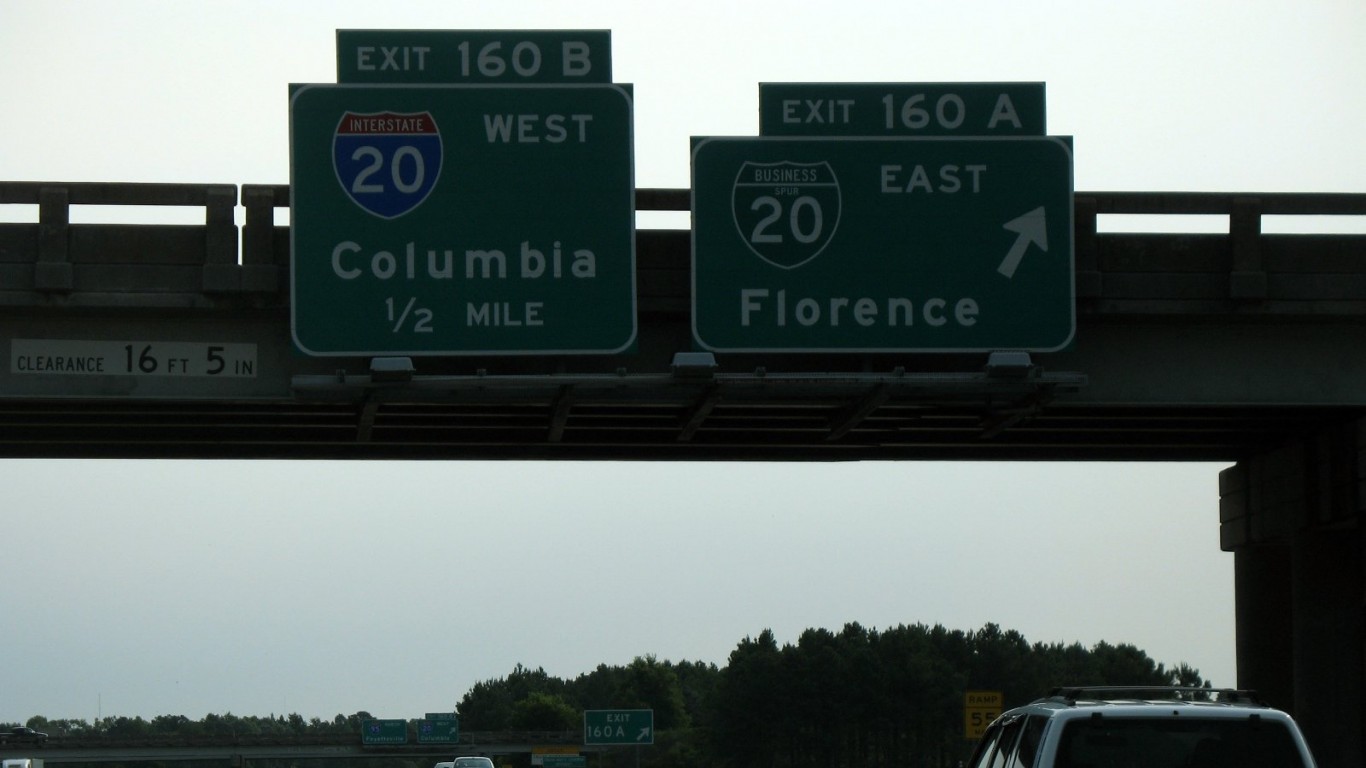
South Carolina: Florence
> Employment chg. 2013-2018: +3.7% (88,223 to 91,510)
> State employment chg. 2013-2018: +9.9% (2.0 million to 2.2 million)
> June unemployment: 3.4%
> Industry with weakest job growth: Government
> Employment change in government: +3.8%
South Dakota: Rapid City
> Employment chg. 2013-2018: +6.5% (68,021 to 72,447)
> State employment chg. 2013-2018: +4.2% (427,395 to 445,496)
> June unemployment: 3.1%
> Industry with weakest job growth: Information
> Employment change in information: -11.1%
[in-text-ad]
Tennessee: Kingsport-Bristol-Bristol
> Employment chg. 2013-2018: +1.4% (132,871 to 134,725)
> State employment chg. 2013-2018: +10.3% (2.9 million to 3.2 million)
> June unemployment: 3.7%
> Industry with weakest job growth: Information
> Employment change in information: -35.0%
[recirclink id=443620]
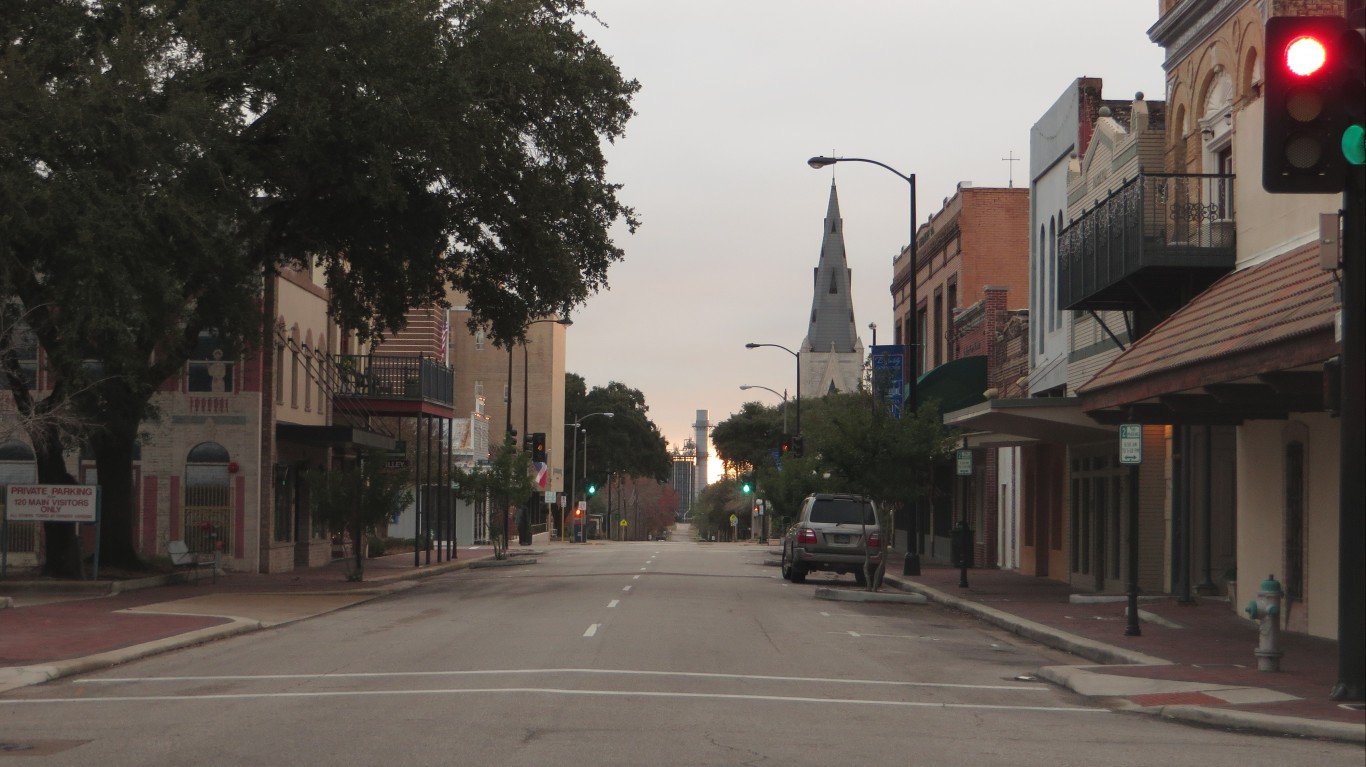
Texas: Victoria
> Employment chg. 2013-2018: -6.8% (46,841 to 43,638)
> State employment chg. 2013-2018: +10.3% (12.1 million to 13.3 million)
> June unemployment: 3.9%
> Industry with weakest job growth: Manufacturing
> Employment change in manufacturing: -33.3%

Utah: Logan
> Employment chg. 2013-2018: +13.8% (61,741 to 70,264)
> State employment chg. 2013-2018: +15.7% (1.3 million to 1.5 million)
> June unemployment: 2.6%
> Industry with weakest job growth: Information
> Employment change in information: -25.0%
[in-text-ad-2]

Vermont: Burlington-South Burlington
> Employment chg. 2013-2018: +3.6% (119,597 to 123,877)
> State employment chg. 2013-2018: +1.4% (333,604 to 338,332)
> June unemployment: 3.8%
> Industry with weakest job growth: Manufacturing
> Employment change in manufacturing: -13.8%
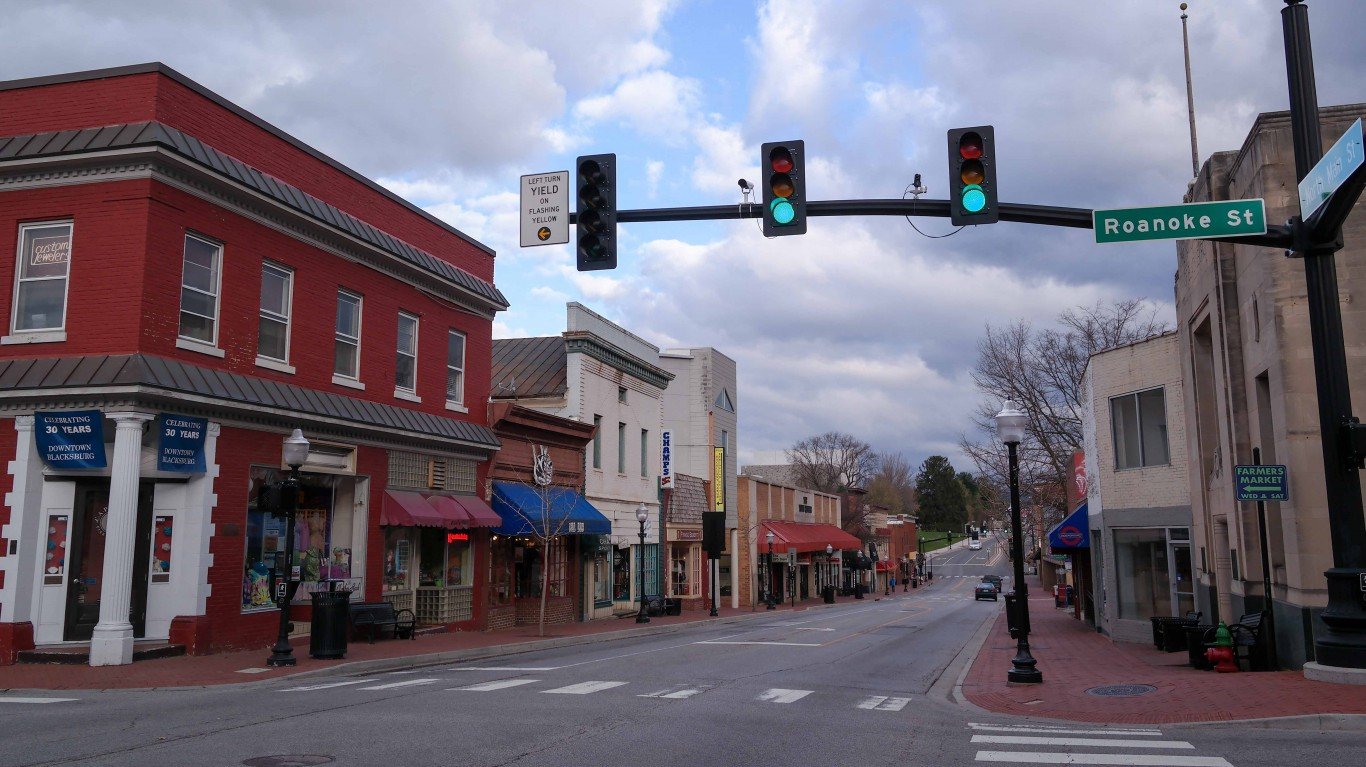
Virginia: Blacksburg-Christiansburg-Radford
> Employment chg. 2013-2018: +1.8% (86,483 to 88,052)
> State employment chg. 2013-2018: +5.7% (4.0 million to 4.2 million)
> June unemployment: 3.2%
> Industry with weakest job growth: Government
> Employment change in government: -0.9%
[in-text-ad]

Washington: Walla Walla
> Employment chg. 2013-2018: +6.9% (28,351 to 30,318)
> State employment chg. 2013-2018: +11.4% (3.2 million to 3.6 million)
> June unemployment: 4.7%
> Industry with weakest job growth: Information
> Employment change in information: -25.0%
[recirclink id=443575]
West Virginia: Parkersburg-Vienna
> Employment chg. 2013-2018: -5.9% (38,758 to 36,483)
> State employment chg. 2013-2018: -0.4% (751,043 to 748,008)
> June unemployment: 5.6%
> Industry with weakest job growth: Manufacturing
> Employment change in manufacturing: -21.9%

Wisconsin: Racine
> Employment chg. 2013-2018: +5.0% (91,530 to 96,143)
> State employment chg. 2013-2018: +7.5% (2.9 million to 3.1 million)
> June unemployment: 3.7%
> Industry with weakest job growth: Financial activities
> Employment change in financial activities: -14.8%
[in-text-ad-2]

Wyoming: Casper
> Employment chg. 2013-2018: -10.2% (41,049 to 36,862)
> State employment chg. 2013-2018: -5.9% (291,200 to 274,136)
> June unemployment: 4.5%
> Industry with weakest job growth: Mining and logging
> Employment change in mining and logging: -46.3%
Detailed Findings
Cities have been the primary driver of employment growth in the U.S. over the last half decade. As a result, it may not be surprising that there are several states with no cities reporting a five-year drop in employment.
Such states include Delaware, New Hampshire, Rhode Island, and Vermont, which each have only one major metro area. While in these special cases the state’s only metro area has the weakest job growth in the state by default, their economies still have some weaknesses.
For example, despite a net increase in employment across all industries, the information sector shed 40.0% of its workforce in Dover, Delaware, and 18.6% in Providence, Rhode Island, over the last five-years. Meanwhile, employment in the government sector contracted by 2.5% in Manchester, New Hampshire, while Burlington, Vermont’s manufacturing sector reported a 13.8% reduction in its workforce over the last five years.
Indeed, in nearly every city on this list with net five-year employment increases, there has been at least one industry that reported an overall decline in employment since 2013. Additionally, every city on this list — even those with double-digit job growth — has had slower five-year growth than either its home state or the nation as a whole, or both.
One of the primary drivers of job growth in American cities is population growth, which ultimately drives up demand for services. At the same time, a prosperous economy creates job opportunities, and is more likely to attract new residents. In just over half of the cities with the weakest job growth in every state, the population is smaller today than it was five years ago. Only eight cities on this list have had more rapid population growth than the 3.0% U.S. growth rate over the last half decade.
Partially due to a shrinking population or slower than average population growth, there are fewer job-seekers and workers in many cities on this list. And regardless of whether a city has positive or negative job growth, a smaller labor force can translate to an improvement in the unemployment rate. Among the metro areas on this list, unemployment rates range from as low as 2.0% in Honolulu, Hawaii, to 8.4% in Bakersfield, California.
In many cities with the worst job growth in each state, financial conditions are worsening for residents. In 14 cities on this list, the share of households earning $200,000 or more a year is smaller now than it was five years ago. Even more troubling, the poverty rate climbed in 12 cities on this list over the last half decade.
Methodology
To determine the cities with the worst job market in every state, 24/7 Wall St. reviewed employment growth for 381 metropolitan statistical areas for the period of May 2013 to May 2018 with data from the Bureau of Labor Statistics. Supplementary data on unemployment and employment by industry also came from the BLS. We also reviewed 2013 and 2016 poverty rates and households earning $200,000 or more per year from the U.S. Census Bureau’s American Community Survey. Population estimates come from Census Bureau data for July 2013 and July 2017.
Contact [email protected] for any questions or corrections.