

With unemployment at over a decade low, wages at all-time highs, and poverty on the decline, the U.S. economy is flourishing — or so it would seem. For Americans struggling financially it can be difficult to feel encouraged by such optimistic reports. It is a common complaint among ordinary Americans and economists alike: economic measures might be indicative of overall economic performance but rarely connect to the lived experiences of Americans.
For example, while the federal minimum wage is $7.25 an hour, most agree this is not a livable wage. The Economic Policy Institute, a non profit think tank, calculated the income families need to secure a modest, yet adequate standard of living in counties and metro areas across the United States. Americans entering the workforce or starting a family have thousands of cities to choose from — and some are more expensive places than others.
In order to illustrate what it looks like to live in the most and least expensive places, 24/7 Wall St. reviewed monthly living expenses from EPI’s family budget calculator in the most expensive metro areas based on the Bureau of Economic Analysis’ regional price parities. According to the EPI, compared with federal measures of poverty, its family budgets provide a more accurate and complete measure of economic security in America.
In an email to 24/7 Wall St., EPI research assistant Zane Mokhiber explained, “Wherever housing and childcare is expensive, cities are expensive, and vice versa.” By contrast, food, transportation, and health care costs tend to be relatively uniform across the the nation’s major cities.
In all of the 25 cities where goods and services are most expensive — with the exception of the Riverside, California, metro area — average monthly housing costs for a family of four are $1,200 or higher. Childcare costs for families living in these cities average between $1,000 and nearly $3,000 per month. In 10 of the cities on this list, monthly childcare costs exceed housing expenses.
As Mokhiber noted, a high cost of living is not the same as low affordability, and it is important to measure living costs against income. While not universally the case, residents of the most expensive cities tend to have higher incomes.
Click here to see what it actually costs to live in America’s most expensive cities.
Click here to see our methodology.

25. Baltimore-Columbia-Towson, MD
> BEA cost of living: 7.2% more expensive than national average
> Monthly living costs, family of 4: $7,378
> Monthly housing costs, family of 4: $1,325
> Monthly food costs, family of 4: $799
> Adults with at least a bachelor’s degree: 39.5%
> Poverty rate: 10.4%
[in-text-ad]

24. Riverside-San Bernardino-Ontario, CA
> BEA cost of living: 7.4% more expensive than national average
> Monthly living costs, family of 4: $6,528
> Monthly housing costs, family of 4: $1,156
> Monthly food costs, family of 4: $757
> Adults with at least a bachelor’s degree: 21.0%
> Poverty rate: 16.4%

23. Miami-Fort Lauderdale-West Palm Beach, FL
> BEA cost of living: 7.6% more expensive than national average
> Monthly living costs, family of 4: $7,081
> Monthly housing costs, family of 4: $1,351
> Monthly food costs, family of 4: $853
> Adults with at least a bachelor’s degree: 30.5%
> Poverty rate: 15.4%

22. Salinas, CA
> BEA cost of living: 8.1% more expensive than national average
> Monthly living costs, family of 4: $8,083
> Monthly housing costs, family of 4: $1,433
> Monthly food costs, family of 4: $802
> Adults with at least a bachelor’s degree: 24.8%
> Poverty rate: 12.5%
[in-text-ad-2]

21. Manchester-Nashua, NH
> BEA cost of living: 8.5% more expensive than national average
> Monthly living costs, family of 4: $6,977
> Monthly housing costs, family of 4: $1,218
> Monthly food costs, family of 4: $817
> Adults with at least a bachelor’s degree: 37.3%
> Poverty rate: 8.2%
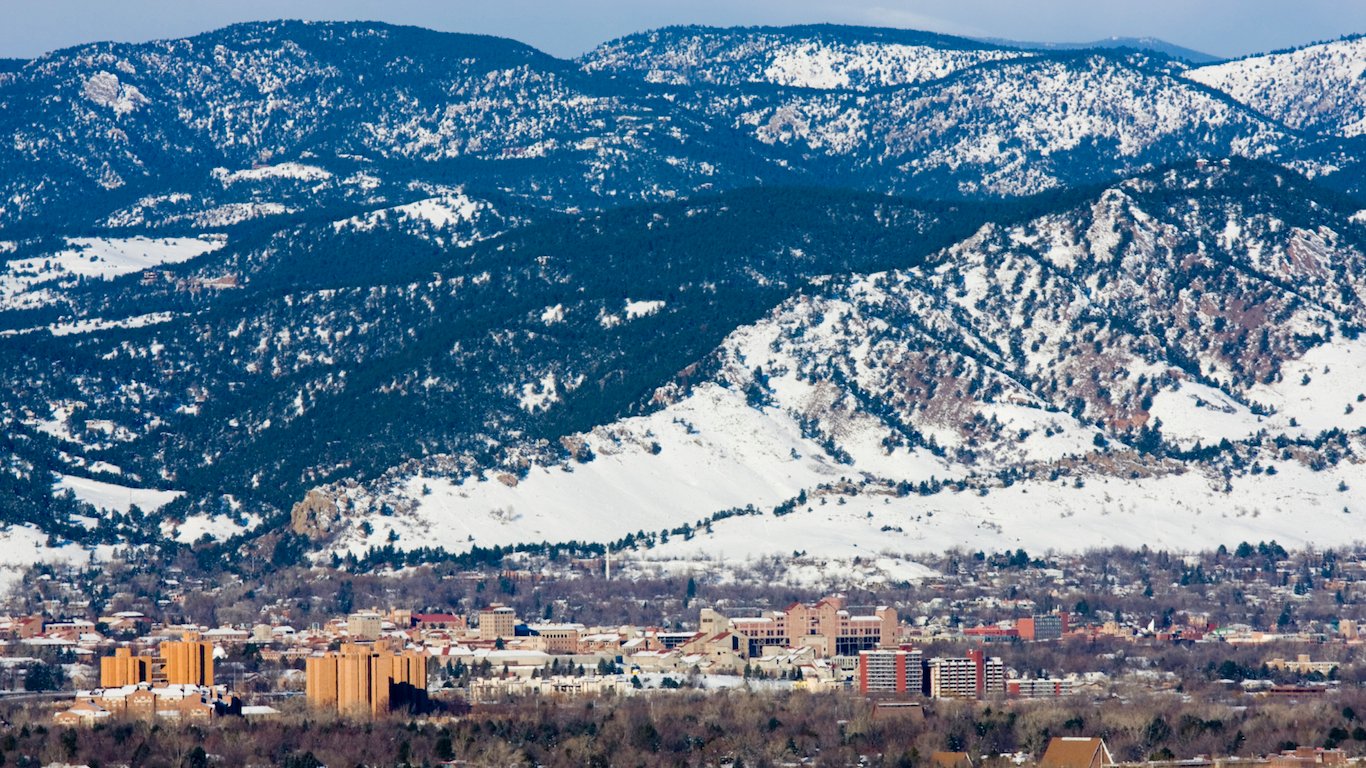
20. Boulder, CO
> BEA cost of living: 8.9% more expensive than national average
> Monthly living costs, family of 4: $8,465
> Monthly housing costs, family of 4: $1,461
> Monthly food costs, family of 4: $893
> Adults with at least a bachelor’s degree: 60.6%
> Poverty rate: 11.0%
[in-text-ad]

19. Anchorage, AK
> BEA cost of living: 9.2% more expensive than national average
> Monthly living costs, family of 4: $9,587
> Monthly housing costs, family of 4: $1,337
> Monthly food costs, family of 4: $644
> Adults with at least a bachelor’s degree: 32.2%
> Poverty rate: 7.2%
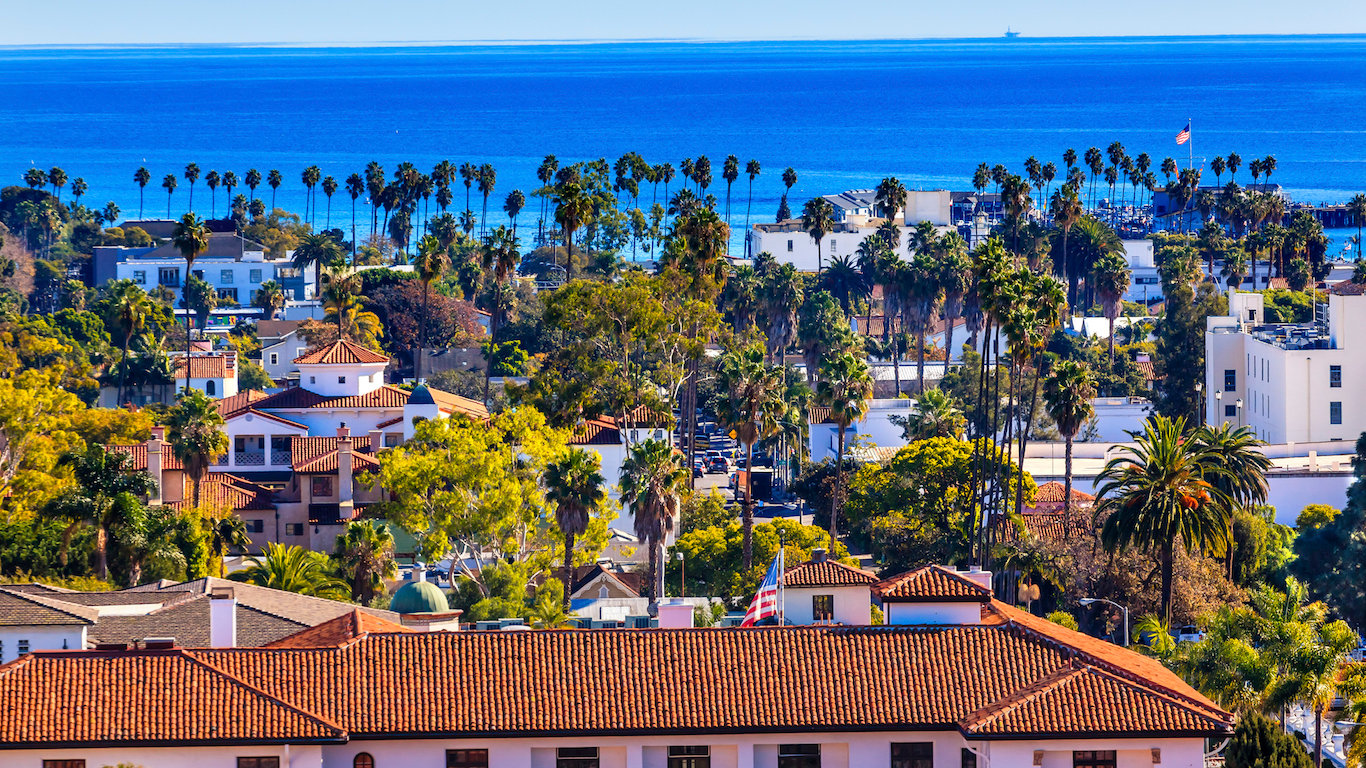
18. Santa Maria-Santa Barbara, CA
> BEA cost of living: 9.5% more expensive than national average
> Monthly living costs, family of 4: $8,034
> Monthly housing costs, family of 4: $1,520
> Monthly food costs, family of 4: $817
> Adults with at least a bachelor’s degree: 32.4%
> Poverty rate: 13.9%

17. Seattle-Tacoma-Bellevue, WA
> BEA cost of living: 10.5% more expensive than national average
> Monthly living costs, family of 4: $8,095
> Monthly housing costs, family of 4: $1,527
> Monthly food costs, family of 4: $854
> Adults with at least a bachelor’s degree: 42.0%
> Poverty rate: 9.6%
[in-text-ad-2]

16. Boston-Cambridge-Newton, MA-NH
> BEA cost of living: 11.1% more expensive than national average
> Monthly living costs, family of 4: $9,463
> Monthly housing costs, family of 4: $1,740
> Monthly food costs, family of 4: $877
> Adults with at least a bachelor’s degree: 46.9%
> Poverty rate: 9.6%
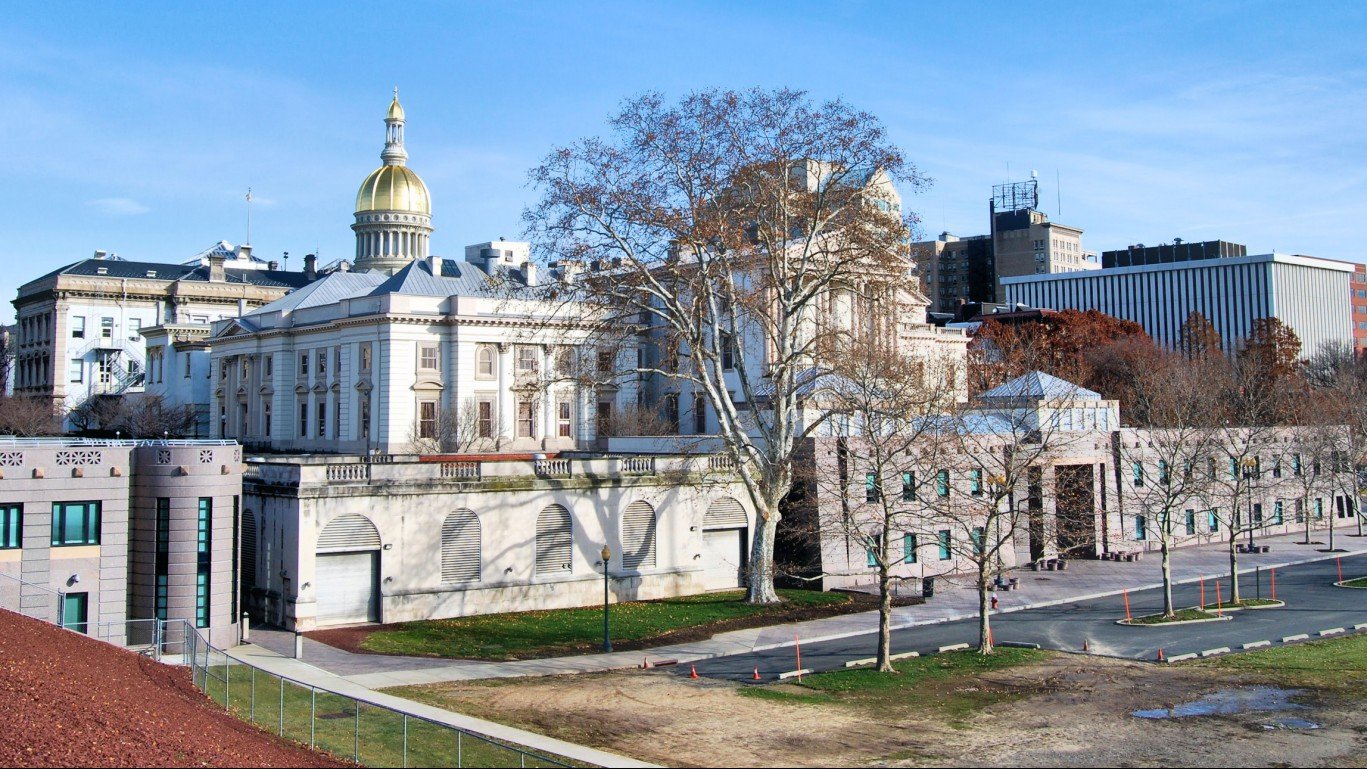
15. Trenton, NJ
> BEA cost of living: 11.3% more expensive than national average
> Monthly living costs, family of 4: $7,848
> Monthly housing costs, family of 4: $1,329
> Monthly food costs, family of 4: $797
> Adults with at least a bachelor’s degree: 42.7%
> Poverty rate: 11.1%
[in-text-ad]

14. New Haven-Milford, CT
> BEA cost of living: 11.4% more expensive than national average
> Monthly living costs, family of 4: $7,818
> Monthly housing costs, family of 4: $1,299
> Monthly food costs, family of 4: $787
> Adults with at least a bachelor’s degree: 35.1%
> Poverty rate: 11.2%

13. San Diego-Carlsbad, CA
> BEA cost of living: 16.3% more expensive than national average
> Monthly living costs, family of 4: $8,129
> Monthly housing costs, family of 4: $1,682
> Monthly food costs, family of 4: $847
> Adults with at least a bachelor’s degree: 37.4%
> Poverty rate: 12.3%

12. Oxnard-Thousand Oaks-Ventura, CA
> BEA cost of living: 17.2% more expensive than national average
> Monthly living costs, family of 4: $8,772
> Monthly housing costs, family of 4: $1,739
> Monthly food costs, family of 4: $860
> Adults with at least a bachelor’s degree: 33.6%
> Poverty rate: 9.5%
[in-text-ad-2]

11. Vallejo-Fairfield, CA
> BEA cost of living: 17.6% more expensive than national average
> Monthly living costs, family of 4: $7,453
> Monthly housing costs, family of 4: $1,341
> Monthly food costs, family of 4: $782
> Adults with at least a bachelor’s degree: 25.4%
> Poverty rate: 11.6%

10. Los Angeles-Long Beach-Anaheim, CA
> BEA cost of living: 17.7% more expensive than national average
> Monthly living costs, family of 4: $7,691
> Monthly housing costs, family of 4: $1,663
> Monthly food costs, family of 4: $830
> Adults with at least a bachelor’s degree: 33.5%
> Poverty rate: 15.0%
[in-text-ad]

9. Washington-Arlington-Alexandria, DC-VA-MD-WV
> BEA cost of living: 19.1% more expensive than national average
> Monthly living costs, family of 4: $8,795
> Monthly housing costs, family of 4: $1,693
> Monthly food costs, family of 4: $858
> Adults with at least a bachelor’s degree: 50.2%
> Poverty rate: 8.4%

8. Bridgeport-Stamford-Norwalk, CT
> BEA cost of living: 20.1% more expensive than national average
> Monthly living costs, family of 4: $8,387
> Monthly housing costs, family of 4: $1,272
> Monthly food costs, family of 4: $883
> Adults with at least a bachelor’s degree: 46.6%
> Poverty rate: 8.6%

7. Santa Rosa, CA
> BEA cost of living: 21.0% more expensive than national average
> Monthly living costs, family of 4: $9,165
> Monthly housing costs, family of 4: $1,843
> Monthly food costs, family of 4: $913
> Adults with at least a bachelor’s degree: 33.9%
> Poverty rate: 9.2%
[in-text-ad-2]

6. Napa, CA
> BEA cost of living: 21.9% more expensive than national average
> Monthly living costs, family of 4: $8,565
> Monthly housing costs, family of 4: $1,575
> Monthly food costs, family of 4: $982
> Adults with at least a bachelor’s degree: 35.1%
> Poverty rate: 7.3%

5. New York-Newark-Jersey City, NY-NJ-PA
> BEA cost of living: 22.0% more expensive than national average
> Monthly living costs, family of 4: $10,344
> Monthly housing costs, family of 4: $1,789
> Monthly food costs, family of 4: $908
> Adults with at least a bachelor’s degree: 39.0%
> Poverty rate: 13.5%
[in-text-ad]
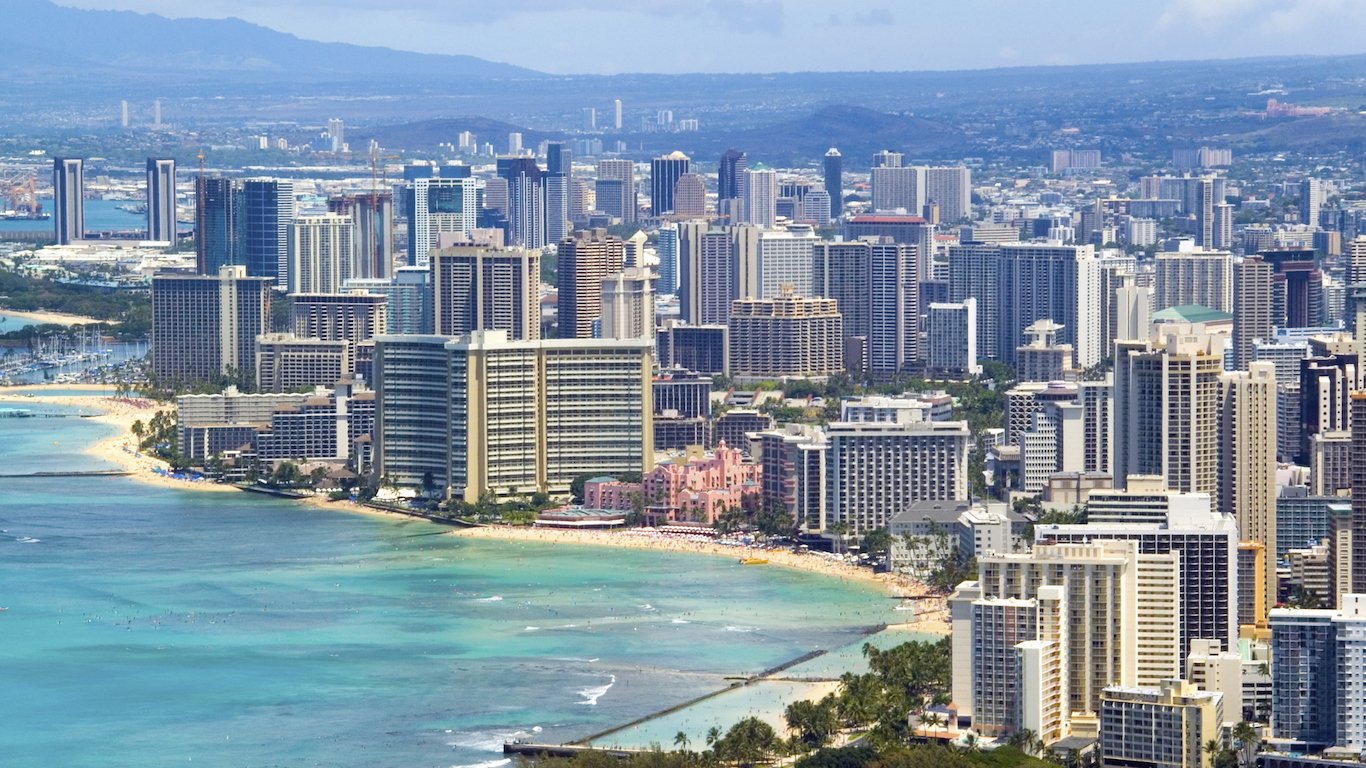
4. Urban Honolulu, HI
> BEA cost of living: 24.4% more expensive than national average
> Monthly living costs, family of 4: $9,632
> Monthly housing costs, family of 4: $1,893
> Monthly food costs, family of 4: $1,074
> Adults with at least a bachelor’s degree: 34.4%
> Poverty rate: 8.5%

3. San Francisco-Oakland-Hayward, CA
> BEA cost of living: 24.7% more expensive than national average
> Monthly living costs, family of 4: $12,370
> Monthly housing costs, family of 4: $3,121
> Monthly food costs, family of 4: $998
> Adults with at least a bachelor’s degree: 48.5%
> Poverty rate: 9.2%

2. Santa Cruz-Watsonville, CA
> BEA cost of living: 24.8% more expensive than national average
> Monthly living costs, family of 4: $9,283
> Monthly housing costs, family of 4: $1,764
> Monthly food costs, family of 4: $931
> Adults with at least a bachelor’s degree: 40.5%
> Poverty rate: 13.7%
[in-text-ad-2]

1. San Jose-Sunnyvale-Santa Clara, CA
> BEA cost of living: 27.1% more expensive than national average
> Monthly living costs, family of 4: $10,758
> Monthly housing costs, family of 4: $2,522
> Monthly food costs, family of 4: $896
> Adults with at least a bachelor’s degree: 50.1%
> Poverty rate: 9.4%
Methodology:
In order to determine what it actually costs to live in America’s most expensive cities, 24/7 Wall St. first identified the 25 cities with the highest cost of living according to the Bureau of Economic Analysis (BEA) as measured by regional price parities for metro. We matched to each of these cities monthly living costs for a family of four (two parents and two children) and other cost of living data provided by the Economic Policy Institute (EPI).
The EPI data is the basis for its Family Budget Calculator, which measures the income a family needs in order to attain a modest yet adequate standard of living. The budgets estimate community-specific costs for 10 family types (one or two adults with zero to four children) in all counties and metro areas in the United States.
Poverty rates and educational attainment rates come from the U.S. Census Bureau’s 1-year 2016 American Community Survey.
Sponsored: Want to Retire Early? Here’s a Great First Step
Want retirement to come a few years earlier than you’d planned? Or are you ready to retire now, but want an extra set of eyes on your finances?
Now you can speak with up to 3 financial experts in your area for FREE. By simply clicking here you can begin to match with financial professionals who can help you build your plan to retire early. And the best part? The first conversation with them is free.
Click here to match with up to 3 financial pros who would be excited to help you make financial decisions.
Thank you for reading! Have some feedback for us?
Contact the 24/7 Wall St. editorial team.
 24/7 Wall St.
 24/7 Wall St.
 24/7 Wall St.
