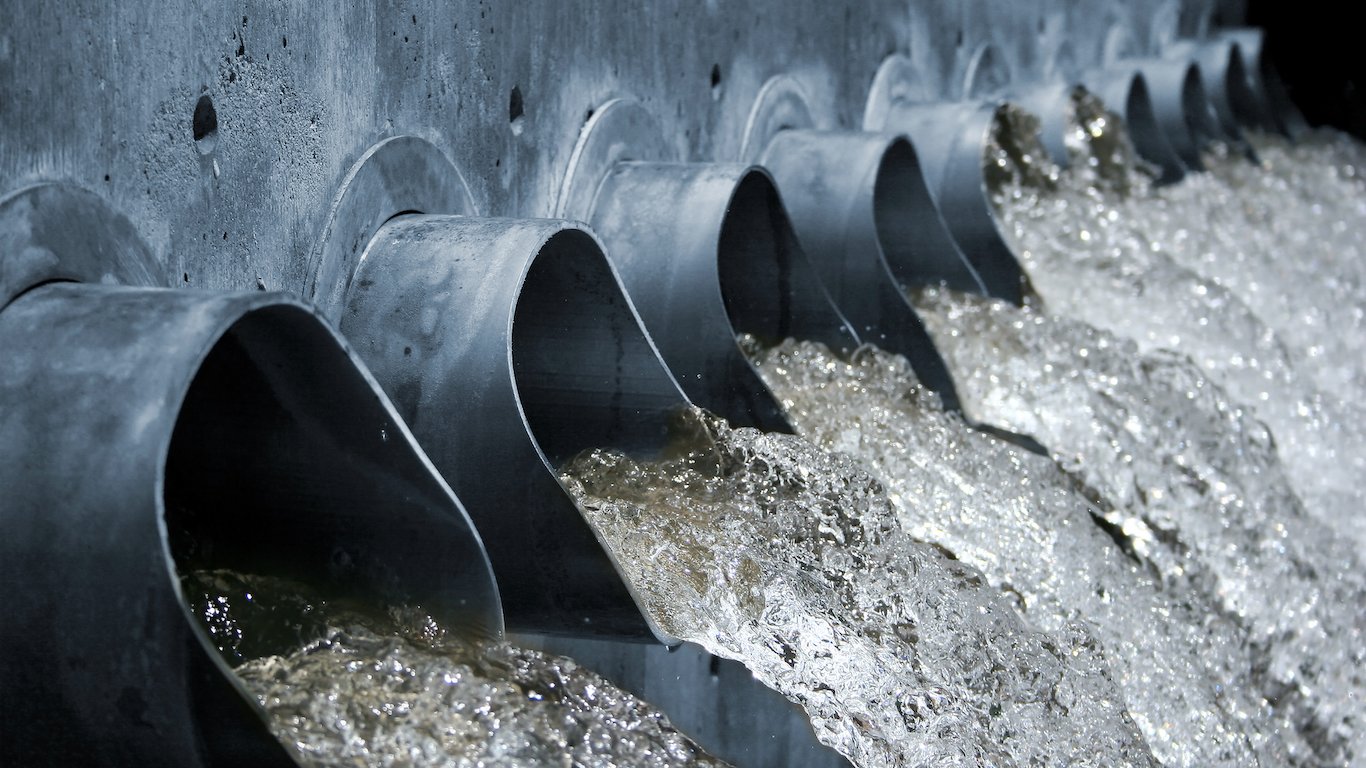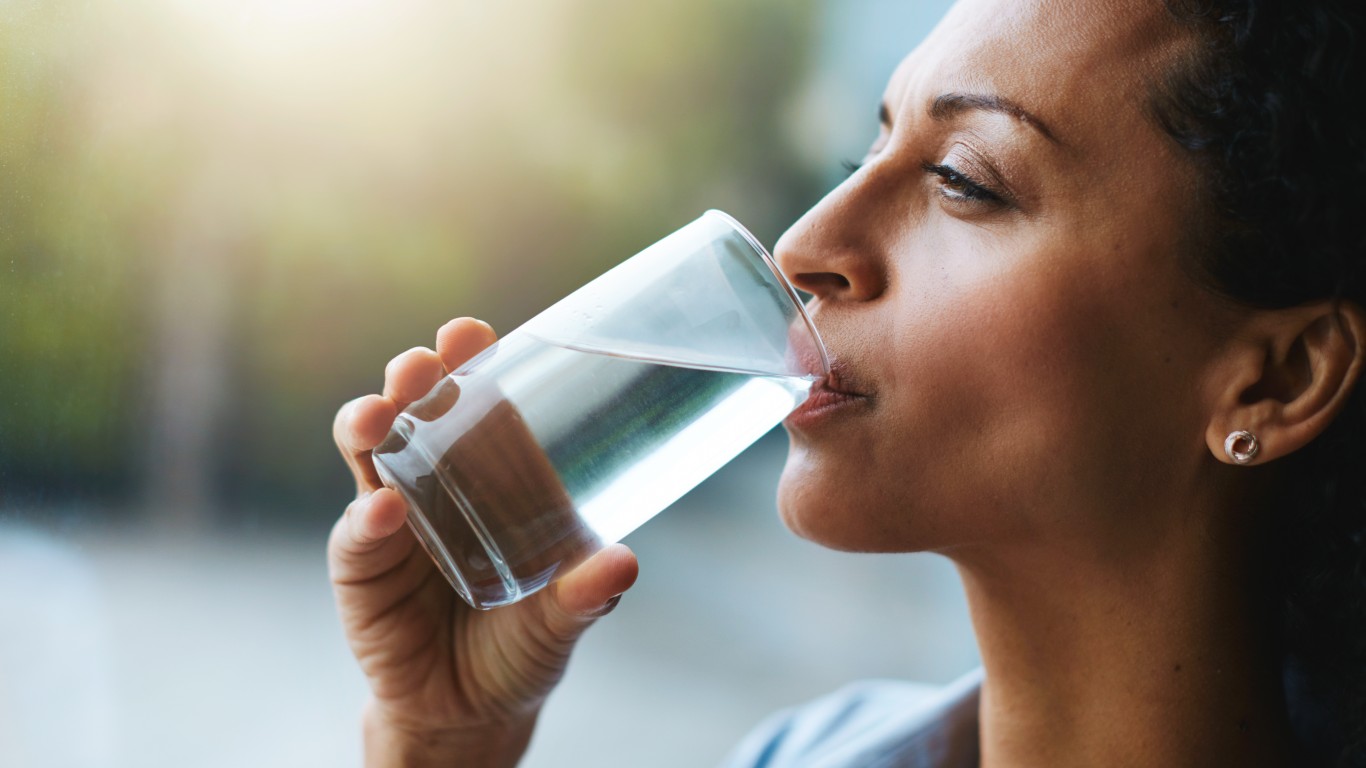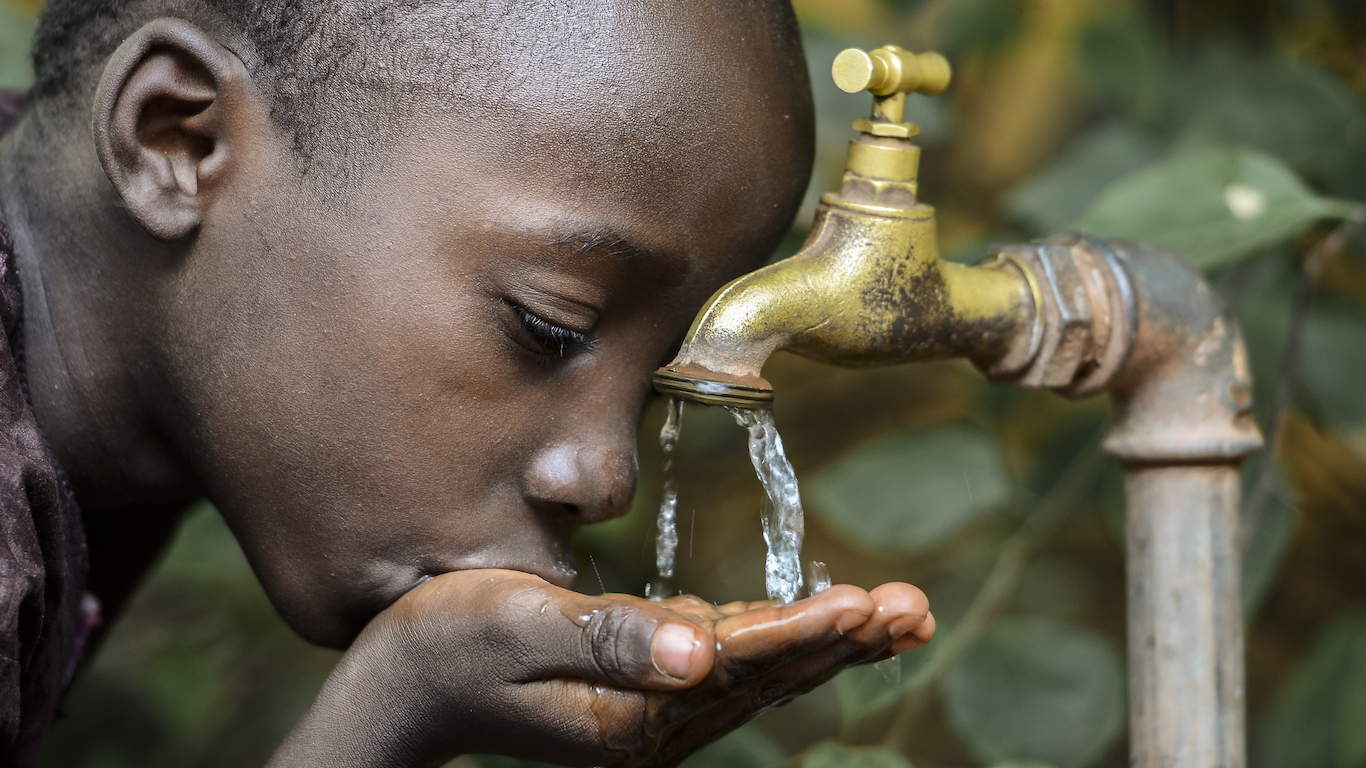
We take for granted the ability to drink fresh, clean water when we turn on the tap. But that was not the reality 150 years ago, and sadly it is still not the reality for many people around the world.To focus attention on the importance of freshwater, the United Nations observed the very first World Water Day on March 22, 1993. Now, as the 27th annual World Water Day approaches, an estimated 884 million people worldwide — nearly triple the U.S. population — lack basic access to clean drinking water.
24/7 Wall St. reviewed data from the 2017 report “Progress on Drinking Water, Sanitation and Hygiene,” published by World Health Organization and UNICEF in a joint effort to identify the countries with the worst access to drinking water.
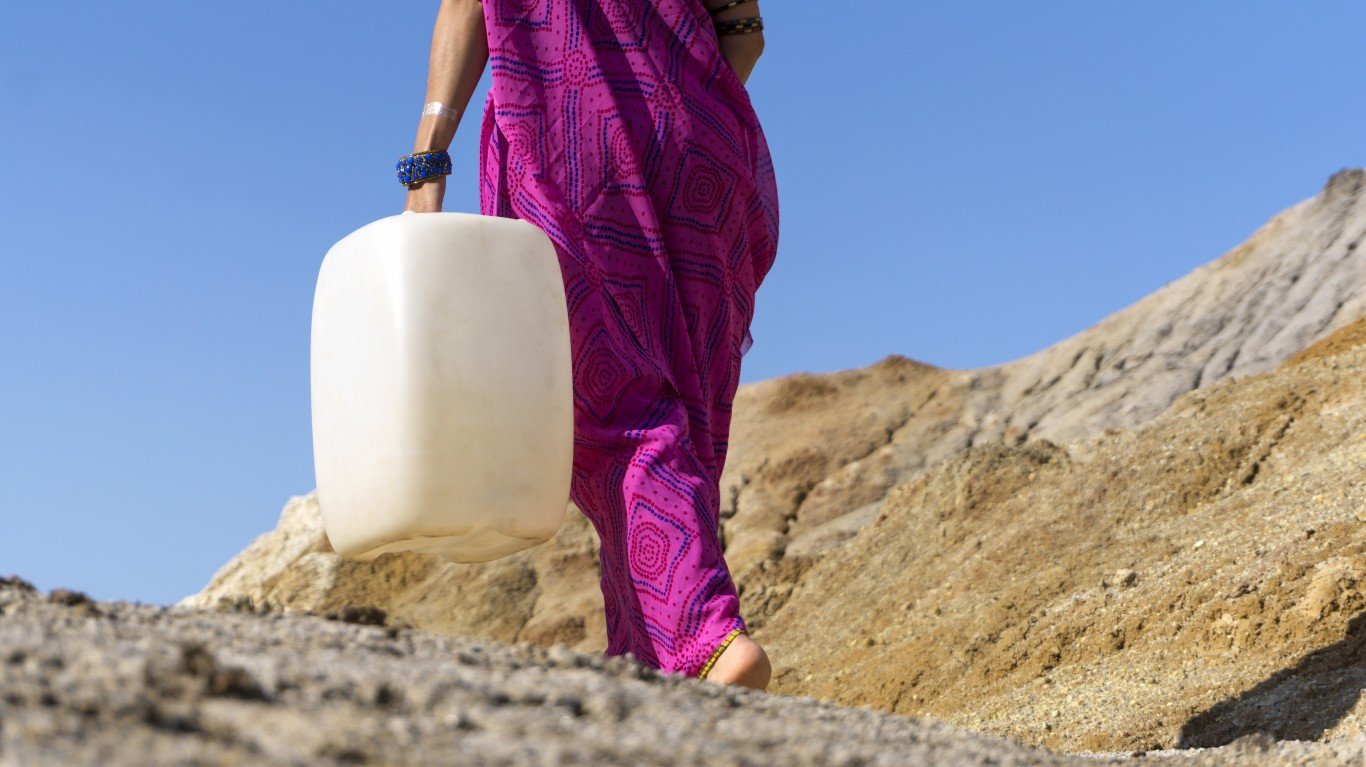
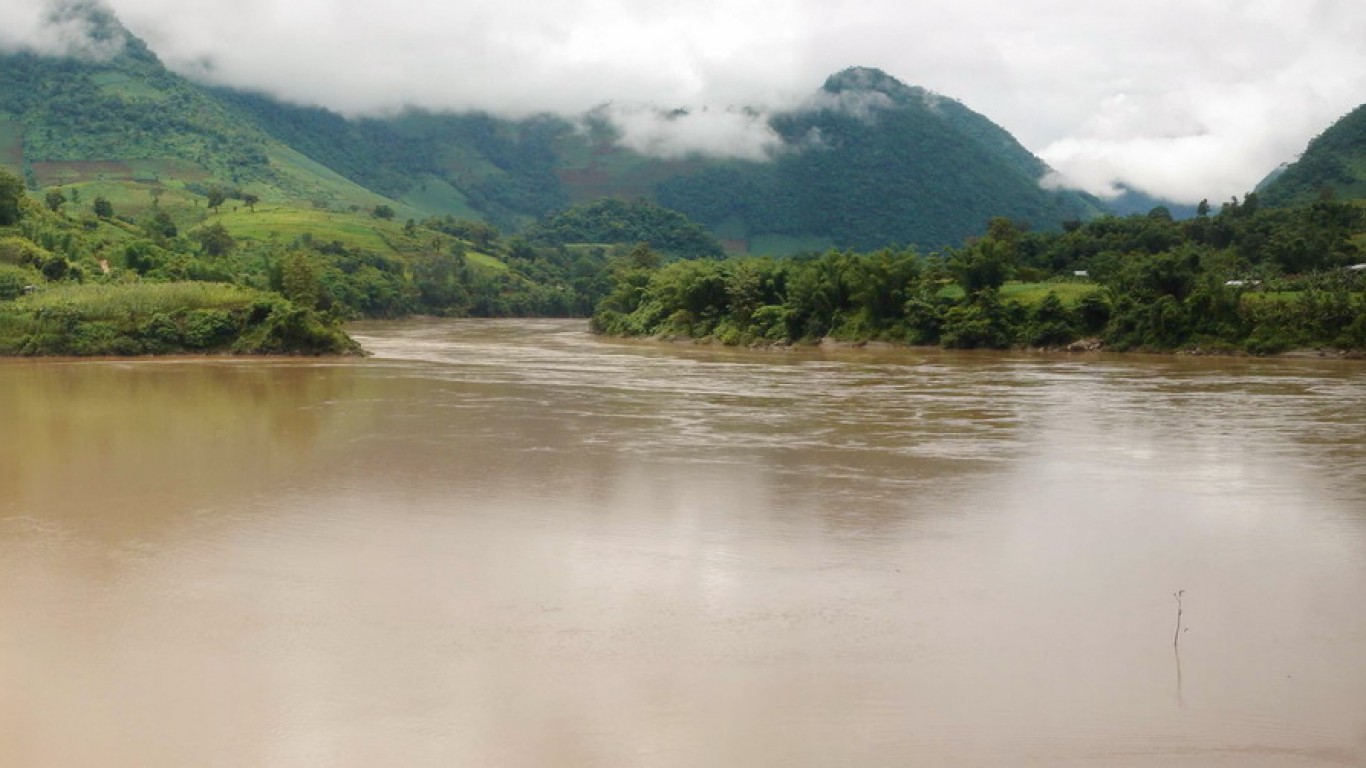
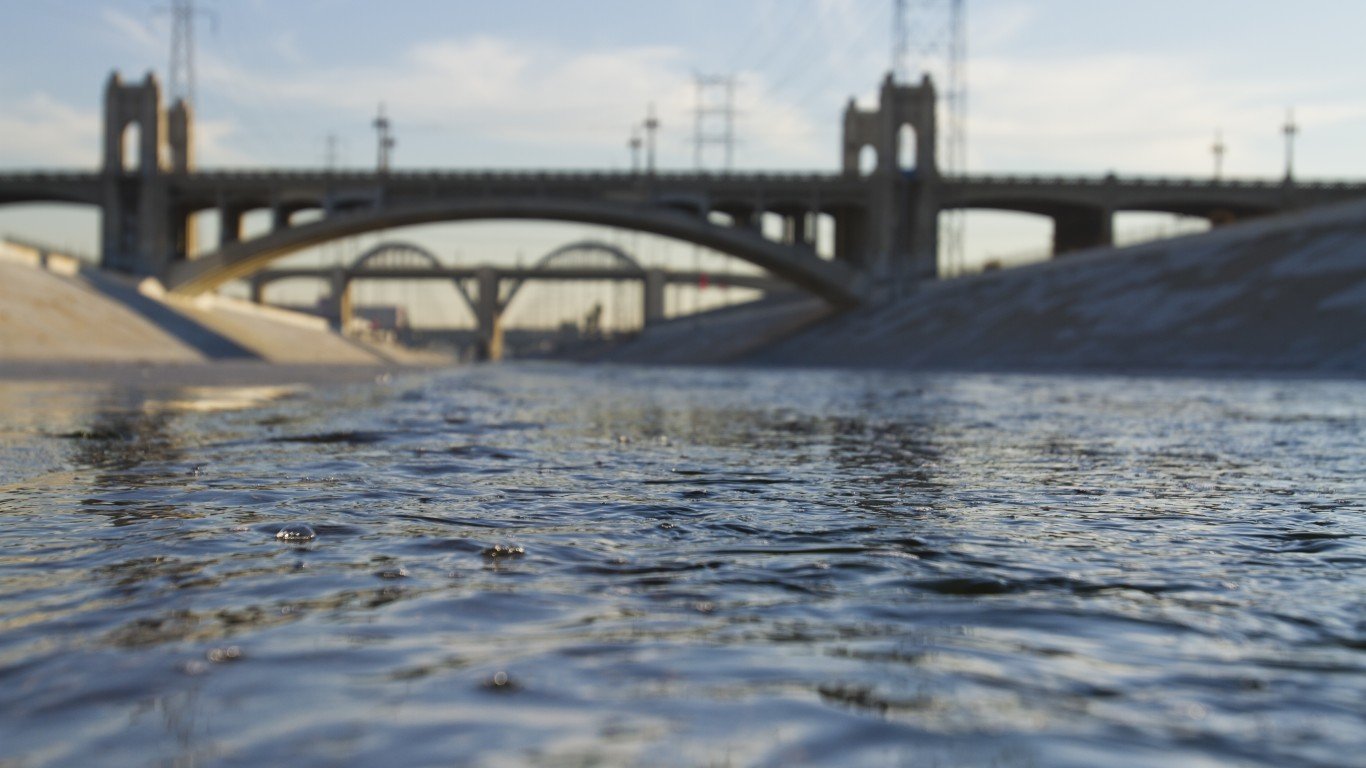
While we hear of U.S. communities with contaminated water — like Flint, Michigan — the percentage of Americans who lack access to clean water is very small at 0.8%. Among the countries on this list, however, anywhere from 33% to 81% of the population lacks basic access to clean water — meaning clean water is either unattainable or takes more than 30 minutes to collect.
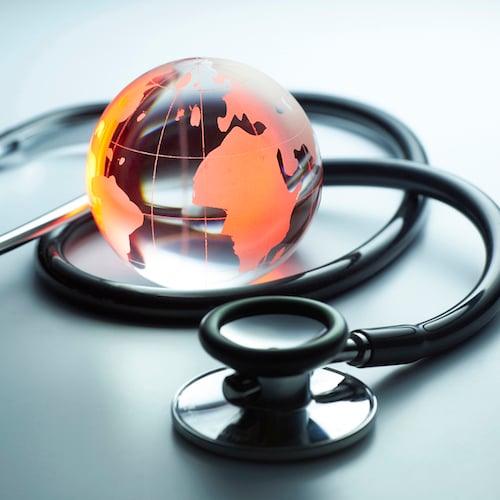
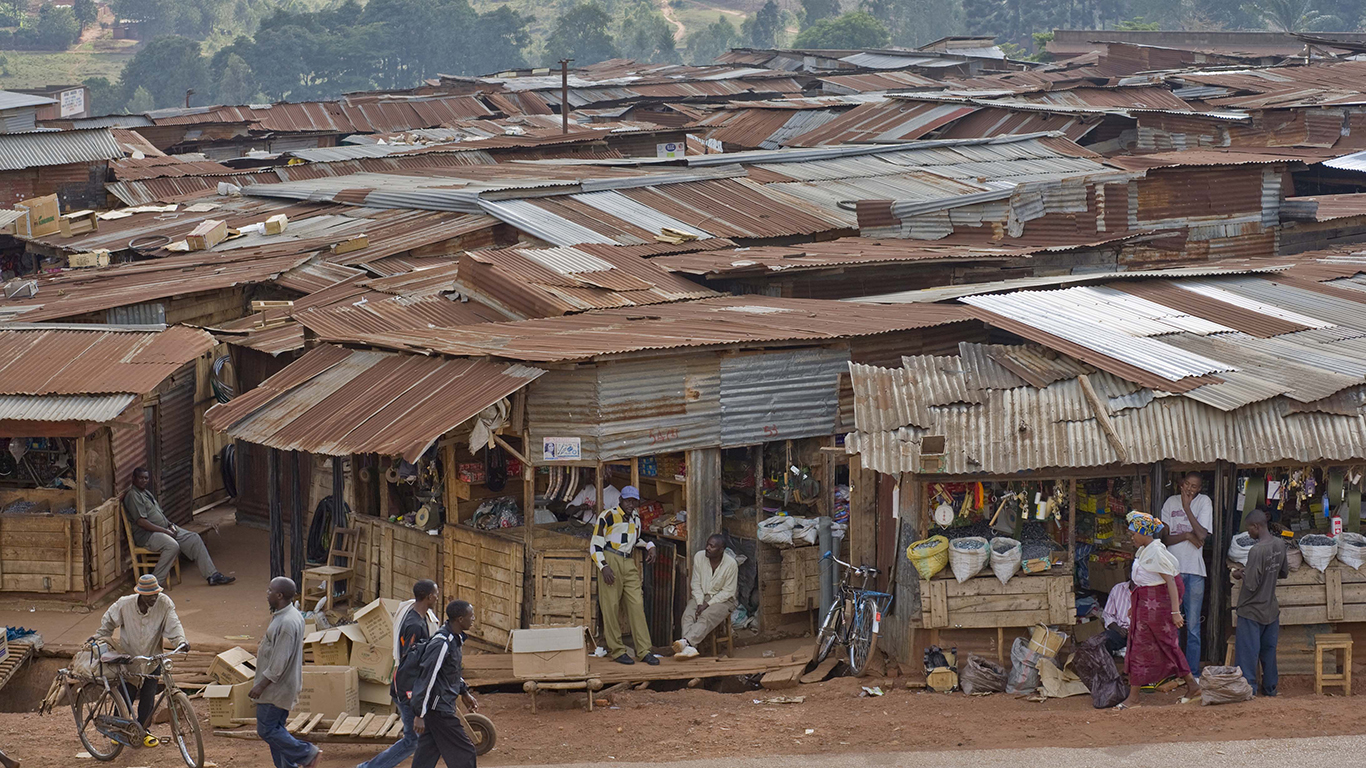
People without access to clean water are at increased risk of contracting waterborne diseases than can result in serious illness and even death. Partly due to the health risks posed by consumption of contaminated water, in each of the countries on this list, life expectancy is below the global average of 72 years. Most of these countries are located in Africa, and some of their developmental challenges are caused by rampant corruption. Many also rank among the poorest countries in the world.
Access to contaminant-free water is recognized by the U.N. as a fundamental human right. With that principle in mind, the U.N. resolved to achieve universal access to clean, affordable drinking water by 2030 by building on the progress of recent years. In 2000, 18.9% of the world population lacked basic access to clean water. As of 2015, that share dropped to 11.5%.
Click here to see the countries with the worst access to drinking water.
Click here to read our methodology.
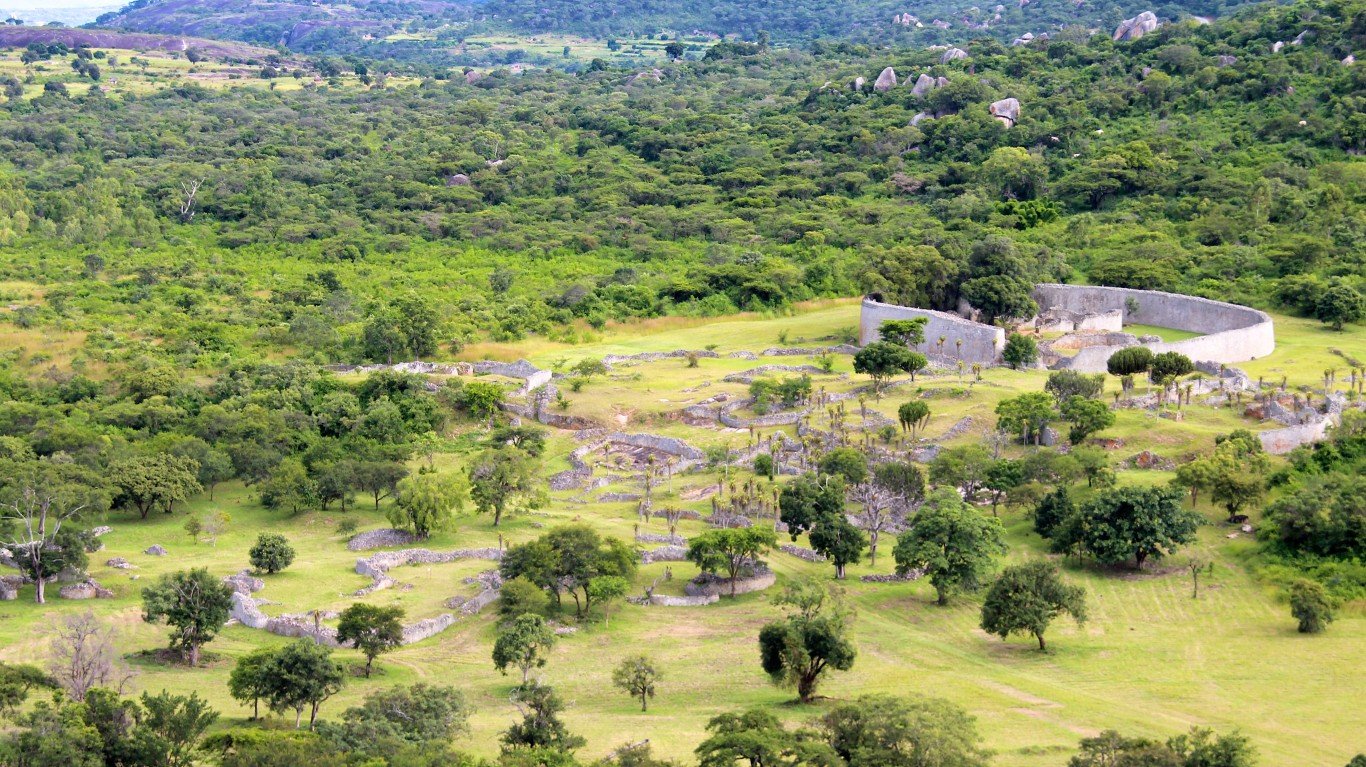
29. Zimbabwe
> Pop. without basic access to clean water: 33.4%
> Pop. consuming untreated surface water: 7.3%
> Total population: 14.9 million
> GDP per capita: $2,003
> Avg. life expectancy: 61.2 years
[in-text-ad]
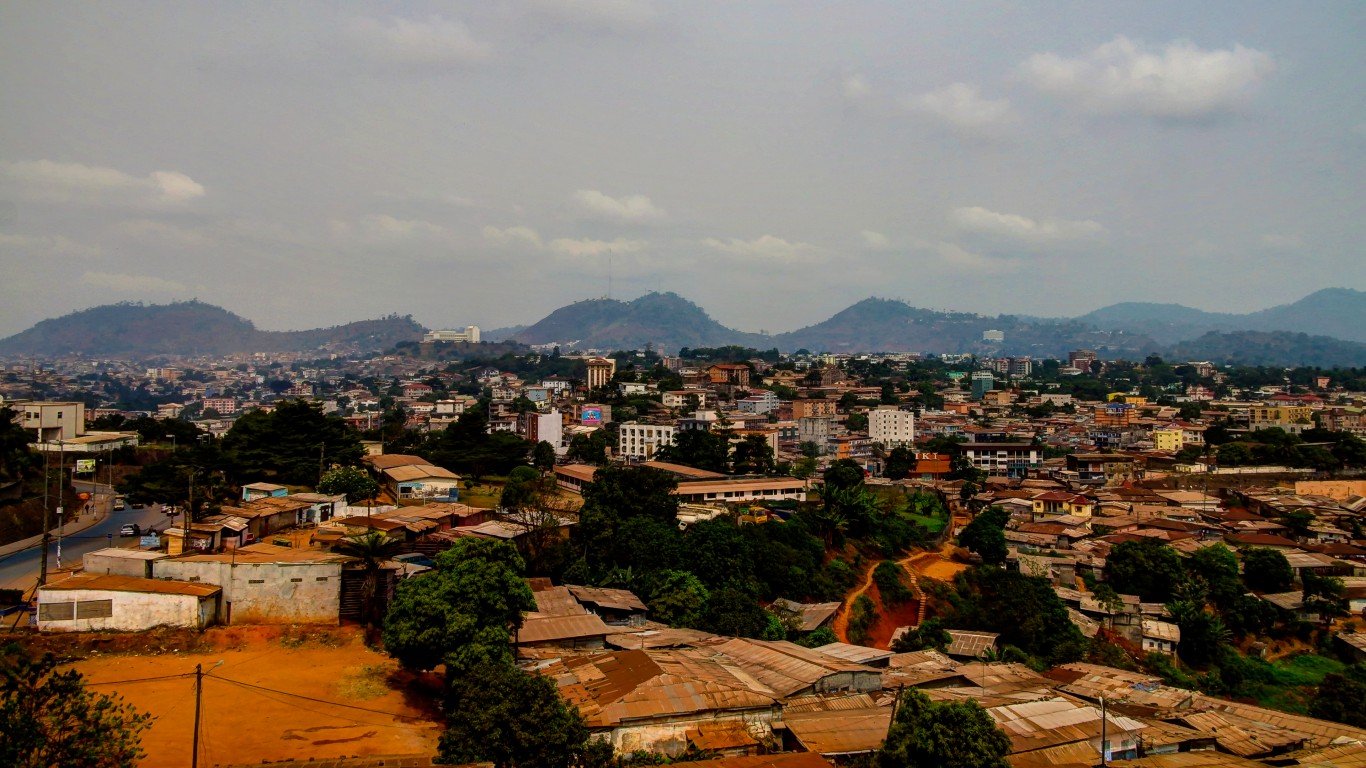
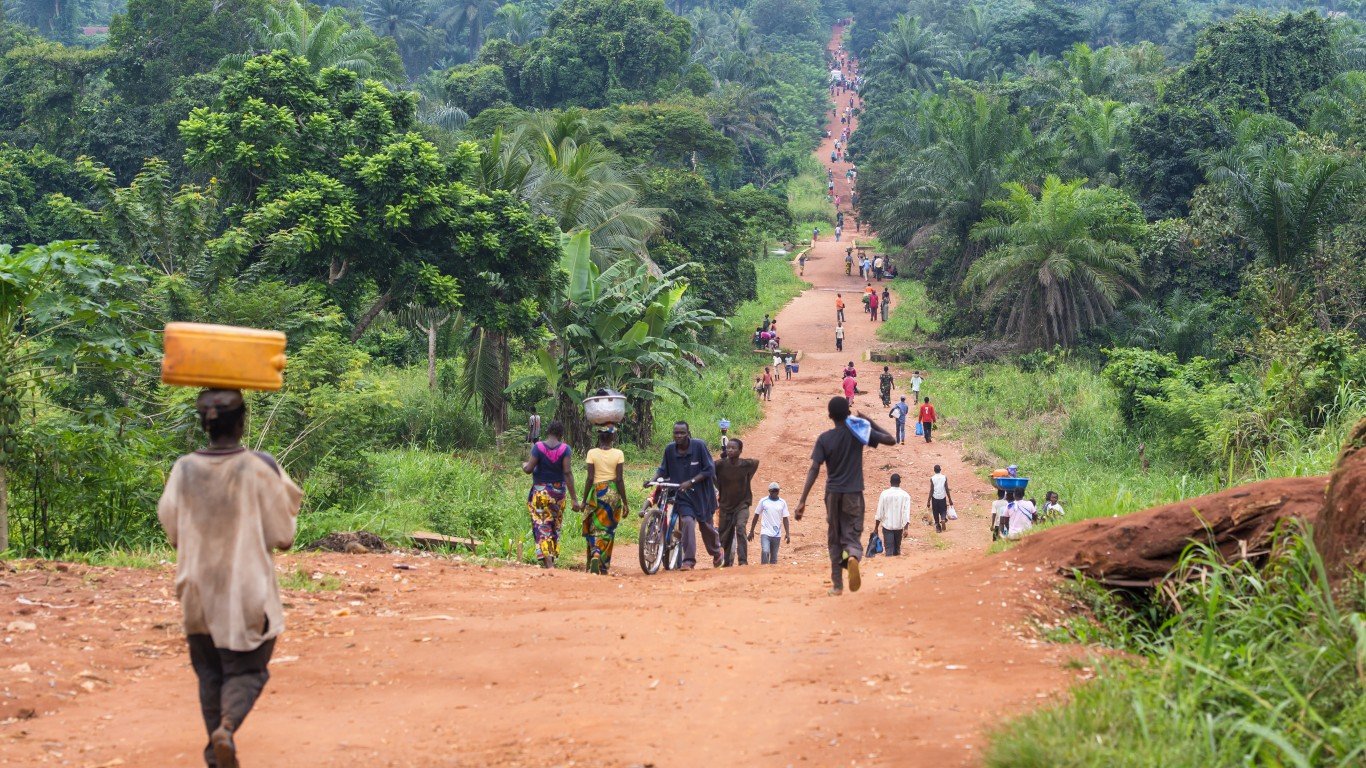
28. Cameroon
> Pop. without basic access to clean water: 34.7%
> Pop. consuming untreated surface water: 7.6%
> Total population: 24.3 million
> GDP per capita: $3,358
> Avg. life expectancy: 58.1 years
[recirclink id=488456]
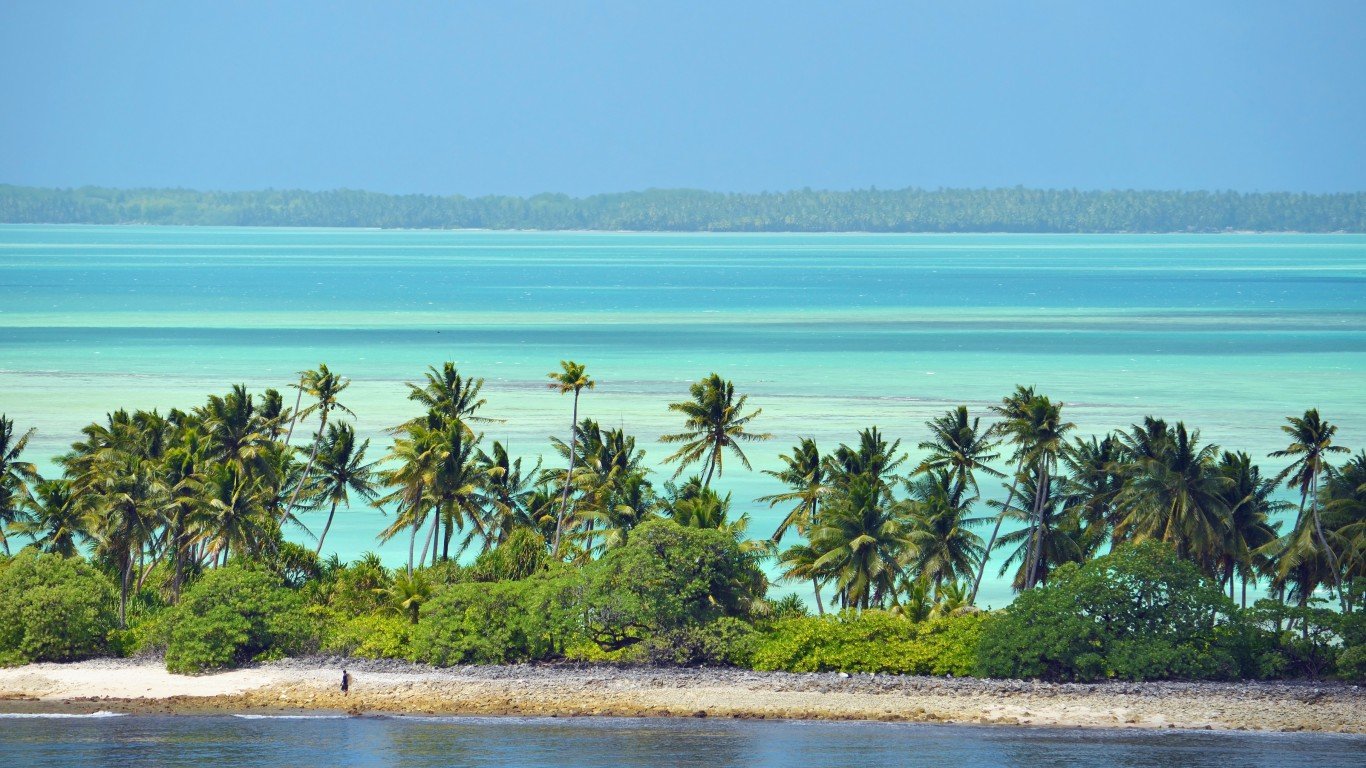
27. Kiribati
> Pop. without basic access to clean water: 35.6%
> Pop. consuming untreated surface water: 0.0%
> Total population: 118,000
> GDP per capita: $1,879
> Avg. life expectancy: 66.3 years
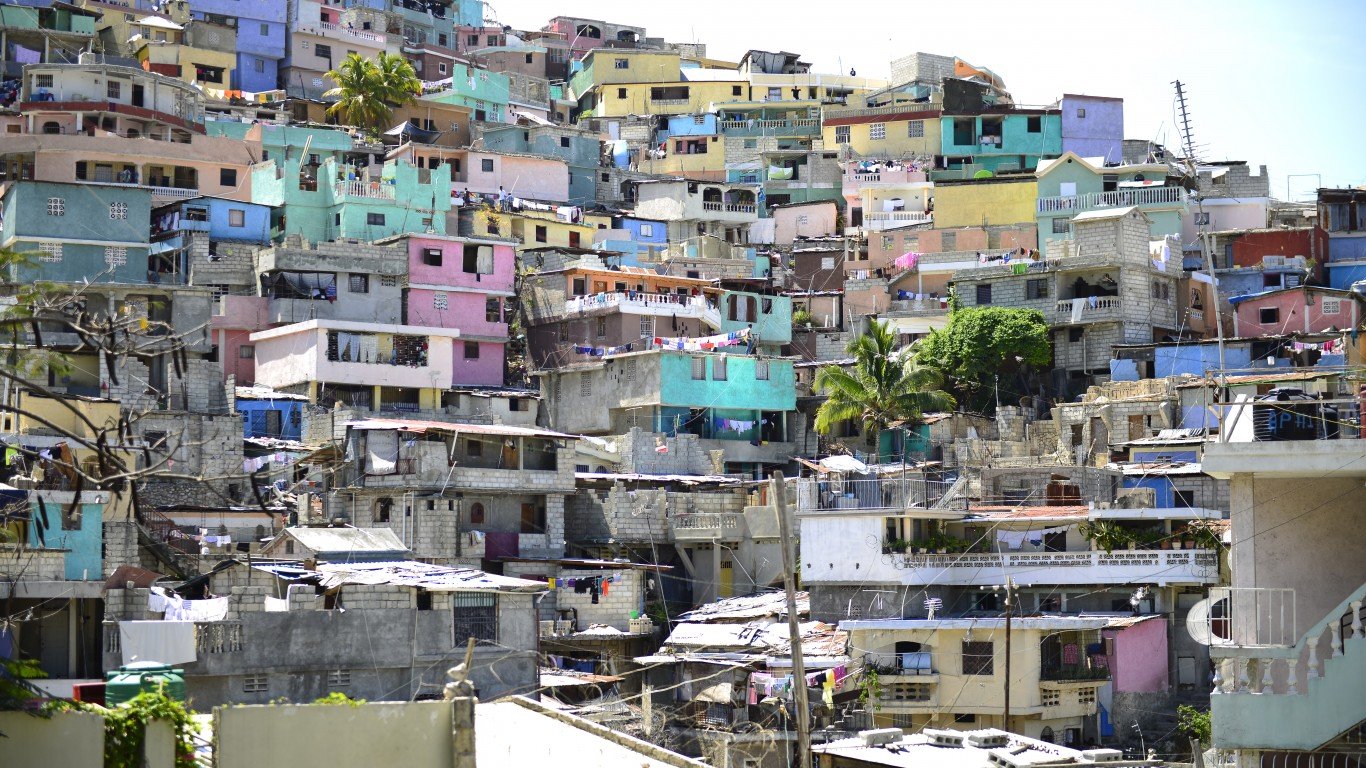
26. Haiti
> Pop. without basic access to clean water: 35.8%
> Pop. consuming untreated surface water: 0.0%
> Total population: 11.0 million
> GDP per capita: $1,819
> Avg. life expectancy: 63.3 years
[in-text-ad-2]
25. Solomon Islands
> Pop. without basic access to clean water: 36.0%
> Pop. consuming untreated surface water: 14.7%
> Total population: 614,000
> GDP per capita: $2,031
> Avg. life expectancy: 70.7 years
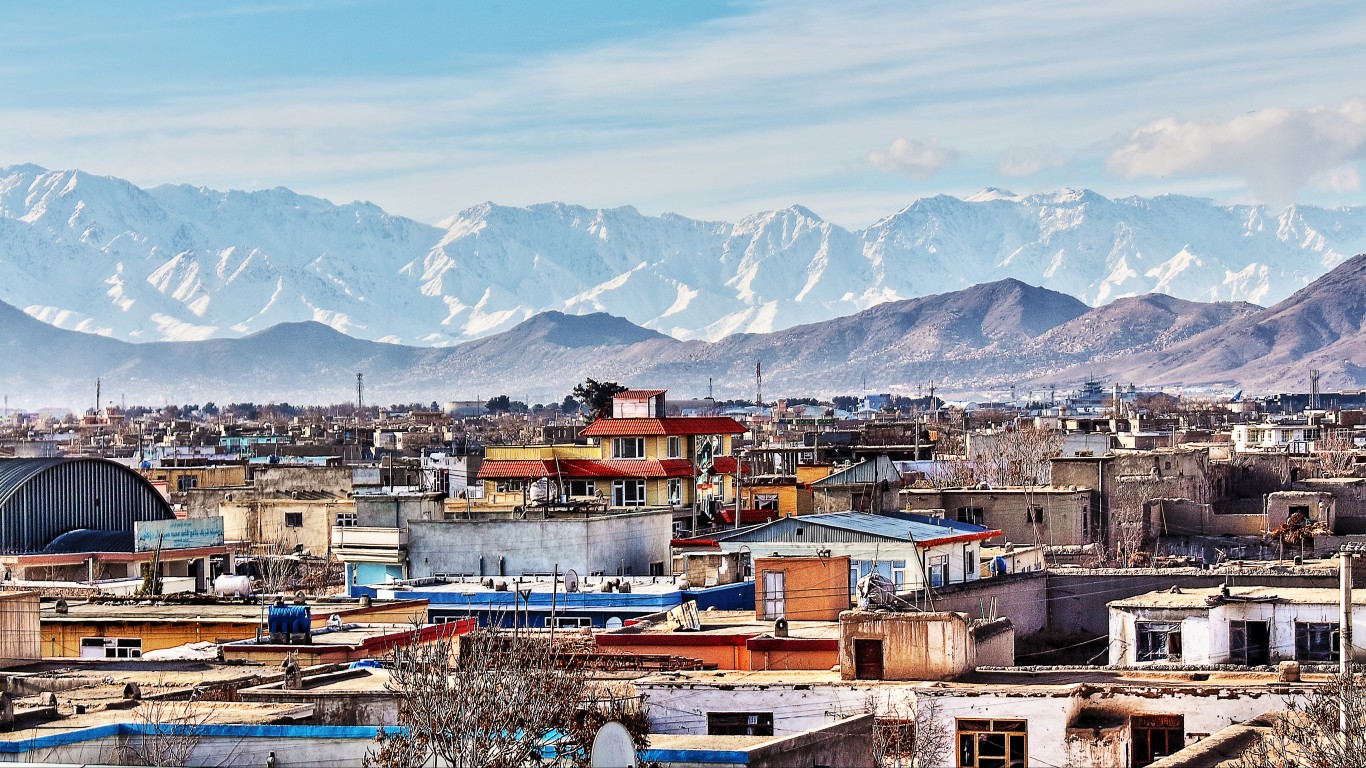
24. Afghanistan
> Pop. without basic access to clean water: 37.0%
> Pop. consuming untreated surface water: 15.2%
> Total population: 36.8 million
> GDP per capita: $1,833
> Avg. life expectancy: 63.7 years
[in-text-ad]
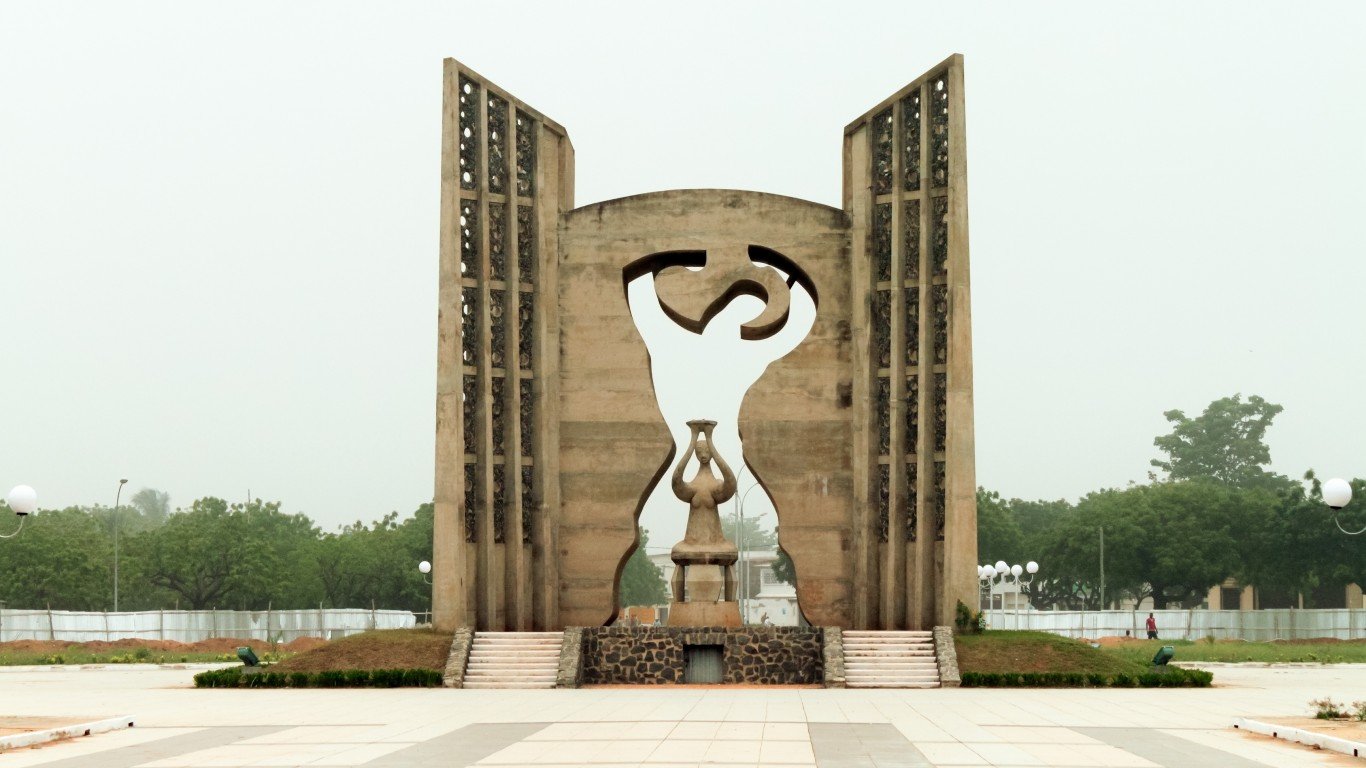
23. Togo
> Pop. without basic access to clean water: 37.2%
> Pop. consuming untreated surface water: 13.6%
> Total population: 7.7 million
> GDP per capita: $1,620
> Avg. life expectancy: 60.2 years
[recirclink id=488594]

22. Zambia
> Pop. without basic access to clean water: 38.8%
> Pop. consuming untreated surface water: 11.7%
> Total population: 17.2 million
> GDP per capita: $3,982
> Avg. life expectancy: 61.9 years
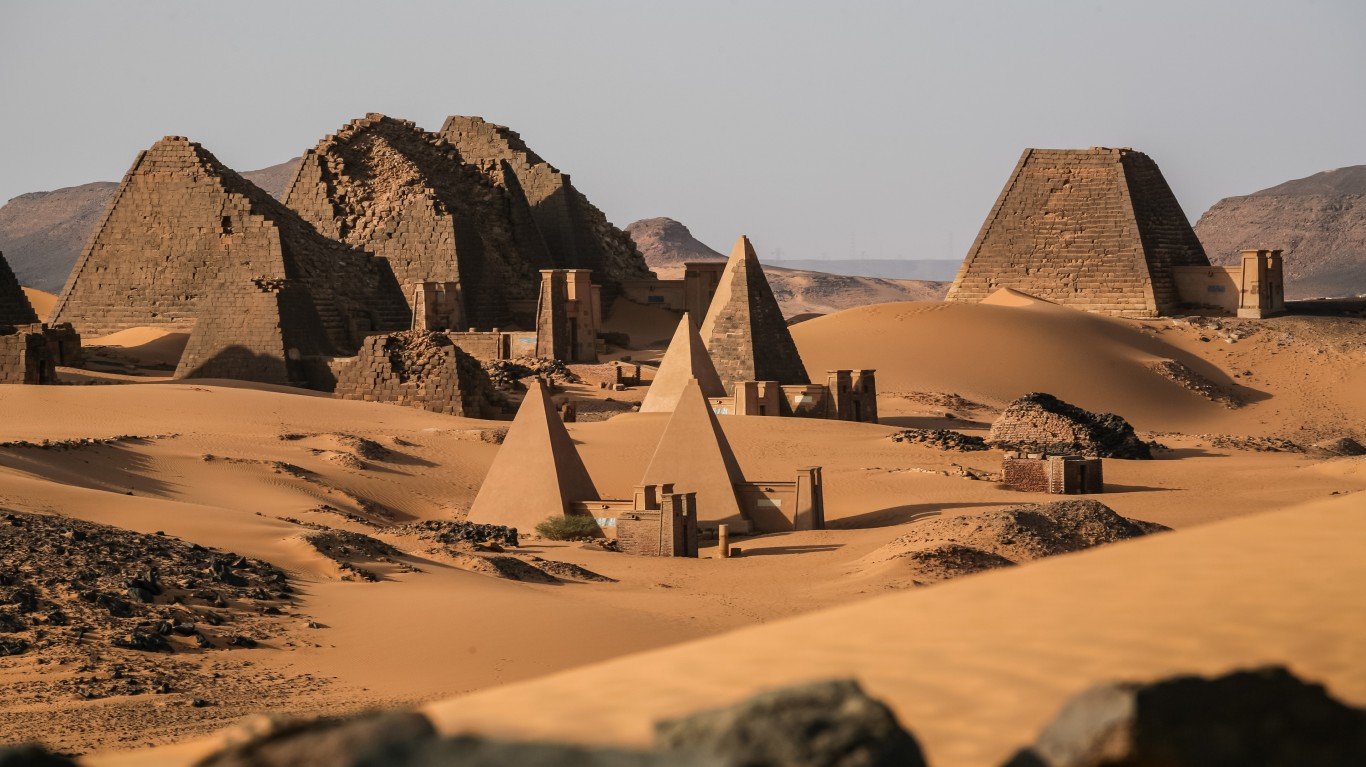
21. Sudan
> Pop. without basic access to clean water: 41.1%
> Pop. consuming untreated surface water: 9.3%
> Total population: 40.8 million
> GDP per capita: $4,578
> Avg. life expectancy: 64.5 years
[in-text-ad-2]
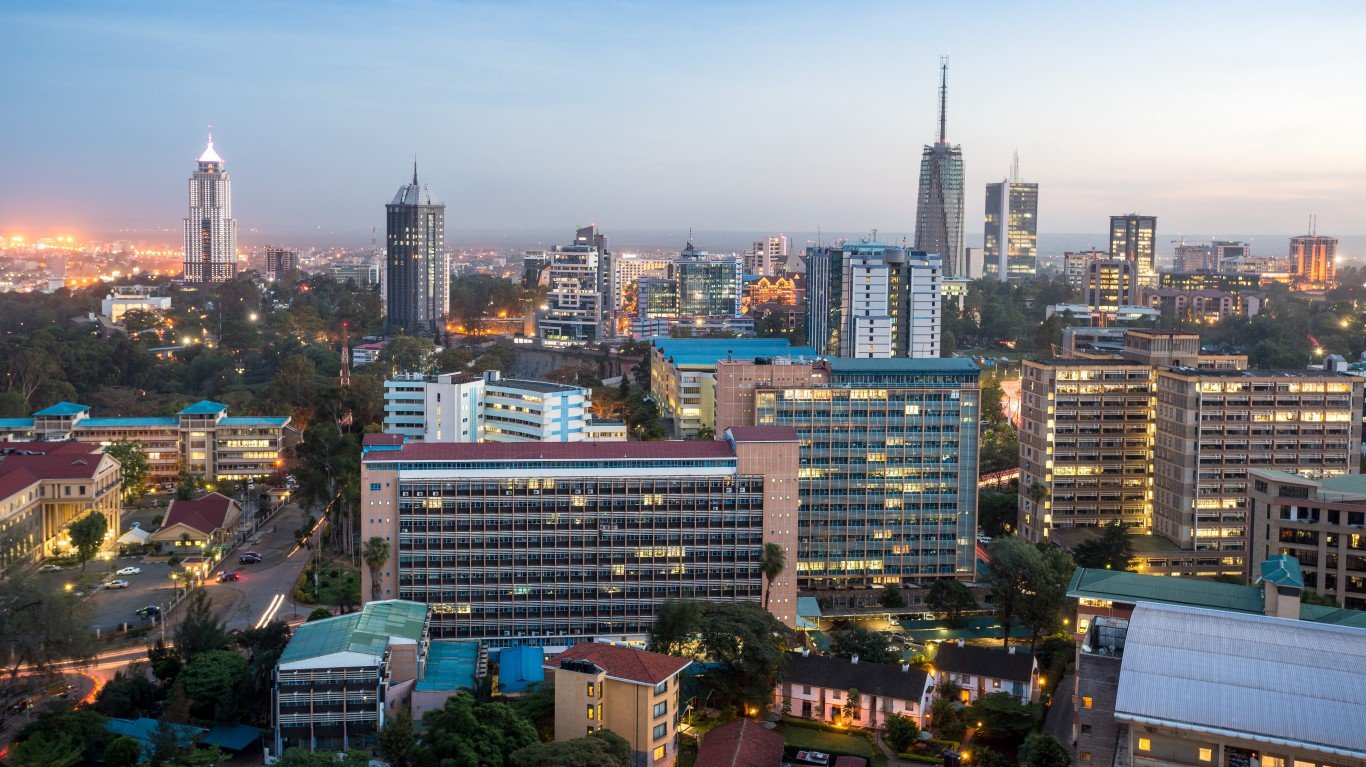
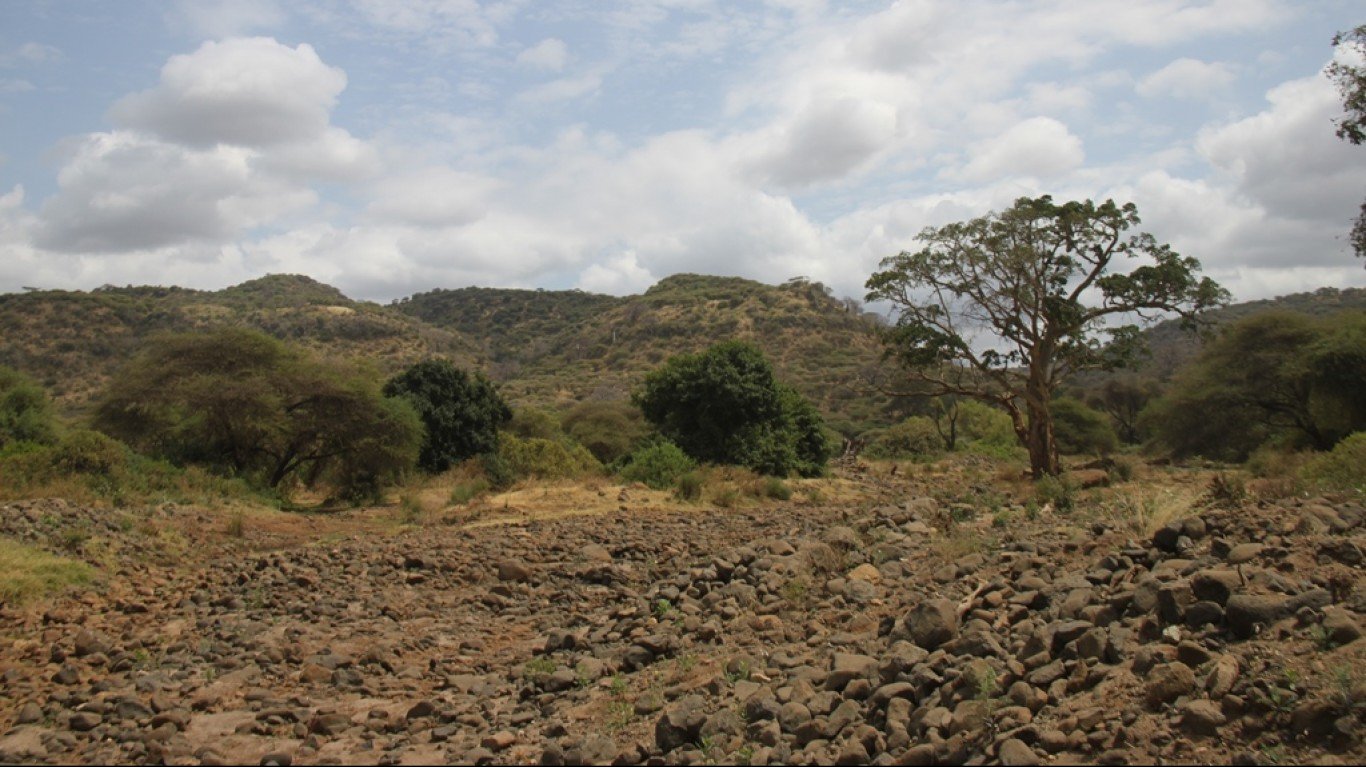
20. Kenya
> Pop. without basic access to clean water: 41.5%
> Pop. consuming untreated surface water: 23.1%
> Total population: 46.7 million
> GDP per capita: $3,517
> Avg. life expectancy: 67.0 years
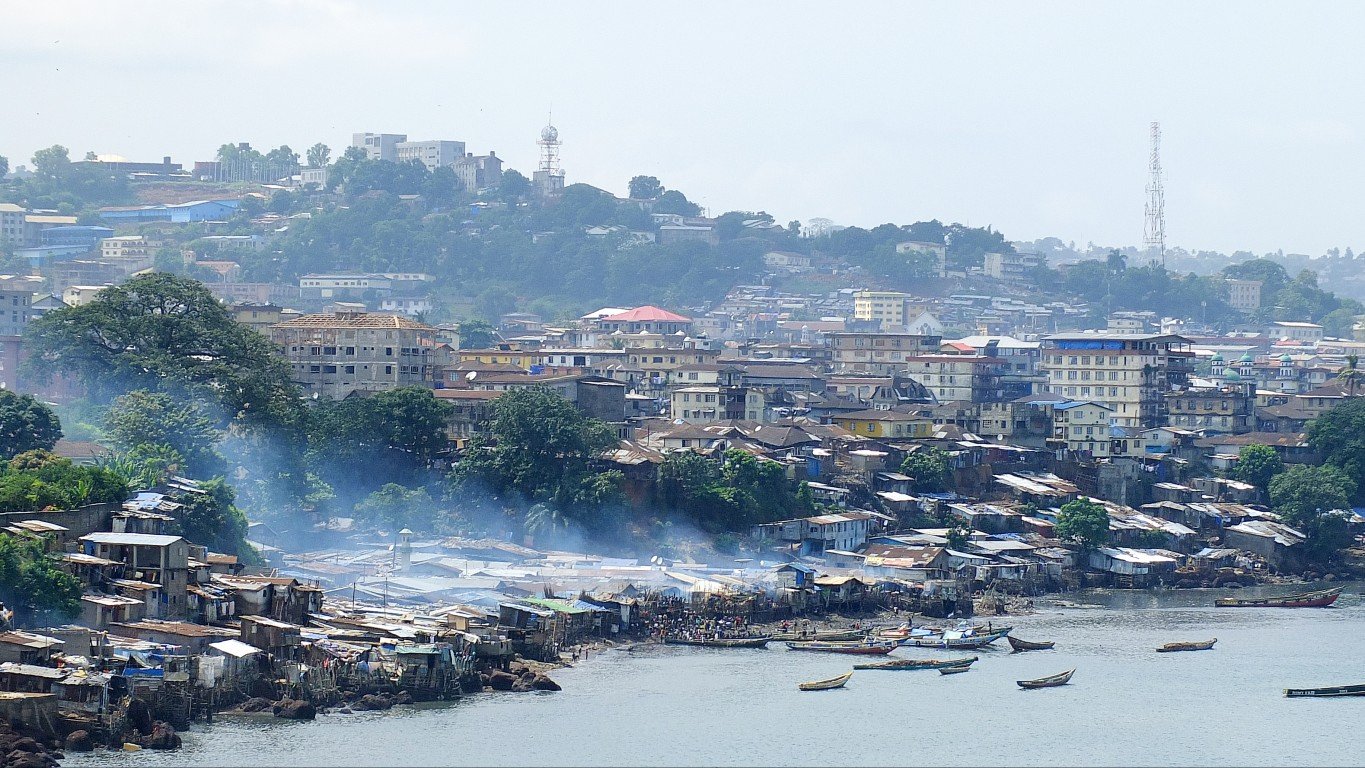
19. Sierra Leone
> Pop. without basic access to clean water: 41.9%
> Pop. consuming untreated surface water: 16.2%
> Total population: 6.6 million
> GDP per capita: $1,760
> Avg. life expectancy: 51.8 years
[in-text-ad]
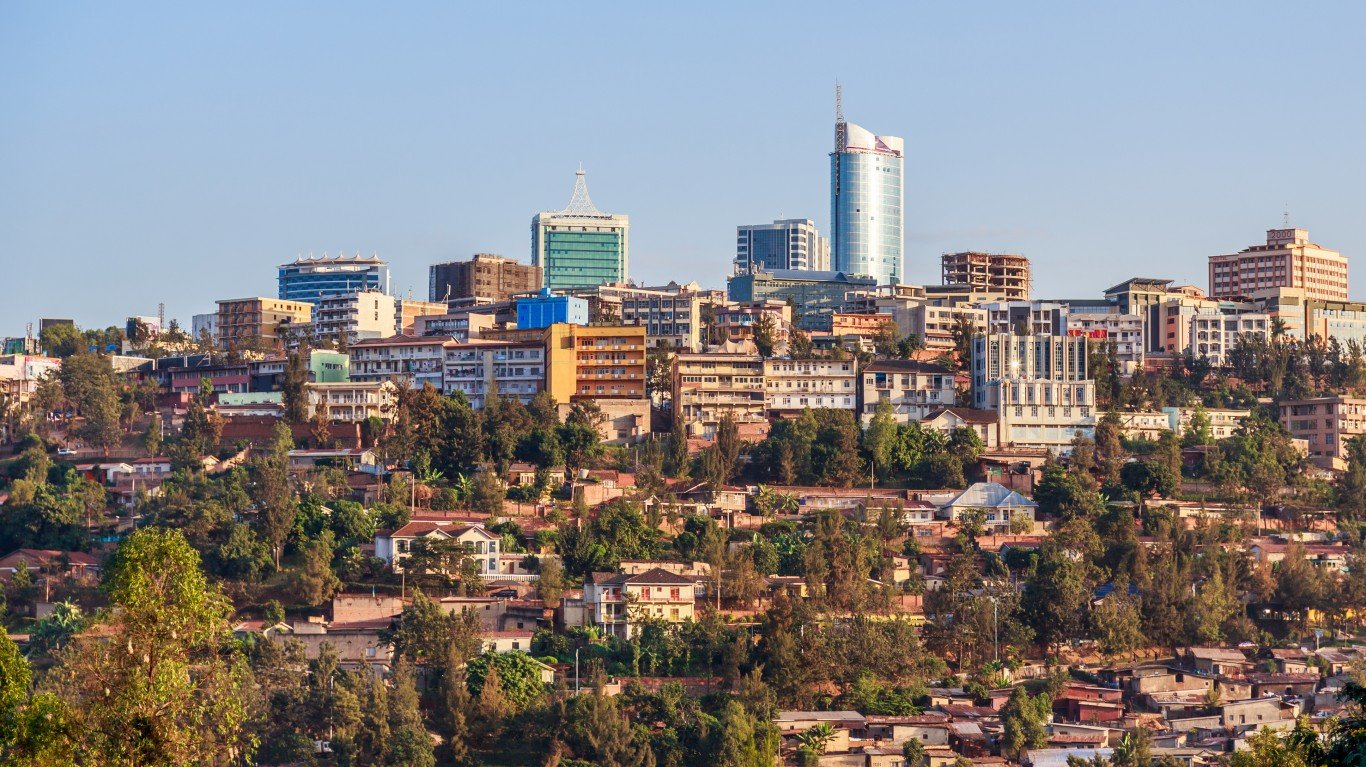
18. Rwanda
> Pop. without basic access to clean water: 43.3%
> Pop. consuming untreated surface water: 7.6%
> Total population: 11.8 million
> GDP per capita: $2,090
> Avg. life expectancy: 67.1 years
[recirclink id=488561]
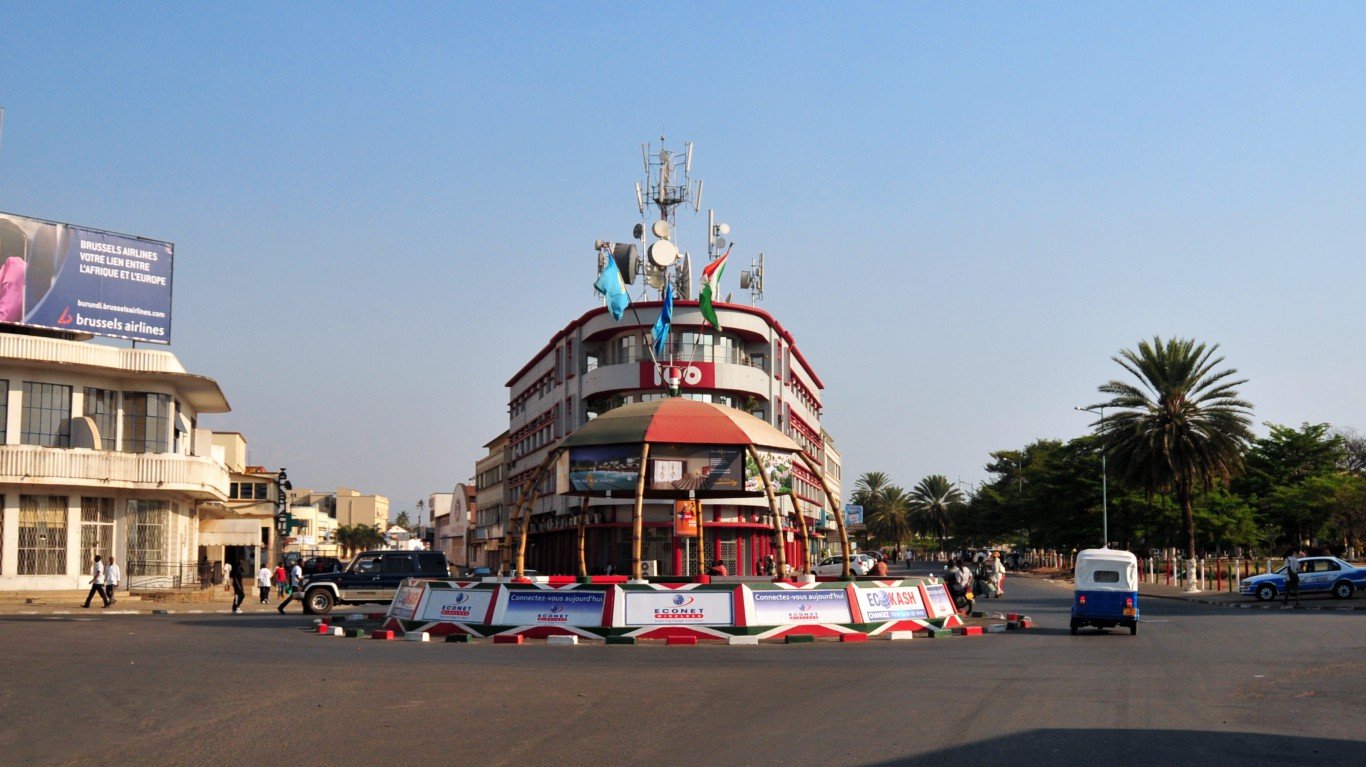
17. Burundi
> Pop. without basic access to clean water: 44.1%
> Pop. consuming untreated surface water: 7.1%
> Total population: 9.9 million
> GDP per capita: $812
> Avg. life expectancy: 57.5 years
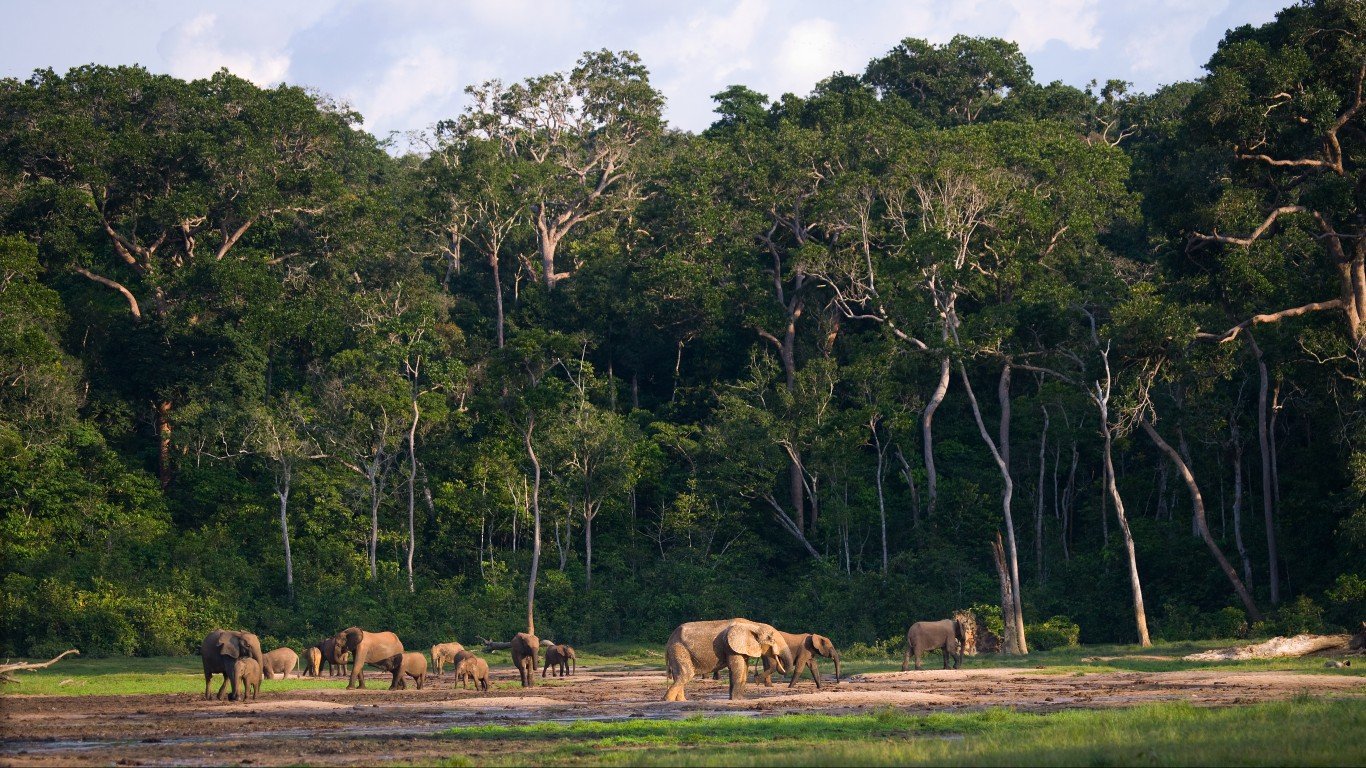
16. Central African Republic
> Pop. without basic access to clean water: 45.9%
> Pop. consuming untreated surface water: 3.2%
> Total population: 5.0 million
> GDP per capita: $685
> Avg. life expectancy: 52.2 years
[in-text-ad-2]
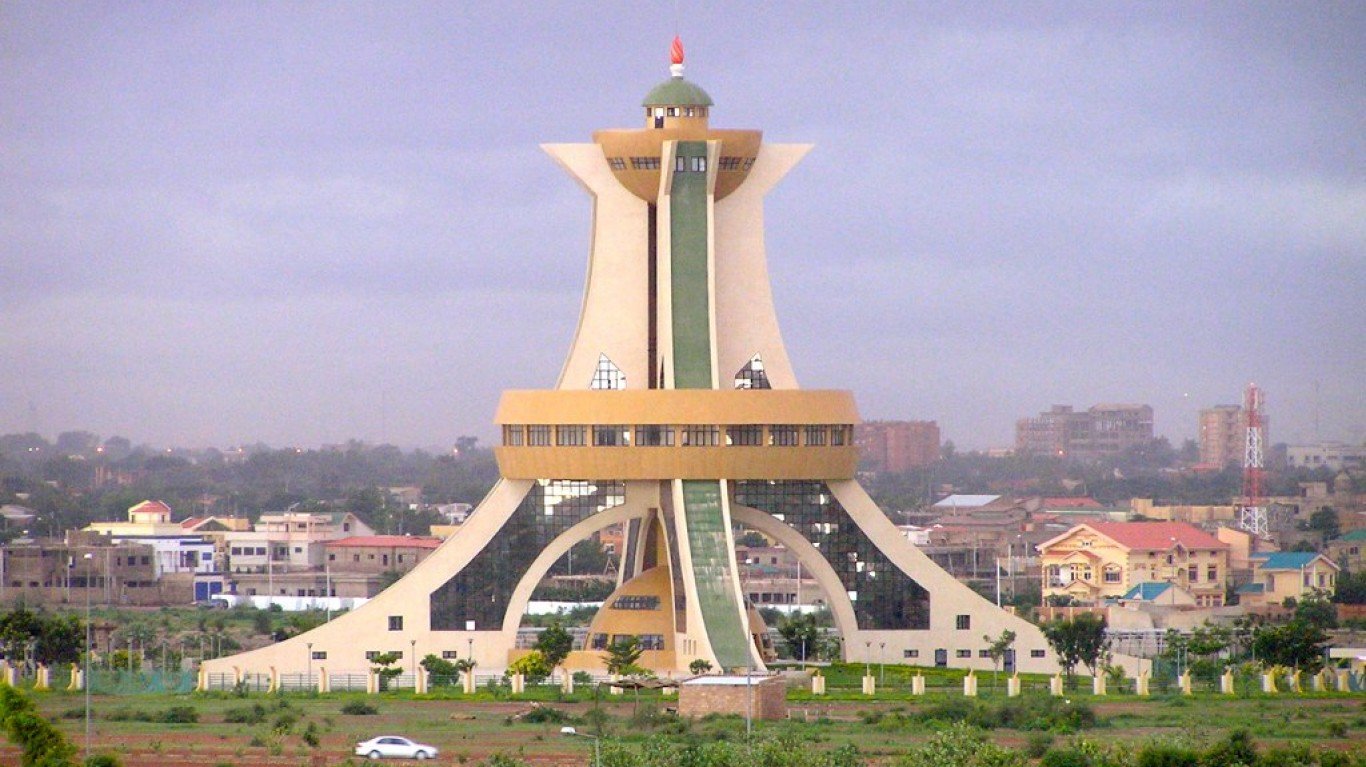
15. Burkina Faso
> Pop. without basic access to clean water: 46.1%
> Pop. consuming untreated surface water: 2.2%
> Total population: 18.9 million
> GDP per capita: $1,880
> Avg. life expectancy: 60.4 years
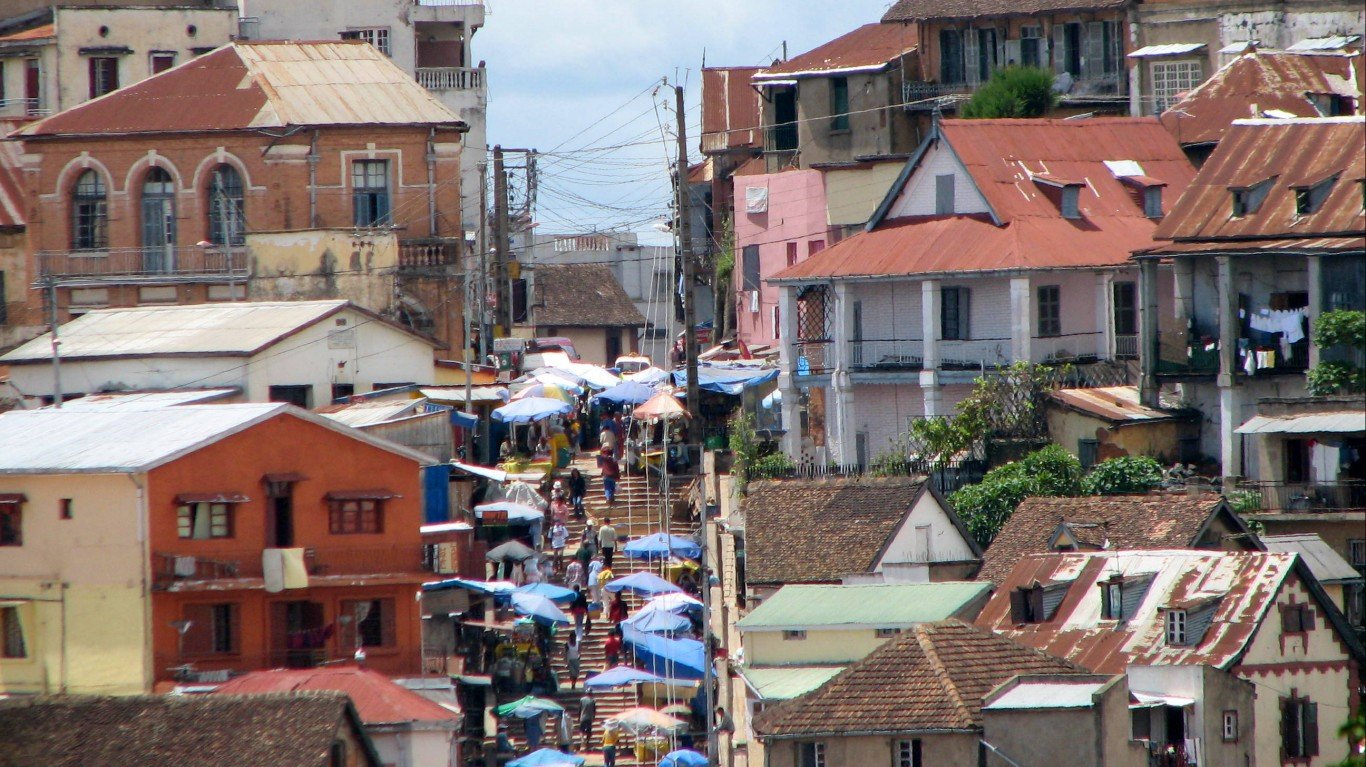
14. Madagascar
> Pop. without basic access to clean water: 49.4%
> Pop. consuming untreated surface water: 15.9%
> Total population: 25.6 million
> GDP per capita: $1,564
> Avg. life expectancy: 65.9 years
[in-text-ad]
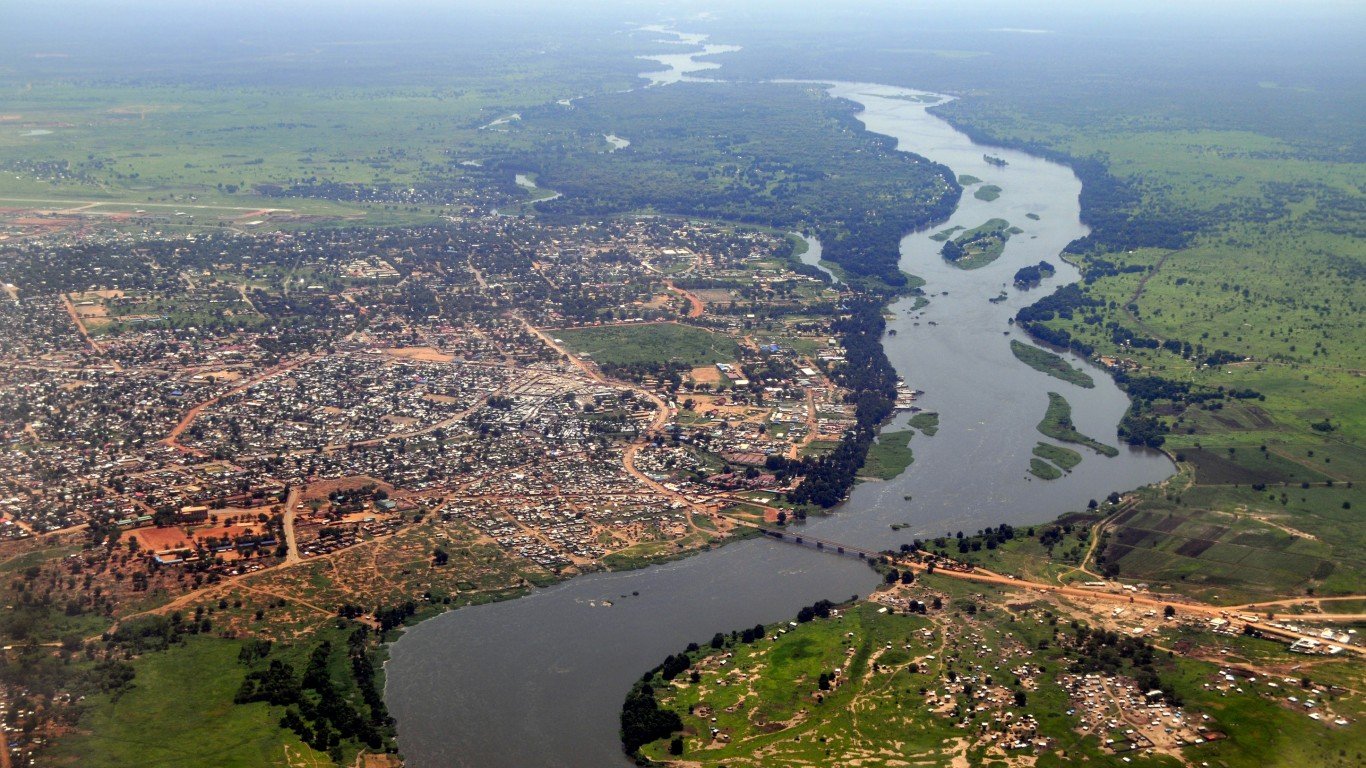
13. South Sudan
> Pop. without basic access to clean water: 49.6%
> Pop. consuming untreated surface water: 6.7%
> Total population: 13.1 million
> GDP per capita: $1,555
> Avg. life expectancy: 56.8 years
[recirclink id=488514]
12. United Republic of Tanzania
> Pop. without basic access to clean water: 49.9%
> Pop. consuming untreated surface water: 13.3%
> Total population: 49.6 million
> GDP per capita: $3,296
> Avg. life expectancy: 65.7 years
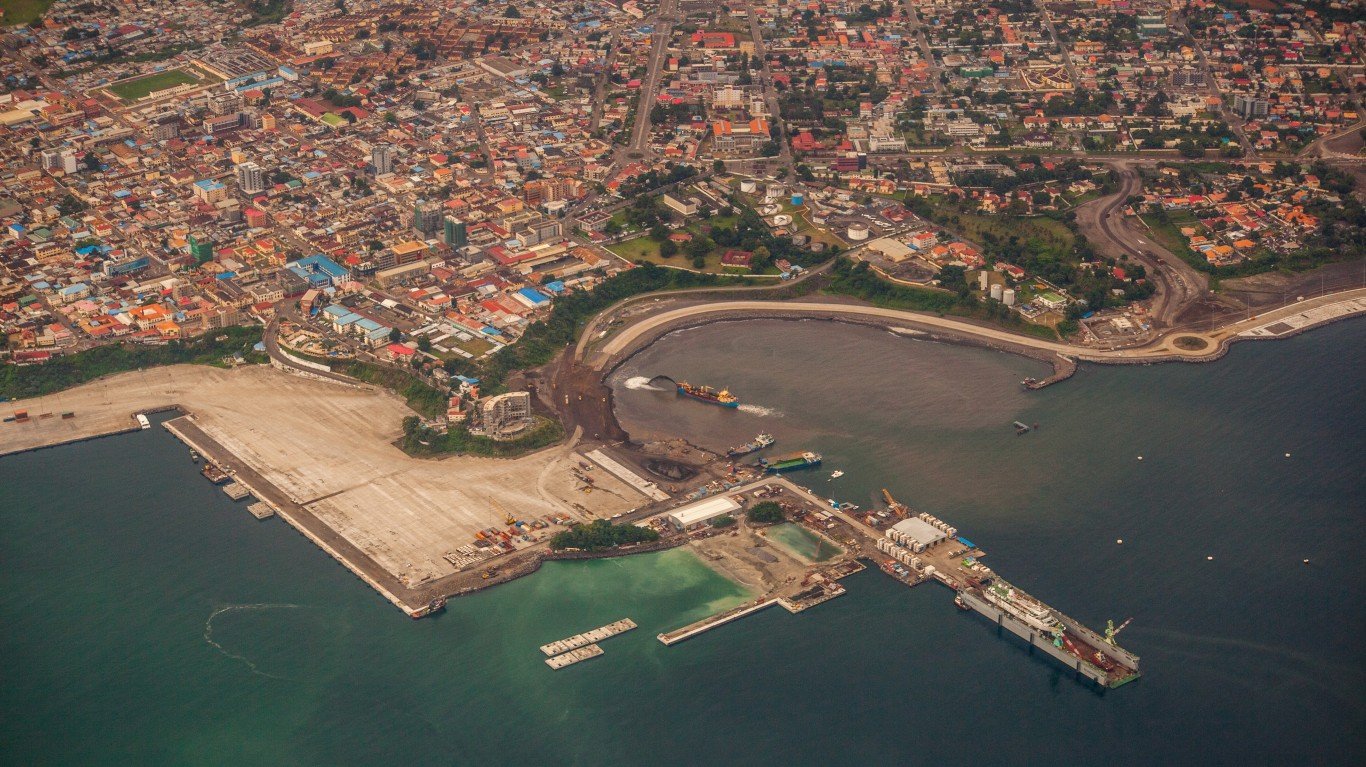
11. Equatorial Guinea
> Pop. without basic access to clean water: 50.4%
> Pop. consuming untreated surface water: 13.2%
> Total population: 843,000
> GDP per capita: $36,557
> Avg. life expectancy: 57.7 years
[in-text-ad-2]
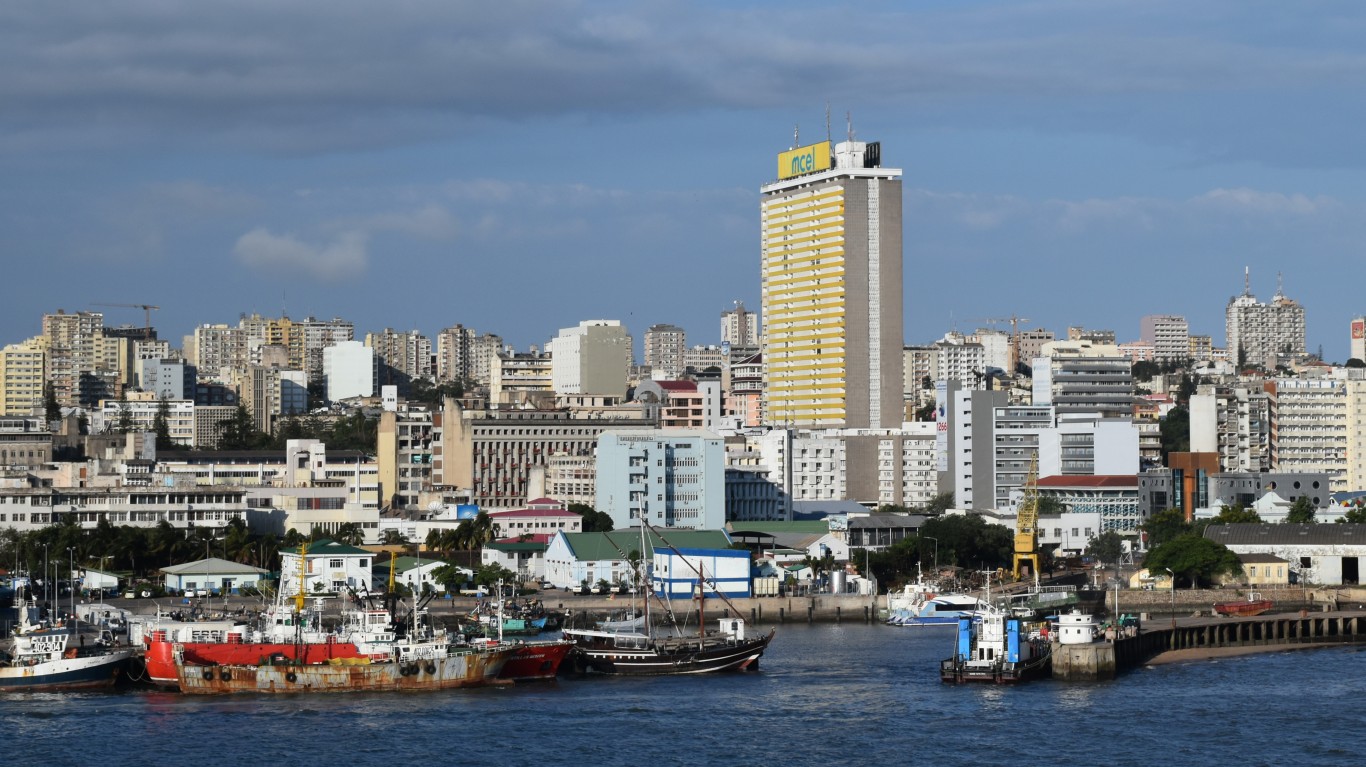
10. Mozambique
> Pop. without basic access to clean water: 52.7%
> Pop. consuming untreated surface water: 14.1%
> Total population: 29.5 million
> GDP per capita: $1,264
> Avg. life expectancy: 58.3 years
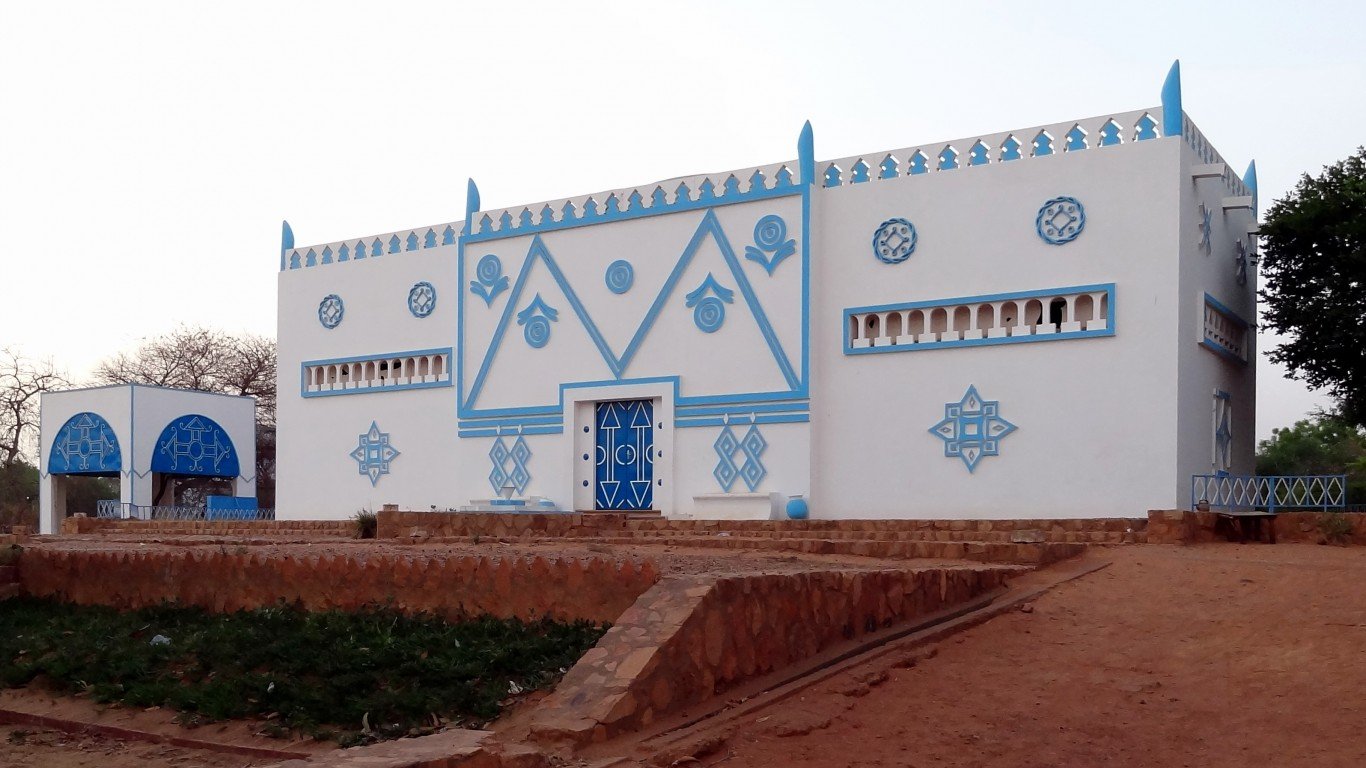
9. Niger
> Pop. without basic access to clean water: 54.2%
> Pop. consuming untreated surface water: 2.3%
> Total population: 18.8 million
> GDP per capita: $1,154
> Avg. life expectancy: 60.1 years
[in-text-ad]
8. Chad
> Pop. without basic access to clean water: 57.5%
> Pop. consuming untreated surface water: 5.8%
> Total population: 12.2 million
> GDP per capita: $2,440
> Avg. life expectancy: 52.9 years
[recirclink id=488498]
7. Democratic Republic of the Congo
> Pop. without basic access to clean water: 58.2%
> Pop. consuming untreated surface water: 9.8%
> Total population: 86.7 million
> GDP per capita: $789
> Avg. life expectancy: 59.6 years
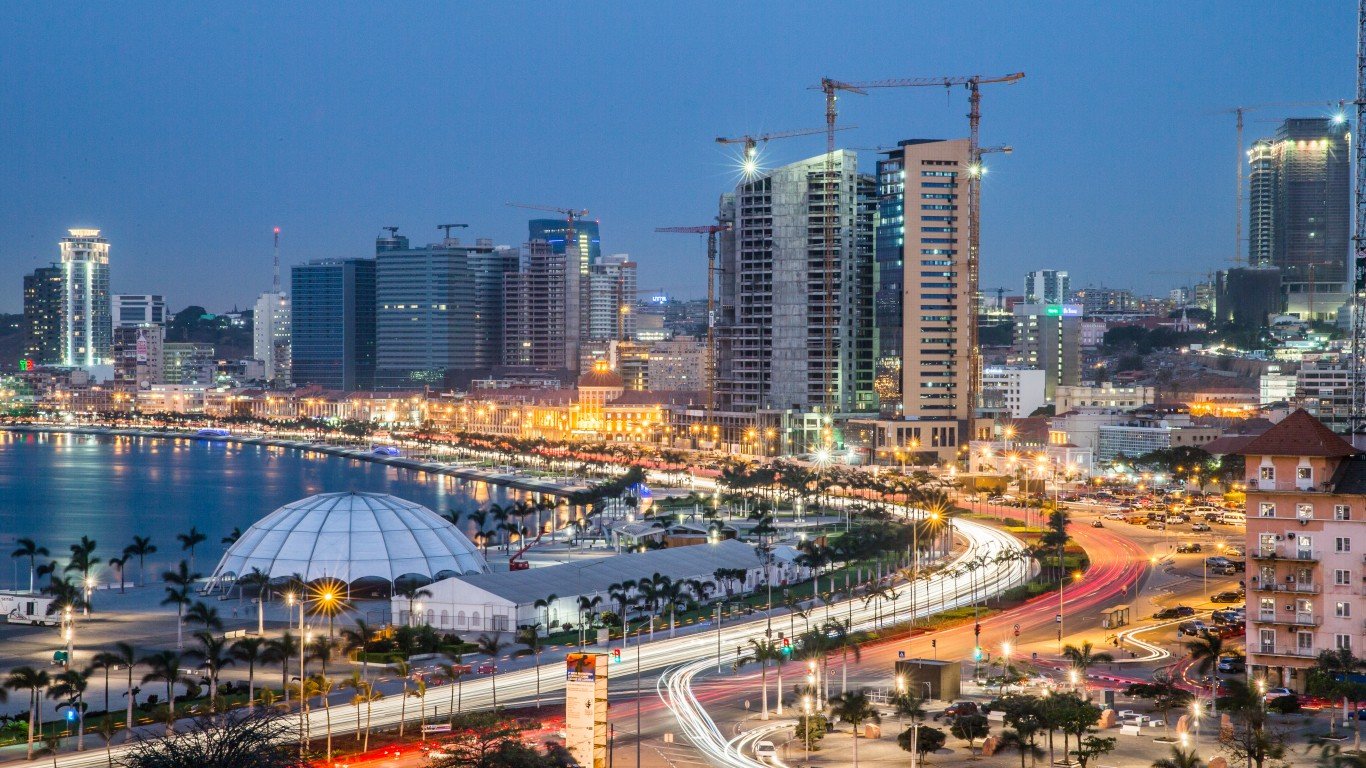
6. Angola
> Pop. without basic access to clean water: 59.0%
> Pop. consuming untreated surface water: 24.5%
> Total population: 28.2 million
> GDP per capita: $6,882
> Avg. life expectancy: 61.5 years
[in-text-ad-2]
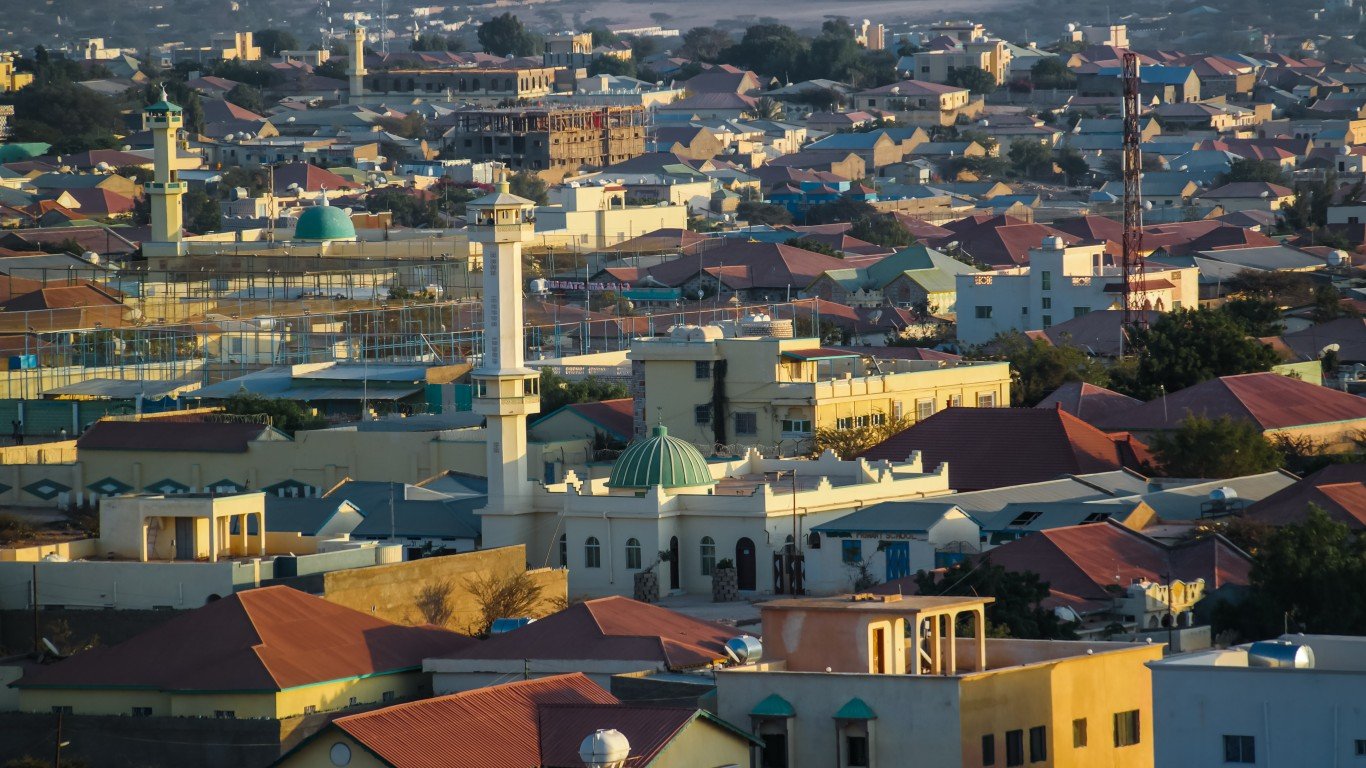
5. Somalia
> Pop. without basic access to clean water: 60.0%
> Pop. consuming untreated surface water: 11.7%
> Total population: 14.7 million
> GDP per capita: N/A
> Avg. life expectancy: 56.3 years
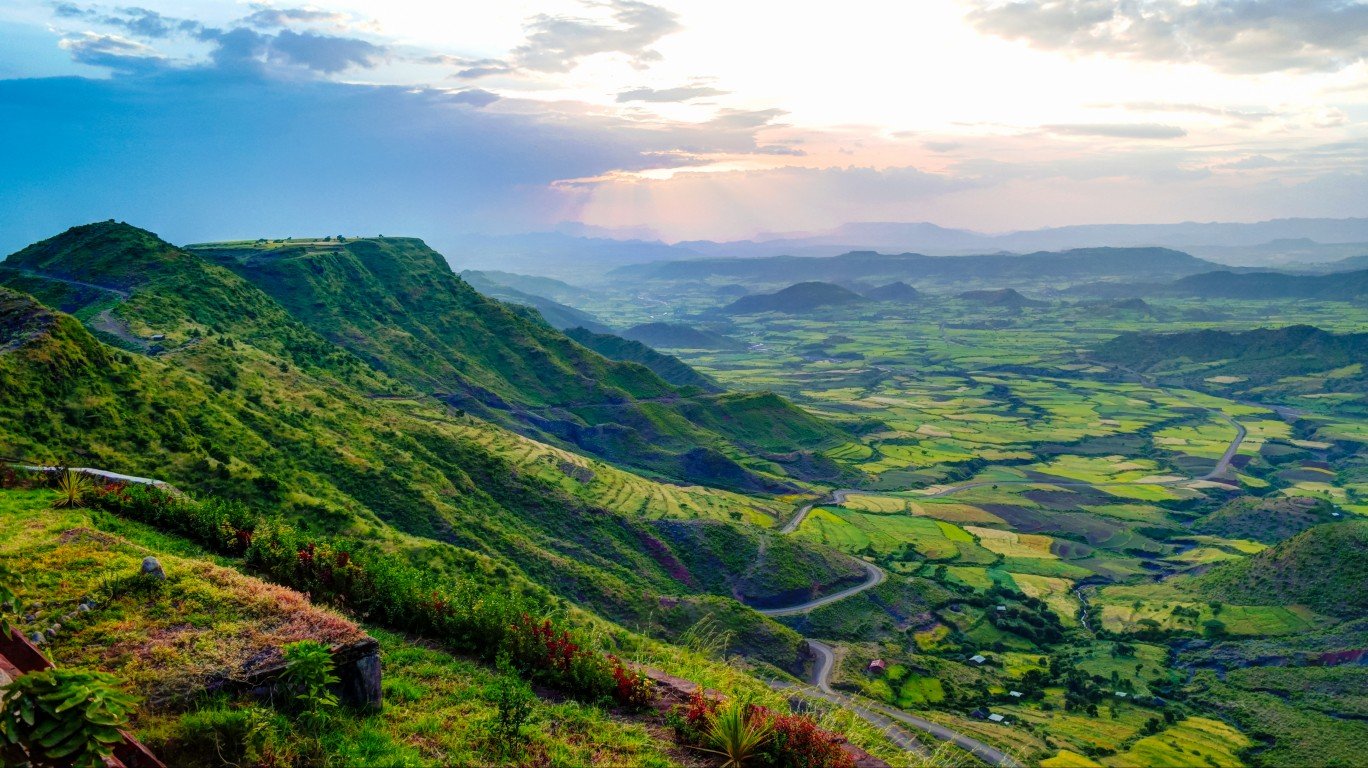
4. Ethiopia
> Pop. without basic access to clean water: 60.9%
> Pop. consuming untreated surface water: 11.6%
> Total population: 92.7 million
> GDP per capita: $2,104
> Avg. life expectancy: 65.5 years
[in-text-ad]
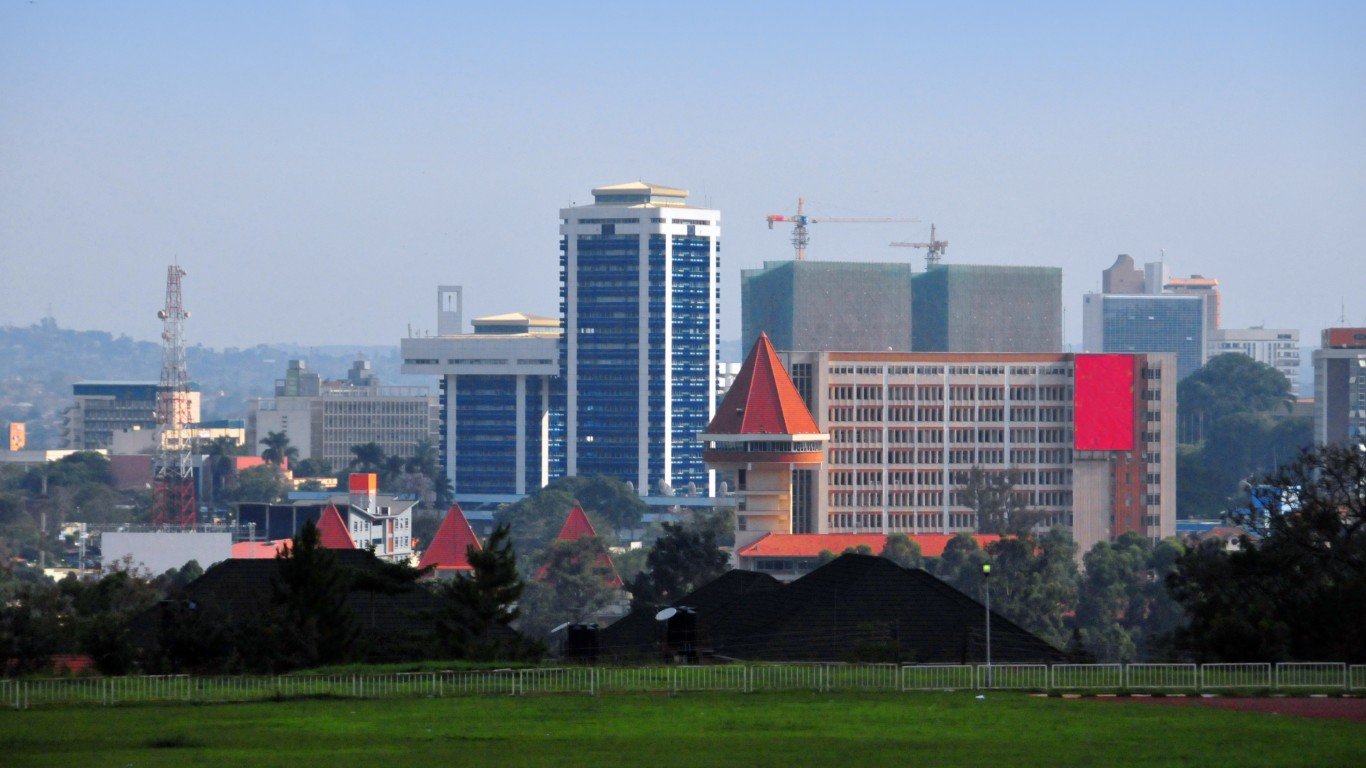
3. Uganda
> Pop. without basic access to clean water: 61.1%
> Pop. consuming untreated surface water: 8.2%
> Total population: 42.3 million
> GDP per capita: $2,155
> Avg. life expectancy: 59.9 years
[recirclink id=488094]
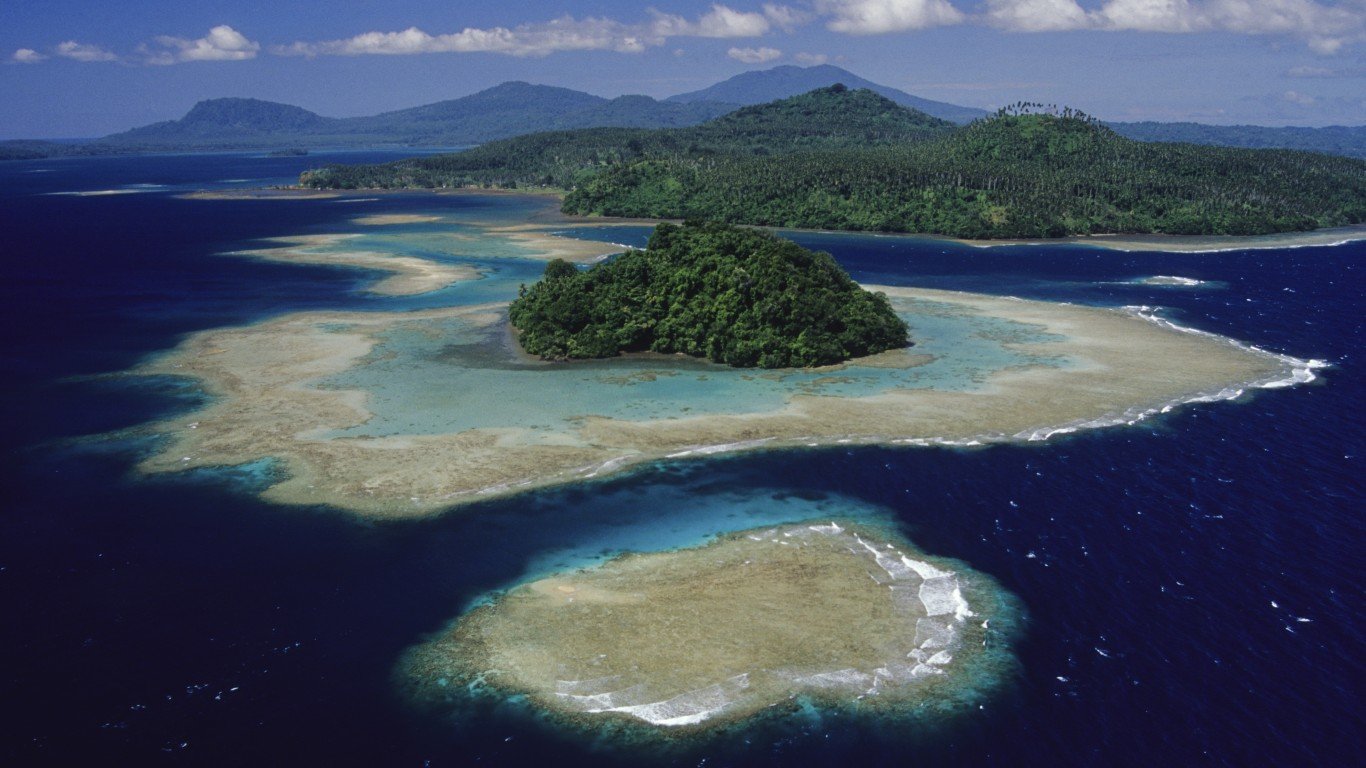
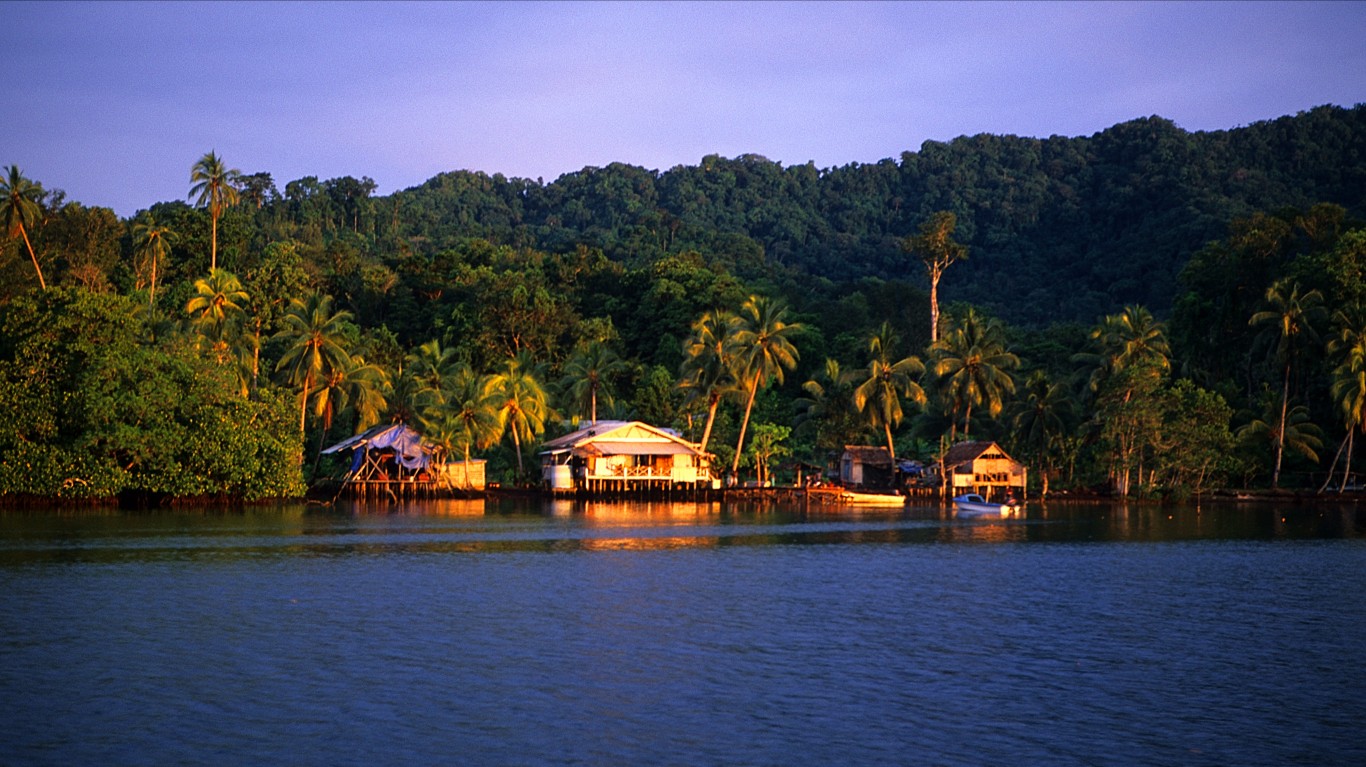
2. Papua New Guinea
> Pop. without basic access to clean water: 63.4%
> Pop. consuming untreated surface water: 42.2%
> Total population: 8.1 million
> GDP per capita: $3,636
> Avg. life expectancy: 65.5 years
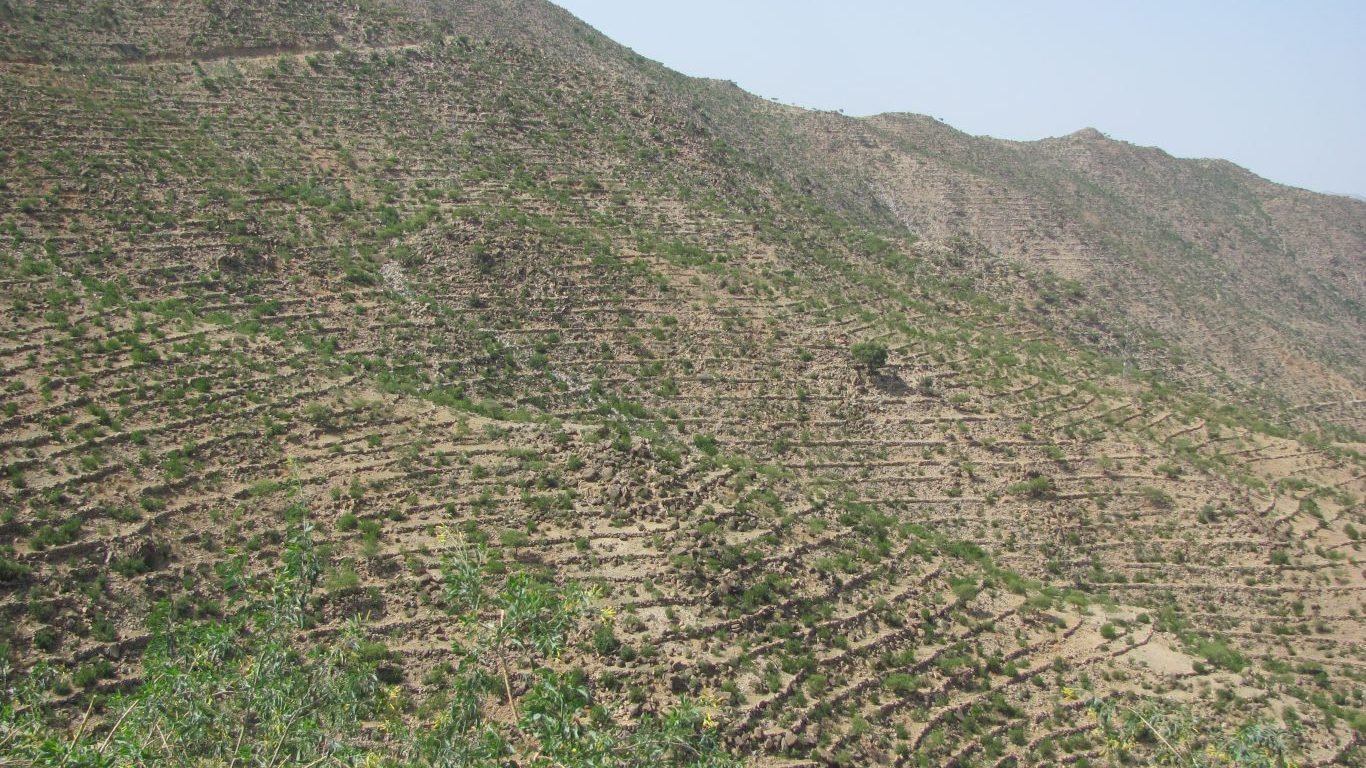
1. Eritrea
> Pop. without basic access to clean water: 80.7%
> Pop. consuming untreated surface water: 21.5%
> Total population: 6.7 million
> GDP per capita: $1,441
> Avg. life expectancy: 65.1 years
Methodology
To identify the countries with the worst access to drinking water, 24/7 Wall St. reviewed the 2017 report “Progress on Drinking Water, Sanitation and Hygiene,” a World Health Organization and UNICEF joint effort. Countries were ranked on the share of the population without basic access to clean water. Basic access is defined as clean water attainable in 30 minutes or less. We also considered the share of the population directly consuming untreated surface water from sources like ponds and streams. Water access data is as of 2015, the most recent year available. Total population figures came from the International Monetary Fund and are as of 2017. Population estimates for Somalia came from the World Bank. Gross domestic product, or GDP, per capita figures came from the IMF and are as of 2017. Life expectancy data came from the World Bank and is as of 2016.
Contact [email protected] for any questions or corrections.