
[cnxvideo id=”893014″ placement=”ros”]
The U.S. economy added 164,000 jobs in July, nearly in line with the expectations of economists. July marks 106 consecutive months of jobs growth — the longest in U.S. history.
Over the last five years alone, overall employment — the number of people employed — in the United States climbed by 7.3%. At the same time, the unemployment rate dipped from 6.1% in June 2014, to 3.4% in June 2019 — close to its lowest point in decades.
Job growth has not been even nationwide, and in some U.S. cities, employment has declined by at least 2.5% in the last five years, and by as much as 16.7% in one case. 24/7 Wall St. reviewed five-year changes in employment at the metro area level to identify the cities losing the most jobs. As can be seen on this list of the cities adding the most jobs, jobs are being added at the fastest rates in the Southern and Western United States. The cities losing the most jobs, on the other hand, can be found in 13 states all across the country.
The metro areas on this list share many of the common issues associated with economic stagnation and weak labor markets, including high poverty, high unemployment, and low incomes. Most of the metro areas on this list have college attainment rates well below the national rate of 32% of adults with a bachelor’s degree.
Those who have a college degree tend to have an easier time finding steady work, and places with a better-educated workforce are often more attractive to potential employers. These are America’s most and least educated states.
Click here to see the American cities losing the most jobs
Click here to read our methodology

25. Parkersburg-Vienna, West Virginia
> Employment chg. 2014-2019: -2.5% (38,395 to 37,451)
> State employment chg. 2014-2019: +2.8% (747,653 to 768,676)
> June unemployment: 5.2%
> Industry with largest employment decrease: Private Service Providing
> Median household income: $43,648
[in-text-ad]

24. Anchorage, Alaska
> Employment chg. 2014-2019: -2.6% (191,557 to 186,638)
> State employment chg. 2014-2019: -3.4% (346,915 to 335,014)
> June unemployment: 5.7%
> Industry with largest employment decrease: Professional and Business Services
> Median household income: $76,871
[recirclink id=561552]

23. Huntington-Ashland, West Virginia
> Employment chg. 2014-2019: -2.6% (141,679 to 137,985)
> State employment chg. 2014-2019: +2.8% (747,653 to 768,676)
> June unemployment: 5.4%
> Industry with largest employment decrease: Trade, Transportation, and Utilities
> Median household income: $40,646

22. El Centro, California
> Employment chg. 2014-2019: -2.6% (58,616 to 57,064)
> State employment chg. 2014-2019: +6.9% (17,302,871 to 18,493,254)
> June unemployment: 18.6%
> Industry with largest employment decrease: Goods Producing
> Median household income: $47,211
[in-text-ad-2]

21. Danville, Illinois
> Employment chg. 2014-2019: -2.8% (32,618 to 31,720)
> State employment chg. 2014-2019: +3.2% (6,118,478 to 6,312,161)
> June unemployment: 4.7%
> Industry with largest employment decrease: Service-Providing
> Median household income: $42,345
20. Weirton-Steubenville, West Virginia
> Employment chg. 2014-2019: -3.0% (49,493 to 48,028)
> State employment chg. 2014-2019: +2.8% (747,653 to 768,676)
> June unemployment: 5.5%
> Industry with largest employment decrease: Private Service Providing
> Median household income: $45,971
[in-text-ad]

19. Farmington, New Mexico
> Employment chg. 2014-2019: -3.1% (52,005 to 50,369)
> State employment chg. 2014-2019: +5.9% (865,695 to 917,134)
> June unemployment: 6.3%
> Industry with largest employment decrease: Goods Producing
> Median household income: $45,942
[recirclink id=569954]

18. Manhattan, Kansas
> Employment chg. 2014-2019: -3.3% (45,021 to 43,554)
> State employment chg. 2014-2019: +0.2% (1,438,597 to 1,441,558)
> June unemployment: 3.1%
> Industry with largest employment decrease: Government
> Median household income: $50,698

17. Atlantic City-Hammonton, New Jersey
> Employment chg. 2014-2019: -3.3% (122,119 to 118,128)
> State employment chg. 2014-2019: +2.8% (4,228,623 to 4,346,389)
> June unemployment: 4.0%
> Industry with largest employment decrease: Government
> Median household income: $61,777
[in-text-ad-2]

16. Watertown-Fort Drum, New York
> Employment chg. 2014-2019: -3.3% (44,872 to 43,386)
> State employment chg. 2014-2019: +2.2% (9,009,079 to 9,203,379)
> June unemployment: 4.2%
> Industry with largest employment decrease: Trade, Transportation, and Utilities
> Median household income: $47,101

15. Shreveport-Bossier City, Louisiana
> Employment chg. 2014-2019: -3.6% (183,363 to 176,850)
> State employment chg. 2014-2019: -0.4% (2,022,352 to 2,013,742)
> June unemployment: 5.7%
> Industry with largest employment decrease: Service-Providing
> Median household income: $38,627
[in-text-ad]

14. Fairbanks, Alaska
> Employment chg. 2014-2019: -3.6% (43,731 to 42,160)
> State employment chg. 2014-2019: -3.4% (346,915 to 335,014)
> June unemployment: 5.4%
> Industry with largest employment decrease: Goods Producing
> Median household income: $76,747
[recirclink id=566282]

13. Youngstown-Warren-Boardman, Ohio
> Employment chg. 2014-2019: -3.7% (238,463 to 229,705)
> State employment chg. 2014-2019: +3.9% (5,408,523 to 5,619,161)
> June unemployment: 5.6%
> Industry with largest employment decrease: Durable Goods
> Median household income: $45,382

12. Alexandria, Louisiana
> Employment chg. 2014-2019: -3.7% (62,434 to 60,105)
> State employment chg. 2014-2019: -0.4% (2,022,352 to 2,013,742)
> June unemployment: 5.7%
> Industry with largest employment decrease: Private Service Providing
> Median household income: $40,585
[in-text-ad-2]

11. Binghamton, New York
> Employment chg. 2014-2019: -4.2% (107,162 to 102,691)
> State employment chg. 2014-2019: +2.2% (9,009,079 to 9,203,379)
> June unemployment: 4.0%
> Industry with largest employment decrease: Trade, Transportation, and Utilities
> Median household income: $50,545
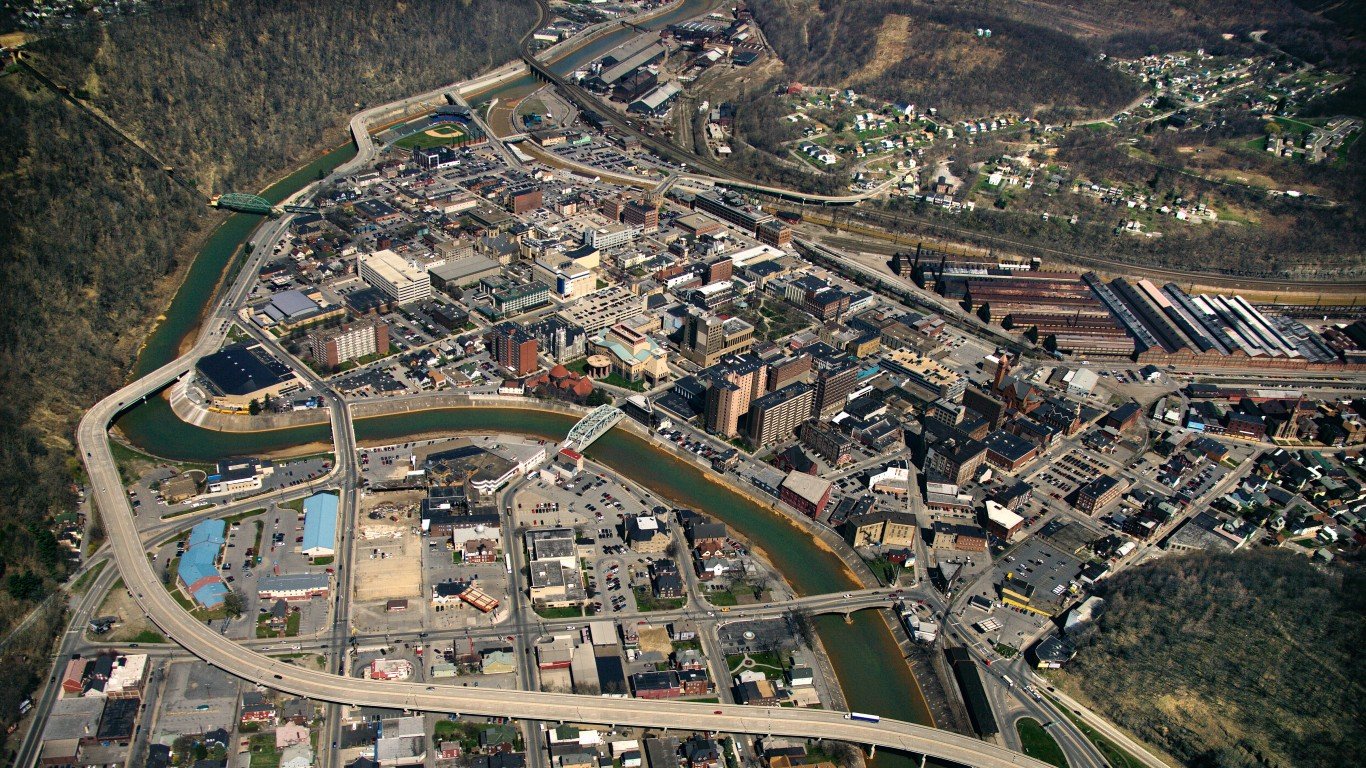
10. Johnstown, Pennsylvania
> Employment chg. 2014-2019: -4.9% (58,926 to 56,028)
> State employment chg. 2014-2019: +3.2% (6,067,113 to 6,262,169)
> June unemployment: 5.3%
> Industry with largest employment decrease: Service-Providing
> Median household income: $46,598
[in-text-ad]

9. Williamsport, Pennsylvania
> Employment chg. 2014-2019: -5.0% (57,874 to 54,982)
> State employment chg. 2014-2019: +3.2% (6,067,113 to 6,262,169)
> June unemployment: 4.2%
> Industry with largest employment decrease: Goods Producing
> Median household income: $50,909
[recirclink id=571898]

8. Charleston, West Virginia
> Employment chg. 2014-2019: -5.7% (96,038 to 90,547)
> State employment chg. 2014-2019: +2.8% (747,653 to 768,676)
> June unemployment: 4.7%
> Industry with largest employment decrease: Service-Providing
> Median household income: $41,558

7. Victoria, Texas
> Employment chg. 2014-2019: -6.4% (47,696 to 44,659)
> State employment chg. 2014-2019: +9.5% (12,368,472 to 13,542,322)
> June unemployment: 3.5%
> Industry with largest employment decrease: Goods Producing
> Median household income: $51,923
[in-text-ad-2]

6. Ithaca, New York
> Employment chg. 2014-2019: -6.5% (50,792 to 47,490)
> State employment chg. 2014-2019: +2.2% (9,009,079 to 9,203,379)
> June unemployment: 3.4%
> Industry with largest employment decrease: Goods Producing
> Median household income: $56,672

5. Longview, Texas
> Employment chg. 2014-2019: -6.6% (99,202 to 92,671)
> State employment chg. 2014-2019: +9.5% (12,368,472 to 13,542,322)
> June unemployment: 3.8%
> Industry with largest employment decrease: Goods Producing
> Median household income: $48,259
[in-text-ad]

4. Elmira, New York
> Employment chg. 2014-2019: -6.8% (36,414 to 33,955)
> State employment chg. 2014-2019: +2.2% (9,009,079 to 9,203,379)
> June unemployment: 3.8%
> Industry with largest employment decrease: Service-Providing
> Median household income: $51,194
[recirclink id=563422]

3. Lafayette, Louisiana
> Employment chg. 2014-2019: -7.2% (221,129 to 205,106)
> State employment chg. 2014-2019: -0.4% (2,022,352 to 2,013,742)
> June unemployment: 5.2%
> Industry with largest employment decrease: Goods Producing
> Median household income: $47,848

2. Casper, Wyoming
> Employment chg. 2014-2019: -9.9% (41,550 to 37,427)
> State employment chg. 2014-2019: -5.7% (298,537 to 281,669)
> June unemployment: 4.2%
> Industry with largest employment decrease: Goods Producing
> Median household income: $60,546
[in-text-ad-2]

1. Houma-Thibodaux, Louisiana
> Employment chg. 2014-2019: -16.7% (98,569 to 82,114)
> State employment chg. 2014-2019: -0.4% (2,022,352 to 2,013,742)
> June unemployment: 5.2%
> Industry with largest employment decrease: Service-Providing
> Median household income: $47,069
Methodology
To identify the American cities losing the most jobs, 24/7 Wall St. reviewed percent change in total employment over the five years from June 2014 to June 2019 in U.S. metro areas. Employment (the number of people employed), the total size of the labor force (those working and looking for work), and the number of unemployed workers are all from the Bureau of Labor Statistics.
The unemployment rate is also from the BLS and is as of June 2019. Employment by industry at the sector level is also from the BLS, and five-year changes were calculated from June 2014 to June 2019. Median household income and educational attainment are from the U.S. Census Bureau’s 2017 American Community Survey.
Contact [email protected] for any questions or corrections.