[cnxvideo id=”893014″ placement=”ros”]
As members of the baby boom generation age into retirement — approximately 10,000 Americans turn 65 every day — more and more are relying on pension benefits for their main source of income.
Millions of aging teachers, firefighters, sanitation workers, and other state and local government employees depend on the income owed to them through defined benefit pension plans. Such plans require employees to contribute a portion of their salaries to a pool of funds that is invested on their behalf and is paid out to them in retirement.
Poor management of the pension funds at the state and local levels, however, has put those benefits at risk for many future retirees. According to nongovernmental organization The Pew Charitable Trusts, state pension systems currently have, on average, less than 70% of the assets they need to be able to pay out benefits owed to current or retired public employees. In some states, the gap is significantly smaller, while in others the pension funding gap is far worse.
To rank the severity of each state’s pension crisis, 24/7 Wall St. reviewed the average pension funding ratio — the market value of a pension fund as a percentage of the total benefits owed to current or retired public employees — for all 50 states as of 2017 with data from The Pew Charitable Trusts.
For more on state budgeting and economic performance, see the states with the best and worst economies, the best and worst states for business, and the best and worst run states in America: a survey of all 50.
Click here to see the full list of pension crises in every state, ranked
Click here to see our detailed findings and methodology

50. Wisconsin
> Funded ratio: 102.6%
> Total pension shortfall: $2.6 billion surplus (the smallest)
> Gov’t workers as share of total workforce: 13.7% (9th lowest)
> Avg. annual payout per public retiree: $26,703 (15th highest)
> Governor: Tony Evers
[in-text-ad]

49. South Dakota
> Funded ratio: 100.1%
> Total pension shortfall: $9.1 million surplus (2nd smallest)
> Gov’t workers as share of total workforce: 18.1% (13th highest)
> Avg. annual payout per public retiree: $20,994 (16th lowest)
> Governor: Kristi Noem
[recirclink id=558313]
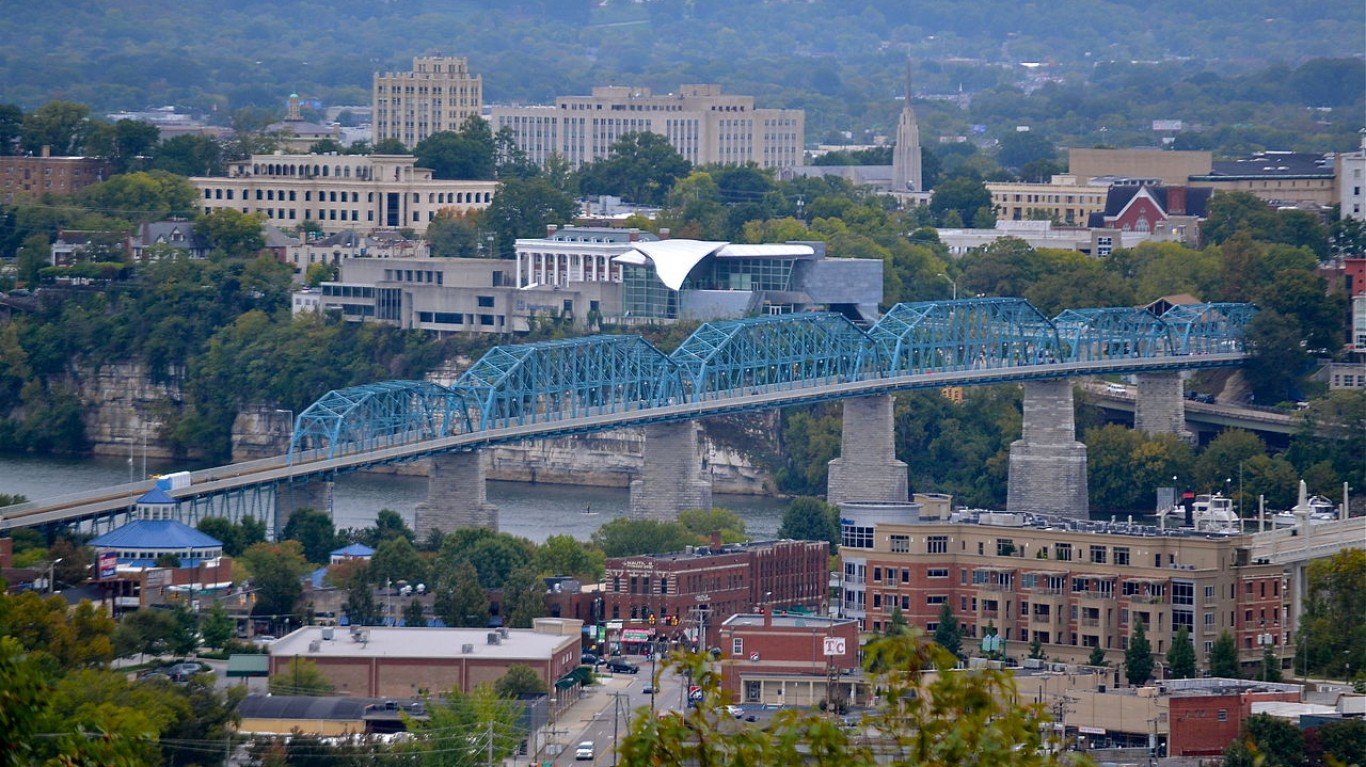
48. Tennessee
> Funded ratio: 96.5%
> Total pension shortfall: $1.7 billion (5th smallest)
> Gov’t workers as share of total workforce: 14.2% (13th lowest)
> Avg. annual payout per public retiree: $17,270 (3rd lowest)
> Governor: Bill Lee

47. New York
> Funded ratio: 94.5%
> Total pension shortfall: $11.5 billion (23rd smallest)
> Gov’t workers as share of total workforce: 15.4% (21st lowest)
> Avg. annual payout per public retiree: $33,040 (7th highest)
> Governor: Andrew Cuomo
[in-text-ad-2]

46. Idaho
> Funded ratio: 91.3%
> Total pension shortfall: $1.5 billion (4th smallest)
> Gov’t workers as share of total workforce: 16.9% (19th highest)
> Avg. annual payout per public retiree: $22,386 (19th lowest)
> Governor: Brad Little

45. North Carolina
> Funded ratio: 90.7%
> Total pension shortfall: $9.6 billion (21st smallest)
> Gov’t workers as share of total workforce: 16.3% (24th highest)
> Avg. annual payout per public retiree: $19,913 (8th lowest)
> Governor: Roy Cooper
[in-text-ad]

44. Utah
> Funded ratio: 90.3%
> Total pension shortfall: $3.4 billion (11th smallest)
> Gov’t workers as share of total workforce: 16.3% (23rd highest)
> Avg. annual payout per public retiree: $24,809 (20th highest)
> Governor: Gary Herbert
[recirclink id=530014]

43. Nebraska
> Funded ratio: 90.2%
> Total pension shortfall: $1.5 billion (3rd smallest)
> Gov’t workers as share of total workforce: 17.0% (18th highest)
> Avg. annual payout per public retiree: $24,812 (19th highest)
> Governor: Pete Ricketts

42. Washington
> Funded ratio: 89.6%
> Total pension shortfall: $9.9 billion (22nd smallest)
> Gov’t workers as share of total workforce: 17.2% (16th highest)
> Avg. annual payout per public retiree: $19,977 (10th lowest)
> Governor: Jay Inslee
[in-text-ad-2]

41. Oregon
> Funded ratio: 83.1%
> Total pension shortfall: $13.5 billion (25th largest)
> Gov’t workers as share of total workforce: 15.4% (22nd lowest)
> Avg. annual payout per public retiree: $33,397 (6th highest)
> Governor: Kate Brown

40. Delaware
> Funded ratio: 82.8%
> Total pension shortfall: $2.0 billion (6th smallest)
> Gov’t workers as share of total workforce: 14.4% (14th lowest)
> Avg. annual payout per public retiree: $23,433 (24th lowest)
> Governor: John Carney
[in-text-ad]

39. Iowa
> Funded ratio: 82.3%
> Total pension shortfall: $6.7 billion (16th smallest)
> Gov’t workers as share of total workforce: 16.5% (22nd highest)
> Avg. annual payout per public retiree: $17,855 (5th lowest)
> Governor: Kim Reynolds
[recirclink id=540624]

38. Maine
> Funded ratio: 81.9%
> Total pension shortfall: $3.0 billion (10th smallest)
> Gov’t workers as share of total workforce: 15.9% (24th lowest)
> Avg. annual payout per public retiree: $21,524 (18th lowest)
> Governor: Janet Mills
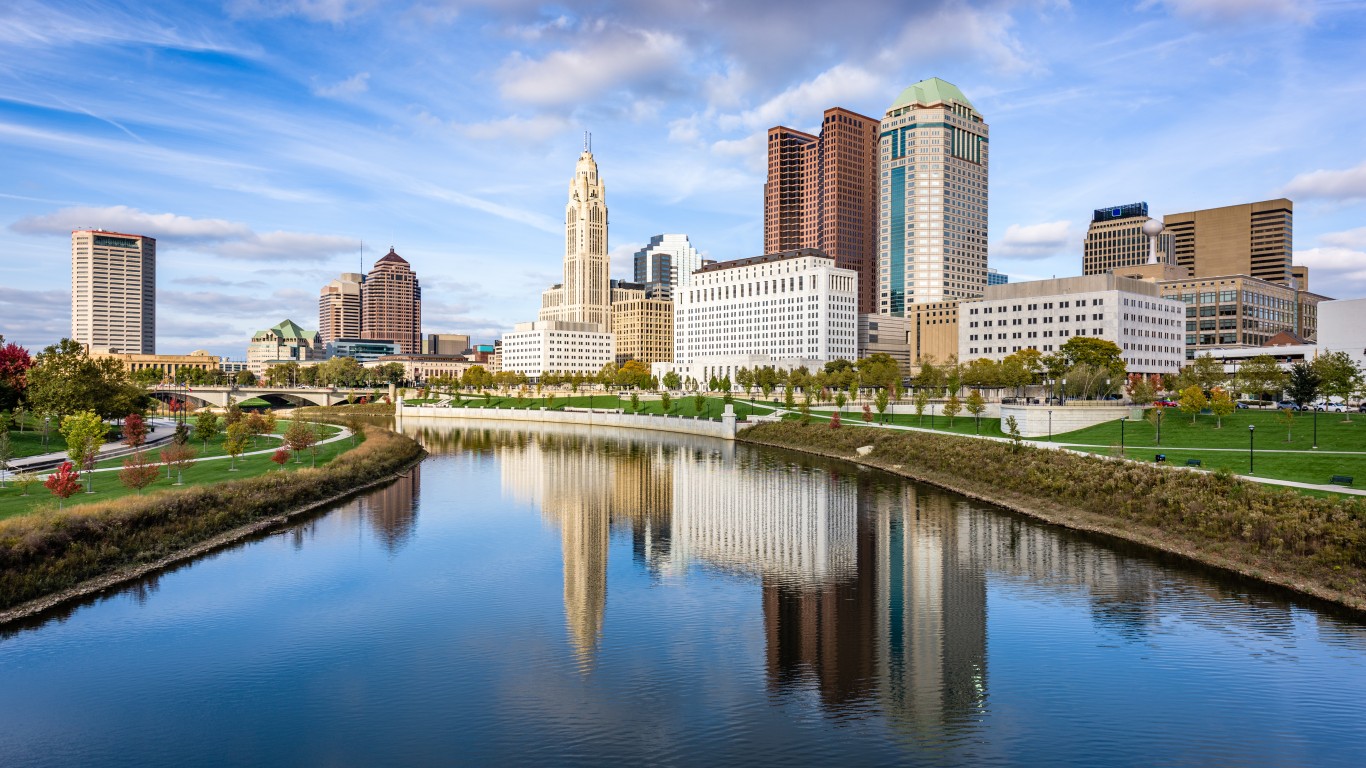
37. Ohio
> Funded ratio: 80.1%
> Total pension shortfall: $39.7 billion (9th largest)
> Gov’t workers as share of total workforce: 14.0% (12th lowest)
> Avg. annual payout per public retiree: $31,861 (10th highest)
> Governor: Mike DeWine
[in-text-ad-2]

36. Florida
> Funded ratio: 79.3%
> Total pension shortfall: $40.3 billion (8th largest)
> Gov’t workers as share of total workforce: 12.7% (5th lowest)
> Avg. annual payout per public retiree: $24,013 (23rd highest)
> Governor: Ron DeSantis

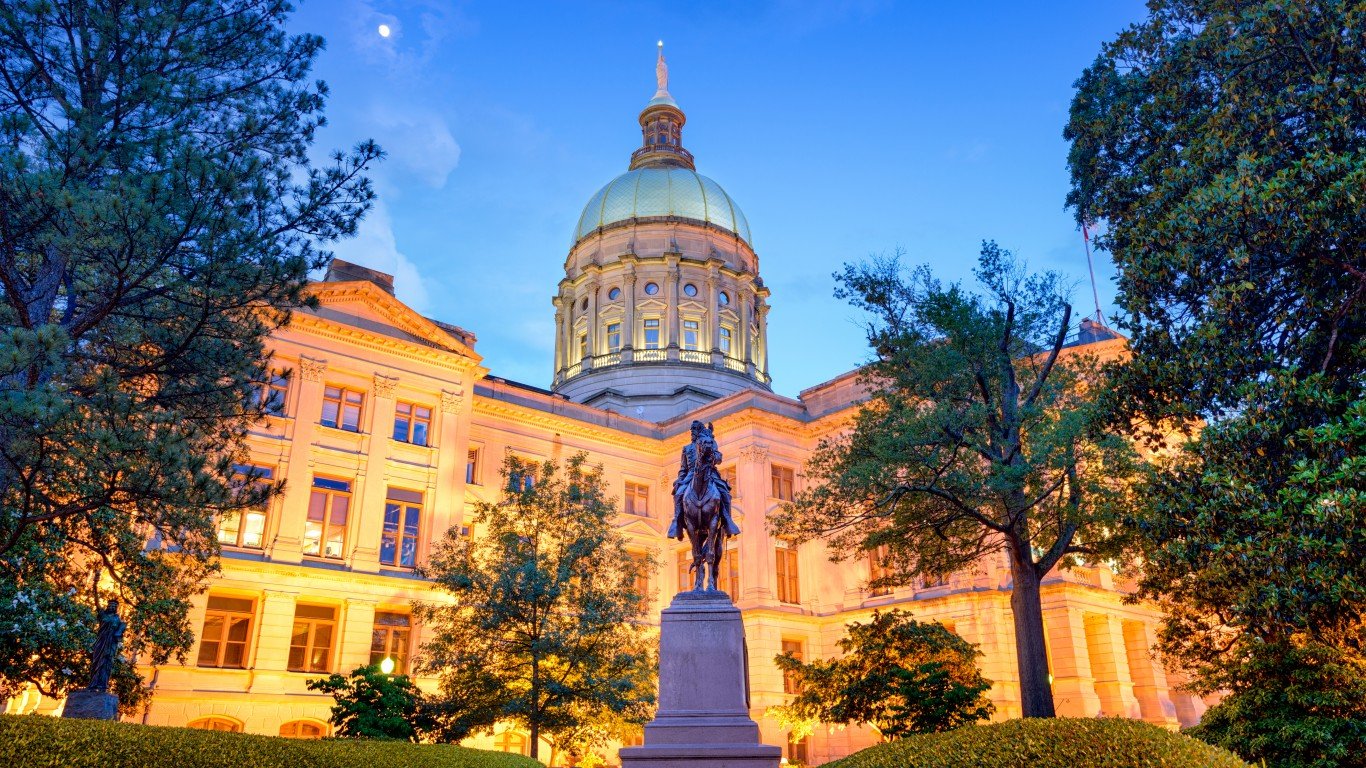
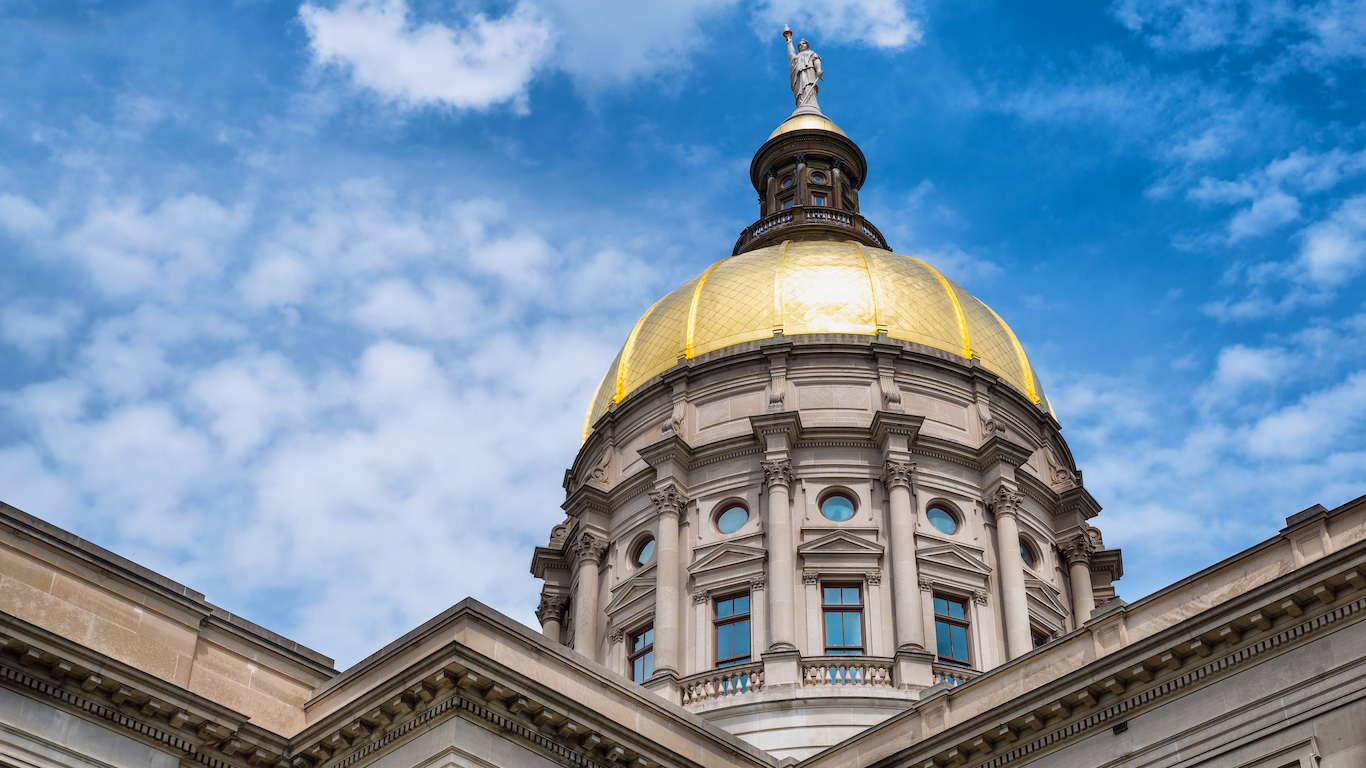
35. Georgia
> Funded ratio: 79.2%
> Total pension shortfall: $22.9 billion (16th largest)
> Gov’t workers as share of total workforce: 15.3% (20th lowest)
> Avg. annual payout per public retiree: $27,122 (14th highest)
> Governor: Brian Kemp
[in-text-ad]
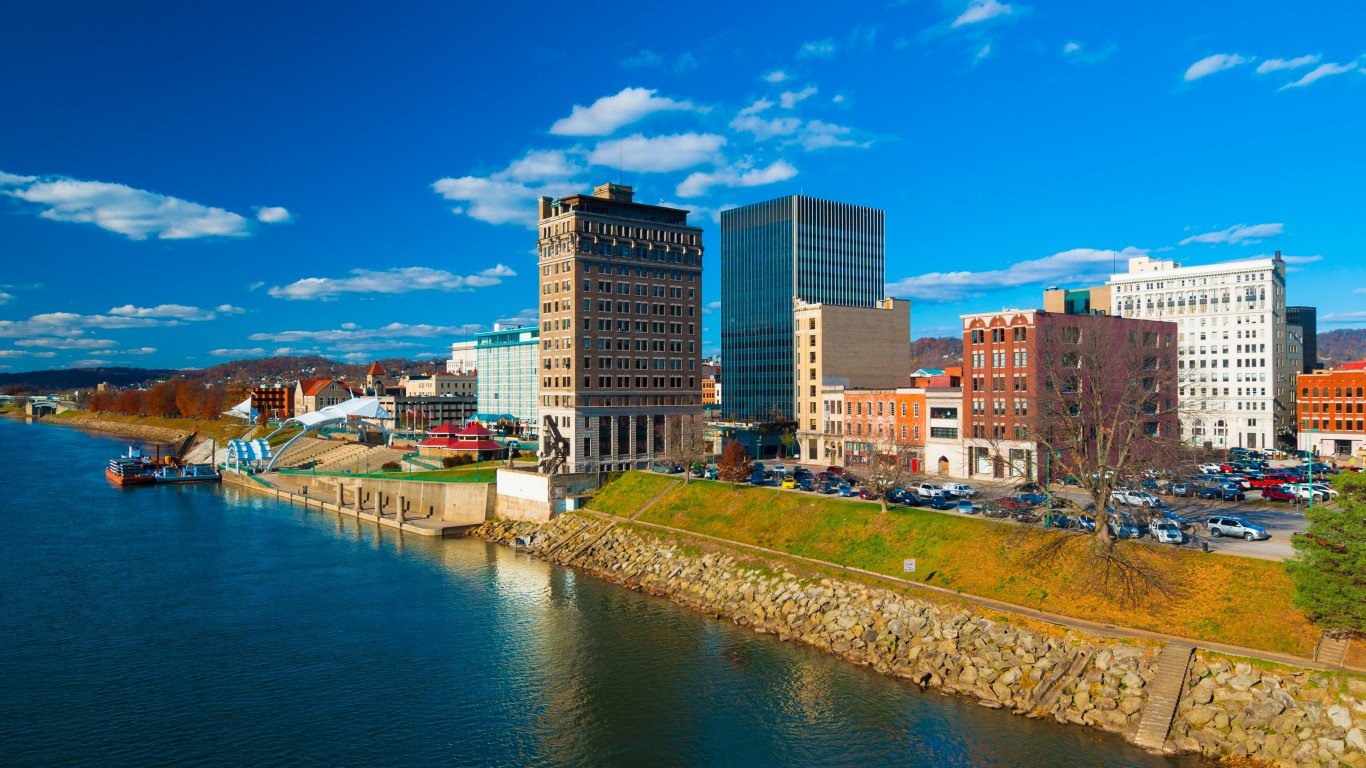
34. West Virginia
> Funded ratio: 78.9%
> Total pension shortfall: $3.9 billion (12th smallest)
> Gov’t workers as share of total workforce: 21.0% (4th highest)
> Avg. annual payout per public retiree: $17,290 (4th lowest)
> Governor: Jim Justice
[recirclink id=557787]
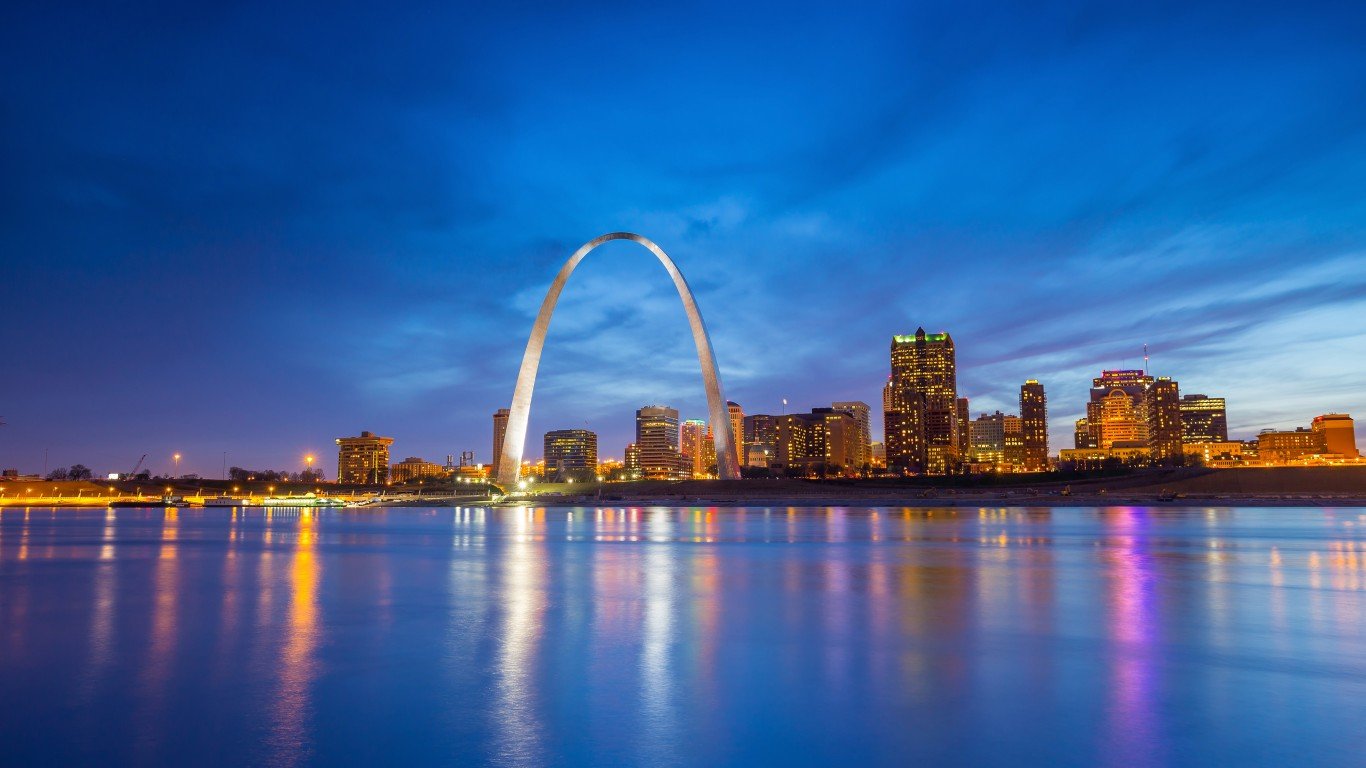
33. Missouri
> Funded ratio: 77.9%
> Total pension shortfall: $15.8 billion (23rd largest)
> Gov’t workers as share of total workforce: 15.0% (18th lowest)
> Avg. annual payout per public retiree: $23,582 (25th highest)
> Governor: Mike Parson
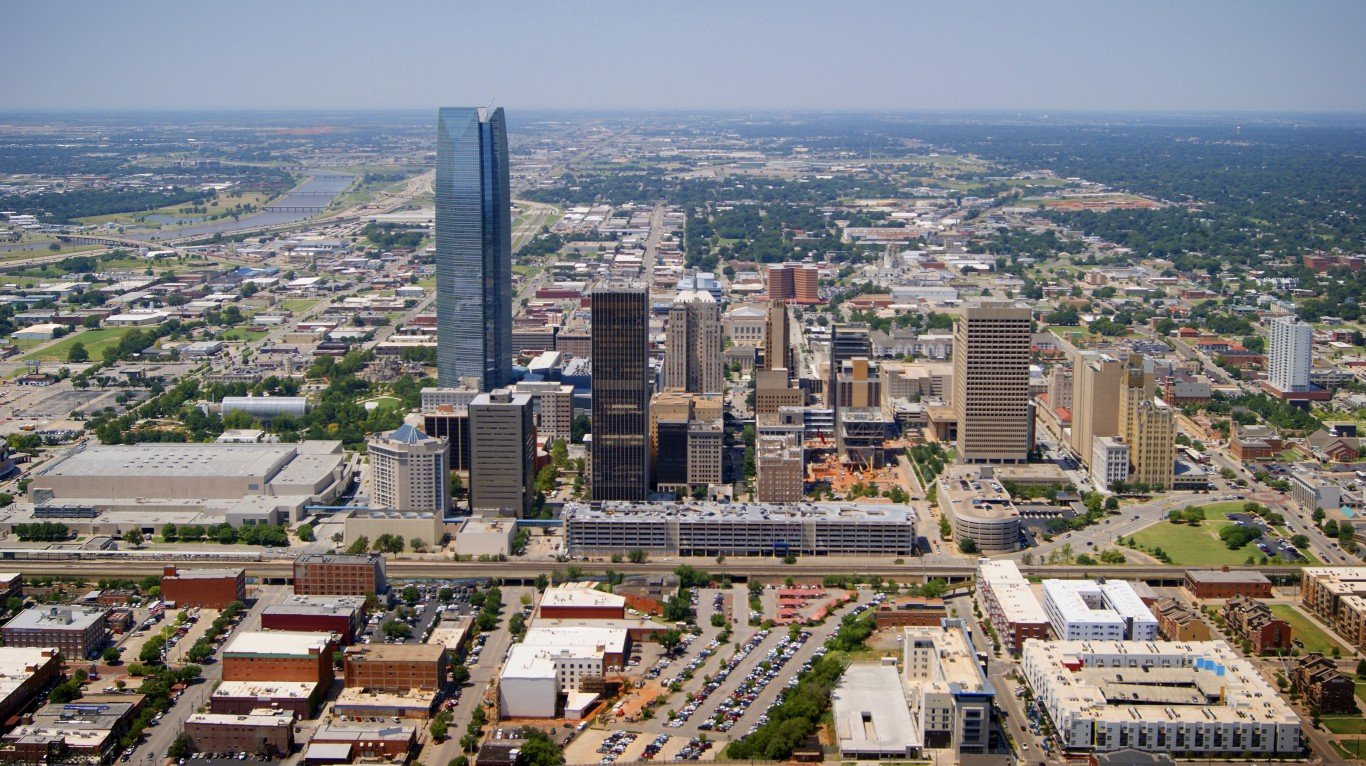
32. Oklahoma
> Funded ratio: 77.9%
> Total pension shortfall: $8.5 billion (19th smallest)
> Gov’t workers as share of total workforce: 20.6% (6th highest)
> Avg. annual payout per public retiree: $20,442 (14th lowest)
> Governor: Kevin Stitt
[in-text-ad-2]

31. Virginia
> Funded ratio: 77.2%
> Total pension shortfall: $21.5 billion (18th largest)
> Gov’t workers as share of total workforce: 18.1% (14th highest)
> Avg. annual payout per public retiree: $22,461 (20th lowest)
> Governor: Ralph Northam

30. Arkansas
> Funded ratio: 76.9%
> Total pension shortfall: $7.9 billion (18th smallest)
> Gov’t workers as share of total workforce: 16.8% (20th highest)
> Avg. annual payout per public retiree: $20,302 (13th lowest)
> Governor: Asa Hutchinson
[in-text-ad]

29. Texas
> Funded ratio: 76.1%
> Total pension shortfall: $55.1 billion (5th largest)
> Gov’t workers as share of total workforce: 15.6% (23rd lowest)
> Avg. annual payout per public retiree: $23,476 (25th lowest)
> Governor: Greg Abbott
[recirclink id=559178]

28. Wyoming
> Funded ratio: 75.9%
> Total pension shortfall: $2.7 billion (8th smallest)
> Gov’t workers as share of total workforce: 24.1% (2nd highest)
> Avg. annual payout per public retiree: $19,921 (9th lowest)
> Governor: Mark Gordon

27. Nevada
> Funded ratio: 74.4%
> Total pension shortfall: $13.3 billion (25th smallest)
> Gov’t workers as share of total workforce: 11.6% (the lowest)
> Avg. annual payout per public retiree: $34,926 (4th highest)
> Governor: Steve Sisolak
[in-text-ad-2]
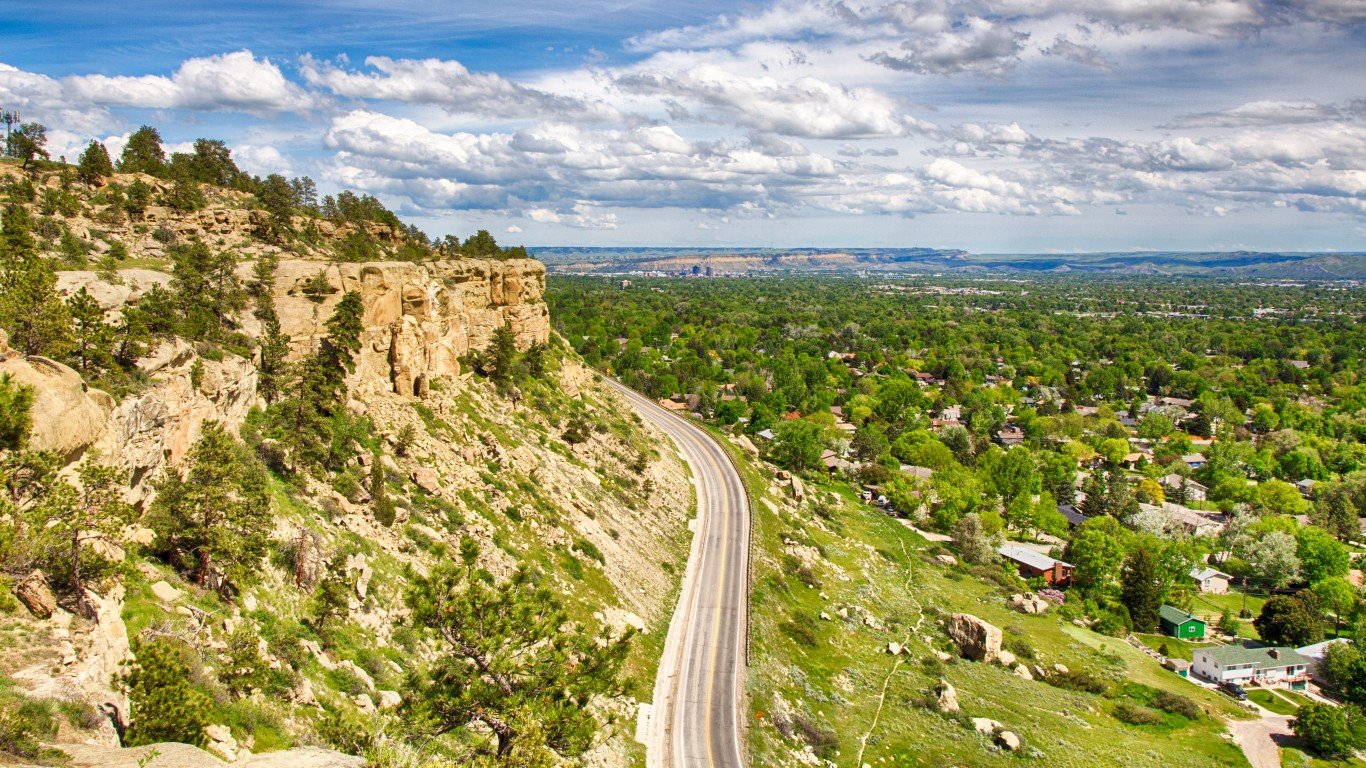
26. Montana
> Funded ratio: 72.8%
> Total pension shortfall: $4.1 billion (13th smallest)
> Gov’t workers as share of total workforce: 18.9% (9th highest)
> Avg. annual payout per public retiree: $20,225 (11th lowest)
> Governor: Steve Bullock
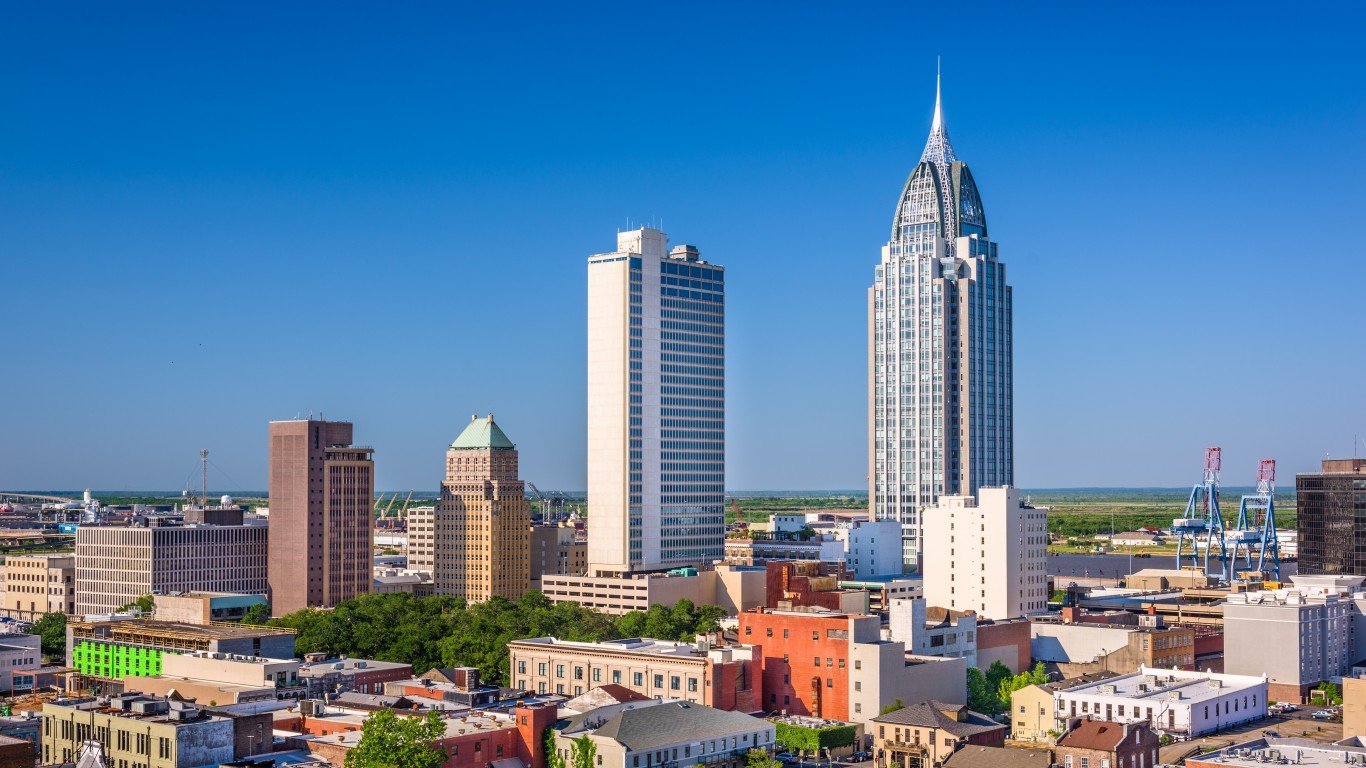
25. Alabama
> Funded ratio: 70.9%
> Total pension shortfall: $15.3 billion (24th largest)
> Gov’t workers as share of total workforce: 18.9% (10th highest)
> Avg. annual payout per public retiree: $23,091 (22nd lowest)
> Governor: Kay Ivey
[in-text-ad]

24. California
> Funded ratio: 68.9%
> Total pension shortfall: $190.4 billion (the largest)
> Gov’t workers as share of total workforce: 15.1% (19th lowest)
> Avg. annual payout per public retiree: $36,351 (3rd highest)
> Governor: Gavin Newsom
[recirclink id=526417]

23. Maryland
> Funded ratio: 68.6%
> Total pension shortfall: $22.6 billion (17th largest)
> Gov’t workers as share of total workforce: 18.4% (11th highest)
> Avg. annual payout per public retiree: $26,043 (18th highest)
> Governor: Larry Hogan

22. Kansas
> Funded ratio: 67.1%
> Total pension shortfall: $9.1 billion (20th smallest)
> Gov’t workers as share of total workforce: 18.2% (12th highest)
> Avg. annual payout per public retiree: $16,802 (the lowest)
> Governor: Laura Kelly
[in-text-ad-2]

21. Alaska
> Funded ratio: 66.6%
> Total pension shortfall: $7.2 billion (17th smallest)
> Gov’t workers as share of total workforce: 24.6% (the highest)
> Avg. annual payout per public retiree: $26,362 (16th highest)
> Governor: Mike Dunleavy

20. Louisiana
> Funded ratio: 65.1%
> Total pension shortfall: $18.2 billion (19th largest)
> Gov’t workers as share of total workforce: 16.5% (21st highest)
> Avg. annual payout per public retiree: $24,658 (21st highest)
> Governor: John Bel Edwards
[in-text-ad]

19. Michigan
> Funded ratio: 65.1%
> Total pension shortfall: $32.5 billion (13th largest)
> Gov’t workers as share of total workforce: 13.7% (10th lowest)
> Avg. annual payout per public retiree: $23,257 (23rd lowest)
> Governor: Gretchen Whitmer
[recirclink id=581590]

18. Indiana
> Funded ratio: 65.0%
> Total pension shortfall: $17.3 billion (20th largest)
> Gov’t workers as share of total workforce: 13.7% (8th lowest)
> Avg. annual payout per public retiree: $16,974 (2nd lowest)
> Governor: Eric Holcomb

17. Vermont
> Funded ratio: 64.3%
> Total pension shortfall: $2.3 billion (7th smallest)
> Gov’t workers as share of total workforce: 17.9% (15th highest)
> Avg. annual payout per public retiree: $20,301 (12th lowest)
> Governor: Phil Scott
[in-text-ad-2]

16. North Dakota
> Funded ratio: 63.8%
> Total pension shortfall: $3.0 billion (9th smallest)
> Gov’t workers as share of total workforce: 19.0% (8th highest)
> Avg. annual payout per public retiree: $19,265 (7th lowest)
> Governor: Doug Burgum

15. Minnesota
> Funded ratio: 63.3%
> Total pension shortfall: $37.2 billion (10th largest)
> Gov’t workers as share of total workforce: 14.4% (15th lowest)
> Avg. annual payout per public retiree: $18,256 (6th lowest)
> Governor: Tim Walz
[in-text-ad]

14. New Hampshire
> Funded ratio: 62.7%
> Total pension shortfall: $4.9 billion (14th smallest)
> Gov’t workers as share of total workforce: 13.2% (6th lowest)
> Avg. annual payout per public retiree: $22,989 (21st lowest)
> Governor: Chris Sununu
[recirclink id=580516]

13. New Mexico
> Funded ratio: 62.5%
> Total pension shortfall: $16.5 billion (22nd largest)
> Gov’t workers as share of total workforce: 22.2% (3rd highest)
> Avg. annual payout per public retiree: $20,907 (15th lowest)
> Governor: Michelle Lujan Grisham

12. Arizona
> Funded ratio: 62.2%
> Total pension shortfall: $27.4 billion (14th largest)
> Gov’t workers as share of total workforce: 14.5% (17th lowest)
> Avg. annual payout per public retiree: $23,907 (24th highest)
> Governor: Doug Ducey
[in-text-ad-2]

11. Mississippi
> Funded ratio: 61.6%
> Total pension shortfall: $16.8 billion (21st largest)
> Gov’t workers as share of total workforce: 20.9% (5th highest)
> Avg. annual payout per public retiree: $24,362 (22nd highest)
> Governor: Phil Bryant

10. Massachusetts
> Funded ratio: 59.9%
> Total pension shortfall: $35.7 billion (11th largest)
> Gov’t workers as share of total workforce: 12.5% (4th lowest)
> Avg. annual payout per public retiree: $31,510 (11th highest)
> Governor: Charlie Baker
[in-text-ad]

9. Pennsylvania
> Funded ratio: 55.3%
> Total pension shortfall: $66.7 billion (4th largest)
> Gov’t workers as share of total workforce: 11.7% (2nd lowest)
> Avg. annual payout per public retiree: $26,358 (17th highest)
> Governor: Tom Wolf
[recirclink id=558313]
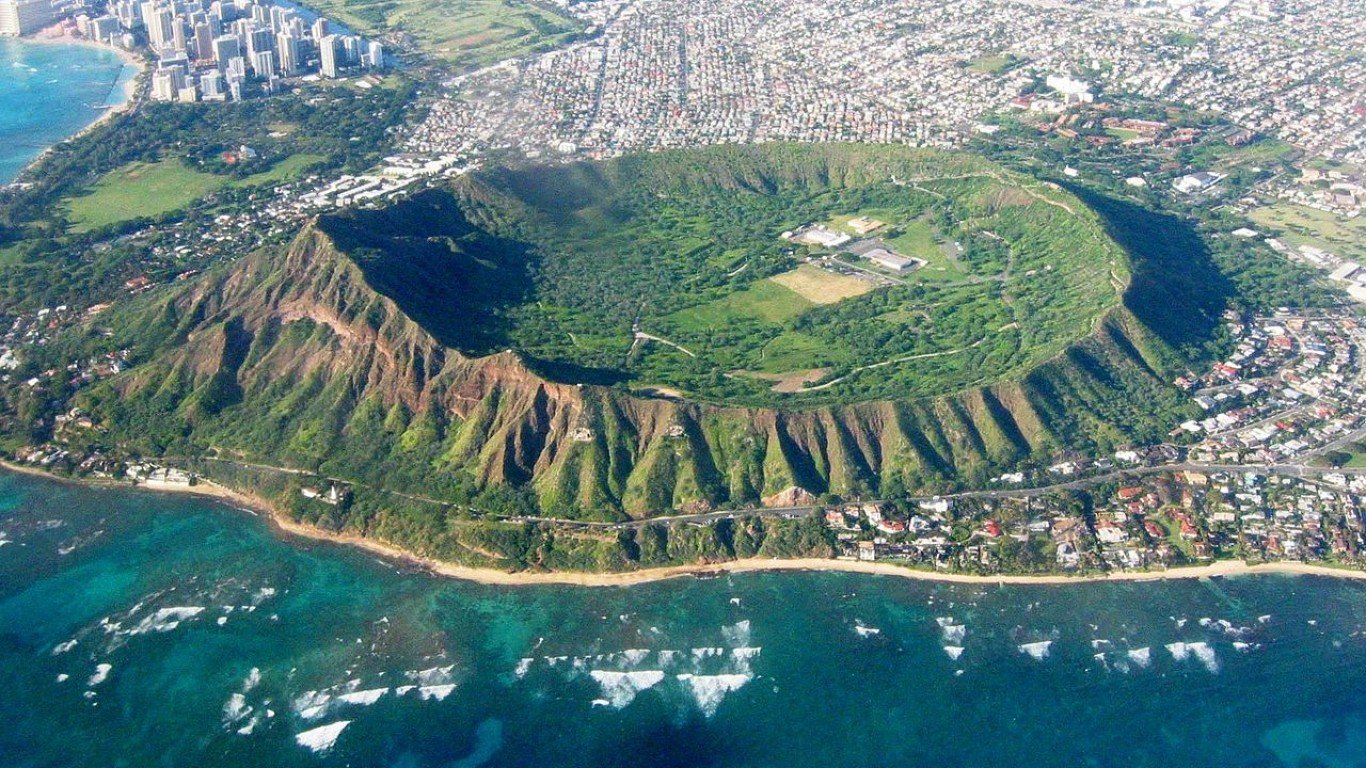
8. Hawaii
> Funded ratio: 54.8%
> Total pension shortfall: $13.0 billion (24th smallest)
> Gov’t workers as share of total workforce: 19.1% (7th highest)
> Avg. annual payout per public retiree: $28,627 (12th highest)
> Governor: David Ige

7. South Carolina
> Funded ratio: 54.3%
> Total pension shortfall: $25.5 billion (15th largest)
> Gov’t workers as share of total workforce: 17.2% (17th highest)
> Avg. annual payout per public retiree: $21,247 (17th lowest)
> Governor: Henry McMaster
[in-text-ad-2]

6. Rhode Island
> Funded ratio: 53.7%
> Total pension shortfall: $5.5 billion (15th smallest)
> Gov’t workers as share of total workforce: 12.3% (3rd lowest)
> Avg. annual payout per public retiree: $32,658 (8th highest)
> Governor: Gina Raimondo

5. Colorado
> Funded ratio: 47.1%
> Total pension shortfall: $54.6 billion (6th largest)
> Gov’t workers as share of total workforce: 16.3% (25th highest)
> Avg. annual payout per public retiree: $34,817 (5th highest)
> Governor: Jared Polis
[in-text-ad]

4. Connecticut
> Funded ratio: 45.7%
> Total pension shortfall: $34.8 billion (12th largest)
> Gov’t workers as share of total workforce: 14.0% (11th lowest)
> Avg. annual payout per public retiree: $39,856 (the highest)
> Governor: Ned Lamont
[recirclink id=510120]

3. Illinois
> Funded ratio: 38.4%
> Total pension shortfall: $136.9 billion (3rd largest)
> Gov’t workers as share of total workforce: 13.5% (7th lowest)
> Avg. annual payout per public retiree: $36,490 (2nd highest)
> Governor: J. B. Pritzker

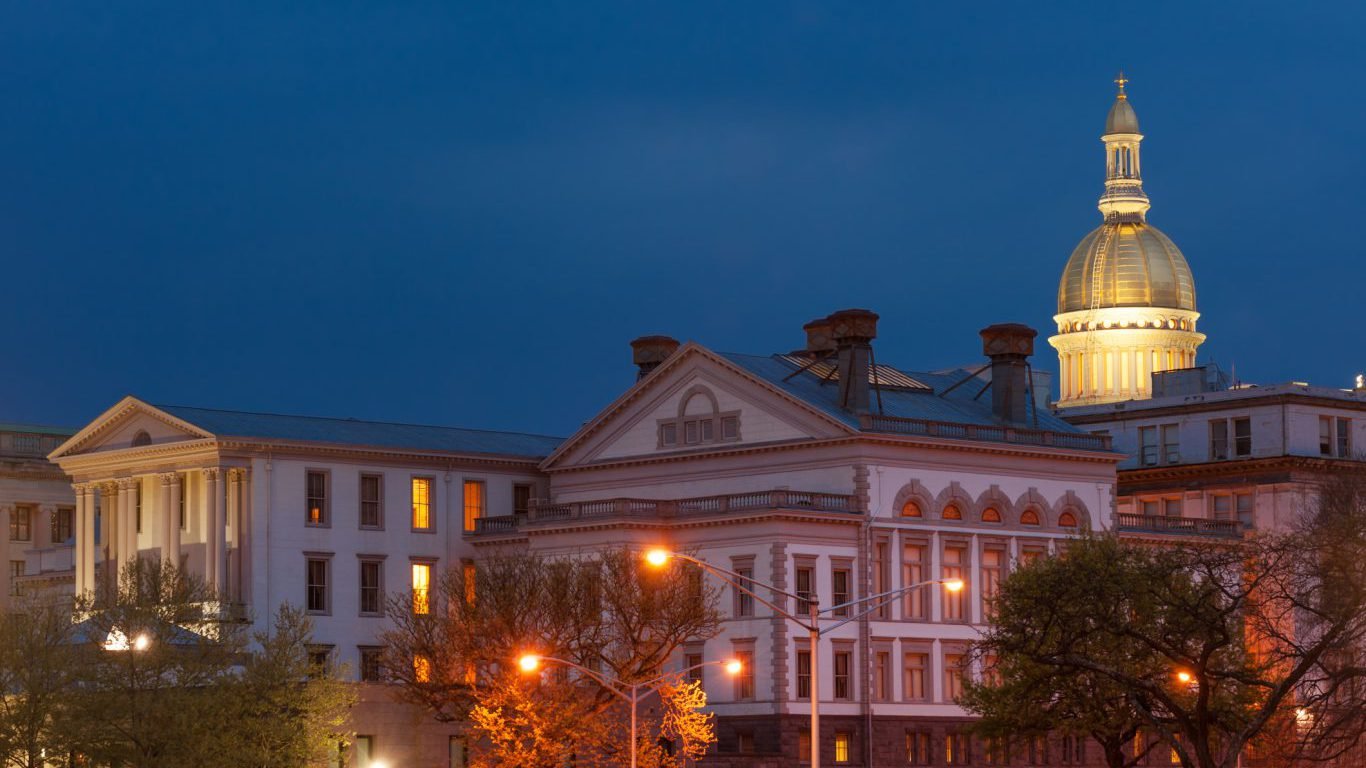
2. New Jersey
> Funded ratio: 35.8%
> Total pension shortfall: $142.3 billion (2nd largest)
> Gov’t workers as share of total workforce: 14.5% (16th lowest)
> Avg. annual payout per public retiree: $32,148 (9th highest)
> Governor: Phil Murphy
[in-text-ad-2]

1. Kentucky
> Funded ratio: 33.9%
> Total pension shortfall: $42.9 billion (7th largest)
> Gov’t workers as share of total workforce: 16.2% (25th lowest)
> Avg. annual payout per public retiree: $27,143 (13th highest)
> Governor: Matt Bevin
Detailed Findings
One of the primary drivers of pension shortfall is insufficient employer contributions. States have varying contribution policies that affect how much regional public employers are required to contribute to pension funds, but in hard economic times, states use the funds meant for pension contributions in hopes they could make up the difference in times of economic growth. States with responsible contribution policies tend to meet their contribution benchmarks, while states with worse policies often fail to meet them. In 2017, a year with strong economic growth, only 17 states met their employer contribution benchmarks.
Overgenerous benefits can also contribute to underfunded pensions. With greater benefits promised, pension obligations rise, leading states to either raise taxes or reduce services to meet them. In nine of the 10 states with the largest pension funding gaps, the average annual retirement benefits are greater than the $21,804 national average.
Historically, one of the largest drivers of pension funding shortfall has been poor market performance. While in 2017 the typical state pension plan had a 13.0% return on investment — greater than the median assumed return of 7.2% — in other years returns have fallen far below actuarial forecasts. In 2016, for example, the median rate of return on public pension plan funds was just 1.0%, far below the assumed rate of 7.5%.
Methodology
To rank the severity of each state’s pension crisis, 24/7 Wall St. reviewed the average pension funding ratio — the market value of a pension fund as a share of the total benefits owed to current or retired public employees — for all 50 states as of 2017 with data from nongovernmental organization The Pew Charitable Trusts. Data on the total pension shortfall also came from Pew and is for 2017. Data on the average annual benefits payout per public retiree came from the research nonprofit National Institute on Retirement Security and figures are for 2016. Data on the share of the workforce employed in state and local government is from the Bureau of Labor Statistics for 2018.
Contact [email protected] for any questions or corrections.