
Americans are about half as likely to pack up and move today than they were in the mid-1980s. A record low 9.8% of the U.S. population moved between 2018 and 2019, compared to 20.2% between 1984 and 1985.
Despite the steep decline, the 4.7 million Americans who moved to a different state in the last year contributed to some significant population population shifts. Using data from the U.S. Census Bureau, 24/7 Wall St. reviewed population change from mid-2018 to mid-2019 to identify America’s fastest growing and shrinking states.
In addition to net migration, population change is also a product of natural change, or the number of people who were born in a state less the number of people who died. In the majority of states, natural change drove population change more than migration.
The states that are growing the fastest tend to share some common characteristics that make them attractive to new residents and young families. One of them is a strong job market. Employment is of the most common reasons for Americans to move — and the fastest growing states are more likely to have added more jobs in the last year and have a low unemployment rate that the states with population declines. These are the cities that added the most jobs in the last five years.
Click here to see how every state’s population changed in the last year

50. West Virginia
> July 2018 – July 2019 pop. change: -0.7% (-12,144)
> Population, July 2019: 1.8 million (13th smallest)
> 2017-2018 employment change: +3,100 (+0.4% – 15th lowest)
> 2018 unemployment: 5.3% (2nd highest)
> 2018 median home value: $121,300 (the lowest)
[in-text-ad]
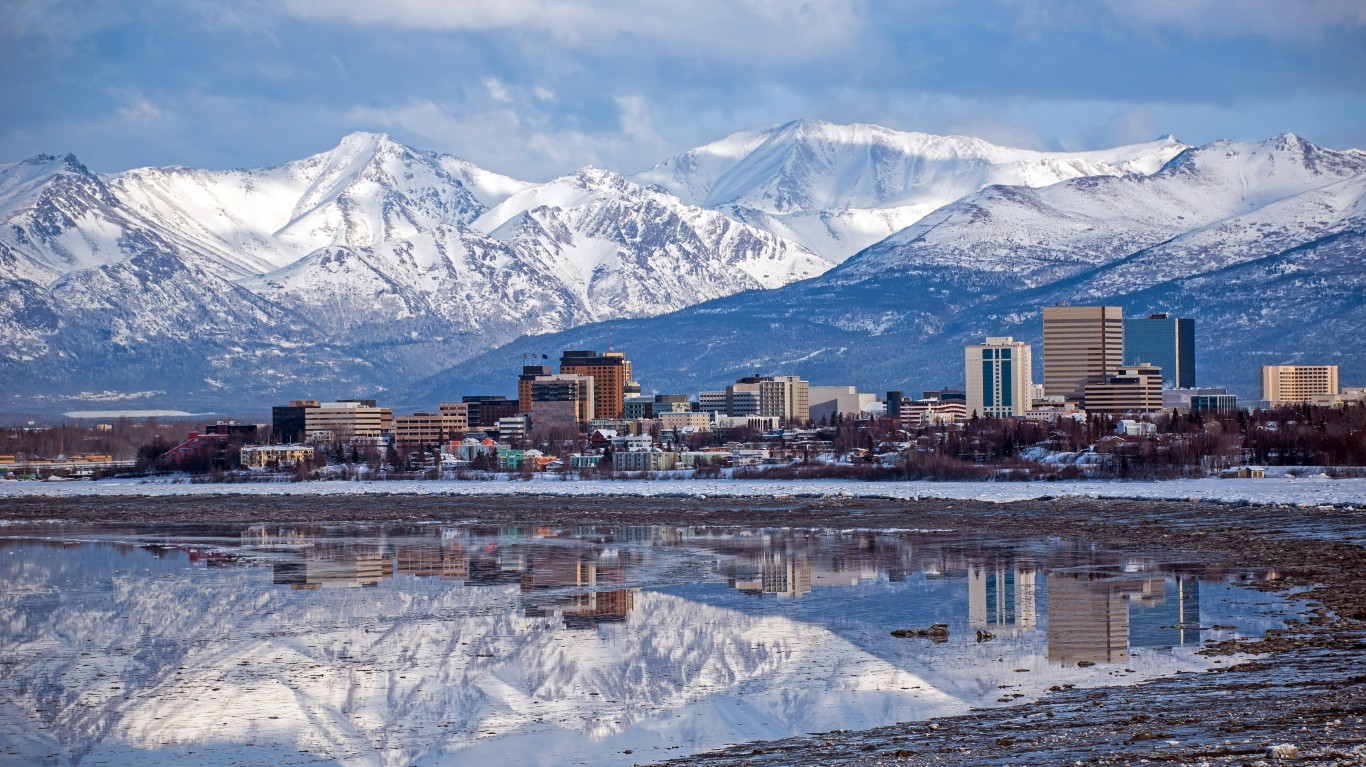
49. Alaska
> July 2018 – July 2019 pop. change: -0.5% (-3,594)
> Population, July 2019: 731,545 (3rd smallest)
> 2017-2018 employment change: -2,307 (-0.7% – 4th lowest)
> 2018 unemployment: 6.6% (the highest)
> 2018 median home value: $276,100 (14th highest)
[recirclink id=531165]

48. Illinois
> July 2018 – July 2019 pop. change: -0.4% (-51,250)
> Population, July 2019: 12.7 million (6th largest)
> 2017-2018 employment change: +20,773 (+0.3% – 14th lowest)
> 2018 unemployment: 4.3% (10th highest)
> 2018 median home value: $203,400 (25th highest)

47. New York
> July 2018 – July 2019 pop. change: -0.4% (-76,790)
> Population, July 2019: 19.5 million (4th largest)
> 2017-2018 employment change: +67,457 (+0.7% – 20th lowest)
> 2018 unemployment: 4.1% (15th highest)
> 2018 median home value: $325,500 (8th highest)
[in-text-ad-2]

46. Hawaii
> July 2018 – July 2019 pop. change: -0.3% (-4,721)
> Population, July 2019: 1.4 million (11th smallest)
> 2017-2018 employment change: -4,881 (-0.7% – 3rd lowest)
> 2018 unemployment: 2.4% (the lowest)
> 2018 median home value: $631,700 (the highest)

45. Louisiana
> July 2018 – July 2019 pop. change: -0.2% (-10,896)
> Population, July 2019: 4.6 million (25th largest)
> 2017-2018 employment change: +4,847 (+0.2% – 10th lowest)
> 2018 unemployment: 4.9% (3rd highest)
> 2018 median home value: $167,300 (14th lowest)
[in-text-ad]

44. Connecticut
> July 2018 – July 2019 pop. change: -0.2% (-6,233)
> Population, July 2019: 3.6 million (22nd smallest)
> 2017-2018 employment change: +19,564 (+1.1% – 23rd highest)
> 2018 unemployment: 4.1% (15th highest)
> 2018 median home value: $277,400 (13th highest)
[recirclink id=565375]

43. Mississippi
> July 2018 – July 2019 pop. change: -0.2% (-4,871)
> Population, July 2019: 3.0 million (17th smallest)
> 2017-2018 employment change: -306 (+0.0% – 6th lowest)
> 2018 unemployment: 4.8% (5th highest)
> 2018 median home value: $123,300 (2nd lowest)

42. Vermont
> July 2018 – July 2019 pop. change: -0.1% (-369)
> Population, July 2019: 623,989 (2nd smallest)
> 2017-2018 employment change: +983 (+0.3% – 12th lowest)
> 2018 unemployment: 2.7% (5th lowest)
> 2018 median home value: $233,100 (21st highest)
[in-text-ad-2]

41. New Jersey
> July 2018 – July 2019 pop. change: +0.0% (-3,835)
> Population, July 2019: 8.9 million (11th largest)
> 2017-2018 employment change: -7,968 (-0.2% – 5th lowest)
> 2018 unemployment: 4.1% (15th highest)
> 2018 median home value: $344,000 (6th highest)

40. Pennsylvania
> July 2018 – July 2019 pop. change: +0.0% (+1,067)
> Population, July 2019: 12.8 million (5th largest)
> 2017-2018 employment change: +38,081 (+0.6% – 18th lowest)
> 2018 unemployment: 4.3% (10th highest)
> 2018 median home value: $186,000 (21st lowest)
[in-text-ad]

39. Michigan
> July 2018 – July 2019 pop. change: +0.0% (+2,785)
> Population, July 2019: 10.0 million (10th largest)
> 2017-2018 employment change: +38,136 (+0.8% – 22nd lowest)
> 2018 unemployment: 4.1% (15th highest)
> 2018 median home value: $162,500 (12th lowest)
[recirclink id=562217]

38. Kansas
> July 2018 – July 2019 pop. change: +0.1% (+1,955)
> Population, July 2019: 2.9 million (16th smallest)
> 2017-2018 employment change: +7,663 (+0.5% – 17th lowest)
> 2018 unemployment: 3.4% (20th lowest)
> 2018 median home value: $159,400 (10th lowest)

37. Rhode Island
> July 2018 – July 2019 pop. change: +0.1% (+1,074)
> Population, July 2019: 1.1 million (7th smallest)
> 2017-2018 employment change: +3,919 (+0.7% – 21st lowest)
> 2018 unemployment: 4.1% (15th highest)
> 2018 median home value: $273,800 (15th highest)
[in-text-ad-2]

36. Ohio
> July 2018 – July 2019 pop. change: +0.1% (+12,759)
> Population, July 2019: 11.7 million (7th largest)
> 2017-2018 employment change: +8,445 (+0.2% – 9th lowest)
> 2018 unemployment: 4.6% (7th highest)
> 2018 median home value: $151,100 (8th lowest)

35. California
> July 2018 – July 2019 pop. change: +0.1% (+50,635)
> Population, July 2019: 39.5 million (the largest)
> 2017-2018 employment change: +297,310 (+1.6% – 14th highest)
> 2018 unemployment: 4.2% (13th highest)
> 2018 median home value: $546,800 (2nd highest)
[in-text-ad]

34. Massachusetts
> July 2018 – July 2019 pop. change: +0.1% (+9,868)
> Population, July 2019: 6.9 million (15th largest)
> 2017-2018 employment change: +121,364 (+3.4% – 3rd highest)
> 2018 unemployment: 3.3% (15th lowest)
> 2018 median home value: $400,700 (3rd highest)
[recirclink id=593079]

33. Kentucky
> July 2018 – July 2019 pop. change: +0.1% (+6,520)
> Population, July 2019: 4.5 million (25th smallest)
> 2017-2018 employment change: +19,280 (+1.0% – 24th highest)
> 2018 unemployment: 4.3% (10th highest)
> 2018 median home value: $148,100 (7th lowest)

32. Maryland
> July 2018 – July 2019 pop. change: +0.2% (+9,878)
> Population, July 2019: 6.0 million (19th largest)
> 2017-2018 employment change: +13,979 (+0.5% – 16th lowest)
> 2018 unemployment: 3.9% (21st highest)
> 2018 median home value: $324,800 (9th highest)
[in-text-ad-2]

31. New Mexico
> July 2018 – July 2019 pop. change: +0.2% (+4,088)
> Population, July 2019: 2.1 million (15th smallest)
> 2017-2018 employment change: +12,571 (+1.4% – 18th highest)
> 2018 unemployment: 4.9% (3rd highest)
> 2018 median home value: $174,700 (17th lowest)

30. Wyoming
> July 2018 – July 2019 pop. change: +0.2% (+1,158)
> Population, July 2019: 578,759 (the smallest)
> 2017-2018 employment change: -2,869 (-1.0% – 2nd lowest)
> 2018 unemployment: 4.1% (15th highest)
> 2018 median home value: $230,500 (24th highest)
[in-text-ad]

29. Iowa
> July 2018 – July 2019 pop. change: +0.2% (+6,452)
> Population, July 2019: 3.2 million (20th smallest)
> 2017-2018 employment change: +17,893 (+1.1% – 22nd highest)
> 2018 unemployment: 2.5% (3rd lowest)
> 2018 median home value: $152,000 (9th lowest)
[recirclink id=531165]

28. Missouri
> July 2018 – July 2019 pop. change: +0.3% (+15,805)
> Population, July 2019: 6.1 million (18th largest)
> 2017-2018 employment change: +8,468 (+0.3% – 11th lowest)
> 2018 unemployment: 3.2% (13th lowest)
> 2018 median home value: $162,600 (13th lowest)

27. Wisconsin
> July 2018 – July 2019 pop. change: +0.3% (+15,028)
> Population, July 2019: 5.8 million (20th largest)
> 2017-2018 employment change: +1,842 (+0.1% – 7th lowest)
> 2018 unemployment: 3.0% (11th lowest)
> 2018 median home value: $188,500 (22nd lowest)
[in-text-ad-2]

26. Arkansas
> July 2018 – July 2019 pop. change: +0.3% (+8,071)
> Population, July 2019: 3.0 million (18th smallest)
> 2017-2018 employment change: +3,807 (+0.3% – 13th lowest)
> 2018 unemployment: 3.7% (24th lowest)
> 2018 median home value: $133,100 (3rd lowest)

25. Alabama
> July 2018 – July 2019 pop. change: +0.3% (+15,504)
> Population, July 2019: 4.9 million (24th largest)
> 2017-2018 employment change: +30,671 (+1.5% – 17th highest)
> 2018 unemployment: 3.9% (21st highest)
> 2018 median home value: $147,900 (6th lowest)
[in-text-ad]

24. Maine
> July 2018 – July 2019 pop. change: +0.4% (+5,155)
> Population, July 2019: 1.3 million (9th smallest)
> 2017-2018 employment change: +471 (+0.1% – 8th lowest)
> 2018 unemployment: 3.4% (20th lowest)
> 2018 median home value: $197,500 (24th lowest)
[recirclink id=565375]

23. Virginia
> July 2018 – July 2019 pop. change: +0.4% (+34,233)
> Population, July 2019: 8.5 million (12th largest)
> 2017-2018 employment change: +52,669 (+1.3% – 19th highest)
> 2018 unemployment: 3.0% (11th lowest)
> 2018 median home value: $281,700 (12th highest)

22. Oklahoma
> July 2018 – July 2019 pop. change: +0.4% (+16,736)
> Population, July 2019: 4.0 million (23rd smallest)
> 2017-2018 employment change: +20,954 (+1.2% – 20th highest)
> 2018 unemployment: 3.4% (20th lowest)
> 2018 median home value: $140,000 (4th lowest)
[in-text-ad-2]

21. Nebraska
> July 2018 – July 2019 pop. change: +0.5% (+8,794)
> Population, July 2019: 1.9 million (14th smallest)
> 2017-2018 employment change: +9,246 (+0.9% – 25th lowest)
> 2018 unemployment: 2.8% (7th lowest)
> 2018 median home value: $161,800 (11th lowest)

20. New Hampshire
> July 2018 – July 2019 pop. change: +0.5% (+6,246)
> Population, July 2019: 1.4 million (10th smallest)
> 2017-2018 employment change: +8,527 (+1.2% – 21st highest)
> 2018 unemployment: 2.5% (3rd lowest)
> 2018 median home value: $270,000 (16th highest)
[in-text-ad]

19. North Dakota
> July 2018 – July 2019 pop. change: +0.5% (+3,982)
> Population, July 2019: 762062.0 (4th smallest)
> 2017-2018 employment change: -5,694 (-1.4% – the lowest)
> 2018 unemployment: 2.6% (4th lowest)
> 2018 median home value: $198,700 (25th lowest)
[recirclink id=562217]

18. Indiana
> July 2018 – July 2019 pop. change: +0.5% (+36,722)
> Population, July 2019: 6.7 million (17th largest)
> 2017-2018 employment change: +47,465 (+1.5% – 16th highest)
> 2018 unemployment: 3.4% (20th lowest)
> 2018 median home value: $147,300 (5th lowest)

17. Minnesota
> July 2018 – July 2019 pop. change: +0.6% (+33,383)
> Population, July 2019: 5.6 million (22nd largest)
> 2017-2018 employment change: +27,925 (+0.9% – 25th highest)
> 2018 unemployment: 2.9% (8th lowest)
> 2018 median home value: $235,400 (20th highest)
[in-text-ad-2]

16. South Dakota
> July 2018 – July 2019 pop. change: +0.7% (+5,961)
> Population, July 2019: 884,659 (5th smallest)
> 2017-2018 employment change: +4,045 (+0.9% – 24th lowest)
> 2018 unemployment: 3.0% (11th lowest)
> 2018 median home value: $171,500 (16th lowest)

15. Montana
> July 2018 – July 2019 pop. change: +0.8% (+8,113)
> Population, July 2019: 1.1 million (8th smallest)
> 2017-2018 employment change: +4,335 (+0.9% – 23rd lowest)
> 2018 unemployment: 3.7% (24th lowest)
> 2018 median home value: $249,200 (18th highest)
[in-text-ad]

14. Tennessee
> July 2018 – July 2019 pop. change: +0.8% (+57,543)
> Population, July 2019: 6.8 million (16th largest)
> 2017-2018 employment change: +61,407 (+2.0% – 8th highest)
> 2018 unemployment: 3.5% (21st lowest)
> 2018 median home value: $177,500 (18th lowest)
[recirclink id=593079]

13. Oregon
> July 2018 – July 2019 pop. change: +0.9% (+35,851)
> Population, July 2019: 4.2 million (24th smallest)
> 2017-2018 employment change: +12,575 (+0.6% – 19th lowest)
> 2018 unemployment: 4.2% (13th highest)
> 2018 median home value: $341,800 (7th highest)

12. Delaware
> July 2018 – July 2019 pop. change: +0.9% (+8,285)
> Population, July 2019: 973,764 (6th smallest)
> 2017-2018 employment change: +8,848 (+1.9% – 9th highest)
> 2018 unemployment: 3.8% (25th lowest)
> 2018 median home value: $255,300 (17th highest)
[in-text-ad-2]

11. Georgia
> July 2018 – July 2019 pop. change: +1.0% (+106,292)
> Population, July 2019: 10.6 million (8th largest)
> 2017-2018 employment change: +84,148 (+1.7% – 10th highest)
> 2018 unemployment: 3.9% (21st highest)
> 2018 median home value: $189,900 (23rd lowest)

10. North Carolina
> July 2018 – July 2019 pop. change: +1.0% (+106,469)
> Population, July 2019: 10.5 million (9th largest)
> 2017-2018 employment change: +70,094 (+1.5% – 15th highest)
> 2018 unemployment: 3.9% (21st highest)
> 2018 median home value: $180,600 (19th lowest)
[in-text-ad]

9. Florida
> July 2018 – July 2019 pop. change: +1.1% (+233,420)
> Population, July 2019: 21.5 million (3rd largest)
> 2017-2018 employment change: +200,445 (+2.1% – 7th highest)
> 2018 unemployment: 3.6% (22nd lowest)
> 2018 median home value: $230,600 (23rd highest)
[recirclink id=531165]

8. Colorado
> July 2018 – July 2019 pop. change: +1.2% (+67,449)
> Population, July 2019: 5.8 million (21st largest)
> 2017-2018 employment change: +83,673 (+2.9% – 5th highest)
> 2018 unemployment: 3.3% (15th lowest)
> 2018 median home value: $373,300 (4th highest)

7. Washington
> July 2018 – July 2019 pop. change: +1.2% (+91,024)
> Population, July 2019: 7.6 million (13th largest)
> 2017-2018 employment change: +78,634 (+1.6% – 12th highest)
> 2018 unemployment: 4.5% (9th highest)
> 2018 median home value: $373,100 (5th highest)
[in-text-ad-2]

6. South Carolina
> July 2018 – July 2019 pop. change: +1.3% (+64,558)
> Population, July 2019: 5.1 million (23rd largest)
> 2017-2018 employment change: +36,252 (+1.6% – 13th highest)
> 2018 unemployment: 3.4% (20th lowest)
> 2018 median home value: $170,800 (15th lowest)

5. Texas
> July 2018 – July 2019 pop. change: +1.3% (+367,215)
> Population, July 2019: 29.0 million (2nd largest)
> 2017-2018 employment change: +311,375 (+2.4% – 6th highest)
> 2018 unemployment: 3.9% (21st highest)
> 2018 median home value: $186,000 (21st lowest)
[in-text-ad]

4. Utah
> July 2018 – July 2019 pop. change: +1.7% (+52,408)
> Population, July 2019: 3.2 million (21st smallest)
> 2017-2018 employment change: +25,346 (+1.7% – 11th highest)
> 2018 unemployment: 3.1% (12th lowest)
> 2018 median home value: $303,300 (10th highest)
[recirclink id=565375]

3. Arizona
> July 2018 – July 2019 pop. change: +1.7% (+120,693)
> Population, July 2019: 7.3 million (14th largest)
> 2017-2018 employment change: +108,423 (+3.4% – the highest)
> 2018 unemployment: 4.8% (5th highest)
> 2018 median home value: $241,100 (19th highest)

2. Nevada
> July 2018 – July 2019 pop. change: +1.7% (+52,815)
> Population, July 2019: 3.1 million (19th smallest)
> 2017-2018 employment change: +47,354 (+3.4% – 2nd highest)
> 2018 unemployment: 4.6% (7th highest)
> 2018 median home value: $292,200 (11th highest)
[in-text-ad-2]

1. Idaho
> July 2018 – July 2019 pop. change: +2.1% (+36,529)
> Population, July 2019: 1.8 million (12th smallest)
> 2017-2018 employment change: +24,913 (+3.1% – 4th highest)
> 2018 unemployment: 2.8% (7th lowest)
> 2018 median home value: $233,100 (21st highest)
Contact [email protected] for any questions or corrections.