The majority of colleges and universities in the U.S. admit most of the students who apply each year. There are many institutions, however, that are highly selective, admitting only a small share of those who apply.
24/7 Wall St. reviewed admissions data across thousands of four-year, degree-granting institutions from the National Center for Education Statistics to determine each state’s most selective college. Our index was based on admission rates as well as SAT scores of admitted students to measure the difficulty of being accepted to those universities and colleges.
In many states, the hardest colleges to get into receive tens of thousands of applications and accept only a fraction of them. These include institutions like Harvard, which admitted less than 1 in 20 of the applicants for the 2018-2019 school year. Such colleges are able to rely on their reputation and prestige to attract students and be highly selective. Schools like these also tend to charge more in tuition and board. This is the most expensive colleges in every state.
In other states, there are far fewer colleges and universities, and in some of these states, admission rates for even the most selective school exceed 50%. In these schools, the test scores for admitted students also tend to be lower. Still, in all but a handful of schools on this list, the median SAT score of admitted students exceeds the national average score of 1060.
The most highly selective institutions by state appear to deserve their high number of applicants, at least based on the income potential of their graduates. The median earnings for students at the schools on this list exceeds that of the vast majority of schools in nearly every case. Over a dozen have median earnings 10 years after matriculation in excess of $70,000. In the majority of colleges and universities, that figure is less than $33,000. These are the most affordable colleges with the best outcomes in every state.
Click here to see the hardest colleges to get into by state.
Click here to see our methodology.
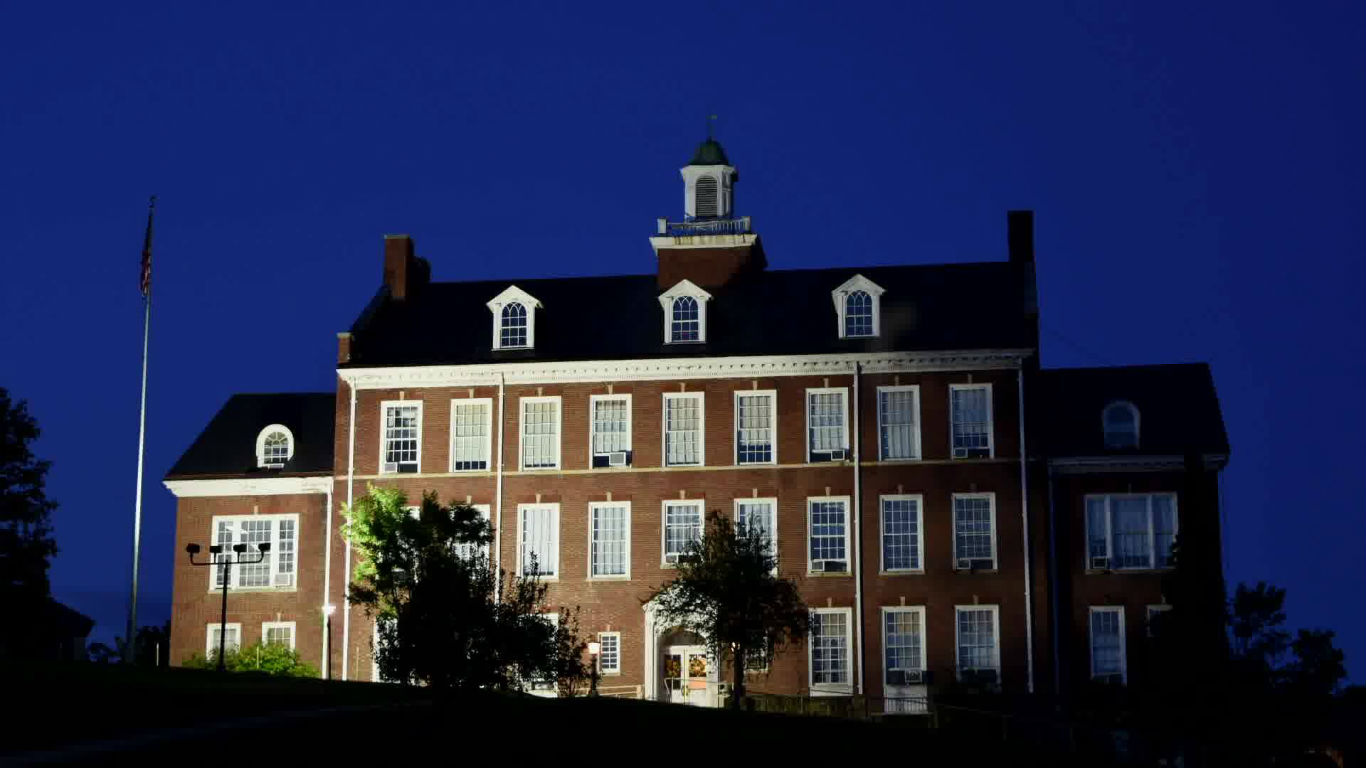
Alabama: Birmingham Southern College
> Location: Birmingham
> Admission rate for 2018-2019: 56.7%
> Applicants for 2018-2019: 3,636
> Undergraduates in 2018: 1,268
> Median SAT score: 1145 out of 1600
> Annual net cost of attendance: $50,440
[in-text-ad]
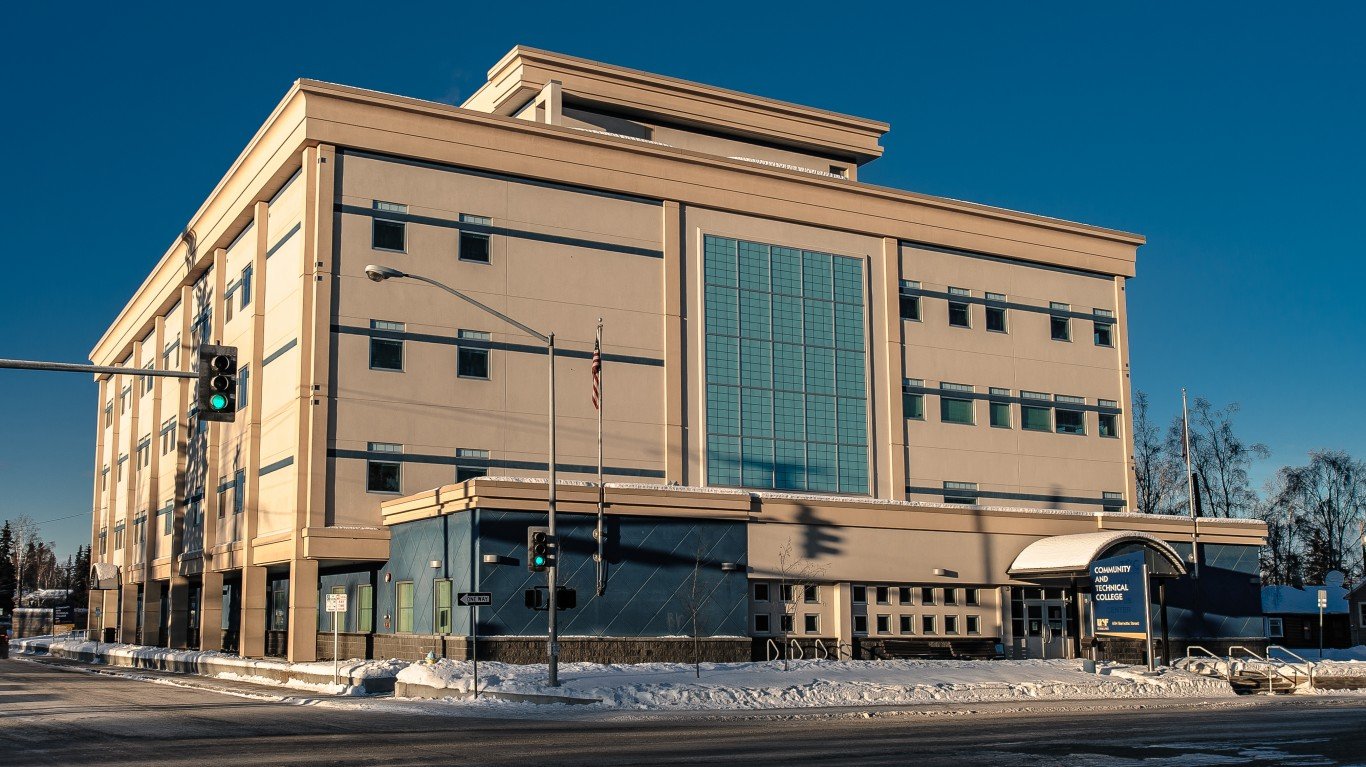
Alaska: University of Alaska Fairbanks
> Location: Fairbanks
> Admission rate for 2018-2019: 76.1%
> Applicants for 2018-2019: 1,683
> Undergraduates in fall 2018: 6,429
> Median SAT score: 1150 out of 1600
> Annual net cost of attendance: $17,168
[recirclink id=587850]
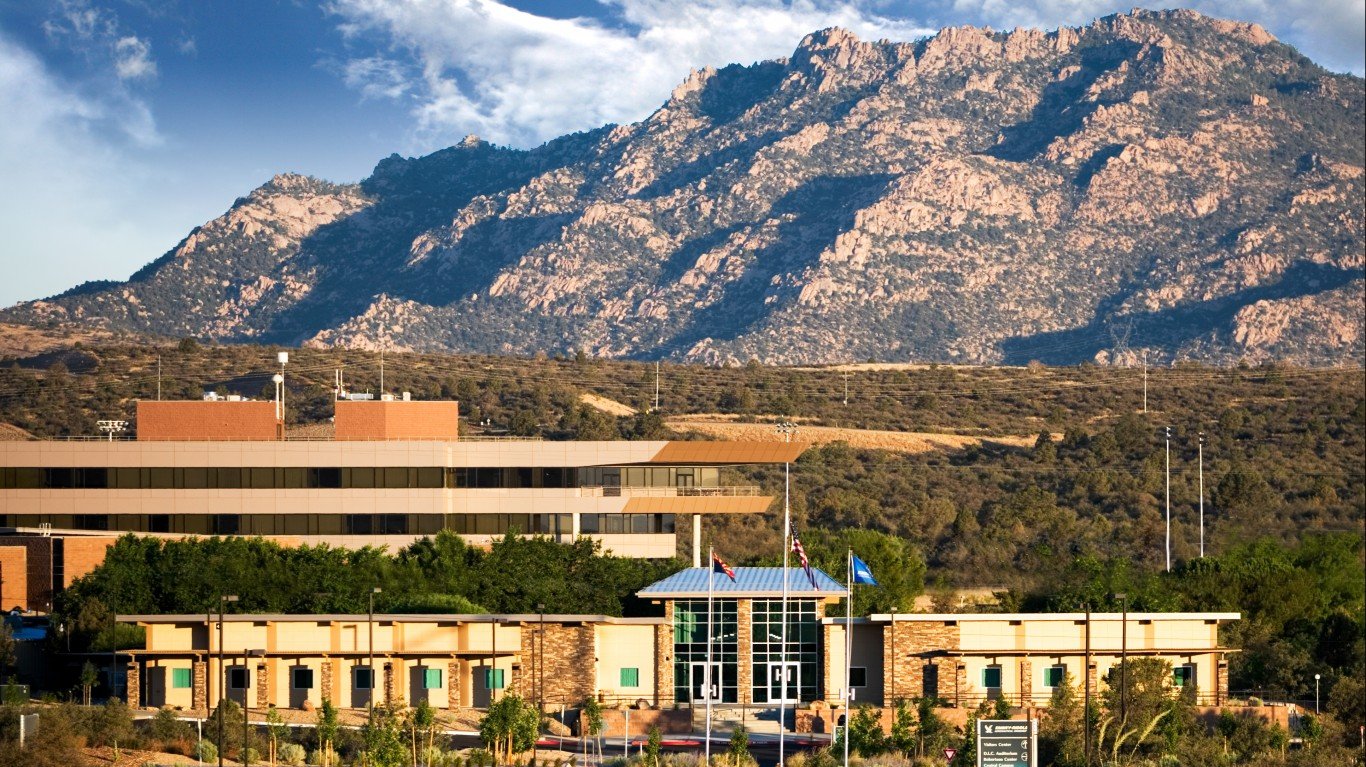
Arizona: Embry-Riddle Aeronautical University-Prescott
> Location: Prescott
> Admission rate for 2018-2019: 67.2%
> Applicants for 2018-2019: 2,859
> Undergraduates in fall 2018: 2,726
> Median SAT score: 1240 out of 1600
> Annual net cost of attendance: $49,912
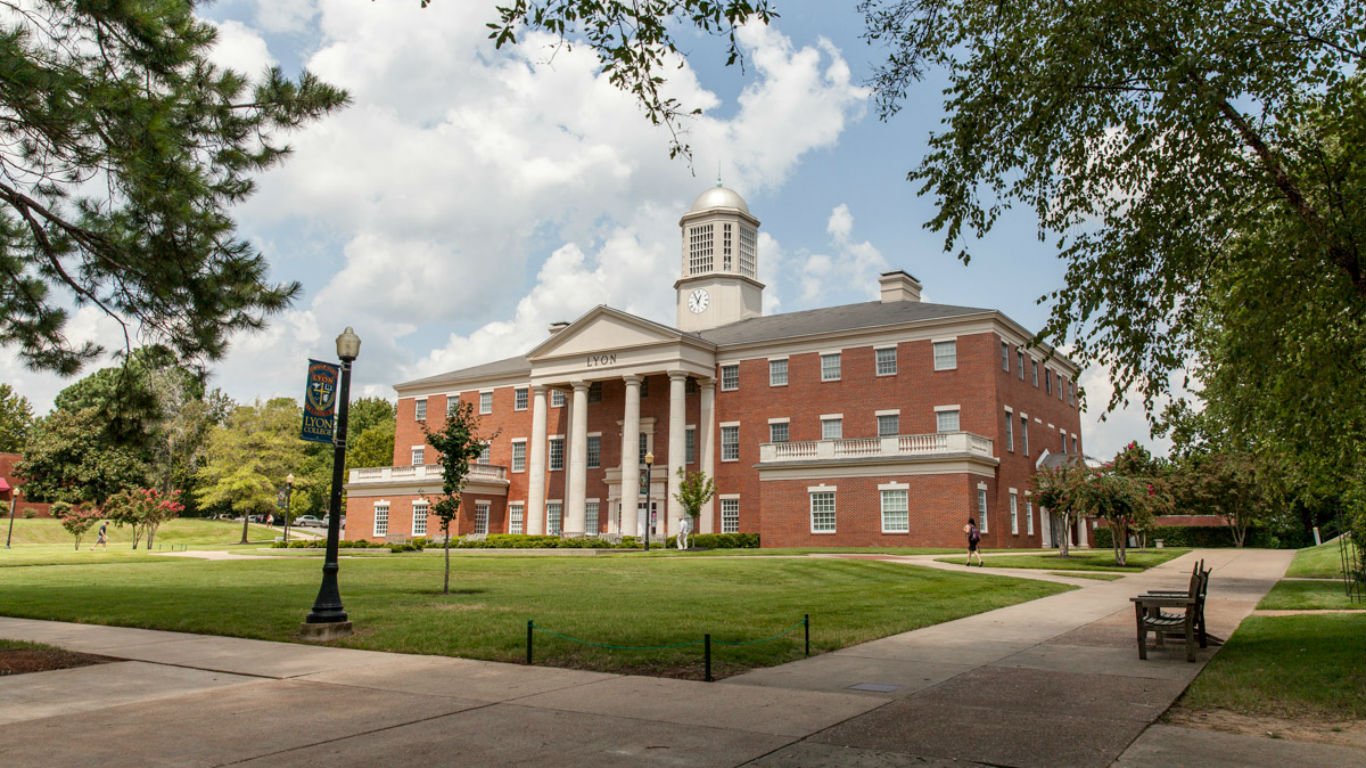
Arkansas: Lyon College
> Location: Batesville
> Admission rate for 2018-2019: 49.9%
> Applicants for 2018-2019: 1,741
> Undergraduates in fall 2018: 655
> Median SAT score: 1132 out of 1600
> Annual net cost of attendance: $37,377
[in-text-ad-2]
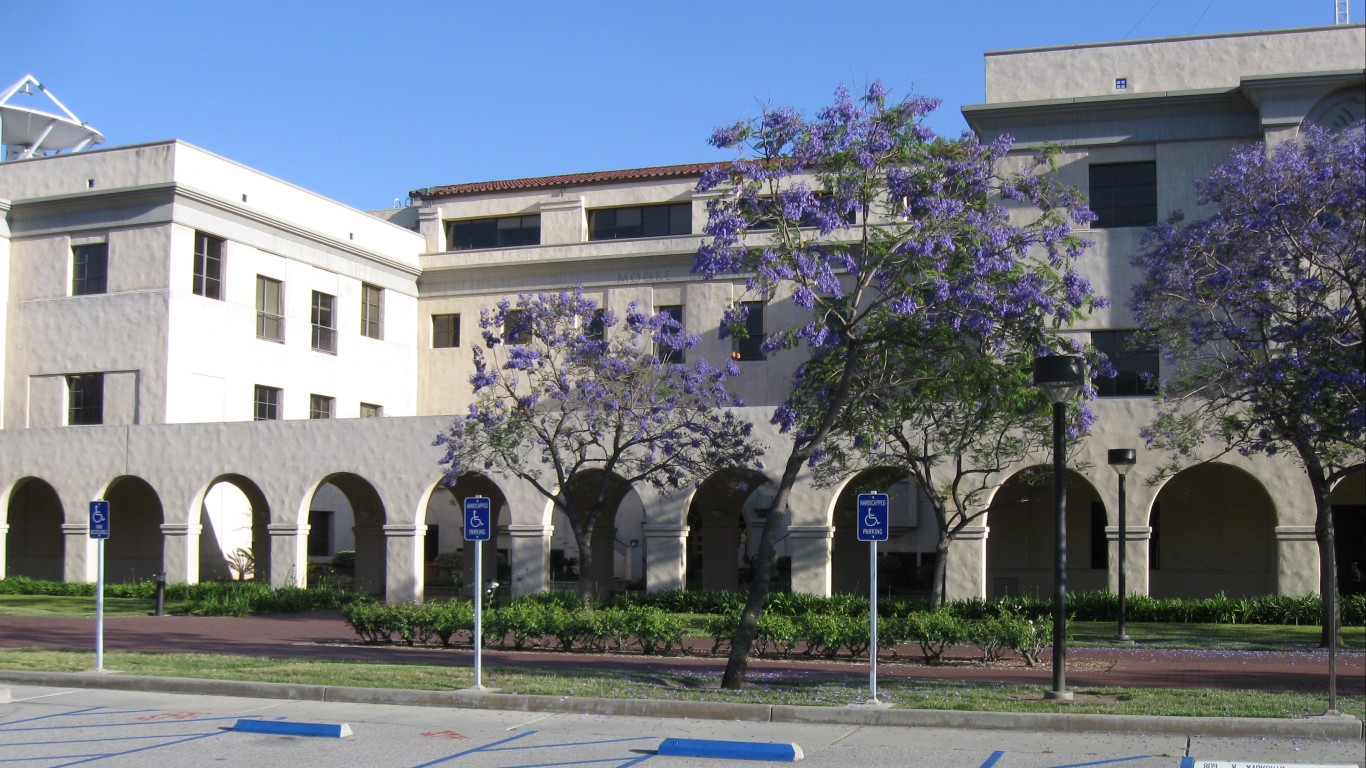
California: California Institute of Technology
> Location: Pasadena
> Admission rate for 2018-2019: 6.6%
> Applicants for 2018-2019: 8,208
> Undergraduates in fall 2018: 948
> Median SAT score: 1560 out of 1600
> Annual net cost of attendance: $65,874

Colorado: United States Air Force Academy
> Location: USAF Academy
> Admission rate for 2018-2019: 11.4%
> Applicants for 2018-2019: 10,376
> Undergraduates in fall 2018: 4,336
> Median SAT score: 1300 out of 1600
> Annual net cost of attendance: N/A
[in-text-ad]
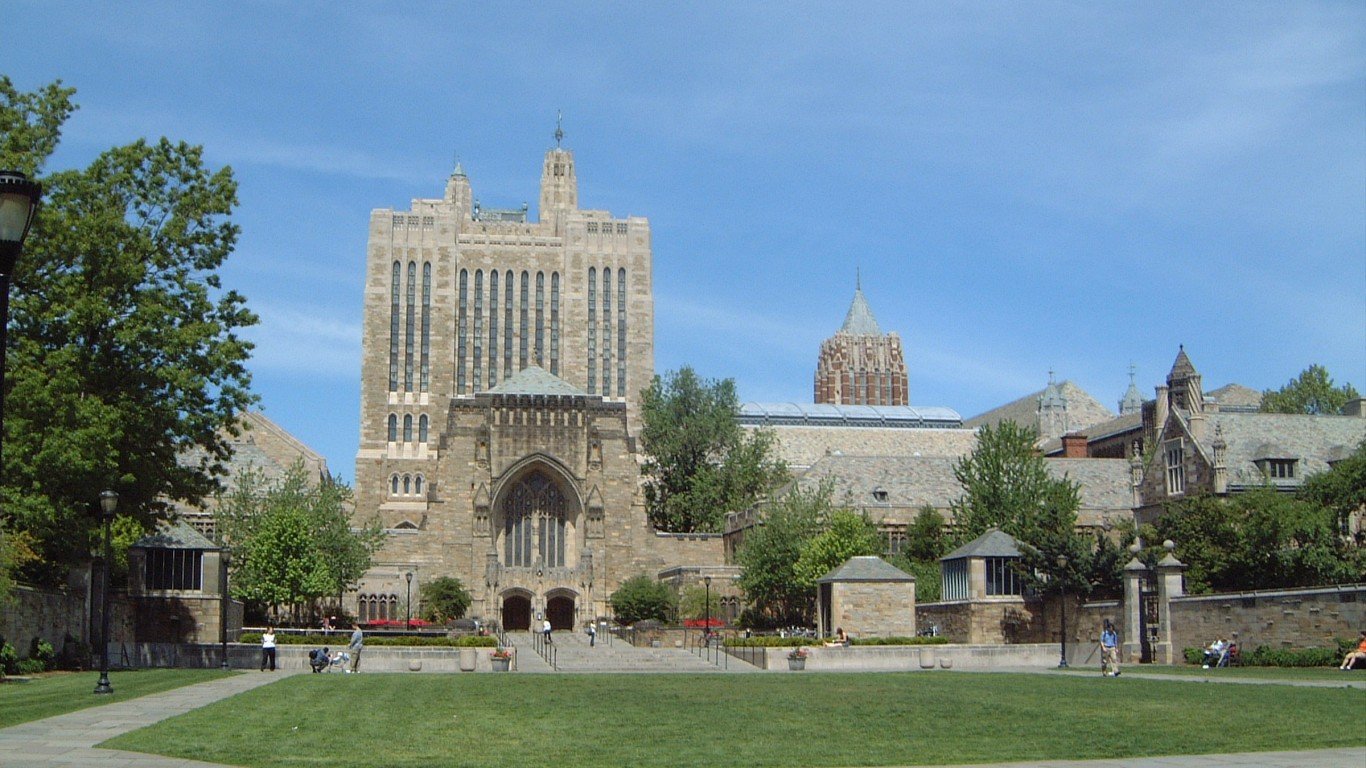
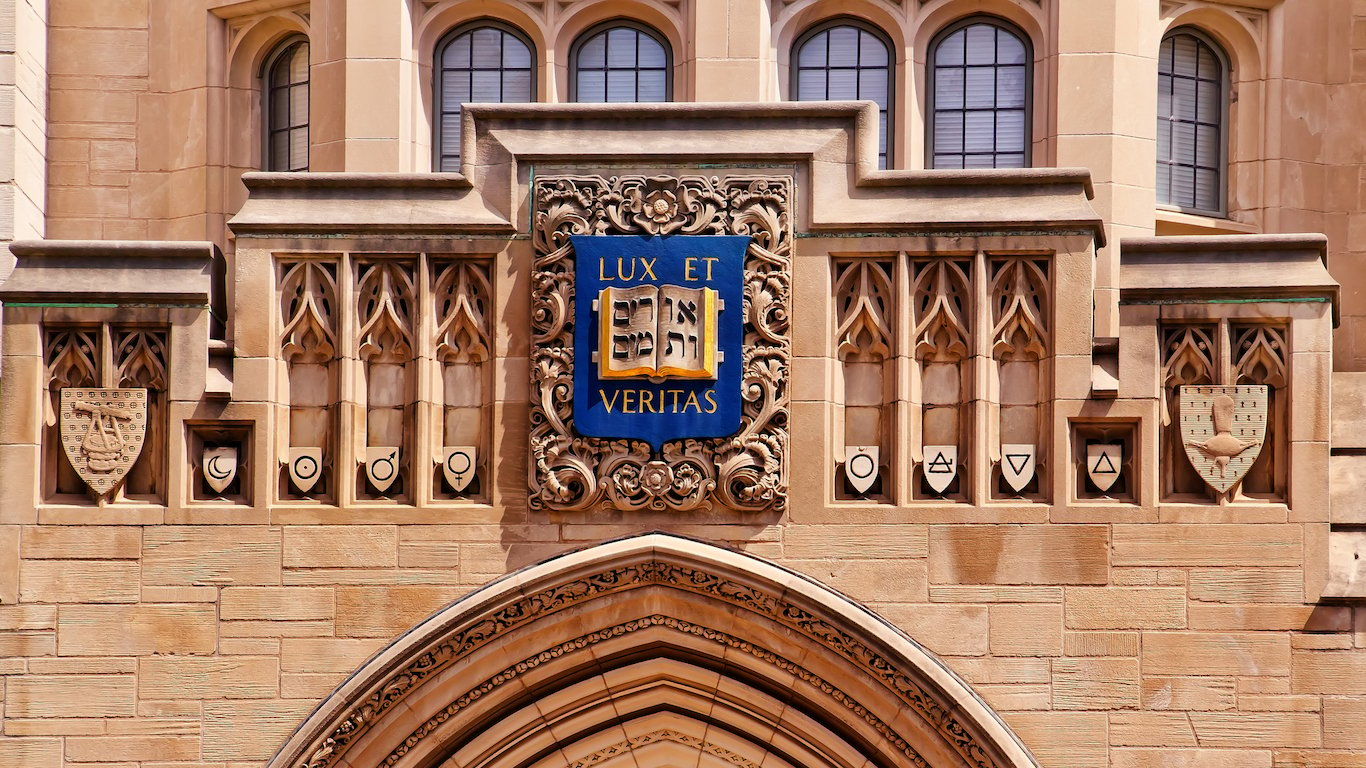
Connecticut: Yale University
> Location: New Haven
> Admission rate for 2018-2019: 6.3%
> Applicants for 2018-2019: 35,301
> Undergraduates in fall 2018: 5,964
> Median SAT score: 1520 out of 1600
> Annual net cost of attendance: $68,950
[recirclink id=636794]
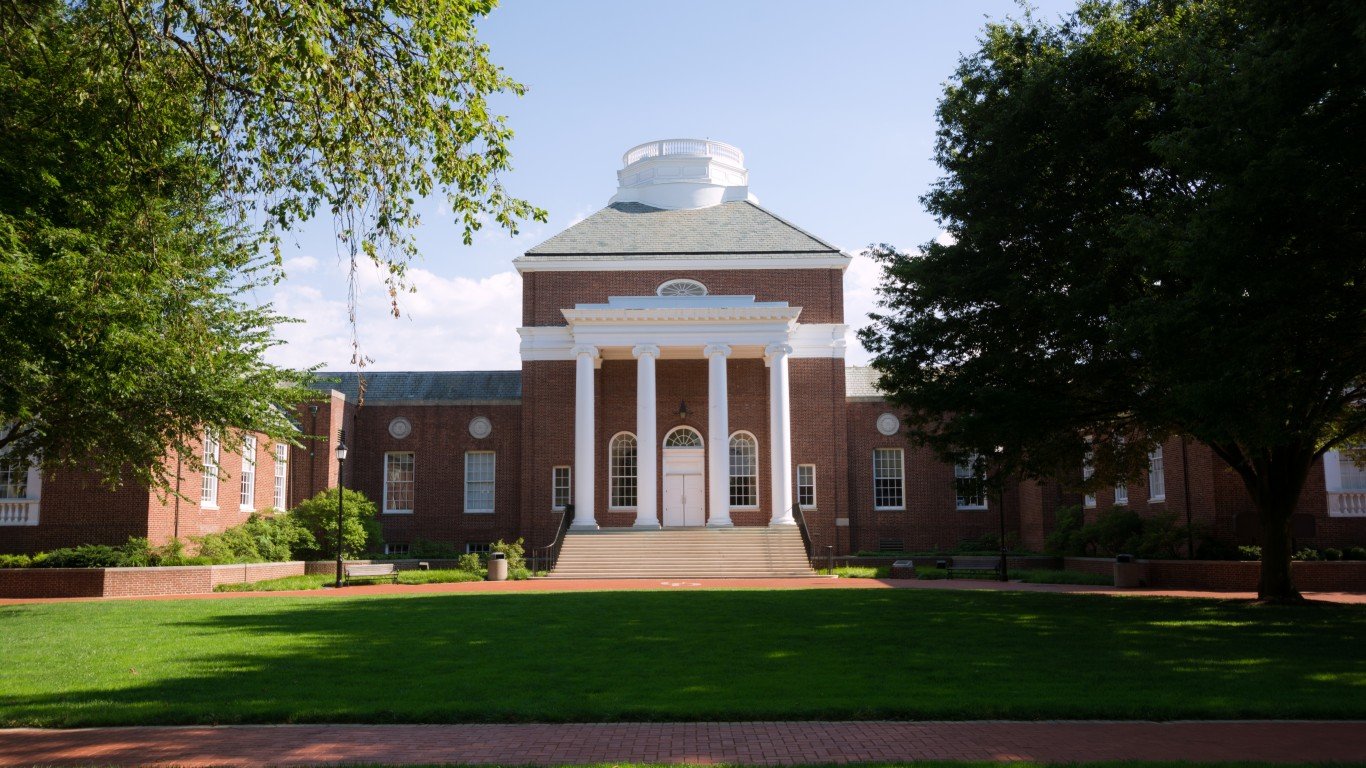
Delaware: University of Delaware
> Location: Newark
> Admission rate for 2018-2019: 66.4%
> Applicants for 2018-2019: 27,691
> Undergraduates in fall 2018: 19,956
> Median SAT score: 1230 out of 1600
> Annual net cost of attendance: $25,210
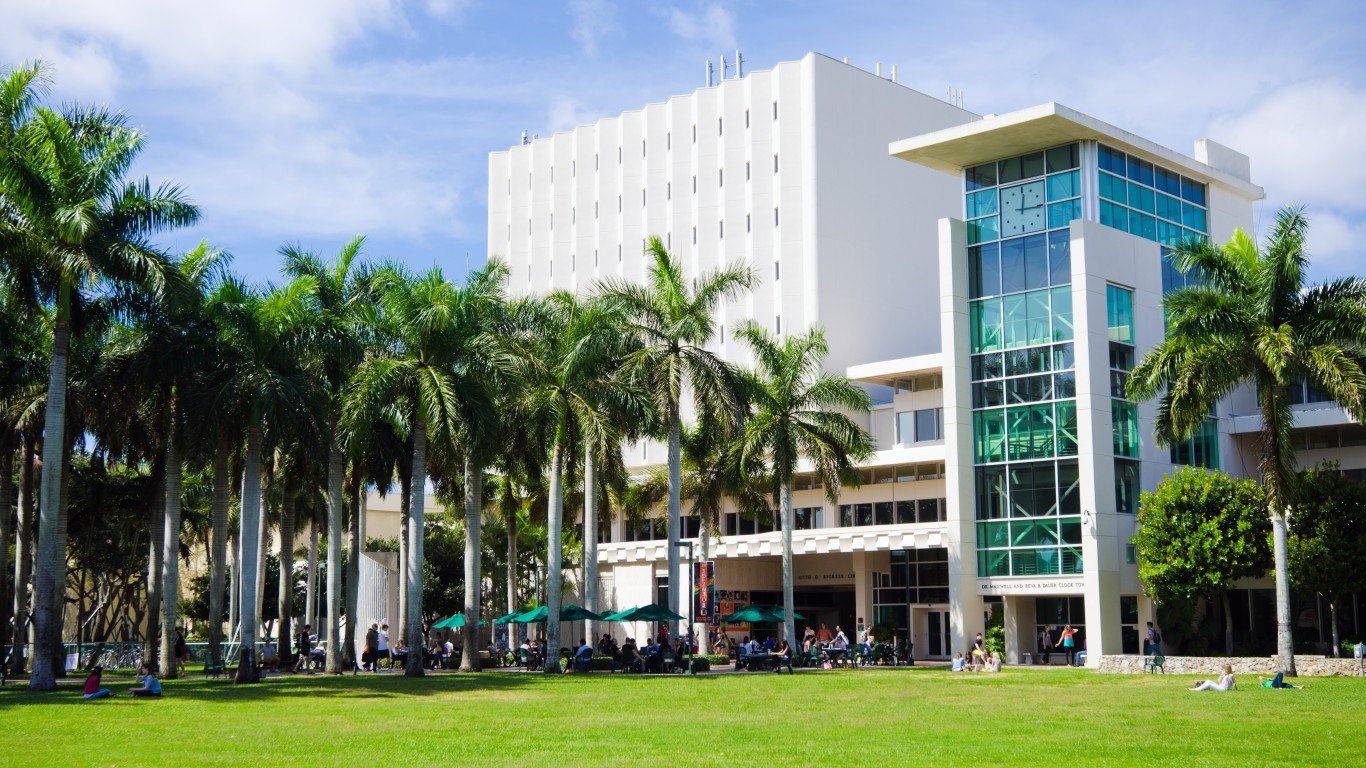
Florida: University of Miami
> Location: Coral Gables
> Admission rate for 2018-2019: 32.1%
> Applicants for 2018-2019: 34,281
> Undergraduates in fall 2018: 11,117
> Median SAT score: 1325 out of 1600
> Annual net cost of attendance: $62,810
[in-text-ad-2]

Georgia: Emory University
> Location: Atlanta
> Admission rate for 2018-2019: 18.5%
> Applicants for 2018-2019: 27,559
> Undergraduates in fall 2018: 7,086
> Median SAT score: 1435 out of 1600
> Annual net cost of attendance: $65,080
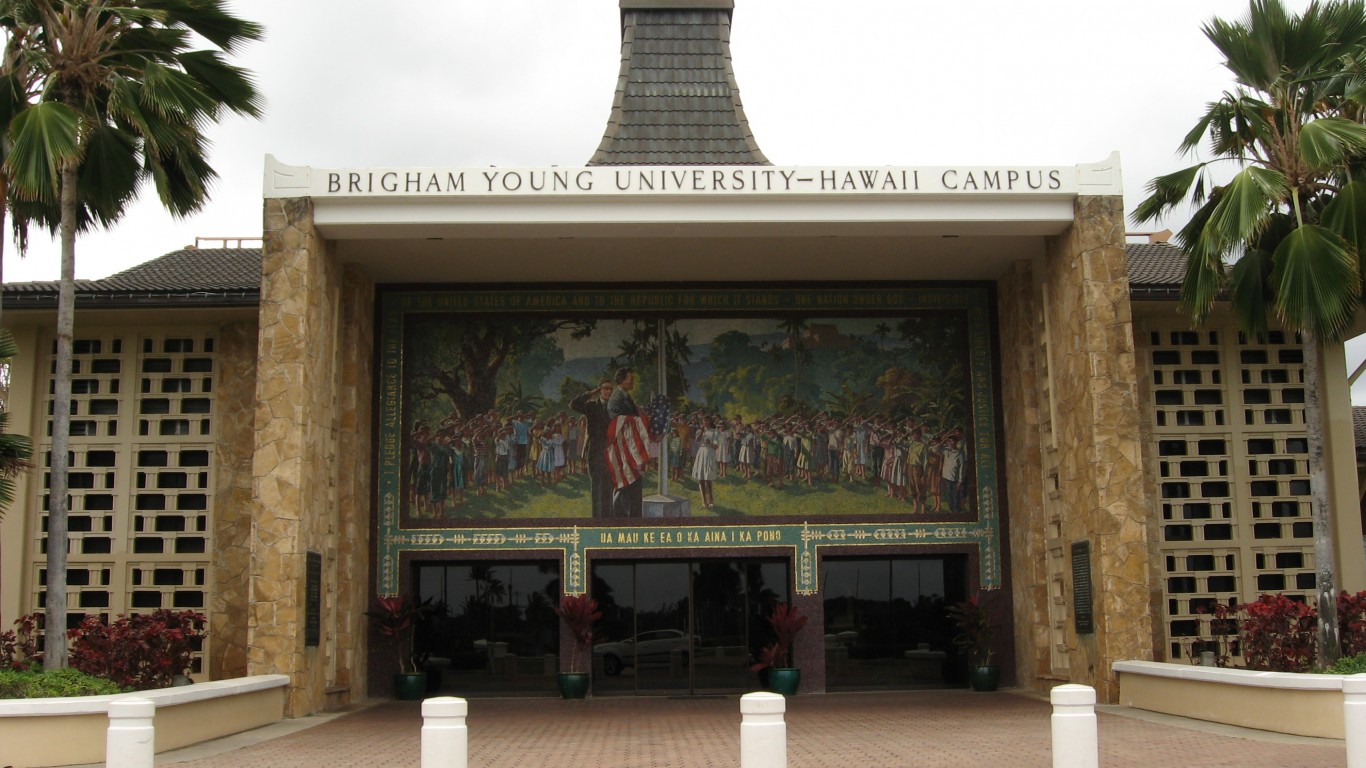
Hawaii: Brigham Young University-Hawaii
> Location: Laie
> Admission rate for 2018-2019: 44.8%
> Applicants for 2018-2019: 2,970
> Undergraduates in fall 2018: 3,176
> Median SAT score: 1172 out of 1600
> Annual net cost of attendance: $17,178
[in-text-ad]
Idaho: Northwest Nazarene University
> Location: Nampa
> Admission rate for 2018-2019: 70.9%
> Applicants for 2018-2019: 1,046
> Undergraduates in fall 2018: 1,483
> Median SAT score: 1130 out of 1600
> Annual net cost of attendance: $38,203
[recirclink id=590260]

Illinois: University of Chicago
> Location: Chicago
> Admission rate for 2018-2019: 7.3%
> Applicants for 2018-2019: 32,283
> Undergraduates in fall 2018: 6,632
> Median SAT score: 1530 out of 1600
> Annual net cost of attendance: $72,717
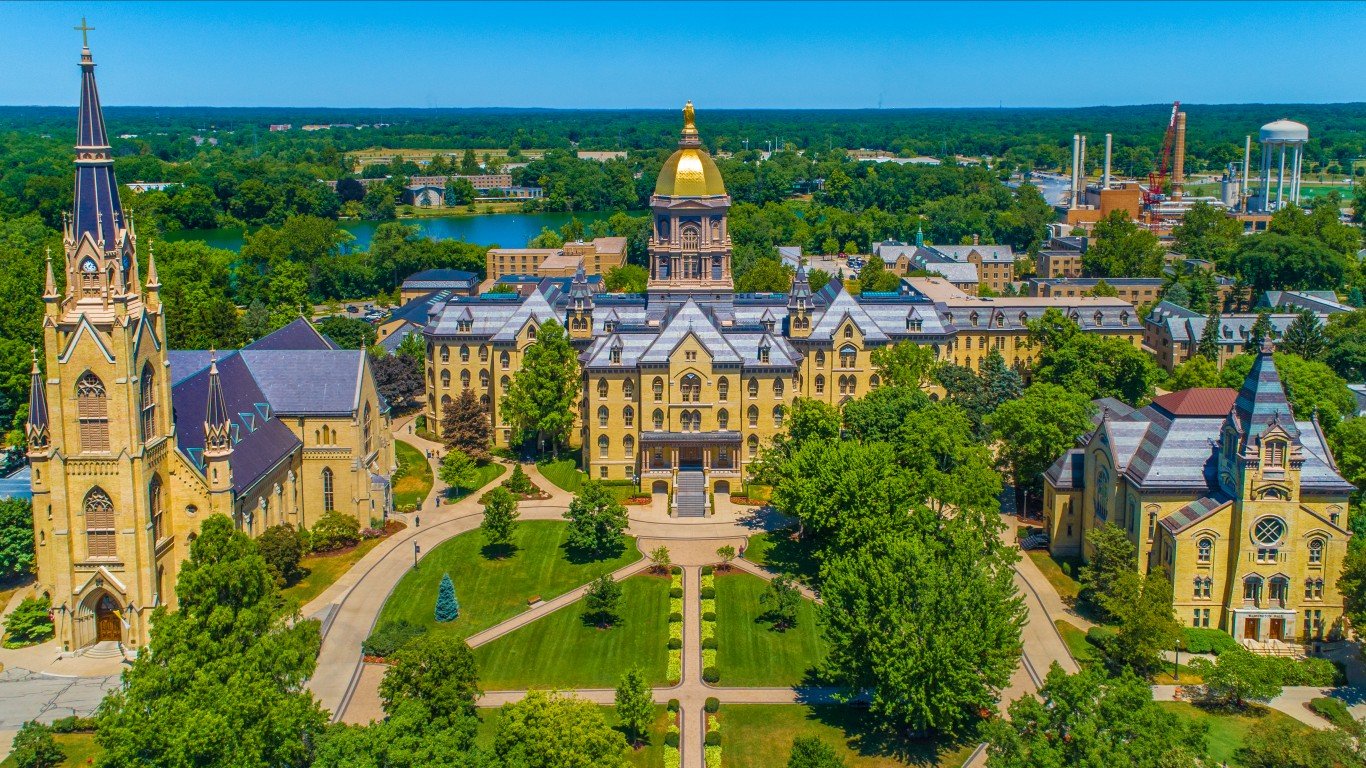
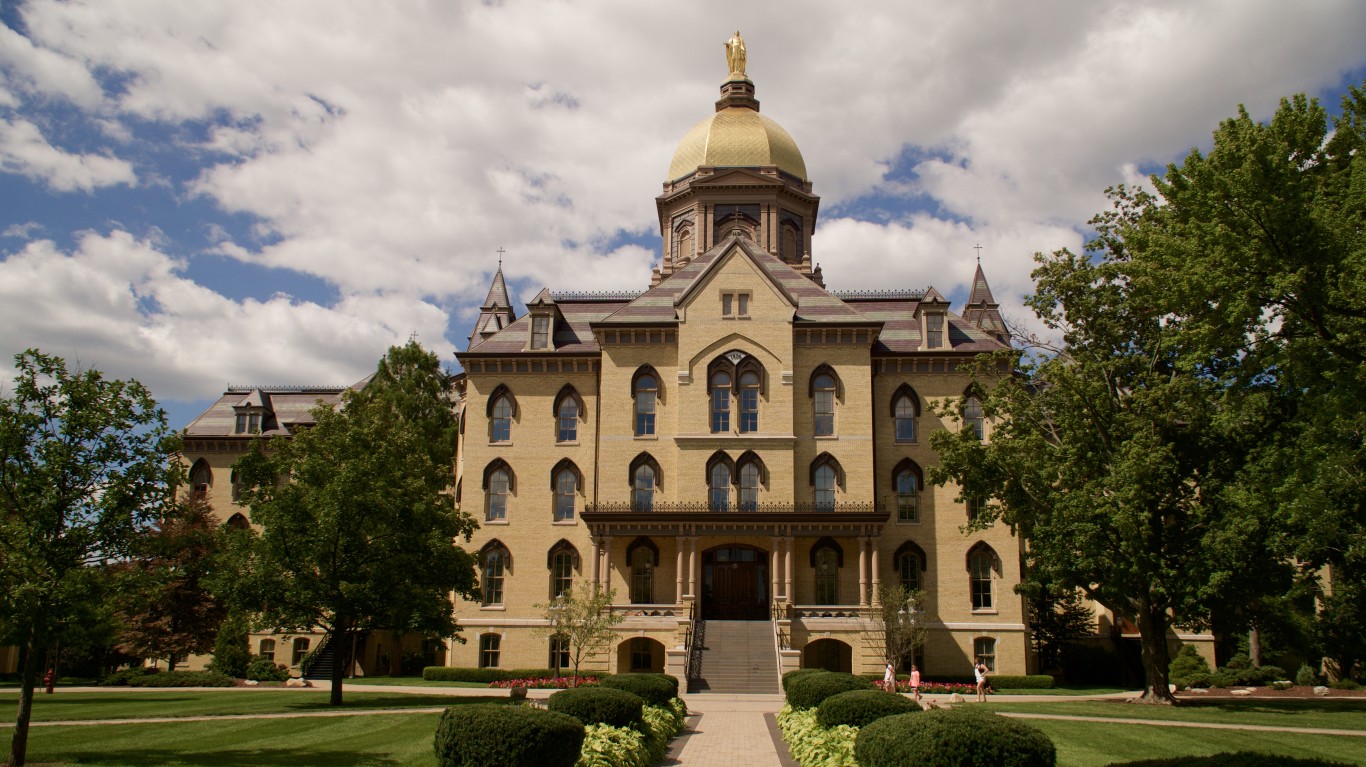
Indiana: University of Notre Dame
> Location: Notre Dame
> Admission rate for 2018-2019: 17.7%
> Applicants for 2018-2019: 20,371
> Undergraduates in fall 2018: 8,617
> Median SAT score: 1445 out of 1600
> Annual net cost of attendance: $67,043
[in-text-ad-2]

Iowa: Grinnell College
> Location: Grinnell
> Admission rate for 2018-2019: 24.4%
> Applicants for 2018-2019: 7,349
> Undergraduates in fall 2018: 1,716
> Median SAT score: 1410 out of 1600
> Annual net cost of attendance: $63,438
Kansas: Sterling College
> Location: Sterling
> Admission rate for 2018-2019: 40.5%
> Applicants for 2018-2019: 1,587
> Undergraduates in fall 2018: 648
> Median SAT score: 985 out of 1600
> Annual net cost of attendance: $35,102
[in-text-ad]
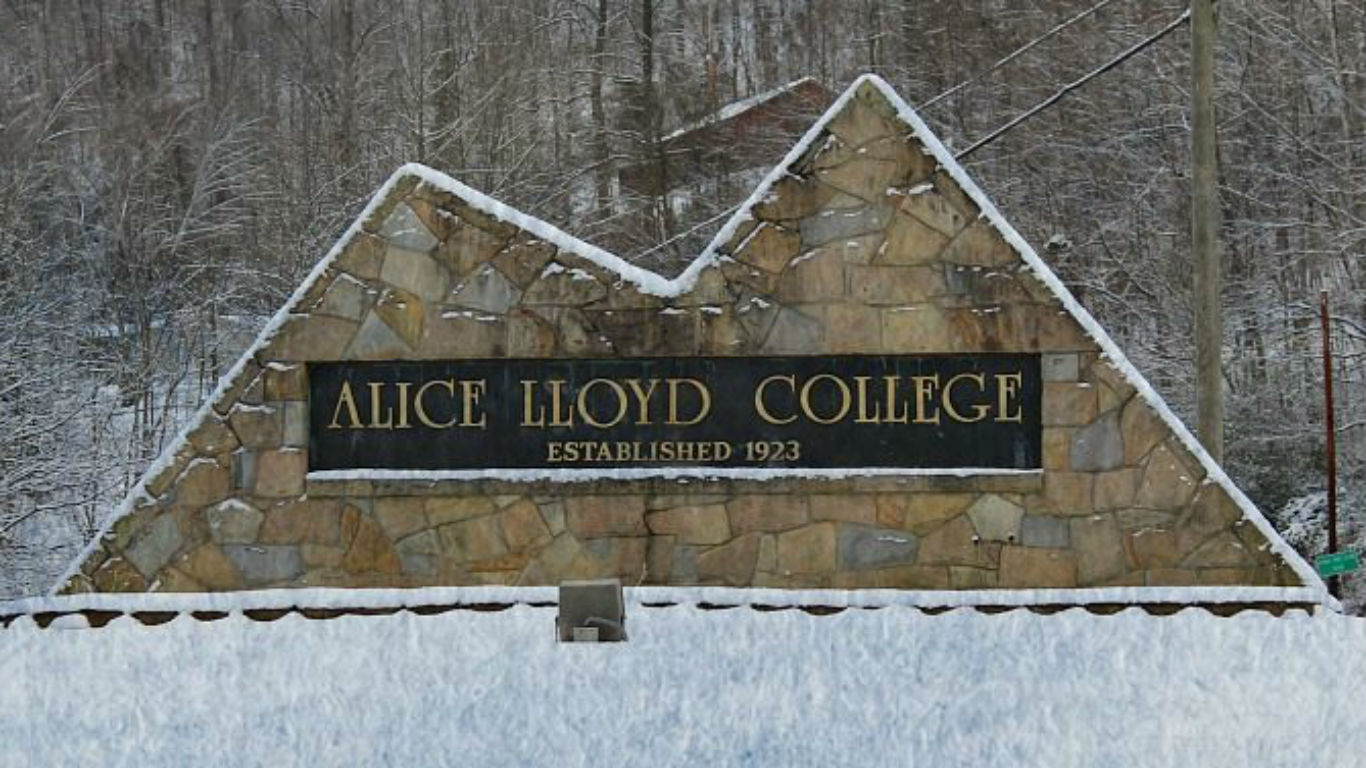
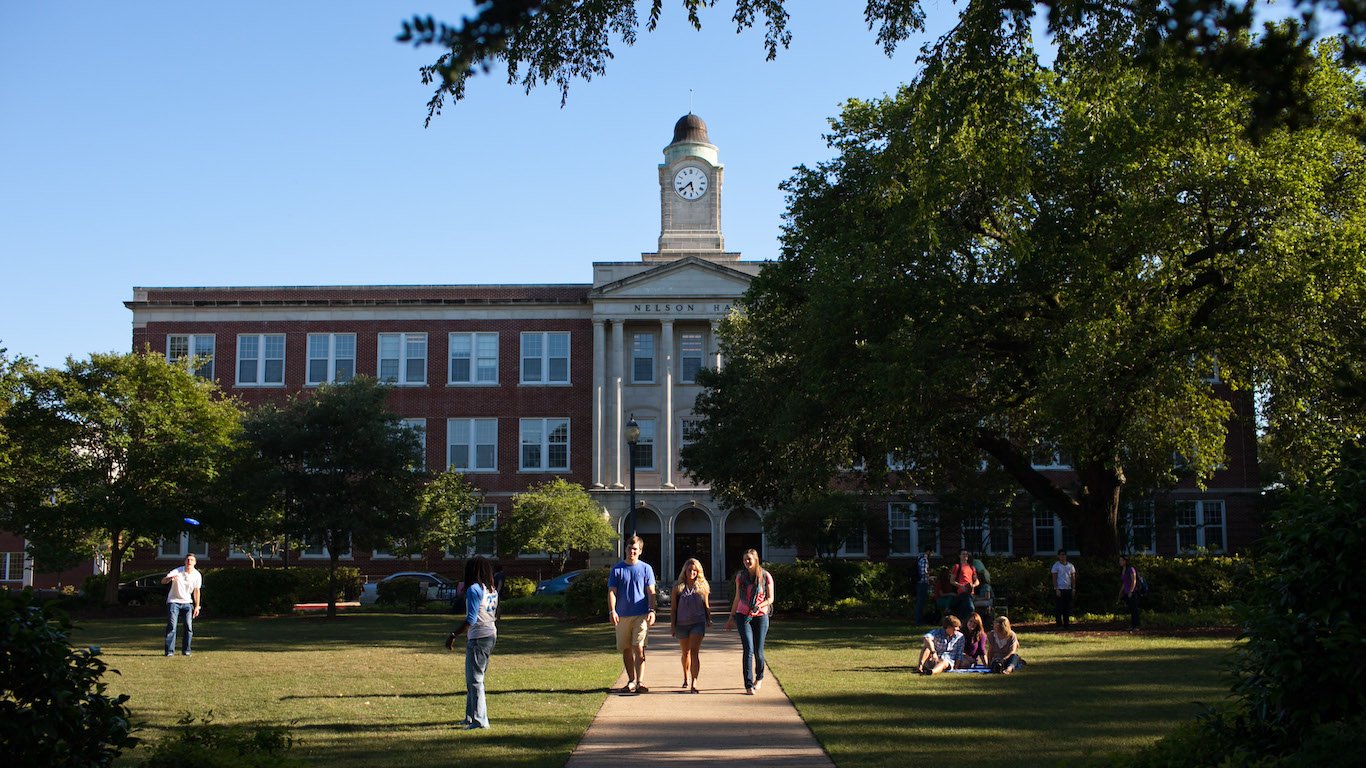
Kentucky: Alice Lloyd College
> Location: Pippa Passes
> Admission rate for 2018-2019: 27.8%
> Applicants for 2018-2019: 4,720
> Undergraduates in fall 2018: 644
> Median SAT score: 985 out of 1600
> Annual net cost of attendance: $23,827
[recirclink id=600755]
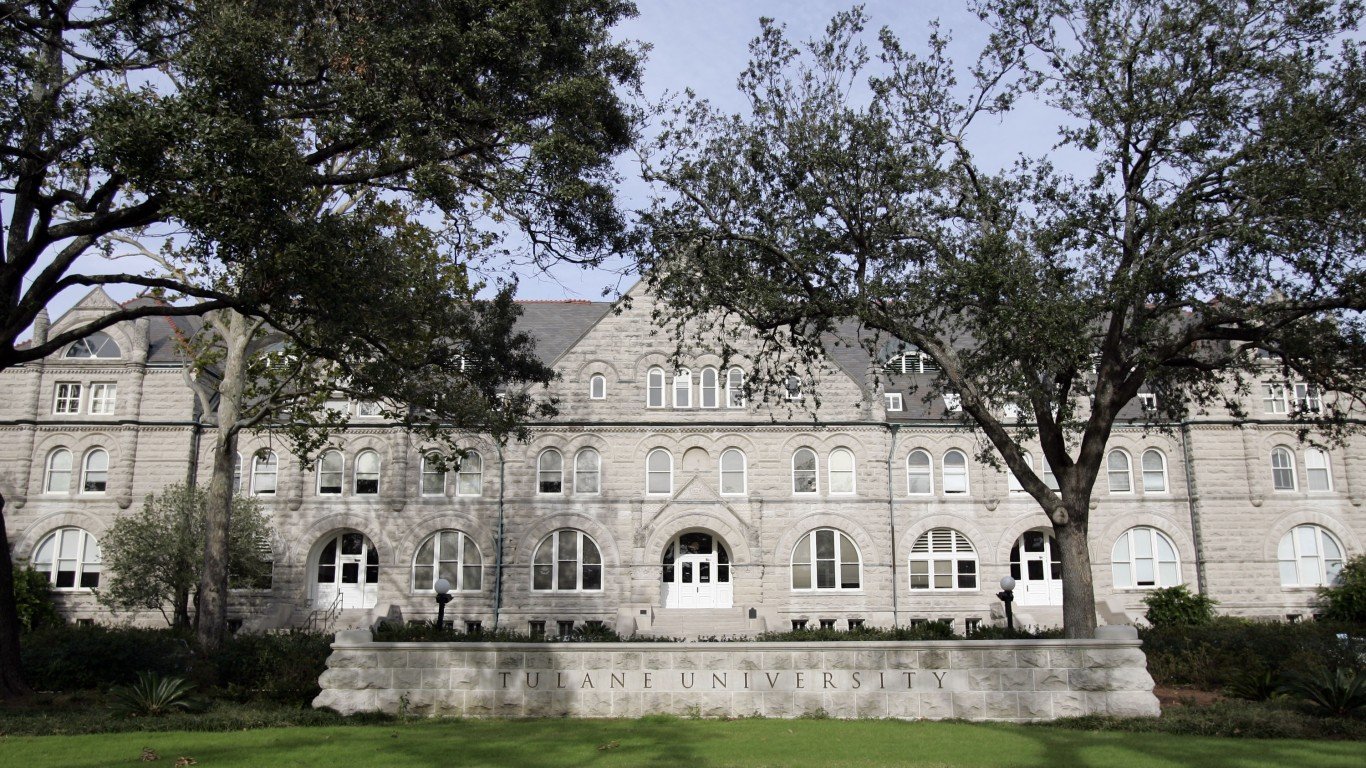
Louisiana: Tulane University of Louisiana
> Location: New Orleans
> Admission rate for 2018-2019: 17.3%
> Applicants for 2018-2019: 38,816
> Undergraduates in fall 2018: 7,920
> Median SAT score: 1410 out of 1600
> Annual net cost of attendance: $66,896

Maine: Colby College
> Location: Waterville
> Admission rate for 2018-2019: 13.1%
> Applicants for 2018-2019: 12,313
> Undergraduates in fall 2018: 2,000
> Median SAT score: 1420 out of 1600
> Annual net cost of attendance: $65,824
[in-text-ad-2]
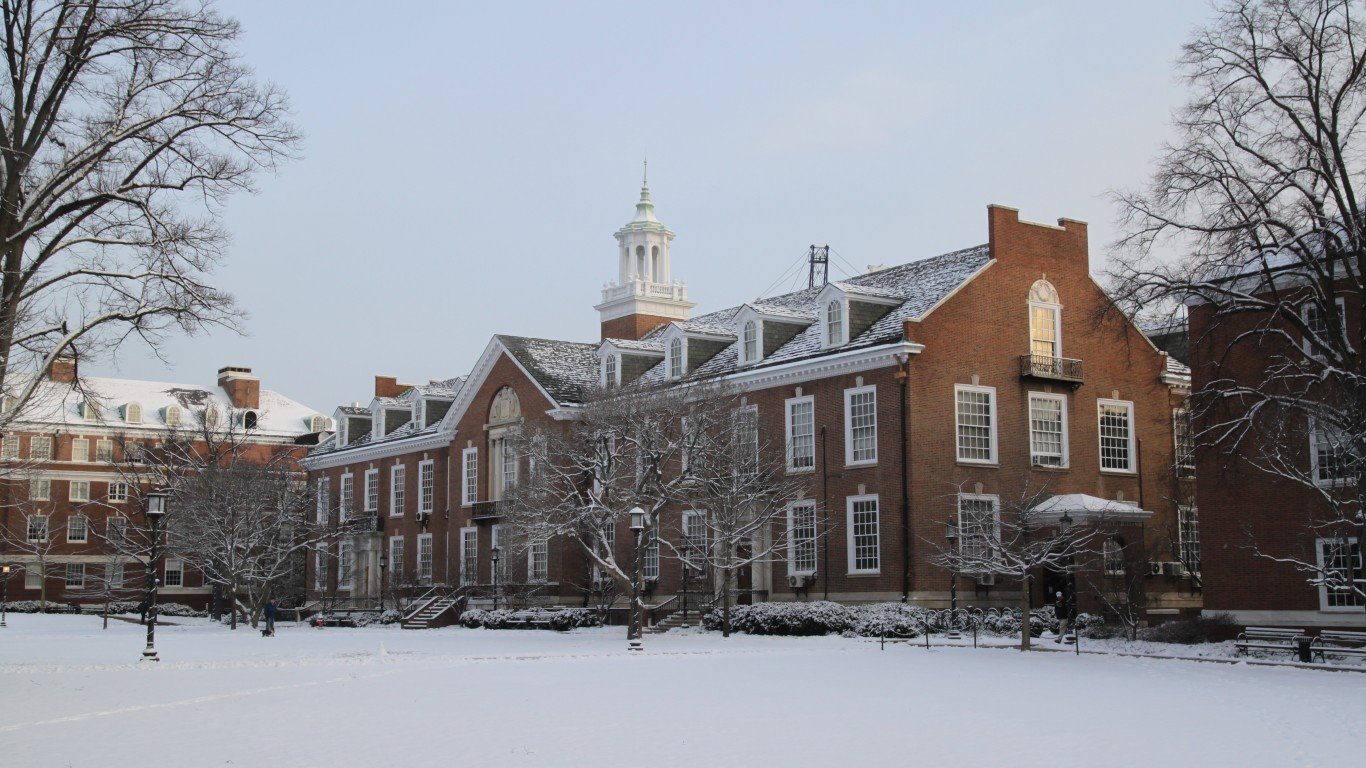
Maryland: Johns Hopkins University
> Location: Baltimore
> Admission rate for 2018-2019: 11.5%
> Applicants for 2018-2019: 29,776
> Undergraduates in fall 2018: 6,064
> Median SAT score: 1510 out of 1600
> Annual net cost of attendance: $67,603
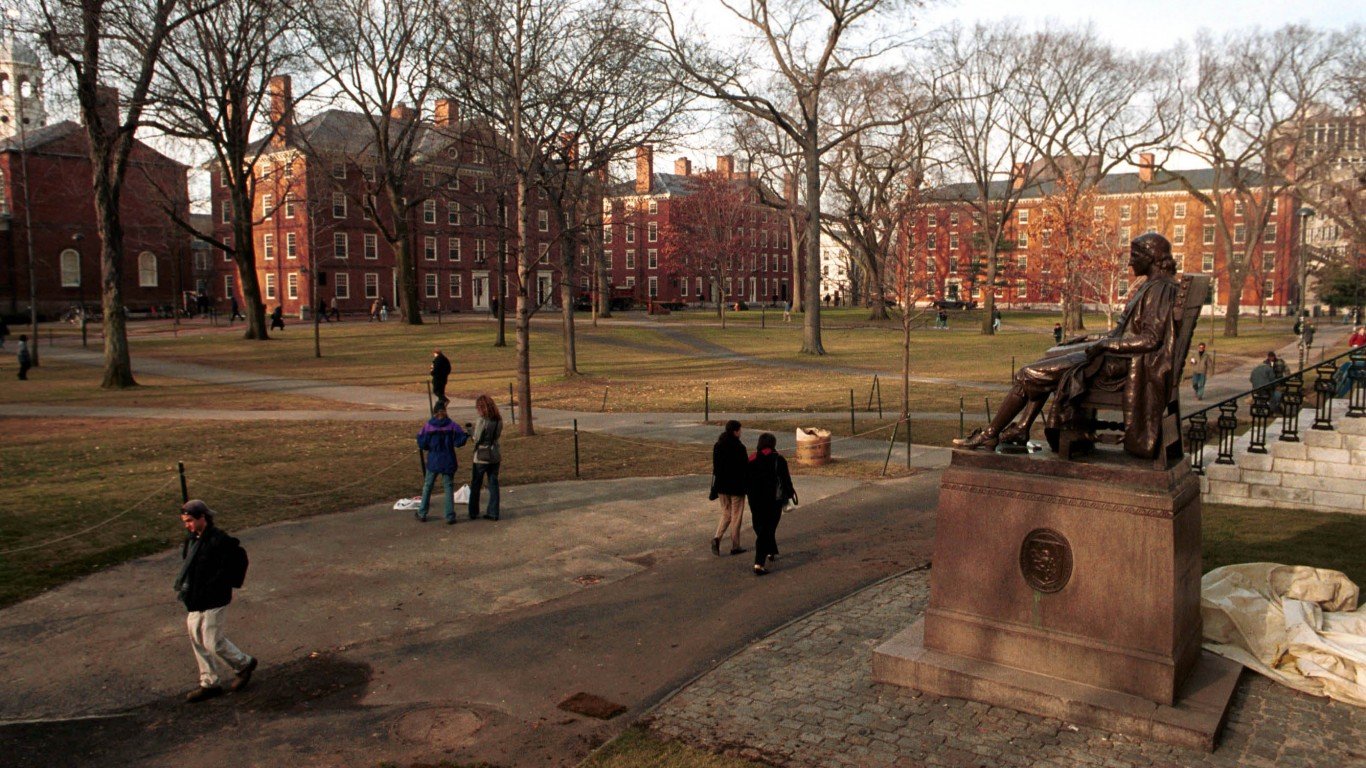
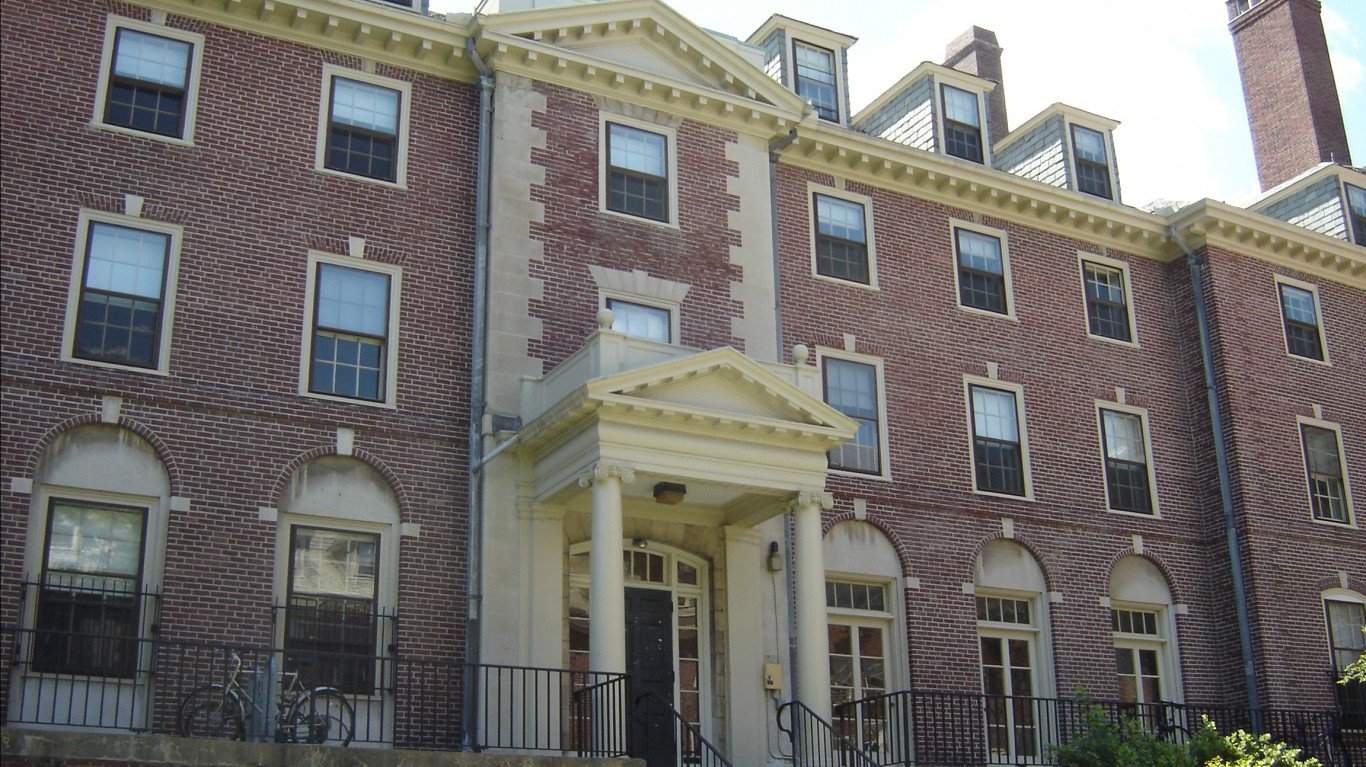
Massachusetts: Harvard University
> Location: Cambridge
> Admission rate for 2018-2019: 4.7%
> Applicants for 2018-2019: 42,749
> Undergraduates in fall 2018: 9,950
> Median SAT score: 1525 out of 1600
> Annual net cost of attendance: $66,900
[in-text-ad]
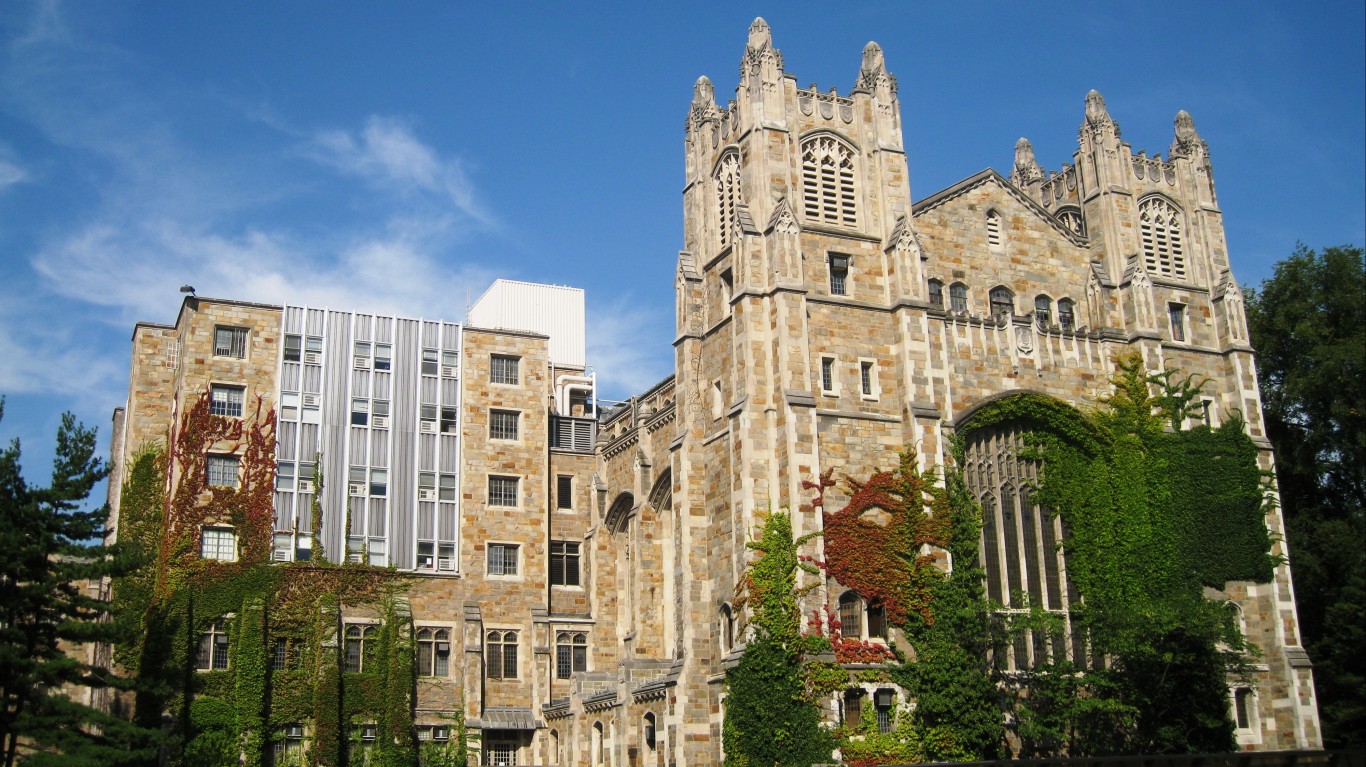
Michigan: University of Michigan-Ann Arbor
> Location: Ann Arbor
> Admission rate for 2018-2019: 22.8%
> Applicants for 2018-2019: 64,917
> Undergraduates in fall 2018: 30,318
> Median SAT score: 1415 out of 1600
> Annual net cost of attendance: $28,652
[recirclink id=587850]
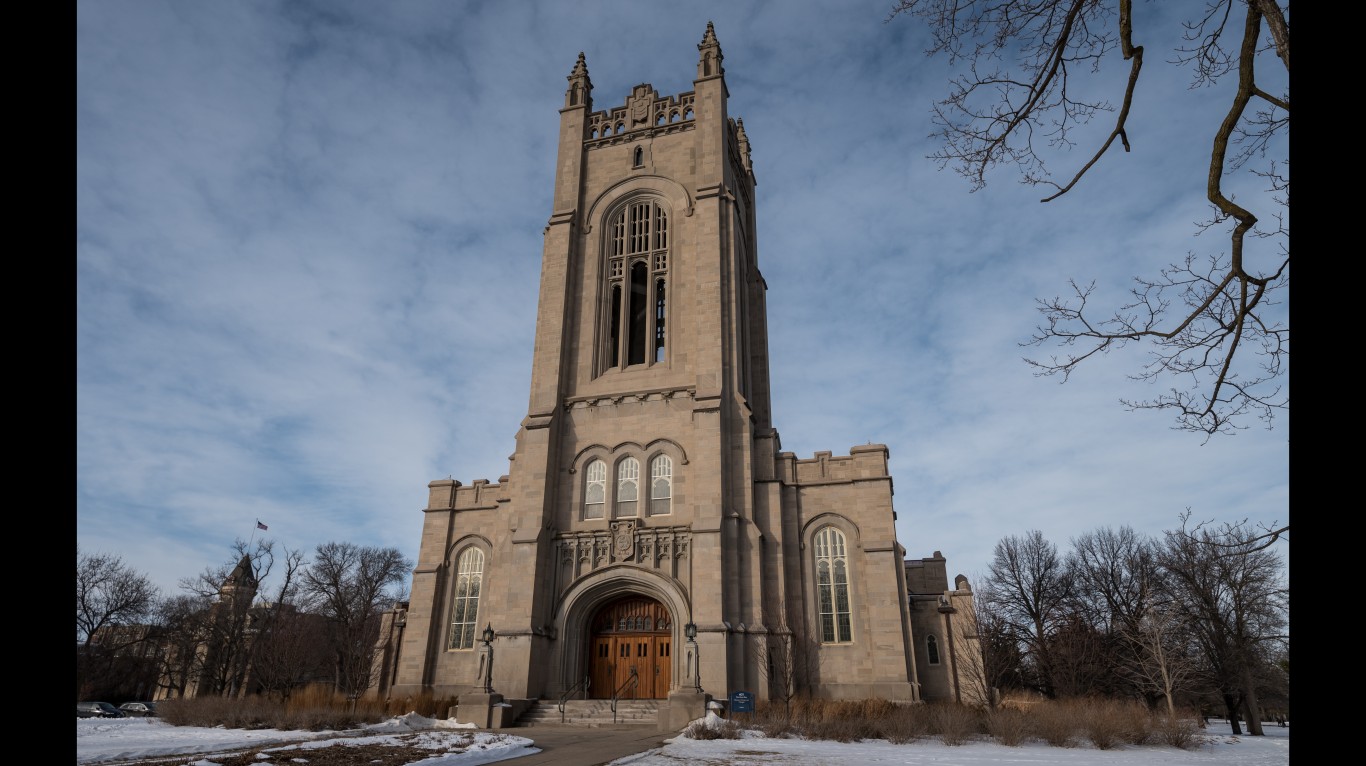
Minnesota: Carleton College
> Location: Northfield
> Admission rate for 2018-2019: 19.8%
> Applicants for 2018-2019: 7,092
> Undergraduates in fall 2018: 2,097
> Median SAT score: 1445 out of 1600
> Annual net cost of attendance: $66,490
Mississippi: Mississippi College
> Location: Clinton
> Admission rate for 2018-2019: 38.4%
> Applicants for 2018-2019: 2,216
> Undergraduates in fall 2018: 3,232
> Median SAT score: 1180 out of 1600
> Annual net cost of attendance: $30,695
[in-text-ad-2]

Missouri: Washington University in St Louis
> Location: Saint Louis
> Admission rate for 2018-2019: 15.0%
> Applicants for 2018-2019: 31,320
> Undergraduates in fall 2018: 7,751
> Median SAT score: 1520 out of 1600
> Annual net cost of attendance: $69,754

Montana: Rocky Mountain College
> Location: Billings
> Admission rate for 2018-2019: 58.4%
> Applicants for 2018-2019: 1,521
> Undergraduates in fall 2018: 897
> Median SAT score: 1030 out of 1600
> Annual net cost of attendance: $37,687
[in-text-ad]
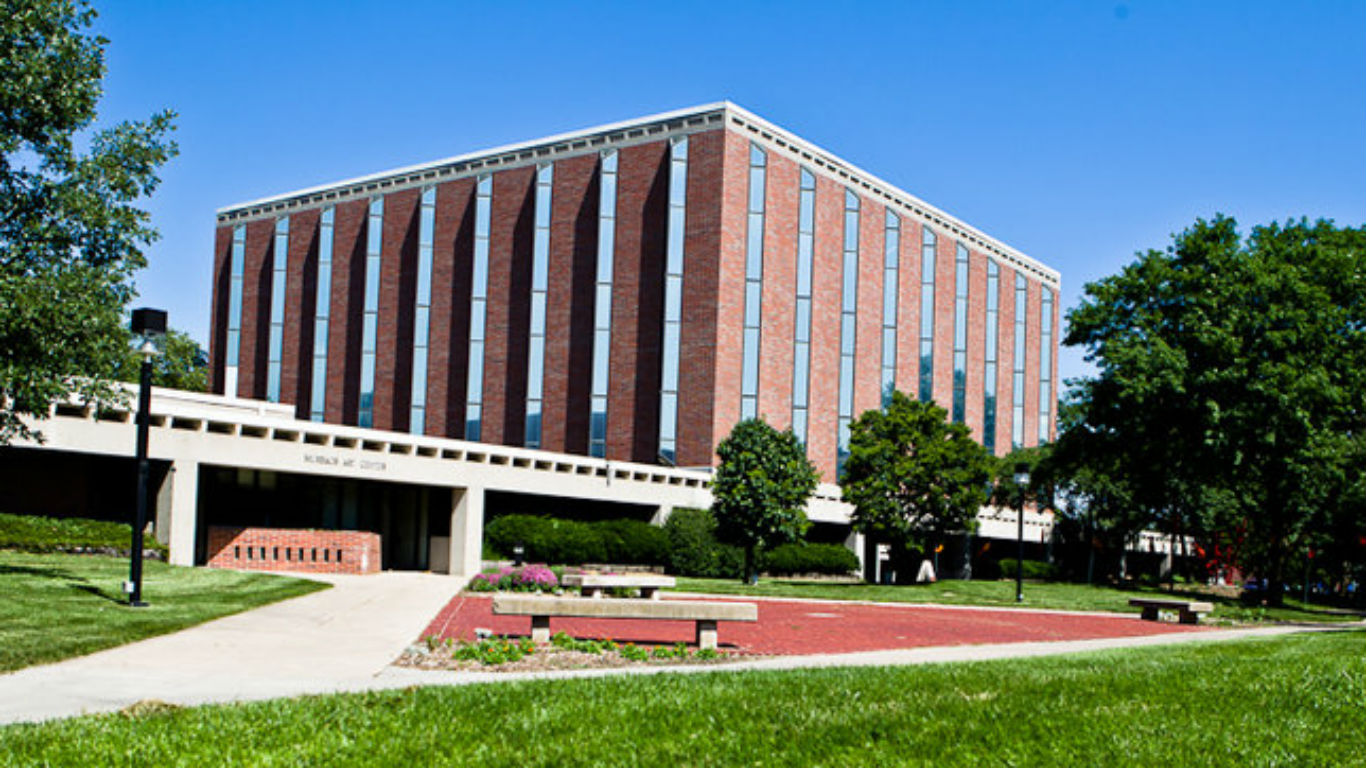
Nebraska: Midland University
> Location: Fremont
> Admission rate for 2018-2019: 52.1%
> Applicants for 2018-2019: 1,886
> Undergraduates in fall 2018: 1,721
> Median SAT score: 994 out of 1600
> Annual net cost of attendance: $41,473
[recirclink id=636794]
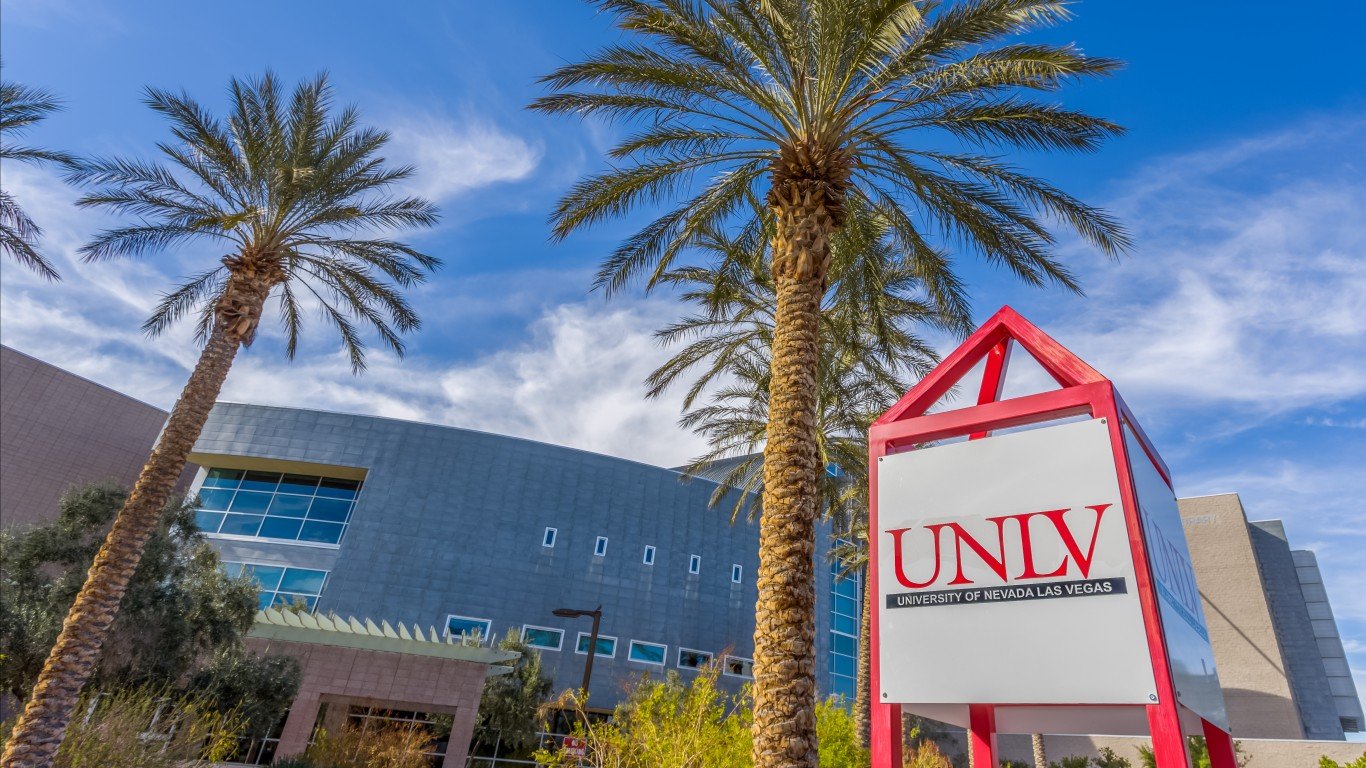
Nevada: University of Nevada-Las Vegas
> Location: Las Vegas
> Admission rate for 2018-2019: 82.0%
> Applicants for 2018-2019: 11,612
> Undergraduates in fall 2018: 25,282
> Median SAT score: 1135 out of 1600
> Annual net cost of attendance: $16,964
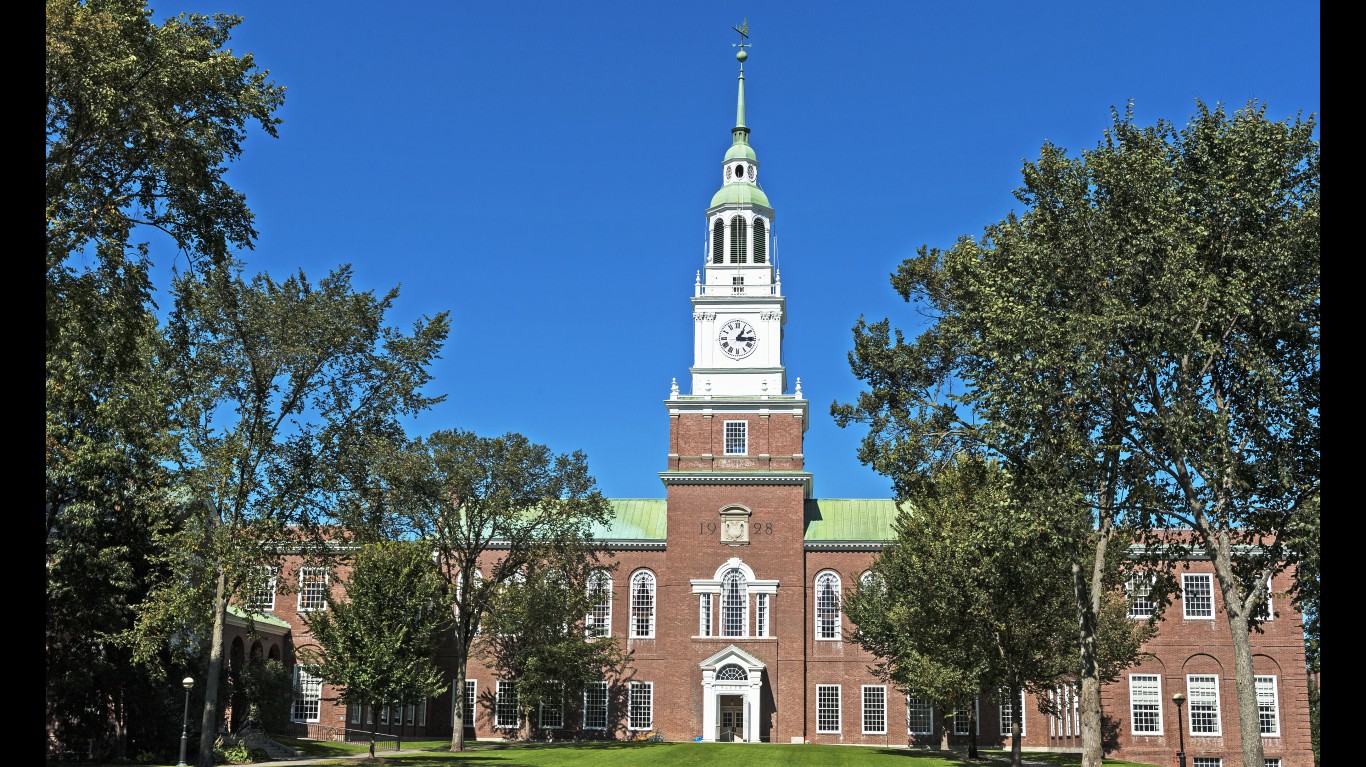
New Hampshire: Dartmouth College
> Location: Hanover
> Admission rate for 2018-2019: 8.7%
> Applicants for 2018-2019: 22,033
> Undergraduates in fall 2018: 4,418
> Median SAT score: 1495 out of 1600
> Annual net cost of attendance: $69,474
[in-text-ad-2]

New Jersey: Princeton University
> Location: Princeton
> Admission rate for 2018-2019: 5.5%
> Applicants for 2018-2019: 35,370
> Undergraduates in fall 2018: 5,428
> Median SAT score: 1500 out of 1600
> Annual net cost of attendance: $64,390
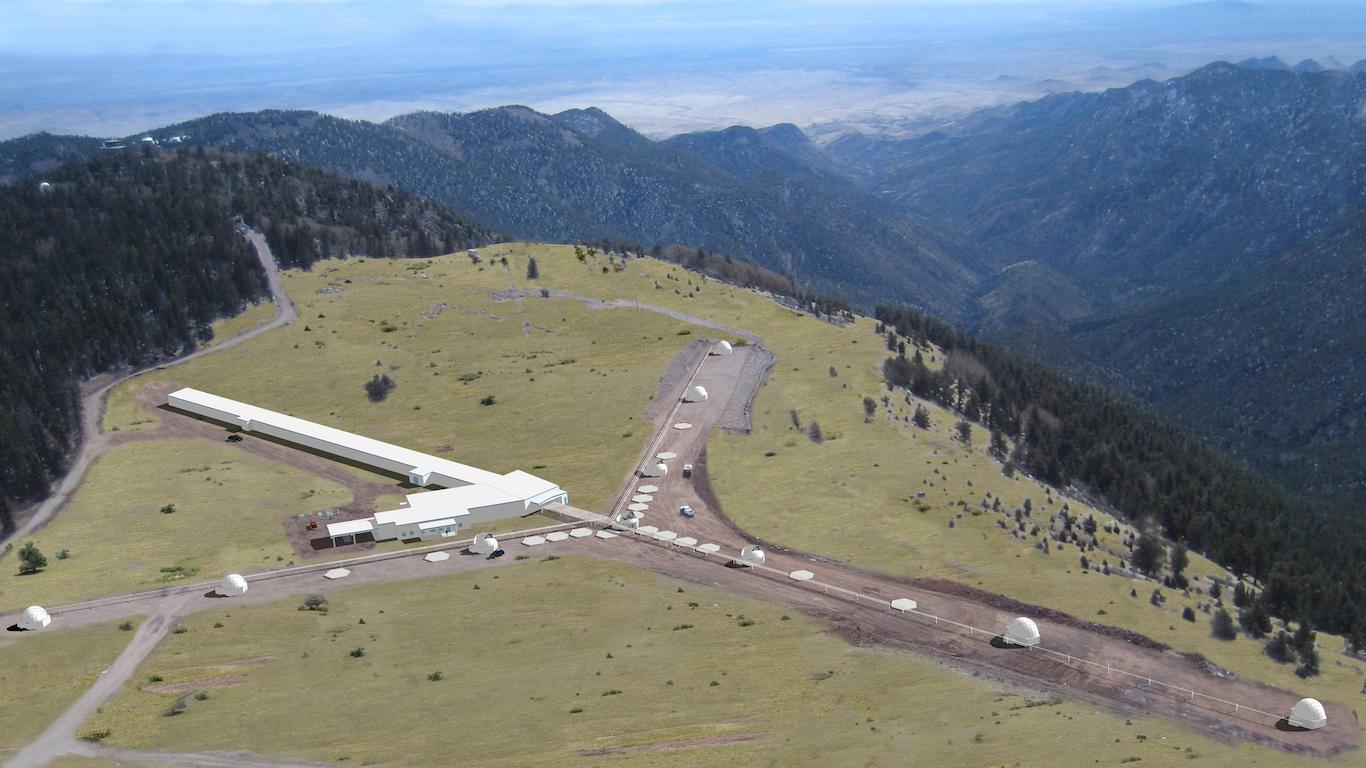
New Mexico: New Mexico Institute of Mining and Technology
> Location: Socorro
> Admission rate for 2018-2019: 23.2%
> Applicants for 2018-2019: 1,740
> Undergraduates in fall 2018: 1,412
> Median SAT score: 1290 out of 1600
> Annual net cost of attendance: $20,727
[in-text-ad]
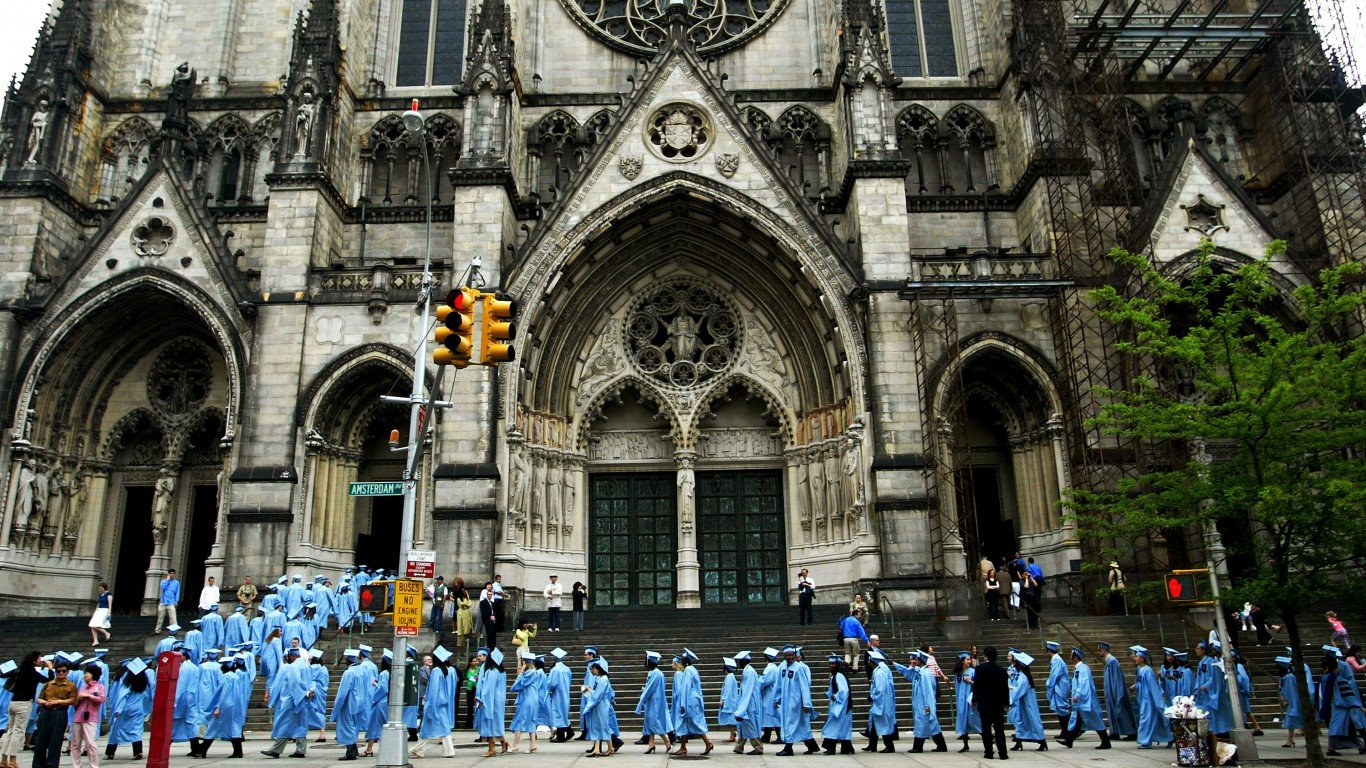
New York: Columbia University in the City of New York
> Location: New York
> Admission rate for 2018-2019: 5.9%
> Applicants for 2018-2019: 40,572
> Undergraduates in fall 2018: 8,216
> Median SAT score: 1490 out of 1600
> Annual net cost of attendance: $71,972
[recirclink id=590260]
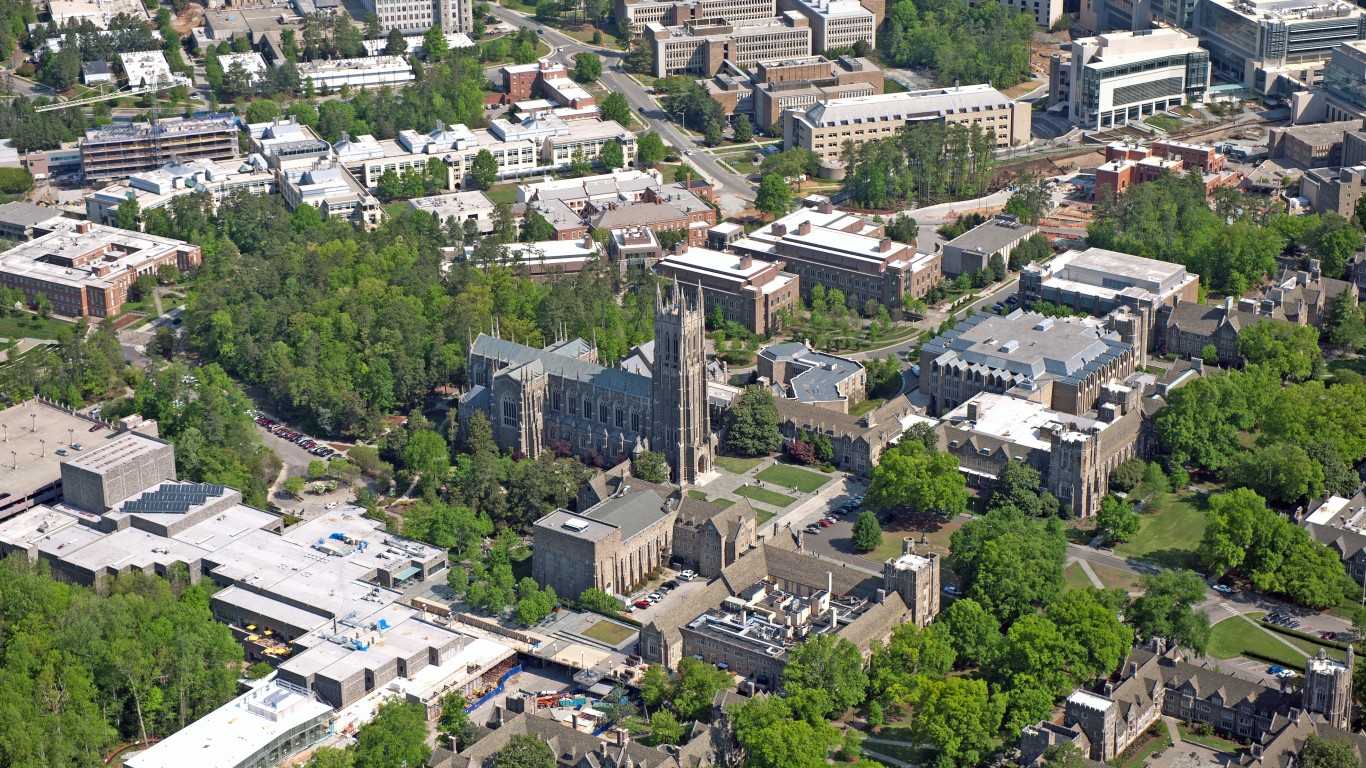
North Carolina: Duke University
> Location: Durham
> Admission rate for 2018-2019: 8.9%
> Applicants for 2018-2019: 35,786
> Undergraduates in fall 2018: 6,682
> Median SAT score: 1460 out of 1600
> Annual net cost of attendance: $69,847
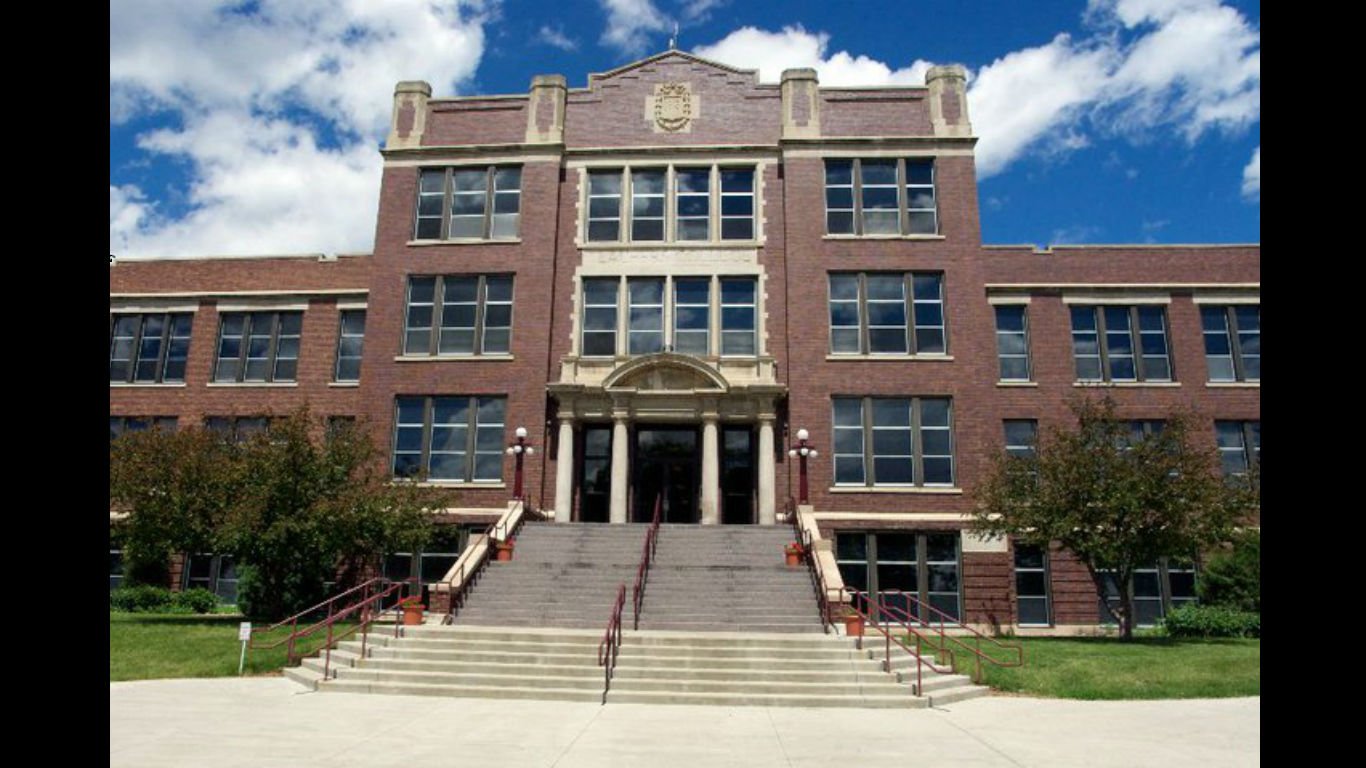
North Dakota: Minot State University
> Location: Minot
> Admission rate for 2018-2019: 50.1%
> Applicants for 2018-2019: 1,040
> Undergraduates in fall 2018: 2,915
> Median SAT score: 1122 out of 1600
> Annual net cost of attendance: $15,483
[in-text-ad-2]
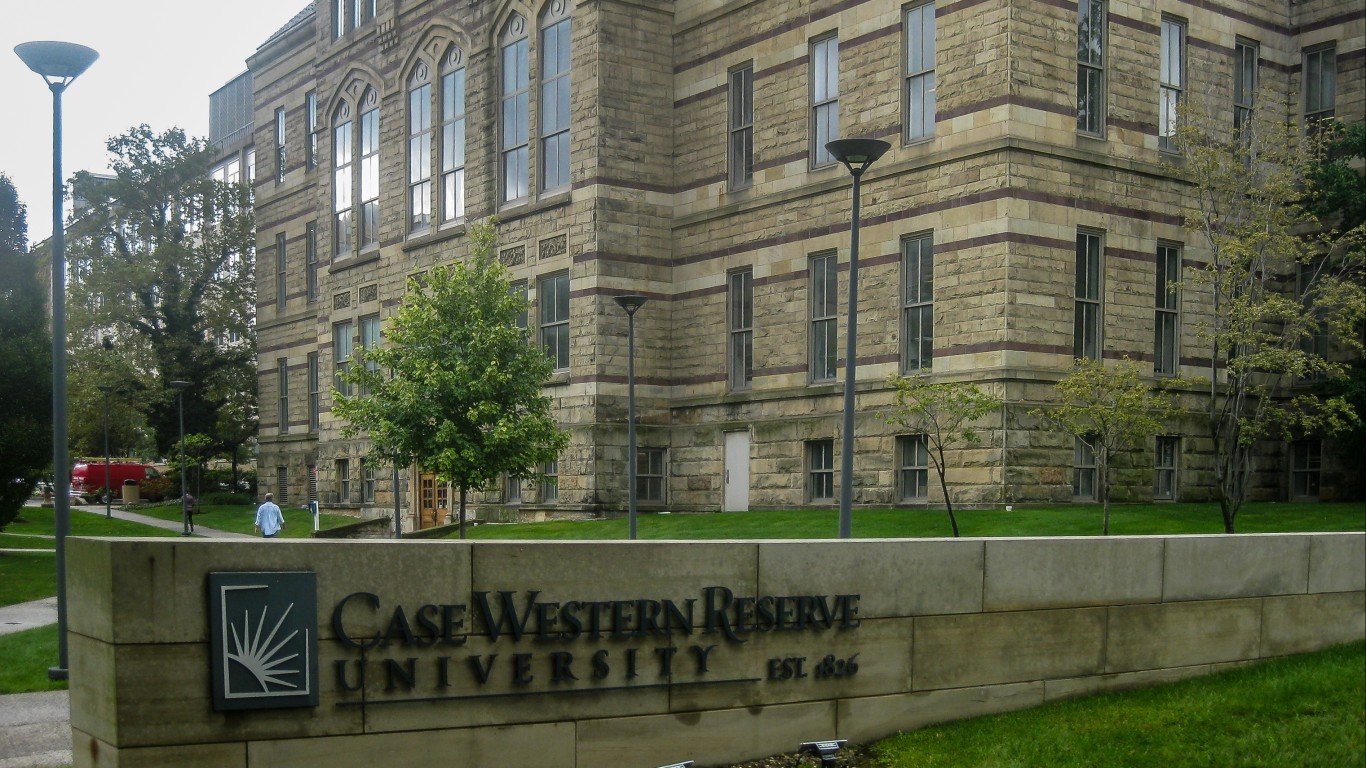
Ohio: Case Western Reserve University
> Location: Cleveland
> Admission rate for 2018-2019: 29.3%
> Applicants for 2018-2019: 26,642
> Undergraduates in fall 2018: 5,261
> Median SAT score: 1430 out of 1600
> Annual net cost of attendance: $63,216
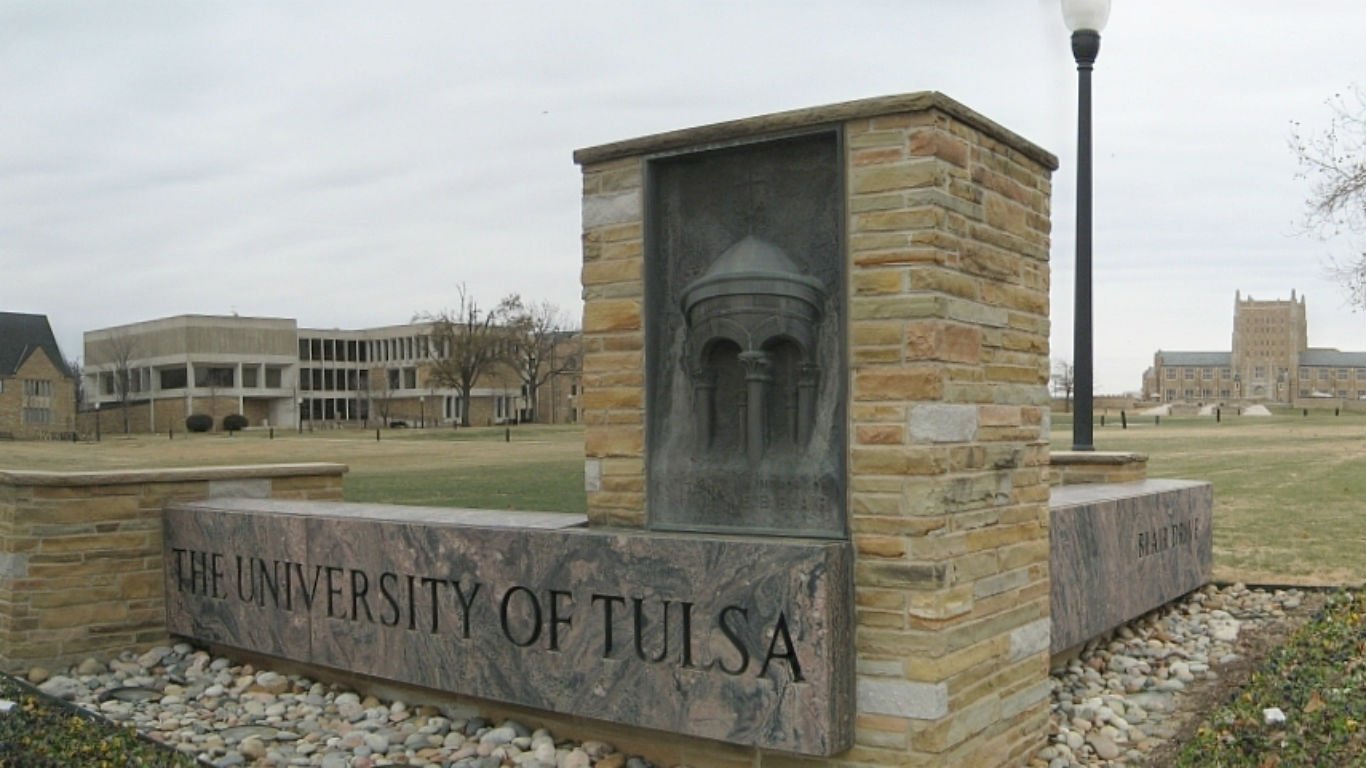
Oklahoma: University of Tulsa
> Location: Tulsa
> Admission rate for 2018-2019: 40.8%
> Applicants for 2018-2019: 8,526
> Undergraduates in fall 2018: 3,267
> Median SAT score: 1295 out of 1600
> Annual net cost of attendance: $56,173
[in-text-ad]
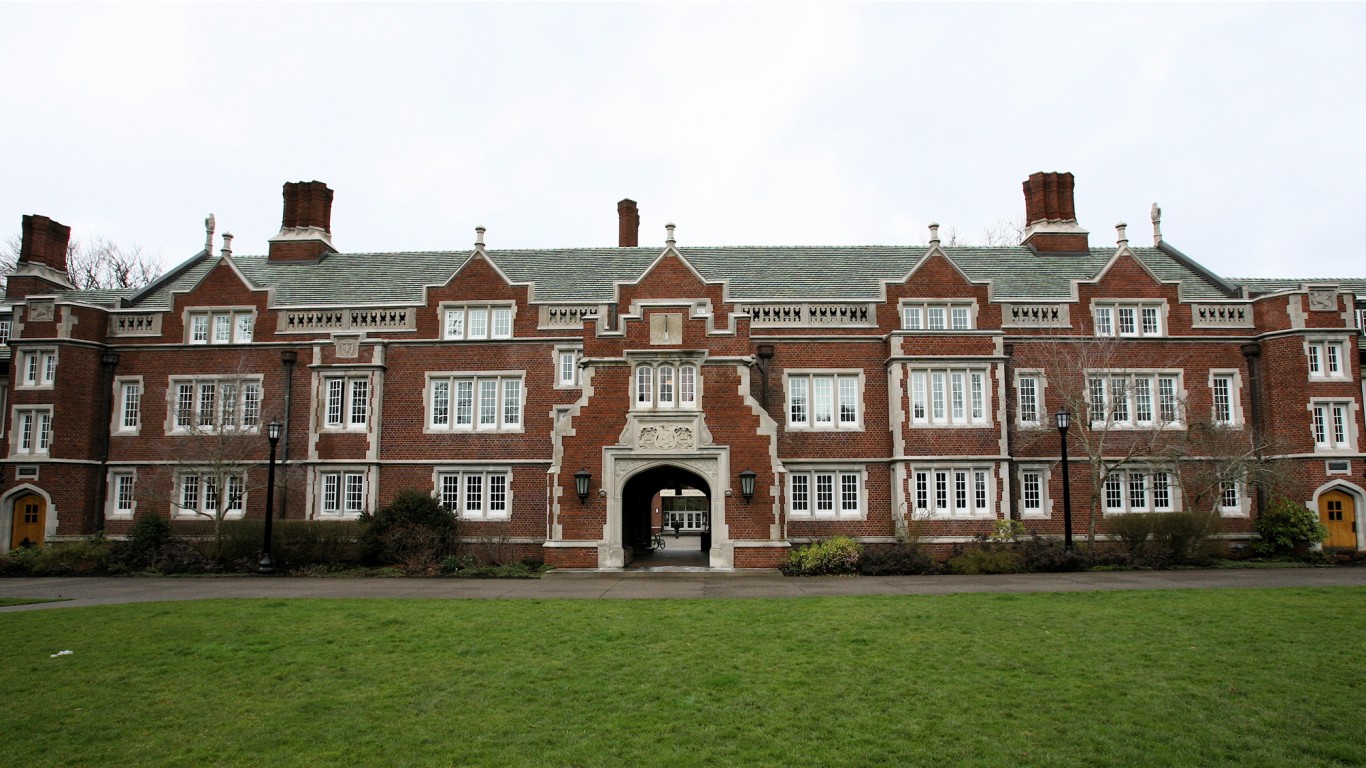
Oregon: Reed College
> Location: Portland
> Admission rate for 2018-2019: 35.0%
> Applicants for 2018-2019: 5,957
> Undergraduates in fall 2018: 1,483
> Median SAT score: 1405 out of 1600
> Annual net cost of attendance: $67,235
[recirclink id=600755]

Pennsylvania: University of Pennsylvania
> Location: Philadelphia
> Admission rate for 2018-2019: 8.4%
> Applicants for 2018-2019: 44,491
> Undergraduates in fall 2018: 11,851
> Median SAT score: 1490 out of 1600
> Annual net cost of attendance: $69,340
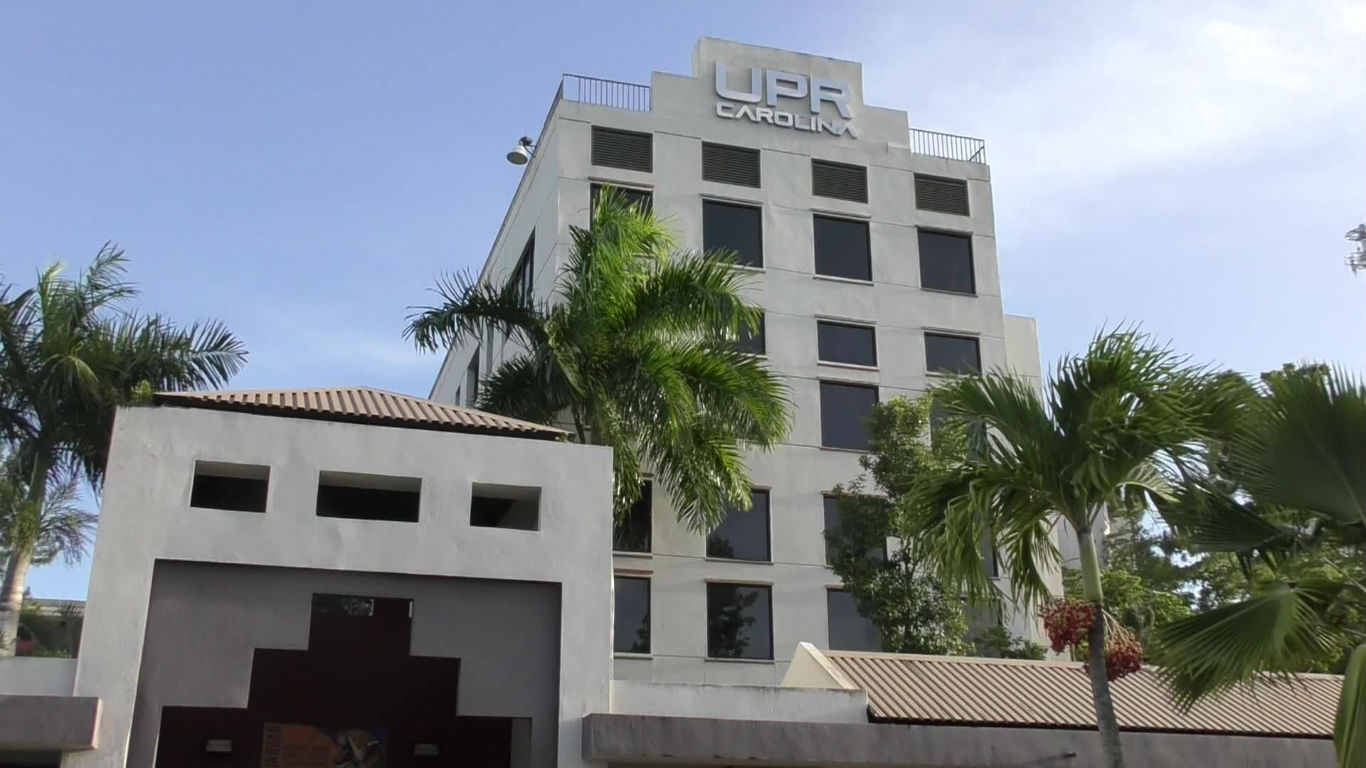
Puerto Rico: University of Puerto Rico-Carolina
> Location: Carolina
> Admission rate for 2018-2019: 31.6%
> Applicants for 2018-2019: 2,639
> Undergraduates in fall 2018: 3,392
> Median SAT score: 1022 out of 1600
> Annual net cost of attendance: $13,283
[in-text-ad-2]
Rhode Island: Brown University
> Location: Providence
> Admission rate for 2018-2019: 7.7%
> Applicants for 2018-2019: 35,437
> Undergraduates in fall 2018: 7,043
> Median SAT score: 1488 out of 1600
> Annual net cost of attendance: $68,106
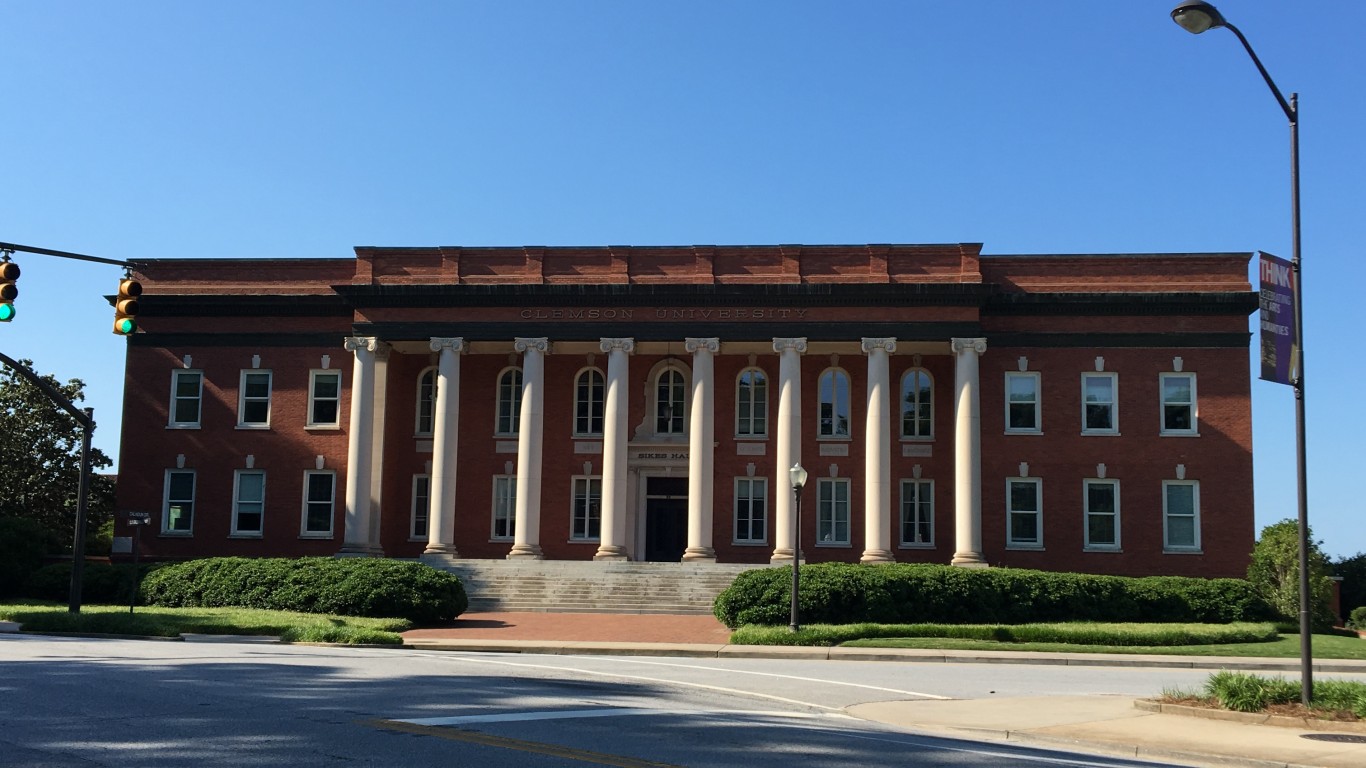
South Carolina: Clemson University
> Location: Clemson
> Admission rate for 2018-2019: 47.2%
> Applicants for 2018-2019: 28,845
> Undergraduates in fall 2018: 19,669
> Median SAT score: 1305 out of 1600
> Annual net cost of attendance: $28,545
[in-text-ad]
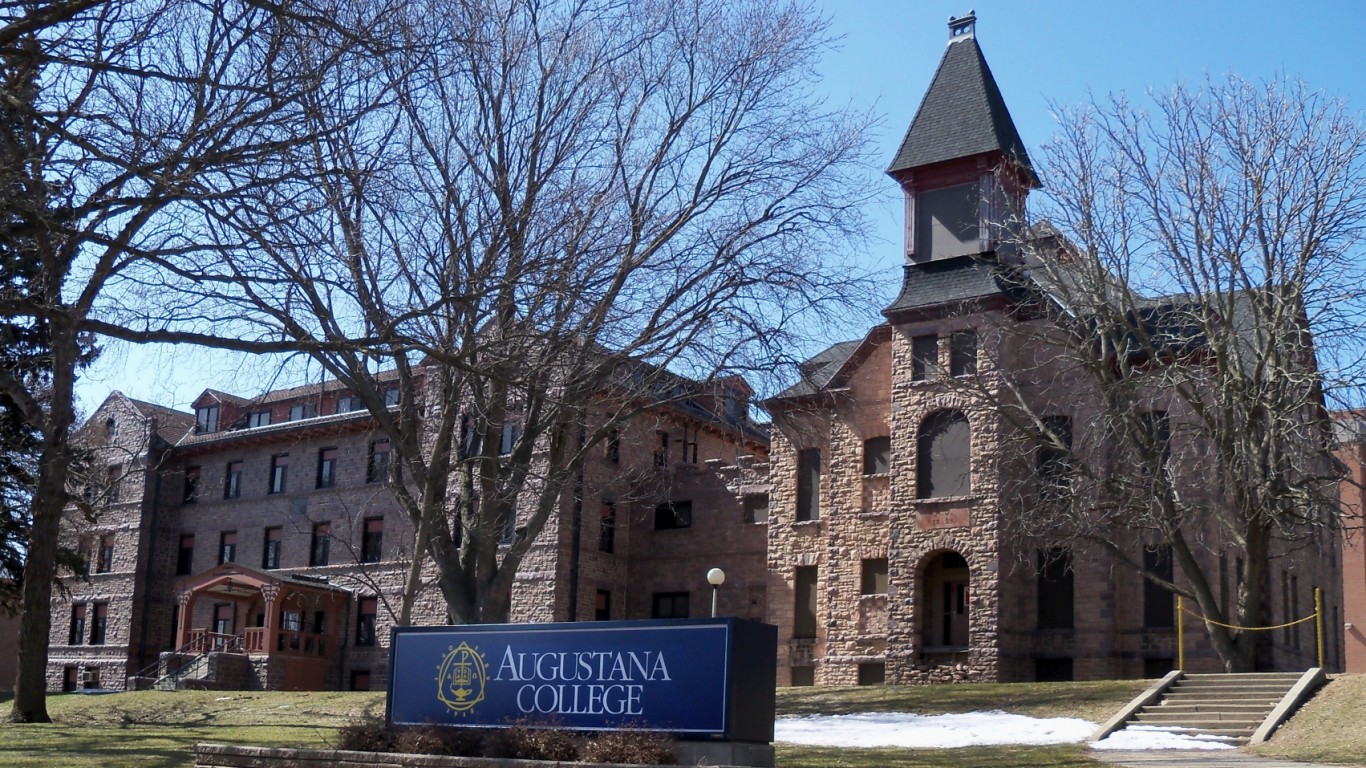
South Dakota: Augustana University
> Location: Sioux Falls
> Admission rate for 2018-2019: 65.4%
> Applicants for 2018-2019: 2,201
> Undergraduates in fall 2018: 1,807
> Median SAT score: 1180 out of 1600
> Annual net cost of attendance: $40,681
[recirclink id=587850]
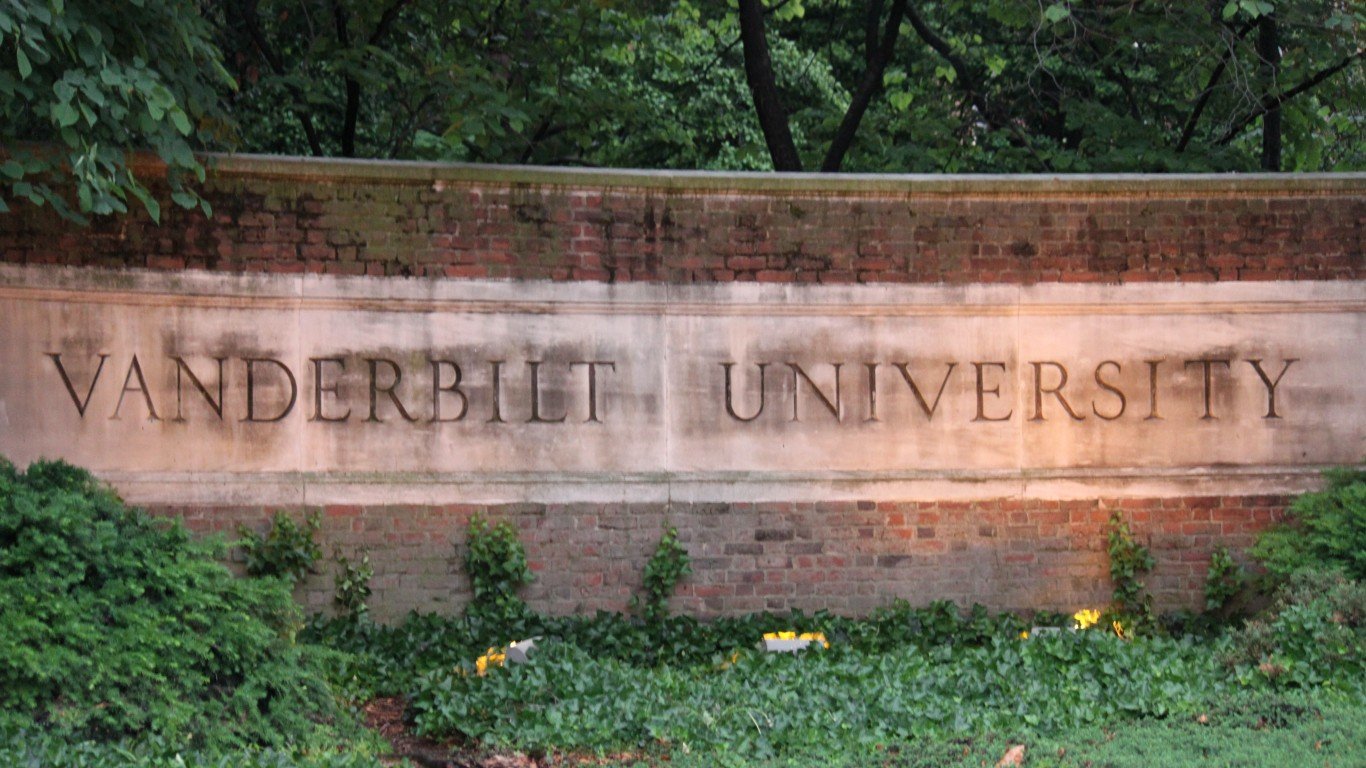
Tennessee: Vanderbilt University
> Location: Nashville
> Admission rate for 2018-2019: 9.6%
> Applicants for 2018-2019: 34,313
> Undergraduates in fall 2018: 6,861
> Median SAT score: 1505 out of 1600
> Annual net cost of attendance: $64,654

Texas: Rice University
> Location: Houston
> Admission rate for 2018-2019: 11.1%
> Applicants for 2018-2019: 20,923
> Undergraduates in fall 2018: 3,992
> Median SAT score: 1535 out of 1600
> Annual net cost of attendance: $60,518
[in-text-ad-2]

Utah: Brigham Young University-Provo
> Location: Provo
> Admission rate for 2018-2019: 64.5%
> Applicants for 2018-2019: 11,205
> Undergraduates in fall 2018: 31,441
> Median SAT score: 1310 out of 1600
> Annual net cost of attendance: $17,801
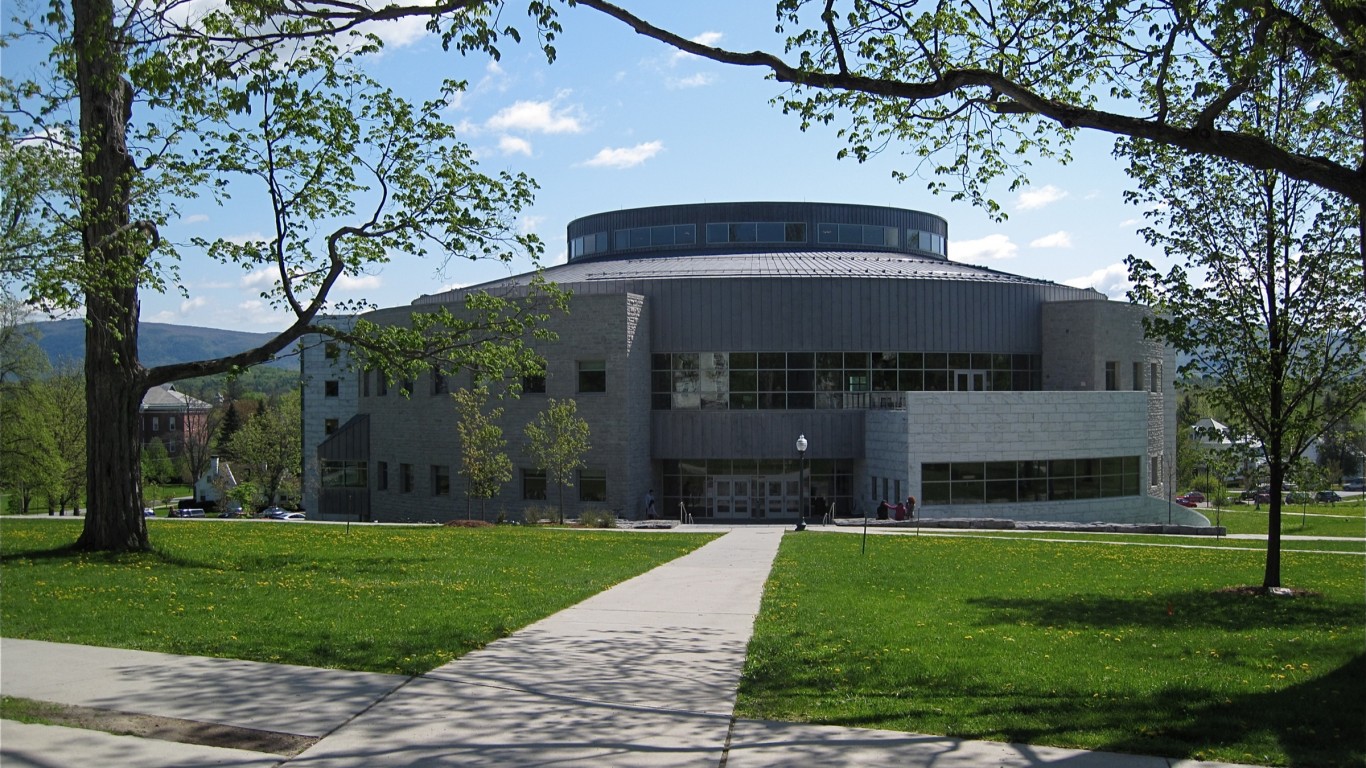
Vermont: Middlebury College
> Location: Middlebury
> Admission rate for 2018-2019: 16.7%
> Applicants for 2018-2019: 9,227
> Undergraduates in fall 2018: 2,564
> Median SAT score: 1415 out of 1600
> Annual net cost of attendance: $66,332
[in-text-ad]
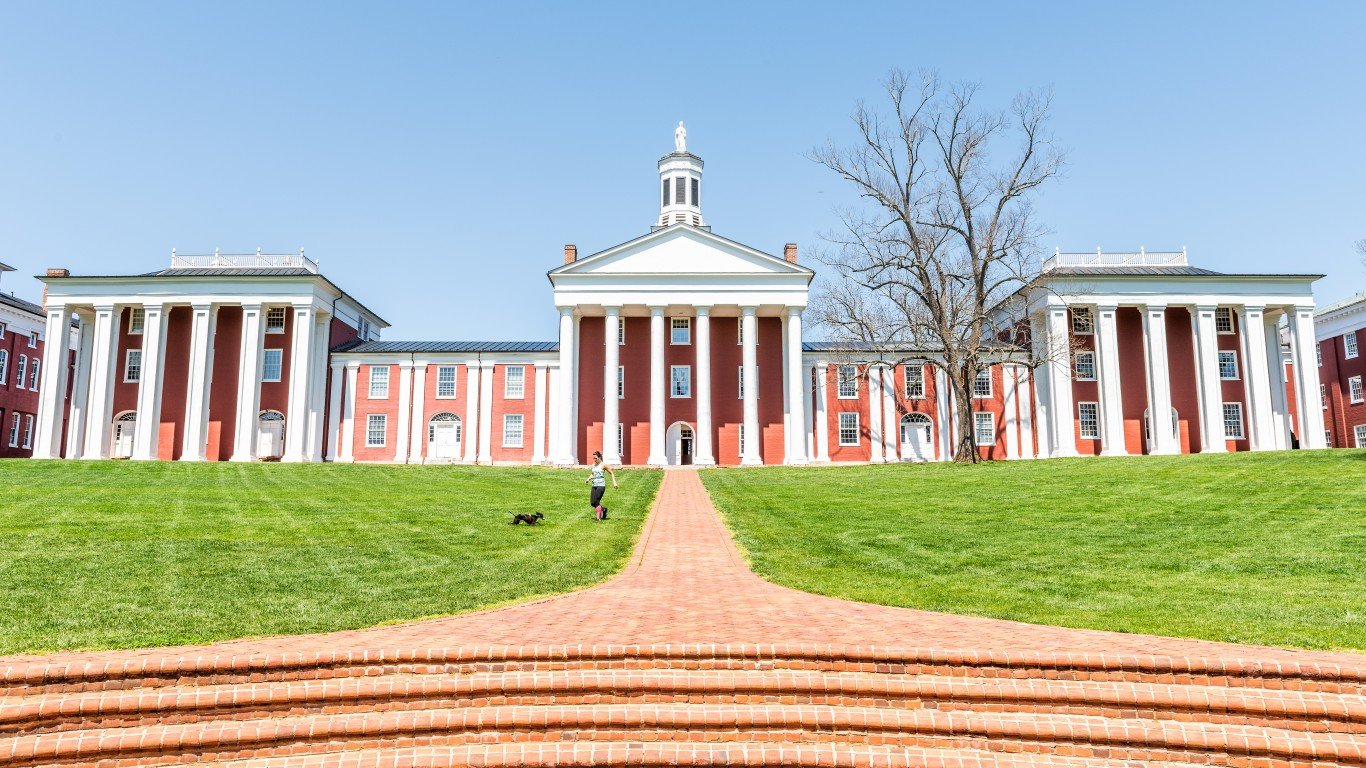
Virginia: Washington and Lee University
> Location: Lexington
> Admission rate for 2018-2019: 21.2%
> Applicants for 2018-2019: 5,855
> Undergraduates in fall 2018: 1,829
> Median SAT score: 1420 out of 1600
> Annual net cost of attendance: $64,700
[recirclink id=636794]
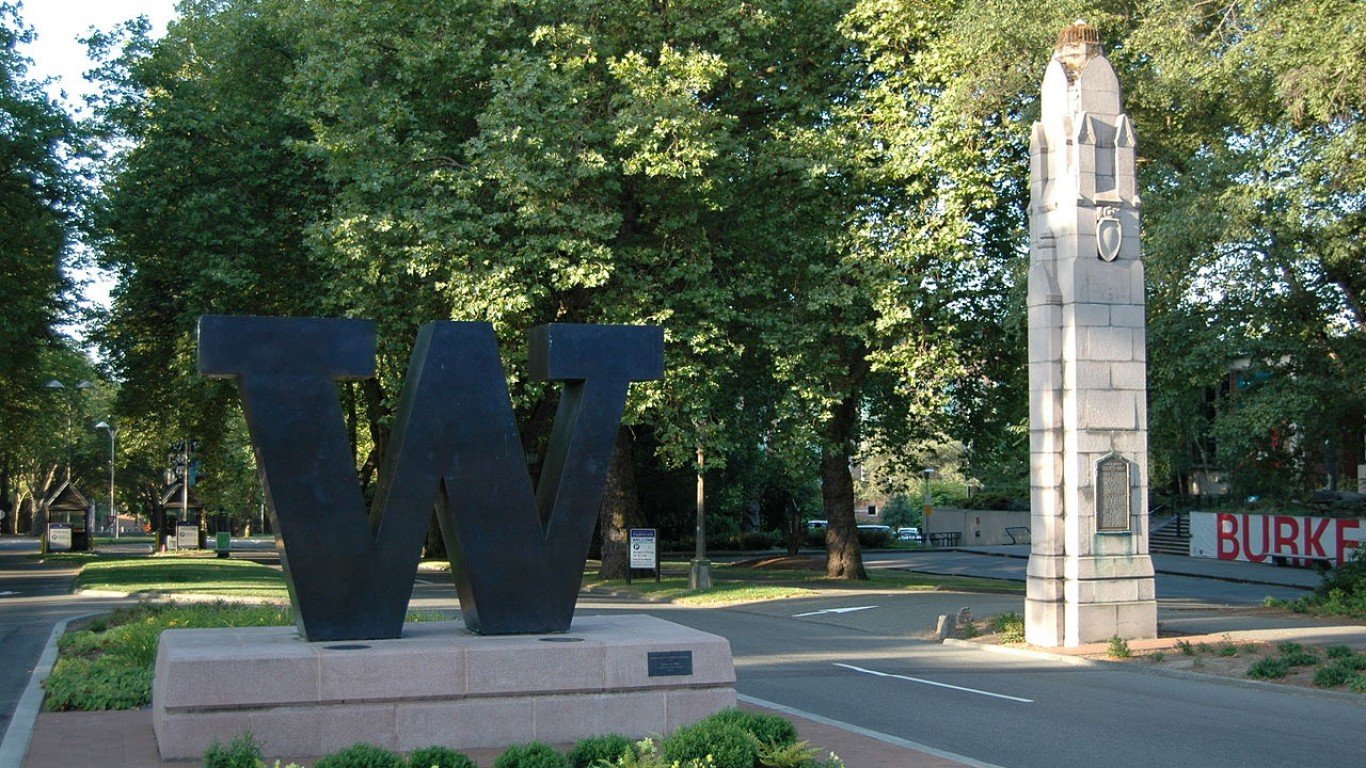
Washington: University of Washington-Seattle Campus
> Location: Seattle
> Admission rate for 2018-2019: 48.7%
> Applicants for 2018-2019: 45,907
> Undergraduates in fall 2018: 32,099
> Median SAT score: 1305 out of 1600
> Annual net cost of attendance: $24,498
West Virginia: Davis & Elkins College
> Location: Elkins
> Admission rate for 2018-2019: 37.0%
> Applicants for 2018-2019: 2,495
> Undergraduates in fall 2018: 793
> Median SAT score: 1000 out of 1600
> Annual net cost of attendance: $41,055
[in-text-ad-2]
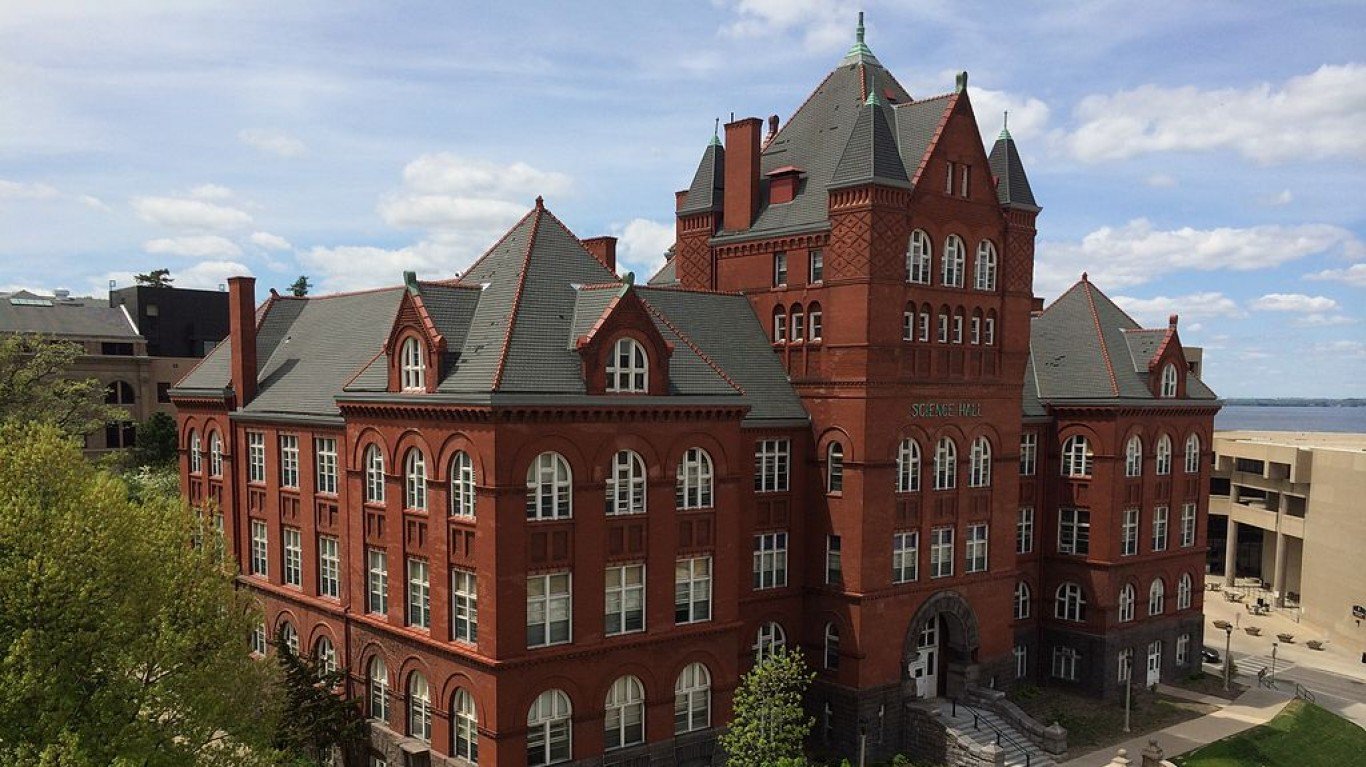
Wisconsin: University of Wisconsin-Madison
> Location: Madison
> Admission rate for 2018-2019: 51.7%
> Applicants for 2018-2019: 42,727
> Undergraduates in fall 2018: 31,705
> Median SAT score: 1365 out of 1600
> Annual net cost of attendance: $25,121
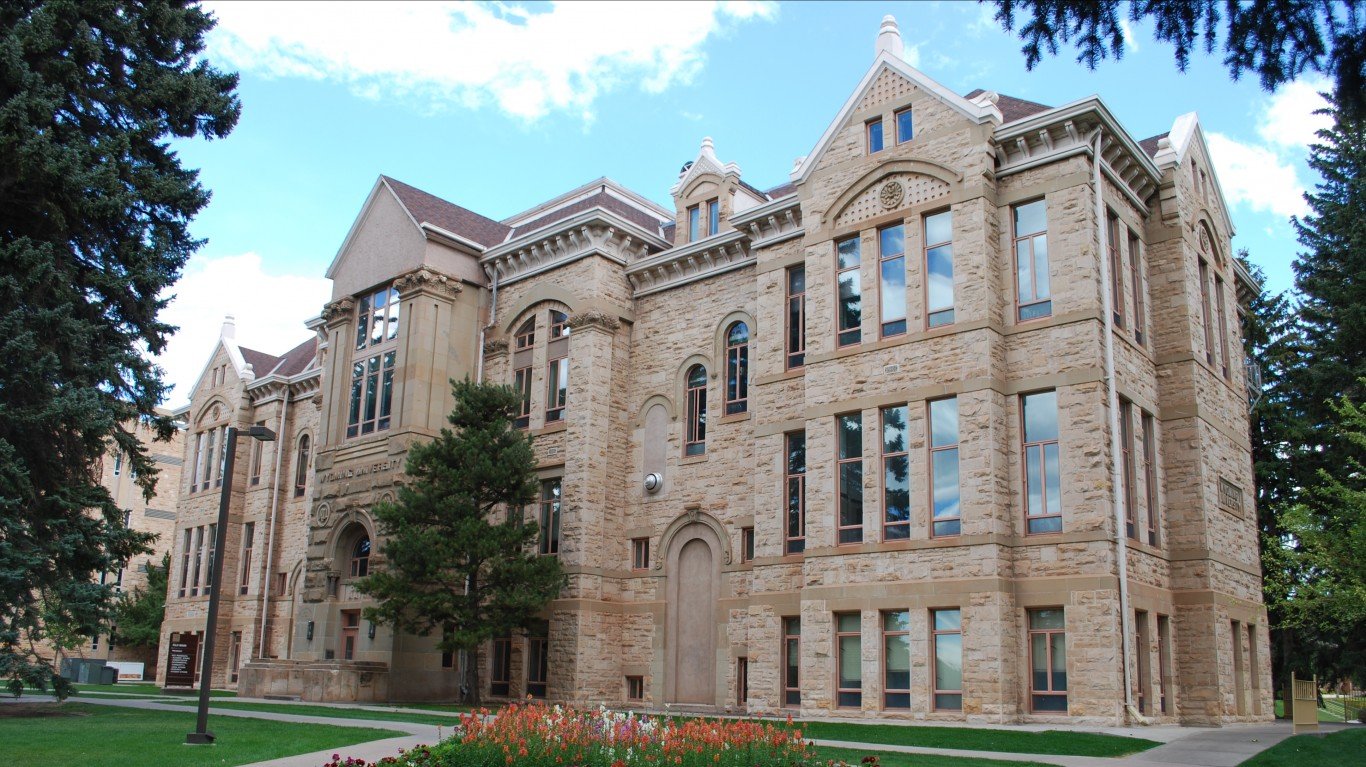
Wyoming: University of Wyoming
> Location: Laramie
> Admission rate for 2018-2019: 96.0%
> Applicants for 2018-2019: 5,293
> Undergraduates in fall 2018: 9,998
> Median SAT score: 1165 out of 1600
> Annual net cost of attendance: $19,615
Methodology
To determine the hardest colleges to get into by state, 24/7 Wall St. reviewed data on admissions and SAT scores from the National Center for Education Statistics of the U.S. Department of Education. Colleges and universities were ranked based on an index using admission rates for the 2018-2019 school year and the median combined math and critical reading SAT scores for students admitted in Fall 2017. Supplemental data on the average cost of attendance for the 2016-2017 school year also came from the NCES.
We only considered colleges and universities with at least 1,000 applicants. In two states, Wyoming and Alaska, there was only one school with at least 1,000 applicants, and so the school listed in each of those states was the hardest to get into by default. Enrollment figures are for all undergraduates, both full and part-time, for fall 2018, also from NCES.
Contact [email protected] for any questions or corrections.