[cnxvideo id=”924890″ placement=”ros”]
The United States is in a period of historic, continuous economic growth, with GDP climbing every quarter since mid-2009. While this trend is good news for most Americans, not all parts of the country have experienced the same growth. In fact, in nearly every state, there is at least one county where GDP has contracted in recent years.
Using data from the Bureau of Economic Analysis, 24/7 Wall St. reviewed GDP change from 2013 through 2018 at the county and county equivalent level to identify the fastest shrinking local economy in every state.
California, Hawaii, Massachusetts, and New Hampshire are the only states where no counties reported a decline in GDP between 2013 and 2018. Still, each of these states has at least one county where economic growth over that period lagged behind the comparable 13.0% national GDP growth. Perhaps not surprisingly, overall economic growth has been faster in these four states than in most other states over the last five years. Here is a look at the fastest growing and shrinking state economies.
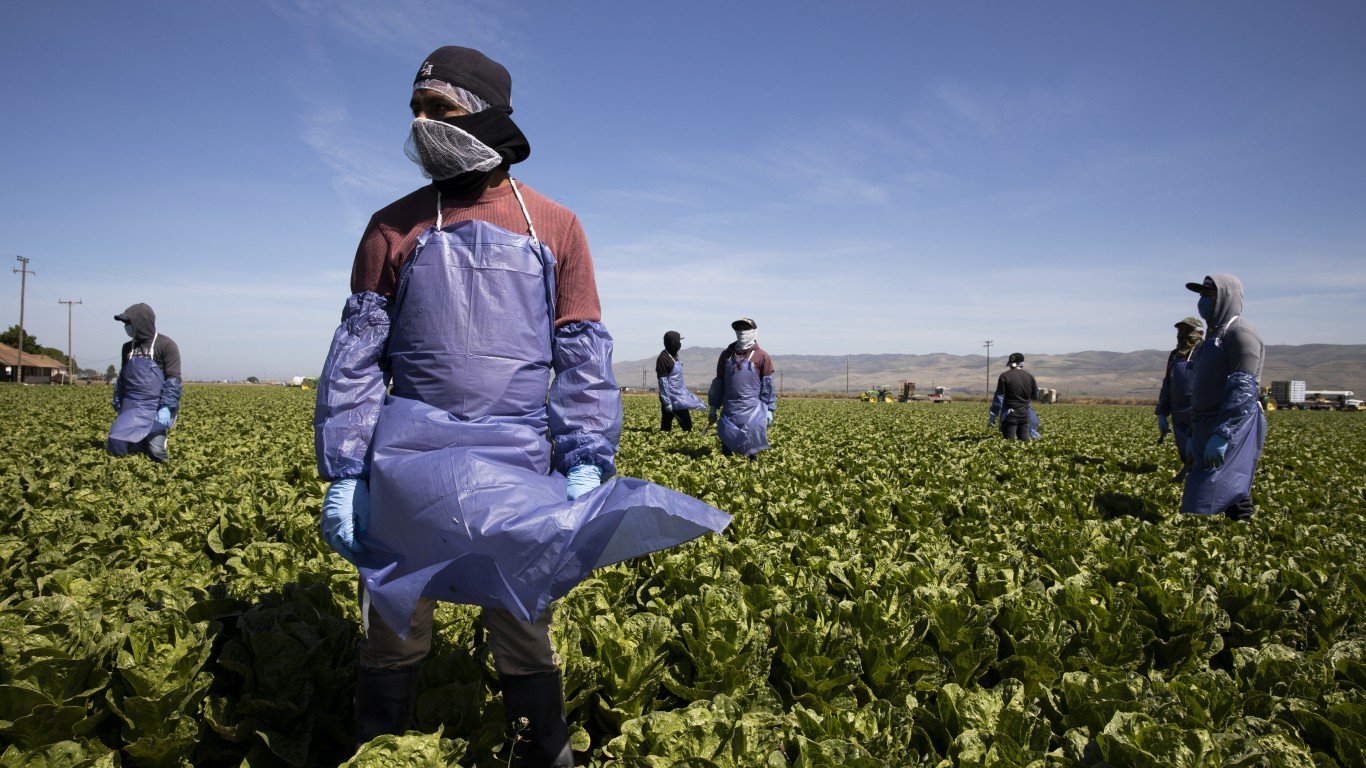
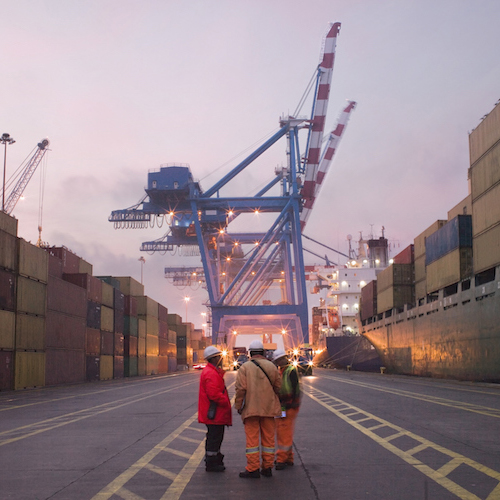
In 13 counties on this list, mining, quarrying, and oil extraction — a particularly volatile industry — reported the largest decline in economic output of any other industry. Many of these counties are located in states that rank among the top coal producers, including Pennsylvania and West Virginia — and between 2013 and 2018, total U.S. coal production has fallen by over 23%.
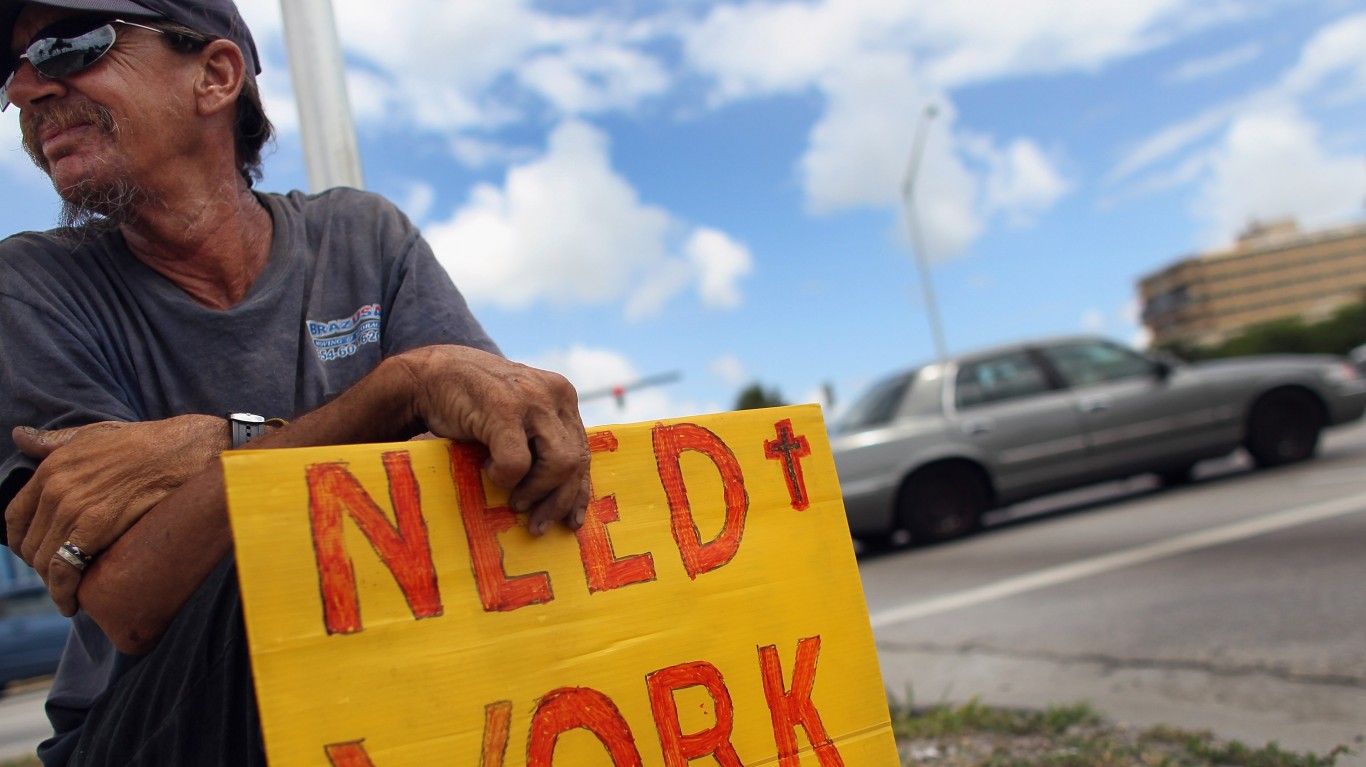
Slow or negative GDP growth are not the only indicators of poor economic conditions in many of the counties on this list. In most of these counties, the annual unemployment rate is higher than the comparable 3.9% national rate. Additionally, In the vast majority of counties on this list, the typical household earns less than the median income across the state as a whole.
Such conditions may be pushing people out of these areas and contributing to population decline — the vast majority of counties on this list are home to fewer people today than they were five years ago. Here is a look at the fastest shrinking county in every state.
Click here to see the fastest shrinking local economy in every state
Click here to see the fastest growing economies in every state
Click here to read our methodology
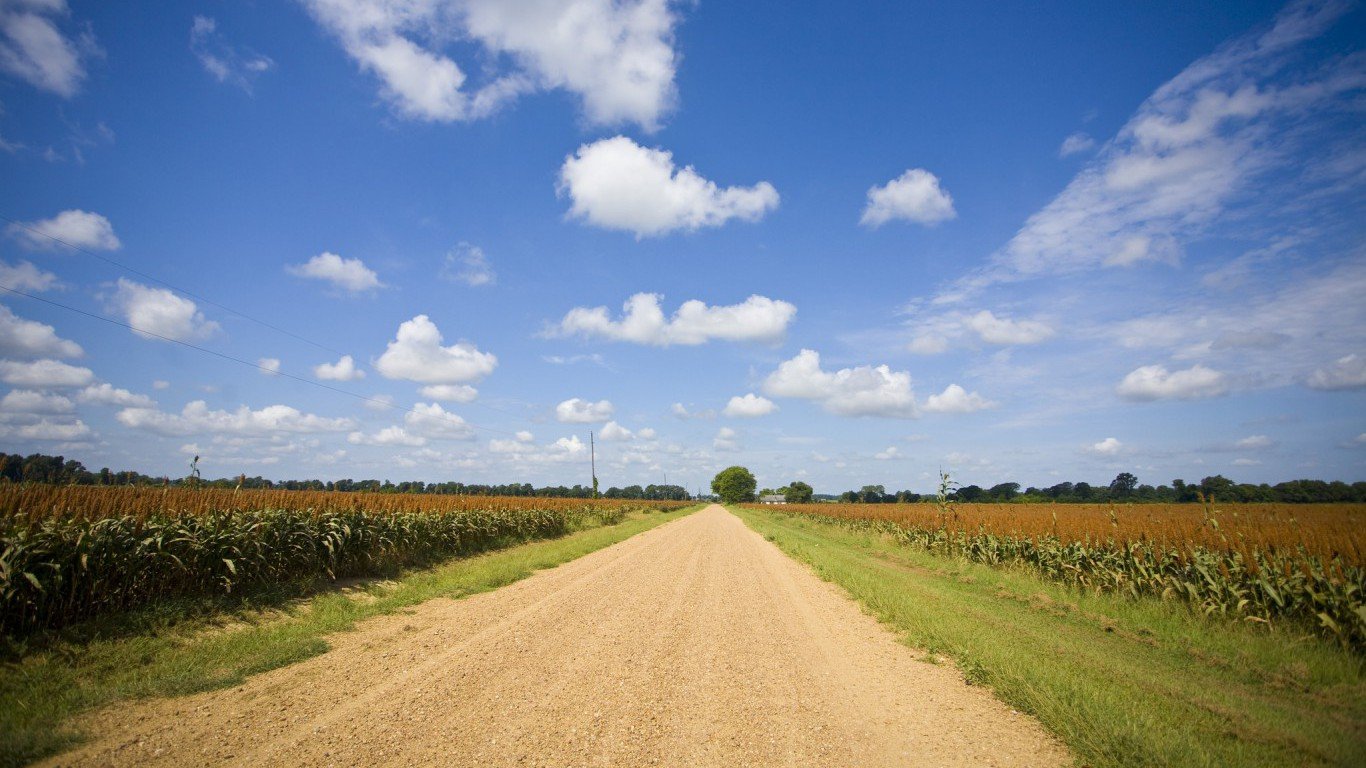
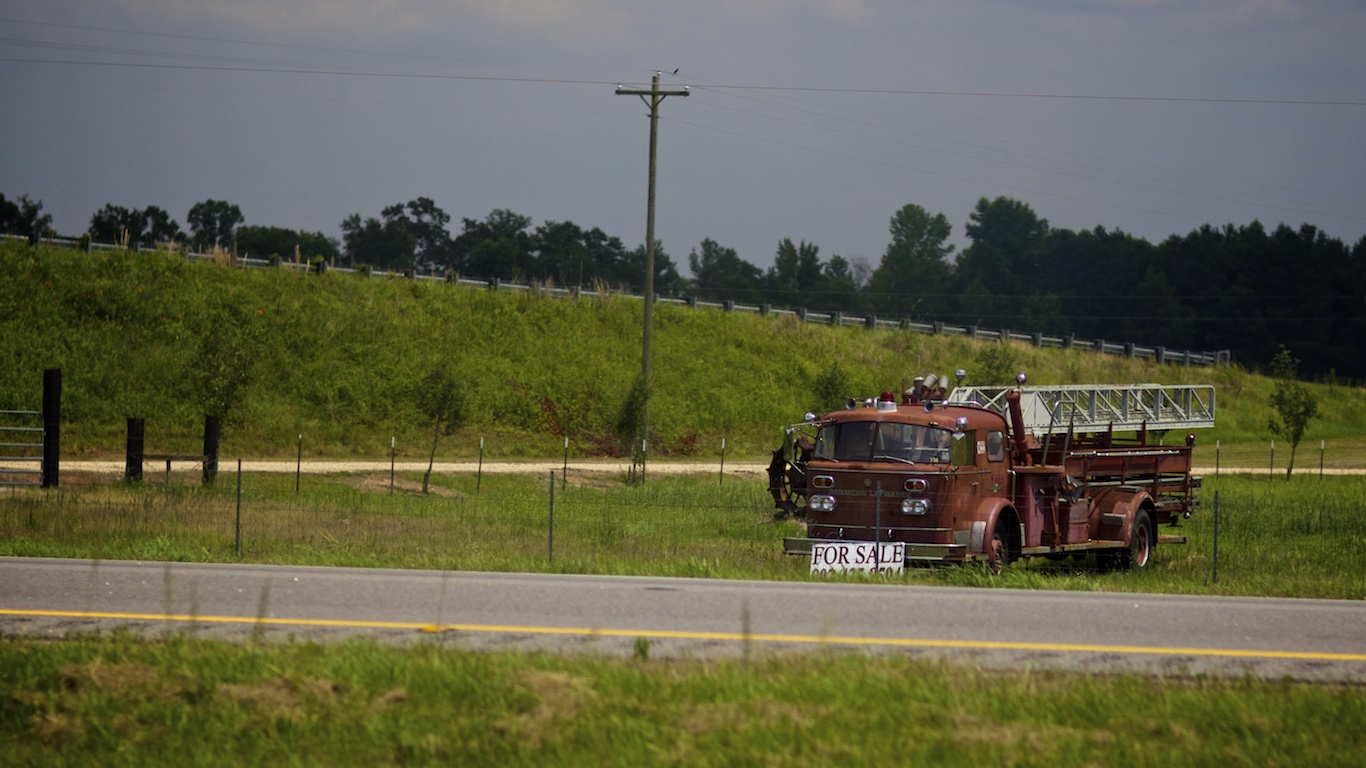
1. Alabama: Lawrence County
> GDP change 2013-2018: -29.5% (county) +5.5% (state)
> 2018 county GDP: $563.2 million (0.3% of state GDP)
> Fastest shrinking industry: Manufacturing (-75.2% GDP change)
> Unemployment change 2013-2018: -4.1 ppt. (8.3% to 4.2%)
> Median household income: $44,515 (county) $48,486 (state)
> Largest place in county: Moulton
[in-text-ad]
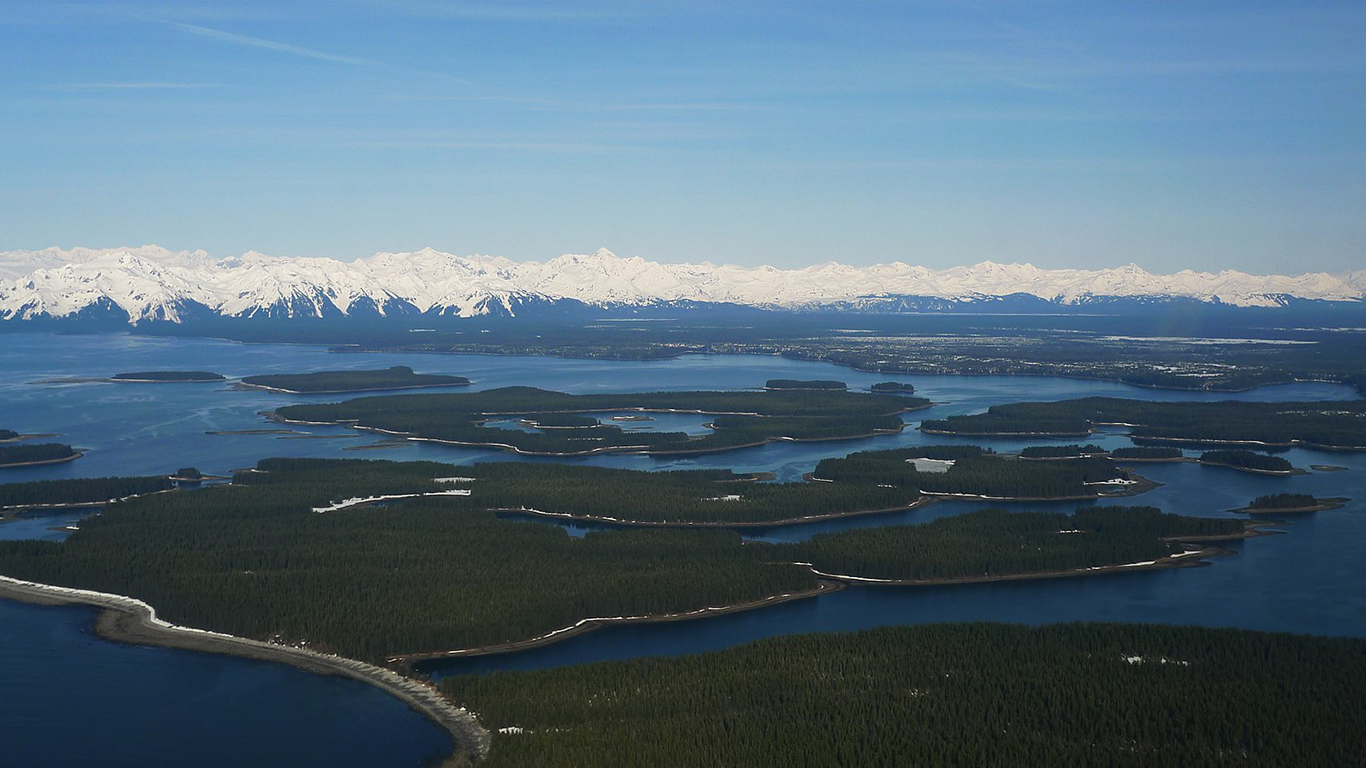
2. Alaska: Yakutat City and Borough
> GDP change 2013-2018: -33.9% (county) -3.0% (state)
> 2018 county GDP: $28.4 million (0.1% of state GDP)
> Fastest shrinking industry: Educational services
> Unemployment change 2013-2018: -1.3 ppt. (9.5% to 8.2%)
> Median household income: $65,833 (county) $76,715 (state)
> Largest place in county: Yakutat
[recirclink id=569954]
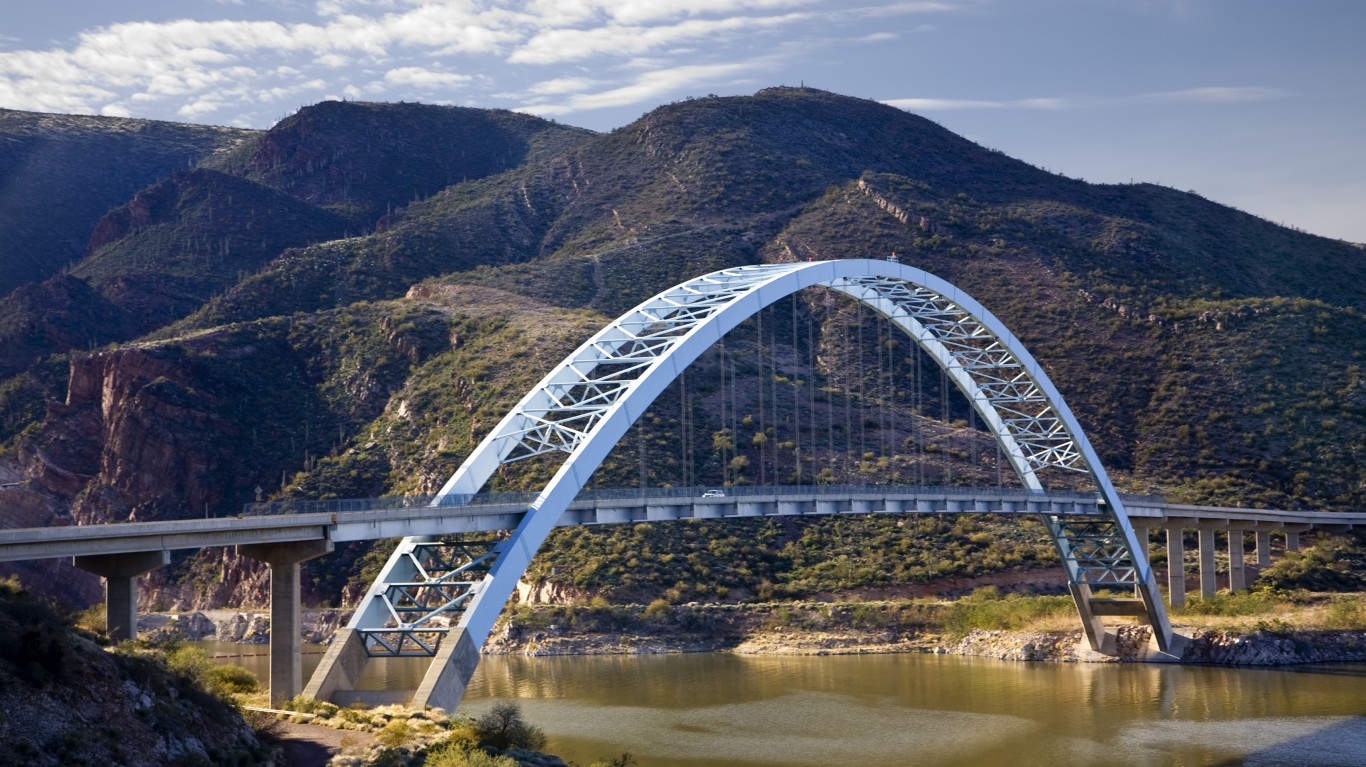
3. Arizona: Gila County
> GDP change 2013-2018: -7.9% (county) +15.4% (state)
> 2018 county GDP: $2.0 billion (0.6% of state GDP)
> Fastest shrinking industry: Finance and insurance
> Unemployment change 2013-2018: -3.7 ppt. (9.6% to 5.9%)
> Median household income: $42,092 (county) $56,213 (state)
> Largest place in county: Payson
4. Arkansas: Lee County
> GDP change 2013-2018: -31.5% (county) +4.9% (state)
> 2018 county GDP: $178.1 million (0.2% of state GDP)
> Fastest shrinking industry: Agriculture, forestry, fishing and hunting
> Unemployment change 2013-2018: -4.5 ppt. (9.3% to 4.8%)
> Median household income: $28,367 (county) $45,726 (state)
> Largest place in county: Marianna
[in-text-ad-2]
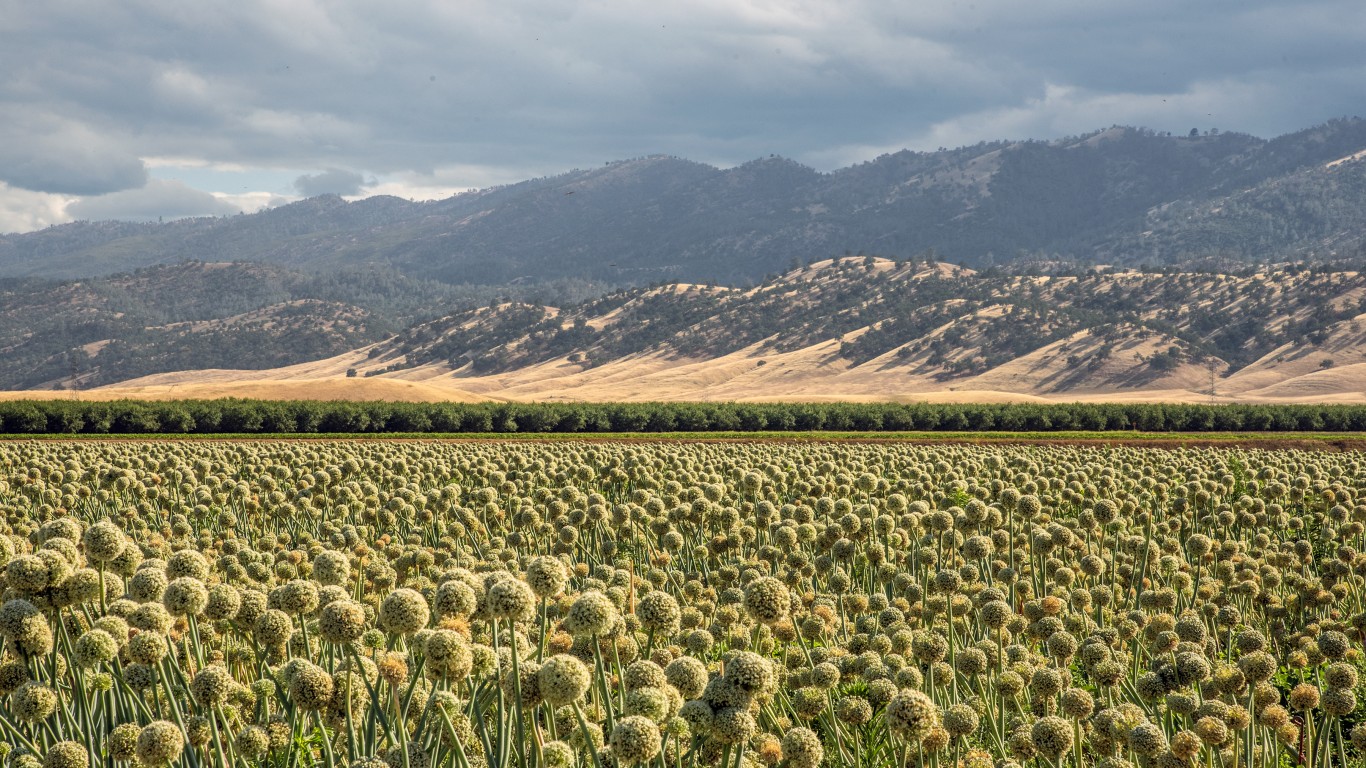
5. California: Colusa County
> GDP change 2013-2018: +5.3% (county) +22.5% (state)
> 2018 county GDP: $1.7 billion (0.1% of state GDP)
> Fastest shrinking industry: Administrative and support and waste management and remediation services
> Unemployment change 2013-2018: -6.0 ppt. (18.9% to 12.9%)
> Median household income: $56,704 (county) $71,228 (state)
> Largest place in county: Colusa
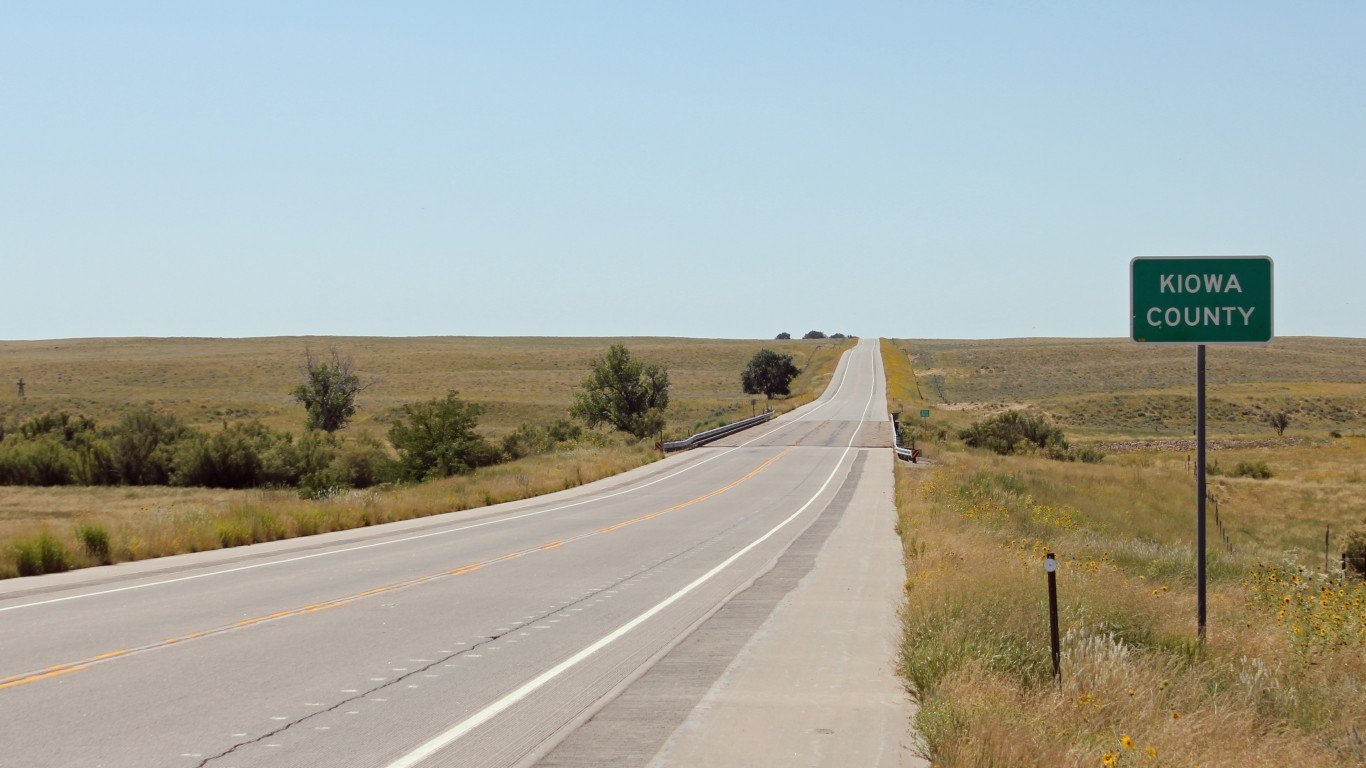
6. Colorado: Kiowa County
> GDP change 2013-2018: -25.4% (county) +20.7% (state)
> 2018 county GDP: $73.8 million (0.0% of state GDP)
> Fastest shrinking industry: Agriculture, forestry, fishing and hunting
> Unemployment change 2013-2018: -2.7 ppt. (4.5% to 1.8%)
> Median household income: $39,784 (county) $68,811 (state)
> Largest place in county: Eads
[in-text-ad]
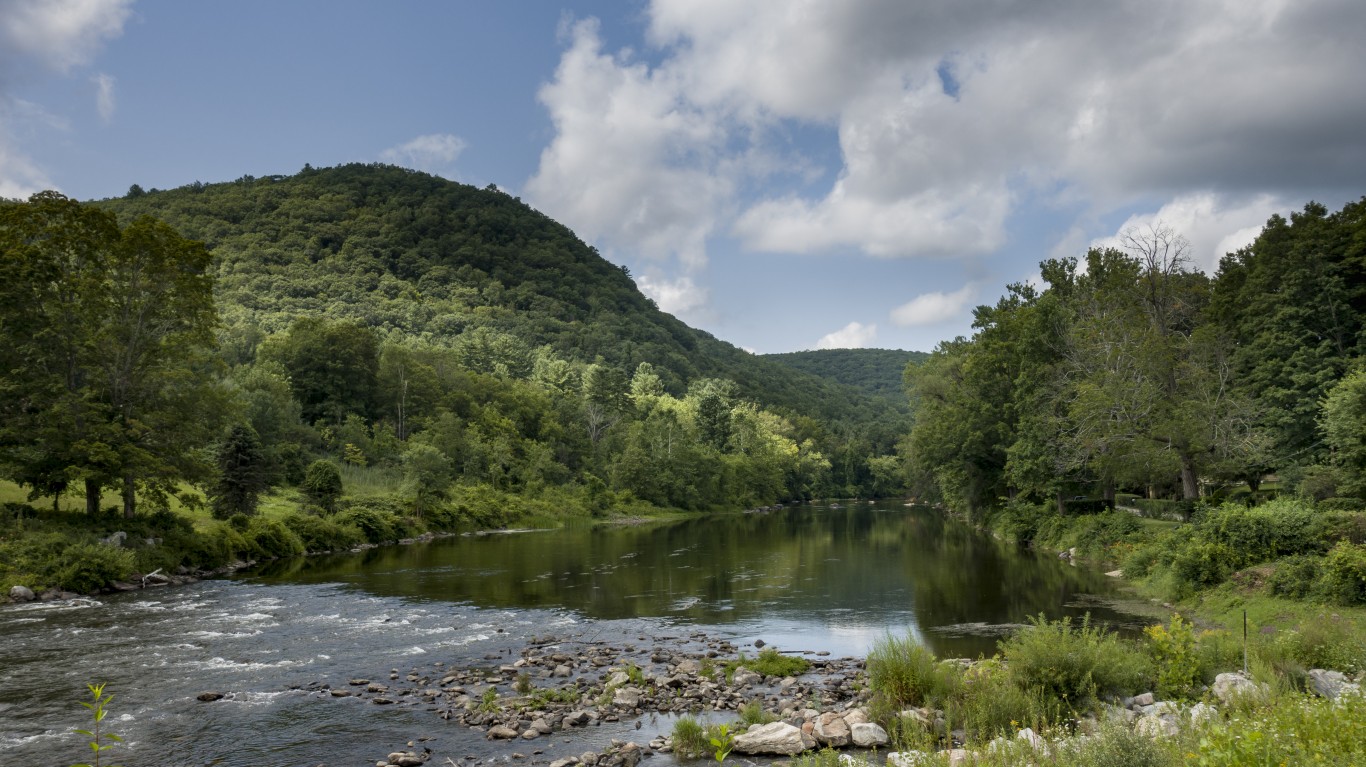
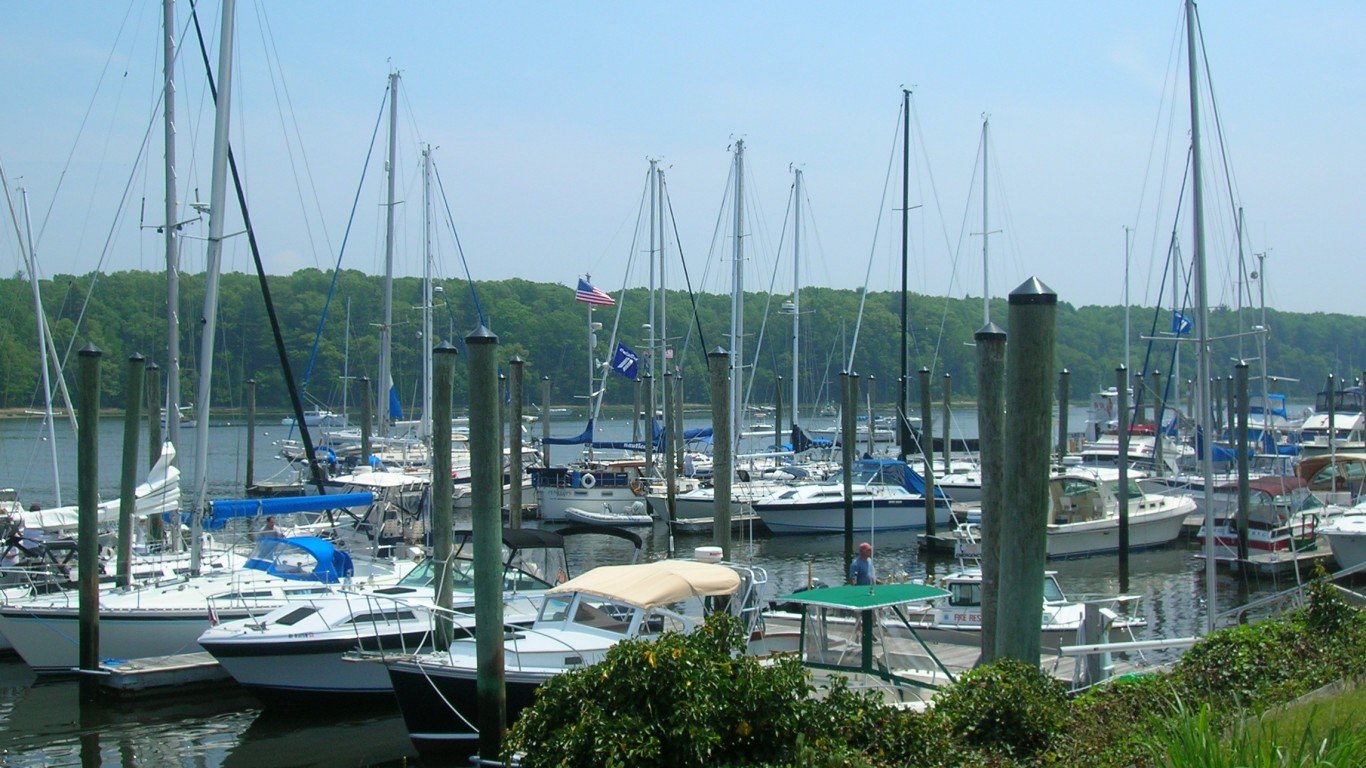
7. Connecticut: Litchfield County
> GDP change 2013-2018: -3.6% (county) +1.6% (state)
> 2018 county GDP: $7.7 billion (3.1% of state GDP)
> Fastest shrinking industry: Arts, entertainment, and recreation
> Unemployment change 2013-2018: -3.3 ppt. (7.1% to 3.8%)
> Median household income: $78,314 (county) $76,106 (state)
> Largest place in county: Torrington
[recirclink id=563869]

8. Delaware: New Castle County
> GDP change 2013-2018: -0.7% (county) +6.1% (state)
> 2018 county GDP: $42.5 billion (67.7% of state GDP)
> Fastest shrinking industry: Information
> Unemployment change 2013-2018: -2.8 ppt. (6.5% to 3.7%)
> Median household income: $70,996 (county) $65,627 (state)
> Largest place in county: Wilmington
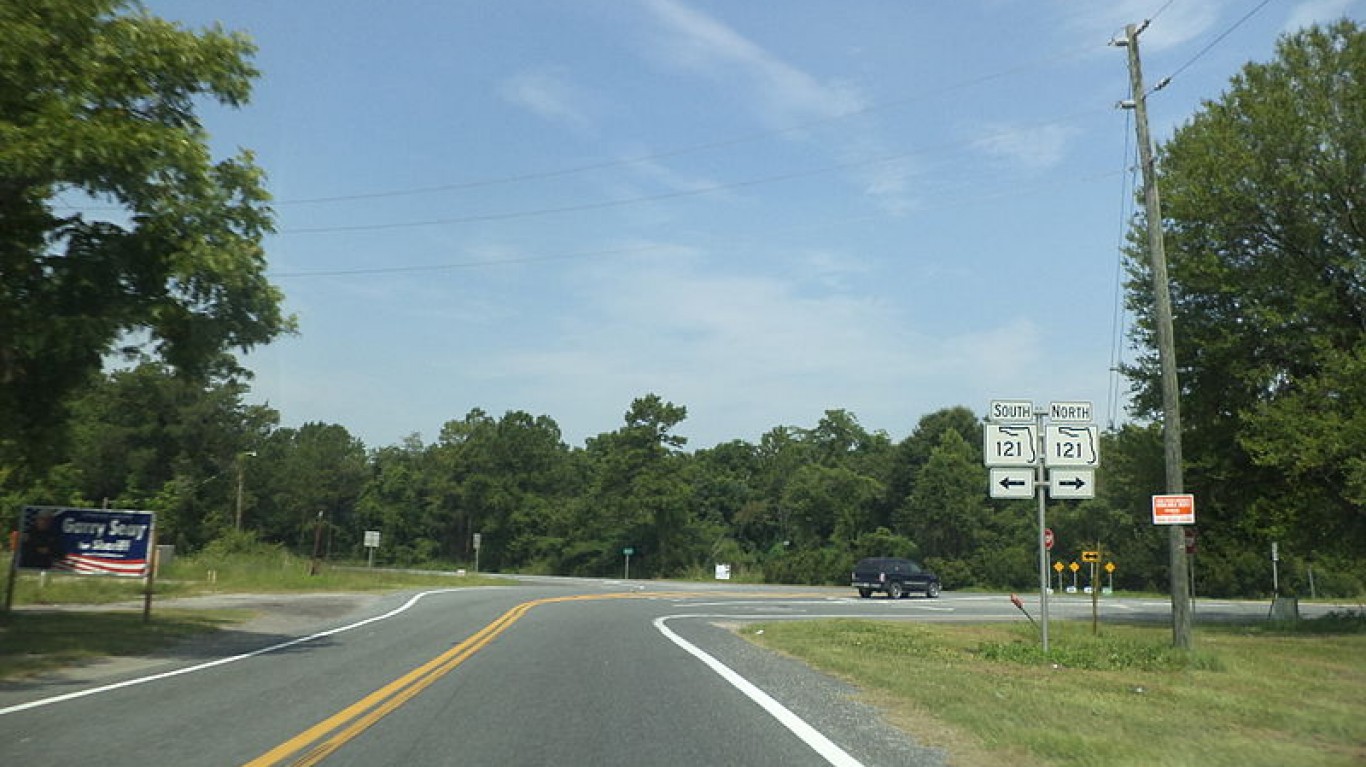
9. Florida: Union County
> GDP change 2013-2018: -4.7% (county) +18.0% (state)
> 2018 county GDP: $299.2 million (0.0% of state GDP)
> Fastest shrinking industry: Mining, quarrying, and oil and gas extraction
> Unemployment change 2013-2018: -2.9 ppt. (6.3% to 3.4%)
> Median household income: $41,770 (county) $53,267 (state)
> Largest place in county: Lake Butler
[in-text-ad-2]
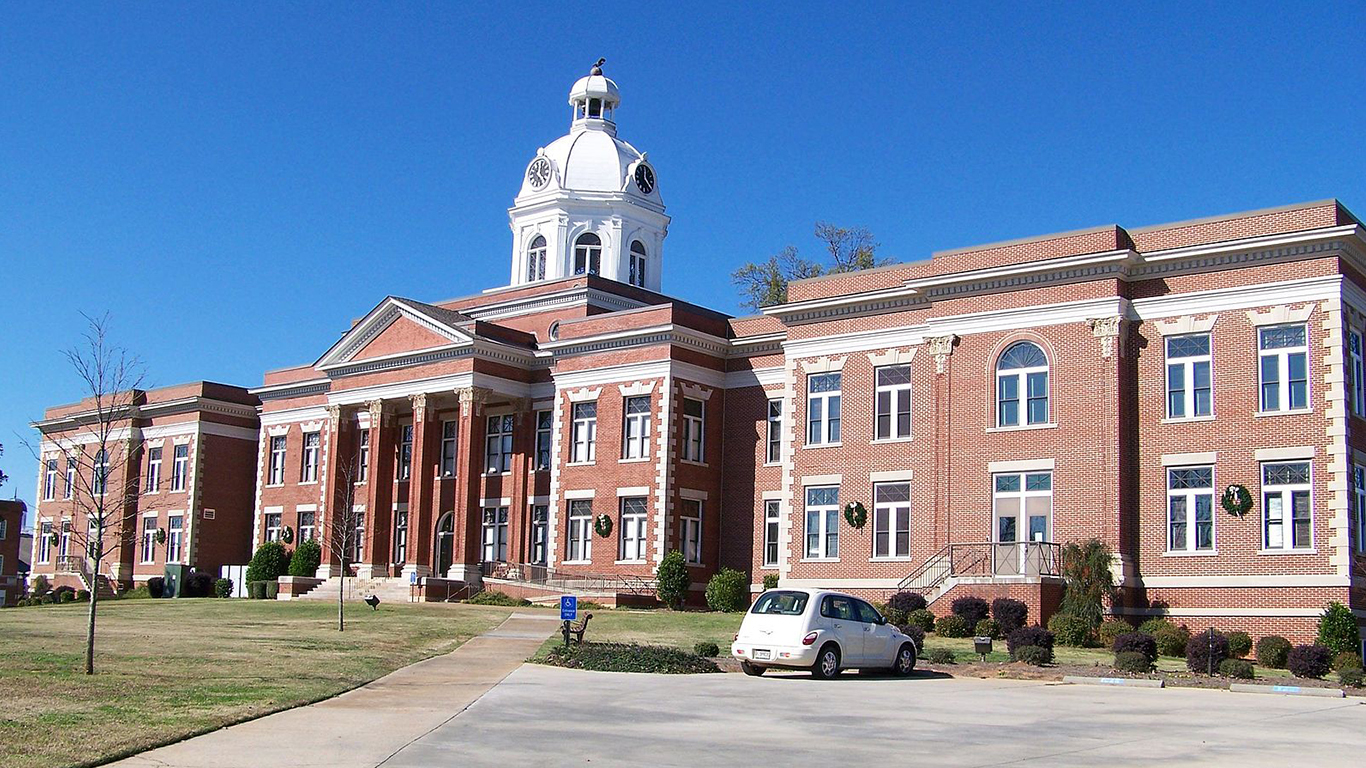
10. Georgia: Putnam County
> GDP change 2013-2018: -25.5% (county) +17.4% (state)
> 2018 county GDP: $445.7 million (0.1% of state GDP)
> Fastest shrinking industry: Utilities
> Unemployment change 2013-2018: -5.3 ppt. (10.3% to 5.0%)
> Median household income: $51,245 (county) $55,679 (state)
> Largest place in county: Eatonton

11. Hawaii: Honolulu County
> GDP change 2013-2018: +9.2% (county) +11.3% (state)
> 2018 county GDP: $61.1 billion (73.9% of state GDP)
> Fastest shrinking industry: Utilities
> Unemployment change 2013-2018: -2.1 ppt. (4.4% to 2.3%)
> Median household income: $82,906 (county) $78,084 (state)
> Largest place in county: Honolulu
[in-text-ad]
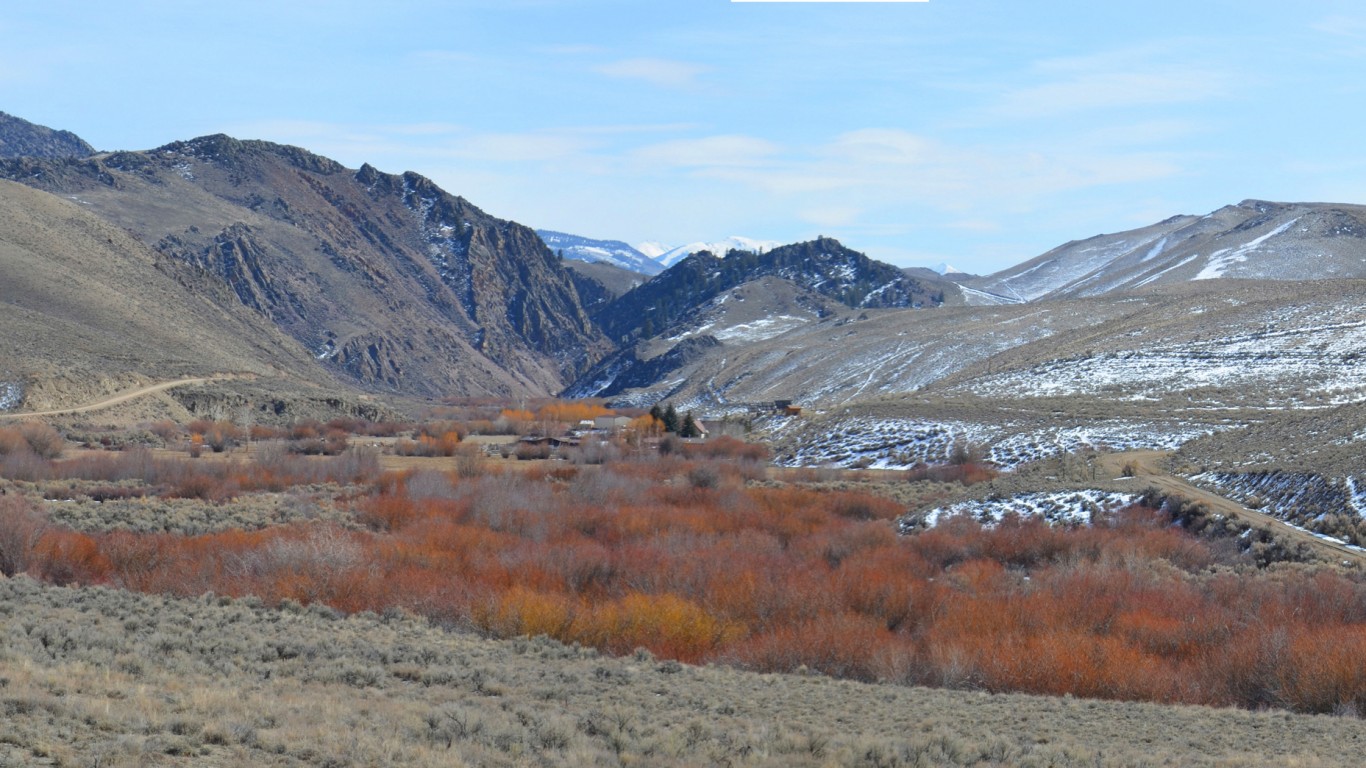
12. Idaho: Custer County
> GDP change 2013-2018: -40.3% (county) +17.8% (state)
> 2018 county GDP: $177.3 million (0.3% of state GDP)
> Fastest shrinking industry: Mining, quarrying, and oil and gas extraction
> Unemployment change 2013-2018: -4.4 ppt. (8.4% to 4.0%)
> Median household income: $39,957 (county) $53,089 (state)
> Largest place in county: Challis
[recirclink id=569002]
13. Illinois: Saline County
> GDP change 2013-2018: -26.6% (county) +6.2% (state)
> 2018 county GDP: $849.8 million (0.1% of state GDP)
> Fastest shrinking industry: Mining, quarrying, and oil and gas extraction
> Unemployment change 2013-2018: -4.1 ppt. (10.6% to 6.5%)
> Median household income: $41,167 (county) $63,575 (state)
> Largest place in county: Harrisburg
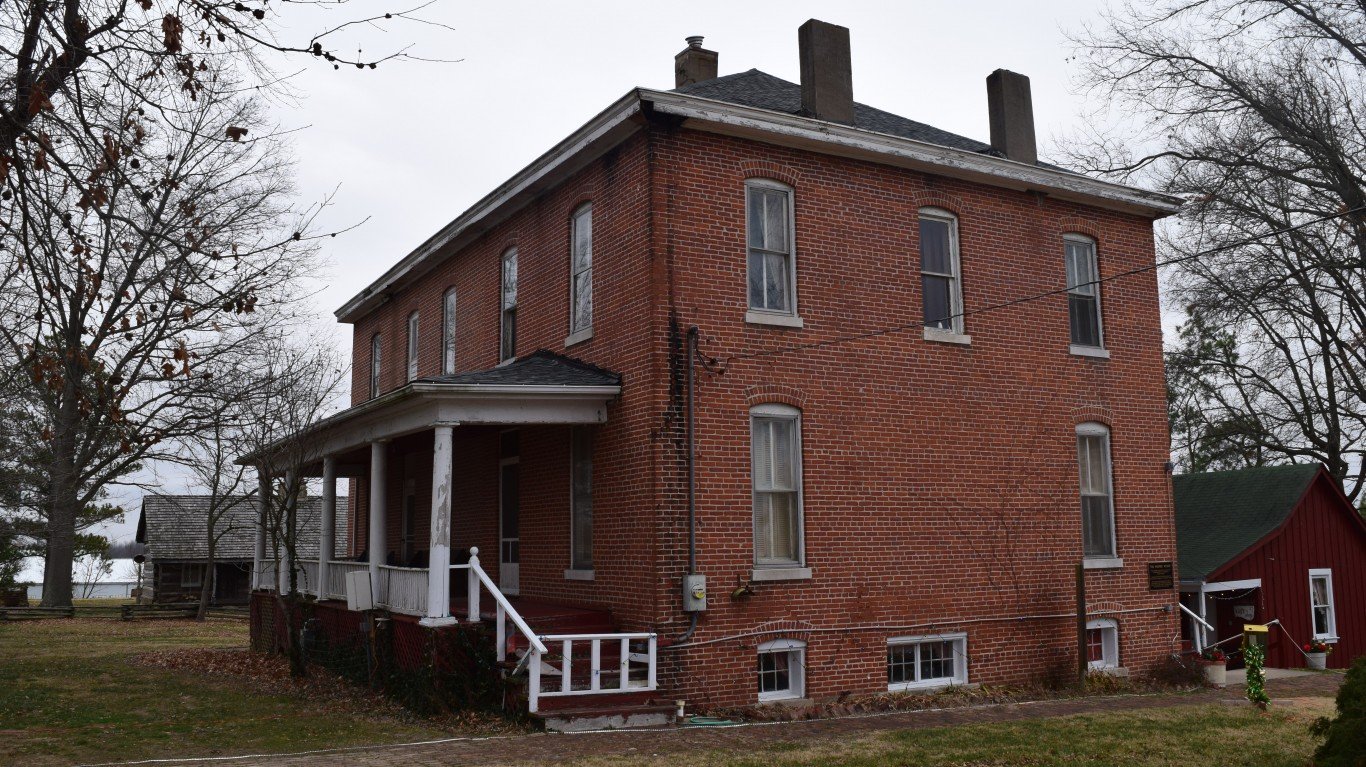
14. Indiana: Pike County
> GDP change 2013-2018: -25.4% (county) +8.4% (state)
> 2018 county GDP: $690.5 million (0.2% of state GDP)
> Fastest shrinking industry: Mining, quarrying, and oil and gas extraction
> Unemployment change 2013-2018: -3.3 ppt. (6.8% to 3.5%)
> Median household income: $52,527 (county) $54,325 (state)
> Largest place in county: Petersburg
[in-text-ad-2]
15. Iowa: Fremont County
> GDP change 2013-2018: -30.0% (county) +9.9% (state)
> 2018 county GDP: $241.3 million (0.1% of state GDP)
> Fastest shrinking industry: Agriculture, forestry, fishing and hunting
> Unemployment change 2013-2018: -2.3 ppt. (4.2% to 1.9%)
> Median household income: $54,281 (county) $58,580 (state)
> Largest place in county: Hamburg
16. Kansas: Sheridan County
> GDP change 2013-2018: -30.3% (county) +10.0% (state)
> 2018 county GDP: $131.9 million (0.1% of state GDP)
> Fastest shrinking industry: Agriculture, forestry, fishing and hunting
> Unemployment change 2013-2018: -0.4 ppt. (2.7% to 2.3%)
> Median household income: $56,071 (county) $57,422 (state)
> Largest place in county: Hoxie
[in-text-ad]
17. Kentucky: Union County
> GDP change 2013-2018: -37.3% (county) +4.4% (state)
> 2018 county GDP: $593.5 million (0.3% of state GDP)
> Fastest shrinking industry: Agriculture, forestry, fishing and hunting
> Unemployment change 2013-2018: -2.7 ppt. (7.7% to 5.0%)
> Median household income: $42,844 (county) $48,392 (state)
> Largest place in county: Morganfield
[recirclink id=531165]
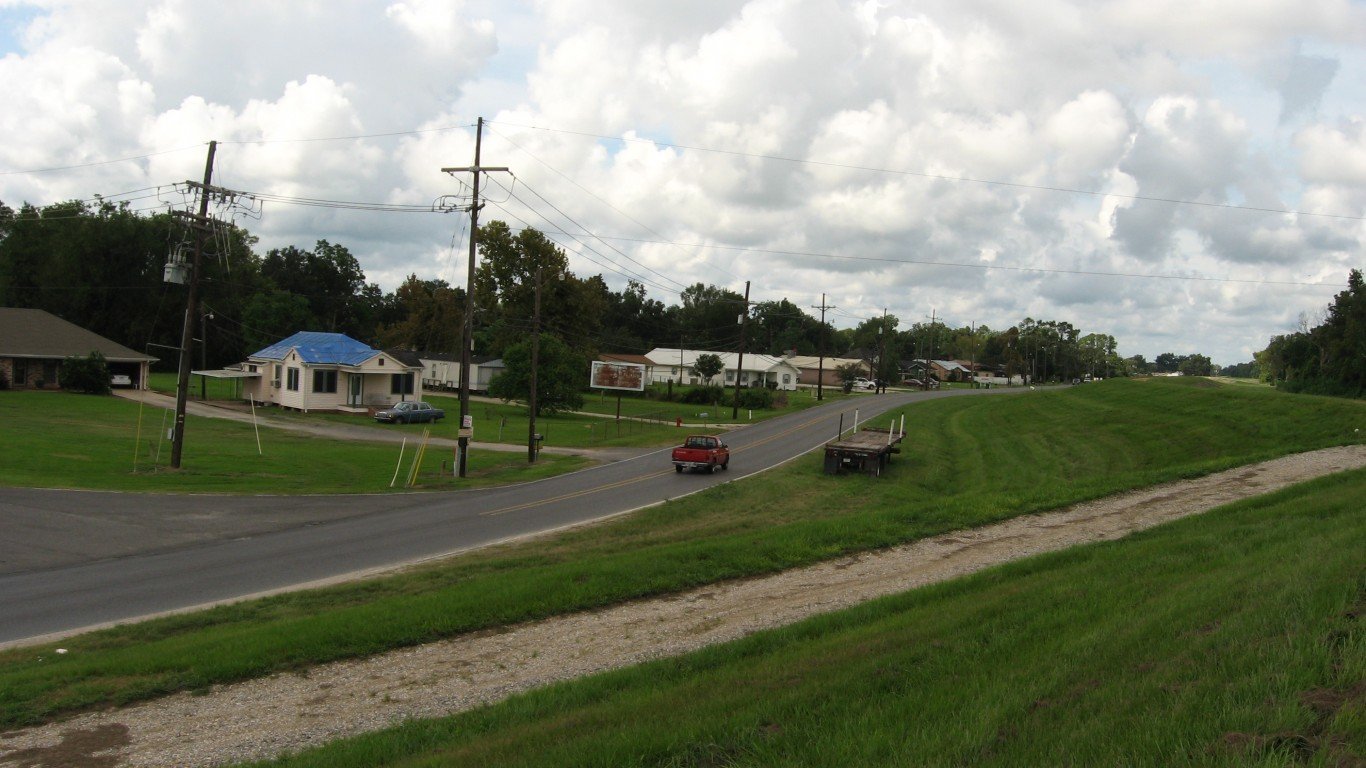
18. Louisiana: St. John the Baptist Parish
> GDP change 2013-2018: -38.8% (county) +4.7% (state)
> 2018 county GDP: $2.4 billion (1.0% of state GDP)
> Fastest shrinking industry: Transportation and warehousing
> Unemployment change 2013-2018: -3.0 ppt. (8.7% to 5.7%)
> Median household income: $54,821 (county) $47,942 (state)
> Largest place in county: Laplace
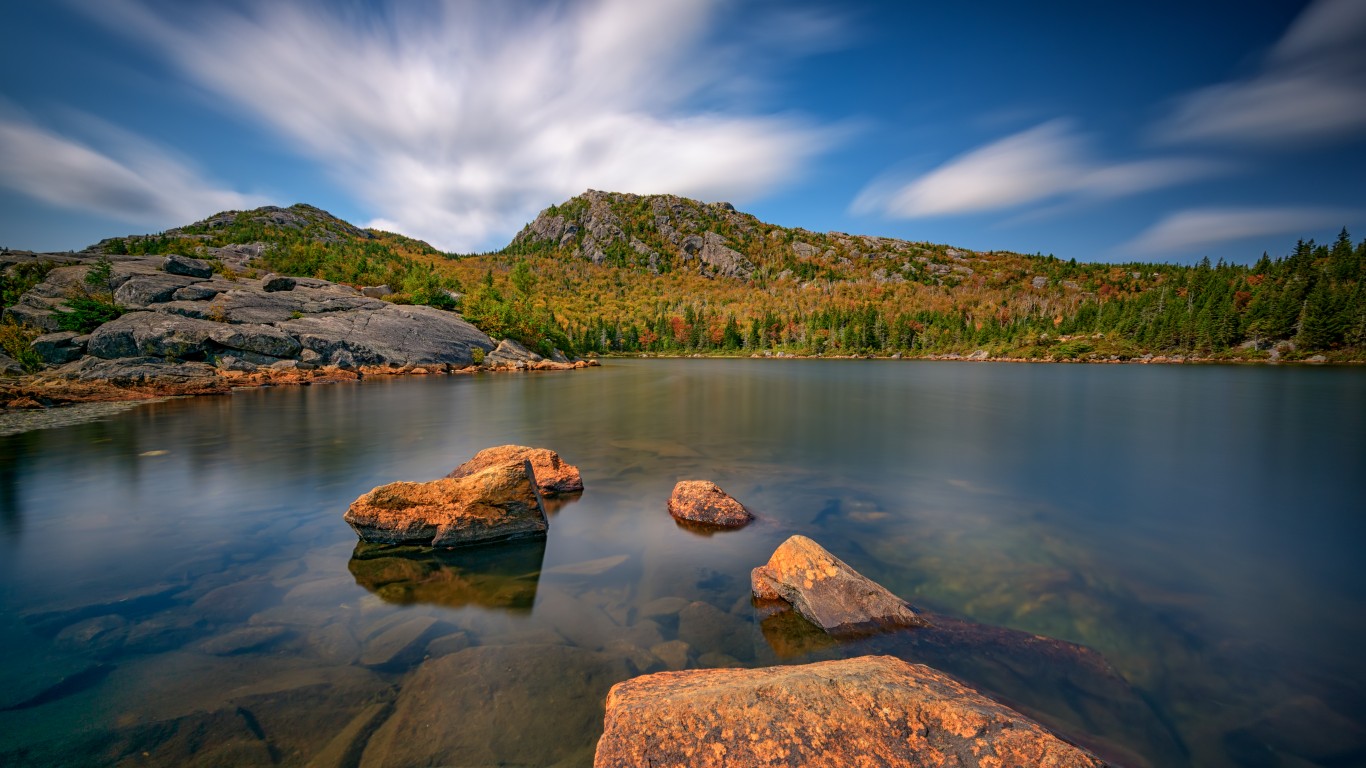
19. Maine: Franklin County
> GDP change 2013-2018: -3.0% (county) +9.4% (state)
> 2018 county GDP: $985.0 million (1.7% of state GDP)
> Fastest shrinking industry: Manufacturing
> Unemployment change 2013-2018: -3.7 ppt. (7.7% to 4.0%)
> Median household income: $48,053 (county) $55,425 (state)
> Largest place in county: Farmington
[in-text-ad-2]
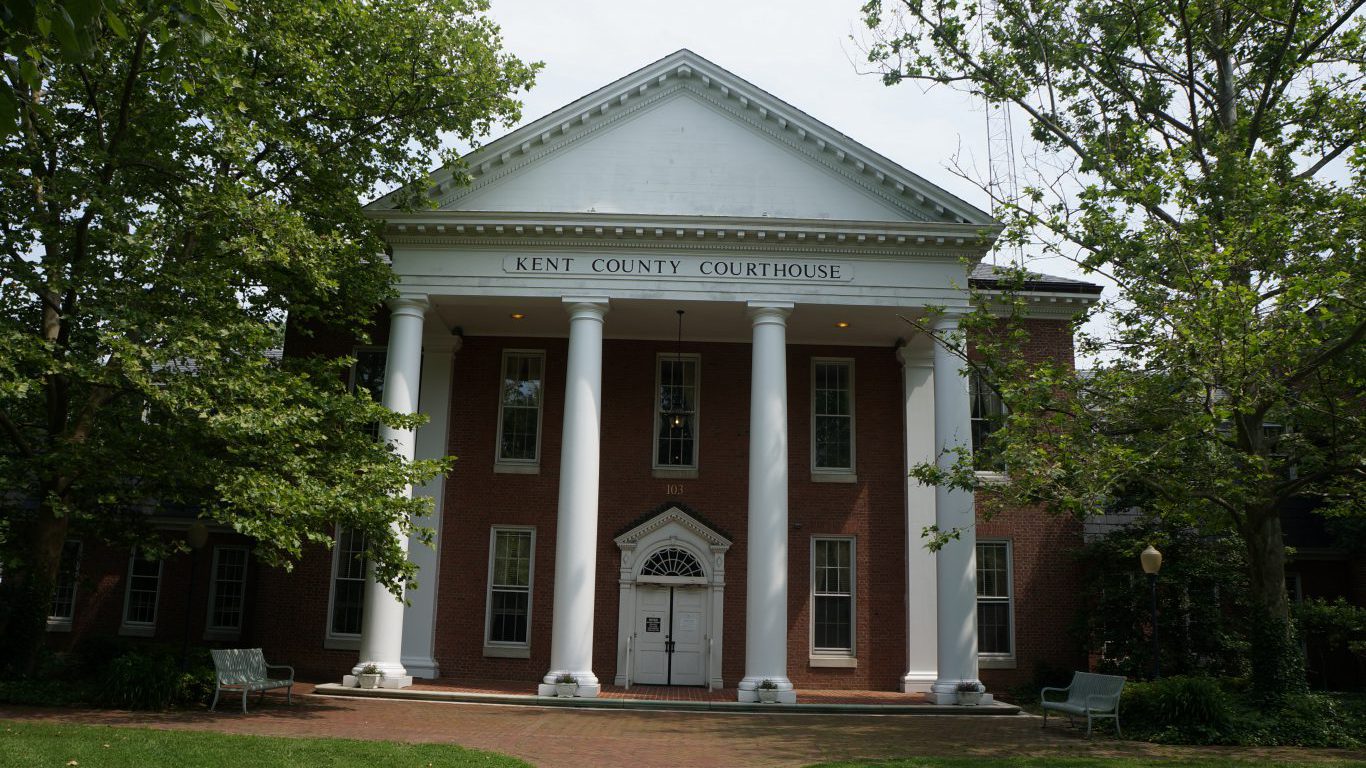
20. Maryland: Kent County
> GDP change 2013-2018: -1.9% (county) +10.1% (state)
> 2018 county GDP: $831.8 million (0.2% of state GDP)
> Fastest shrinking industry: Mining, quarrying, and oil and gas extraction
> Unemployment change 2013-2018: -2.9 ppt. (7.2% to 4.3%)
> Median household income: $56,009 (county) $81,868 (state)
> Largest place in county: Chestertown

21. Massachusetts: Berkshire County
> GDP change 2013-2018: +5.8% (county) +13.8% (state)
> 2018 county GDP: $6.7 billion (1.3% of state GDP)
> Fastest shrinking industry: Utilities
> Unemployment change 2013-2018: -3.4 ppt. (7.4% to 4.0%)
> Median household income: $56,674 (county) $77,378 (state)
> Largest place in county: Pittsfield
[in-text-ad]
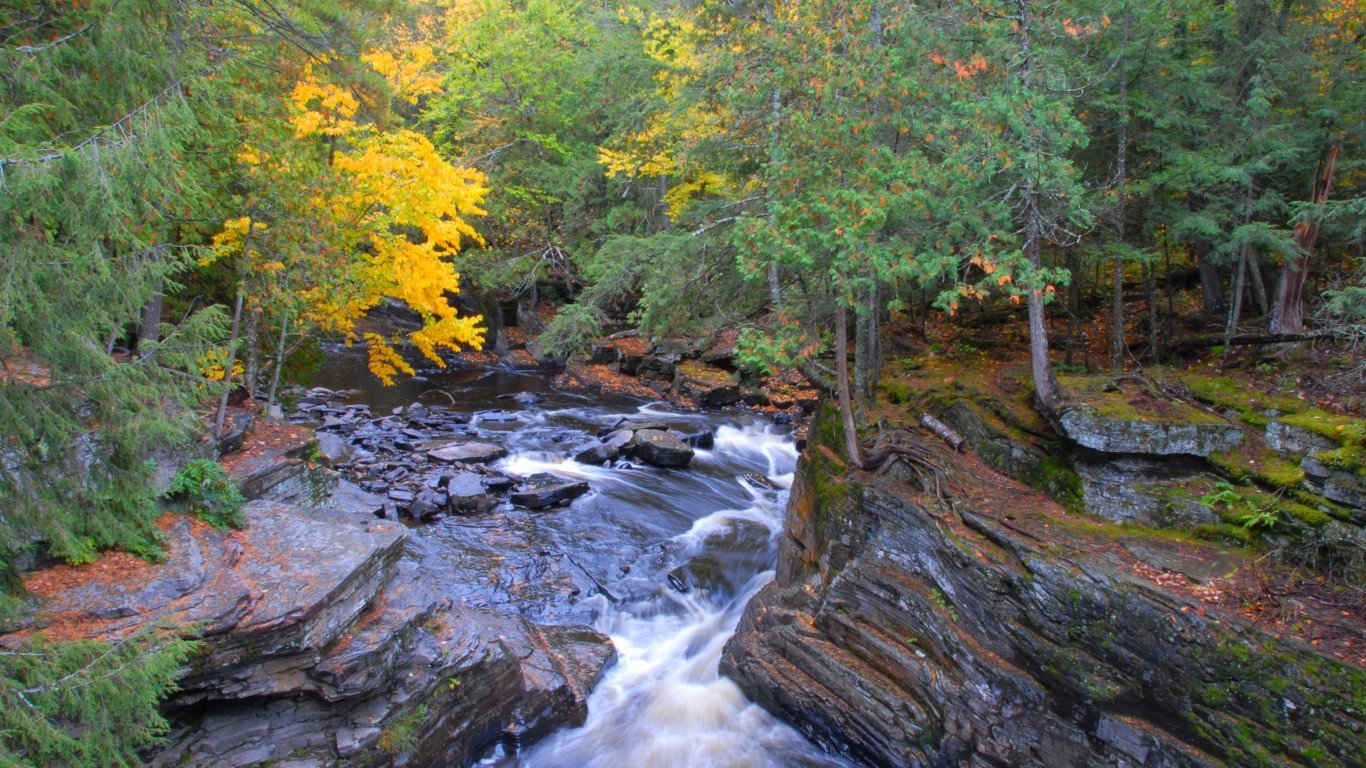
22. Michigan: Baraga County
> GDP change 2013-2018: -4.9% (county) +10.9% (state)
> 2018 county GDP: $259.1 million (0.1% of state GDP)
> Fastest shrinking industry: Wholesale trade
> Unemployment change 2013-2018: -8.4 ppt. (14.5% to 6.1%)
> Median household income: $42,444 (county) $54,938 (state)
> Largest place in county: Baraga
[recirclink id=569954]

23. Minnesota: Cook County
> GDP change 2013-2018: -20.5% (county) +11.1% (state)
> 2018 county GDP: $252.0 million (0.1% of state GDP)
> Fastest shrinking industry: Utilities
> Unemployment change 2013-2018: -2.3 ppt. (5.8% to 3.5%)
> Median household income: $52,271 (county) $68,411 (state)
> Largest place in county: Grand Marais
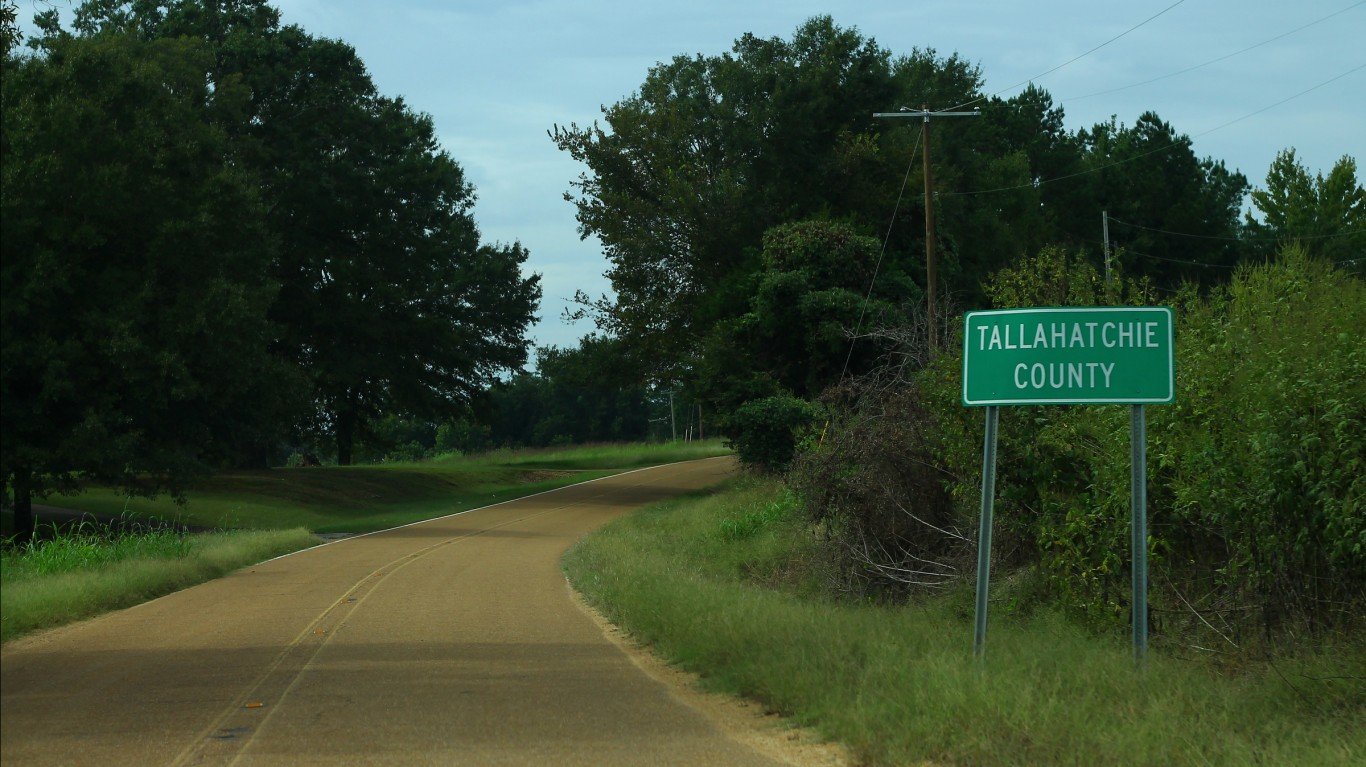
24. Mississippi: Tallahatchie County
> GDP change 2013-2018: -31.5% (county) +3.2% (state)
> 2018 county GDP: $224.6 million (0.2% of state GDP)
> Fastest shrinking industry: Agriculture, forestry, fishing and hunting
> Unemployment change 2013-2018: -5.8 ppt. (11.1% to 5.3%)
> Median household income: $30,028 (county) $43,567 (state)
> Largest place in county: Charleston
[in-text-ad-2]
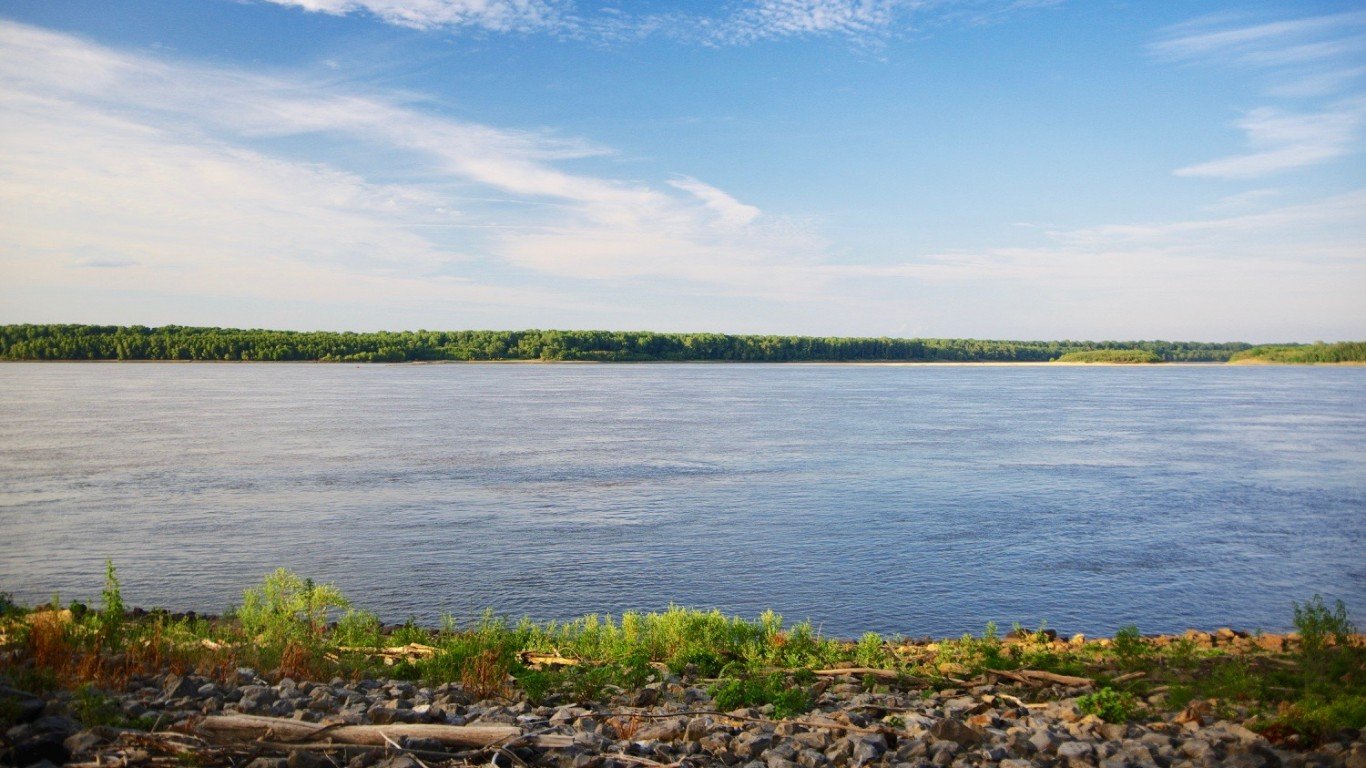
25. Missouri: Pemiscot County
> GDP change 2013-2018: -29.8% (county) +4.8% (state)
> 2018 county GDP: $423.6 million (0.1% of state GDP)
> Fastest shrinking industry: Mining, quarrying, and oil and gas extraction
> Unemployment change 2013-2018: -4.8 ppt. (10.3% to 5.5%)
> Median household income: $33,390 (county) $53,560 (state)
> Largest place in county: Caruthersville
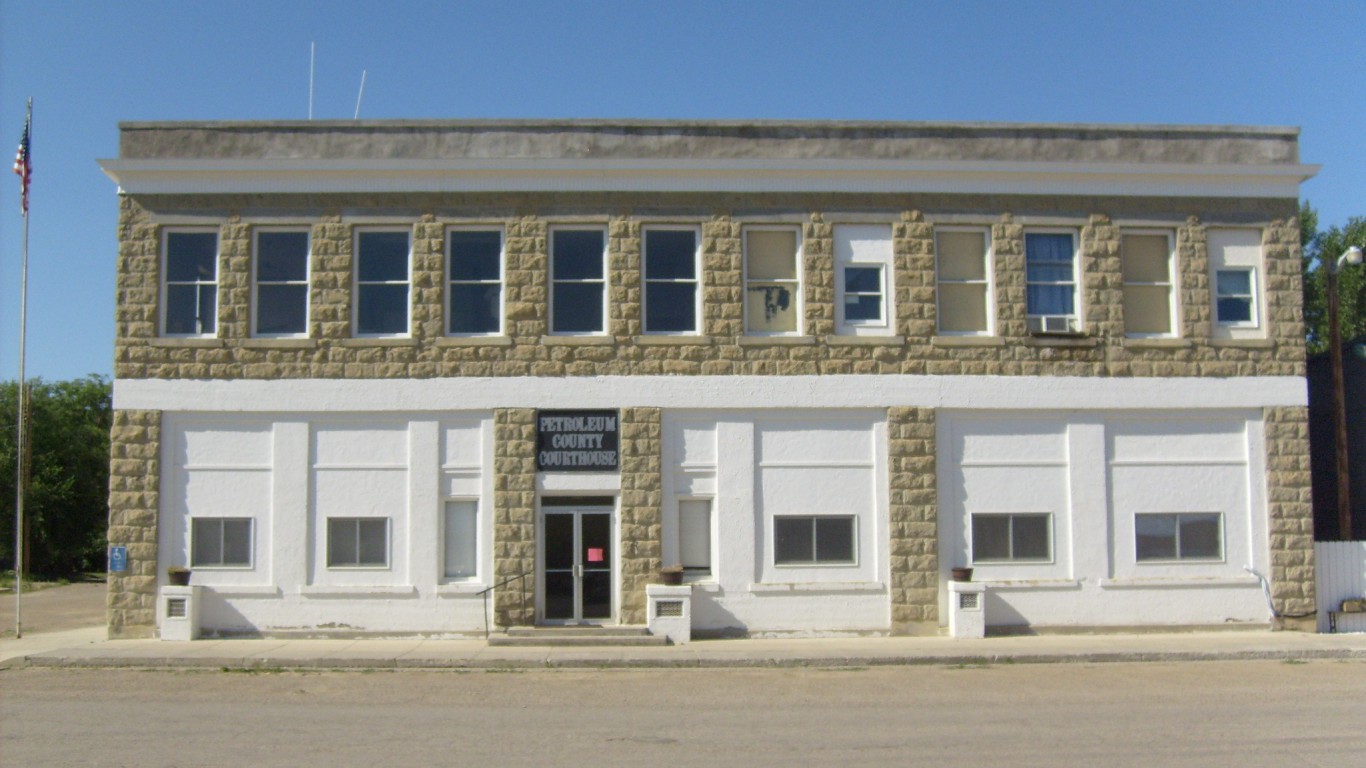
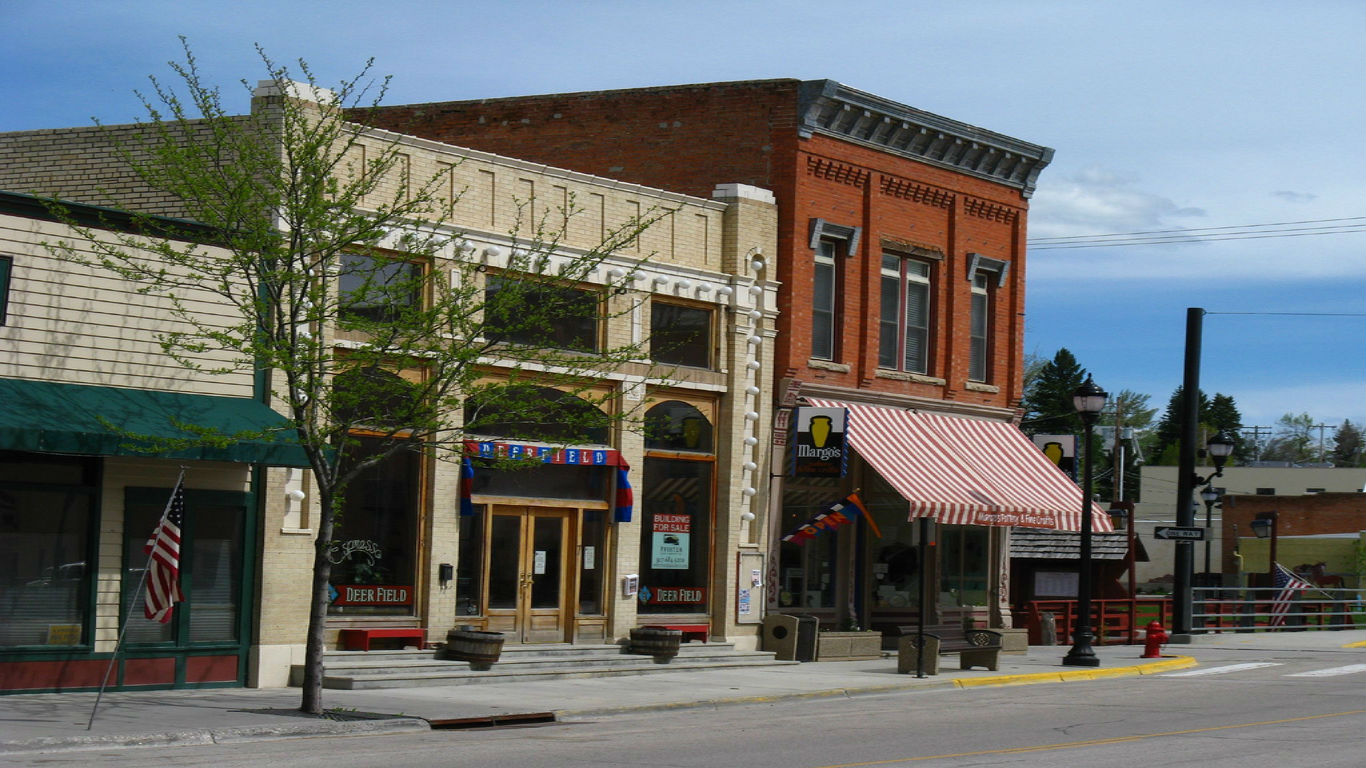
26. Montana: Petroleum County
> GDP change 2013-2018: -39.2% (county) +8.9% (state)
> 2018 county GDP: $22.5 million (0.0% of state GDP)
> Fastest shrinking industry: Mining, quarrying, and oil and gas extraction
> Unemployment change 2013-2018: -0.6 ppt. (4.8% to 4.2%)
> Median household income: $44,688 (county) $52,559 (state)
> Largest place in county: Winnett
[in-text-ad]
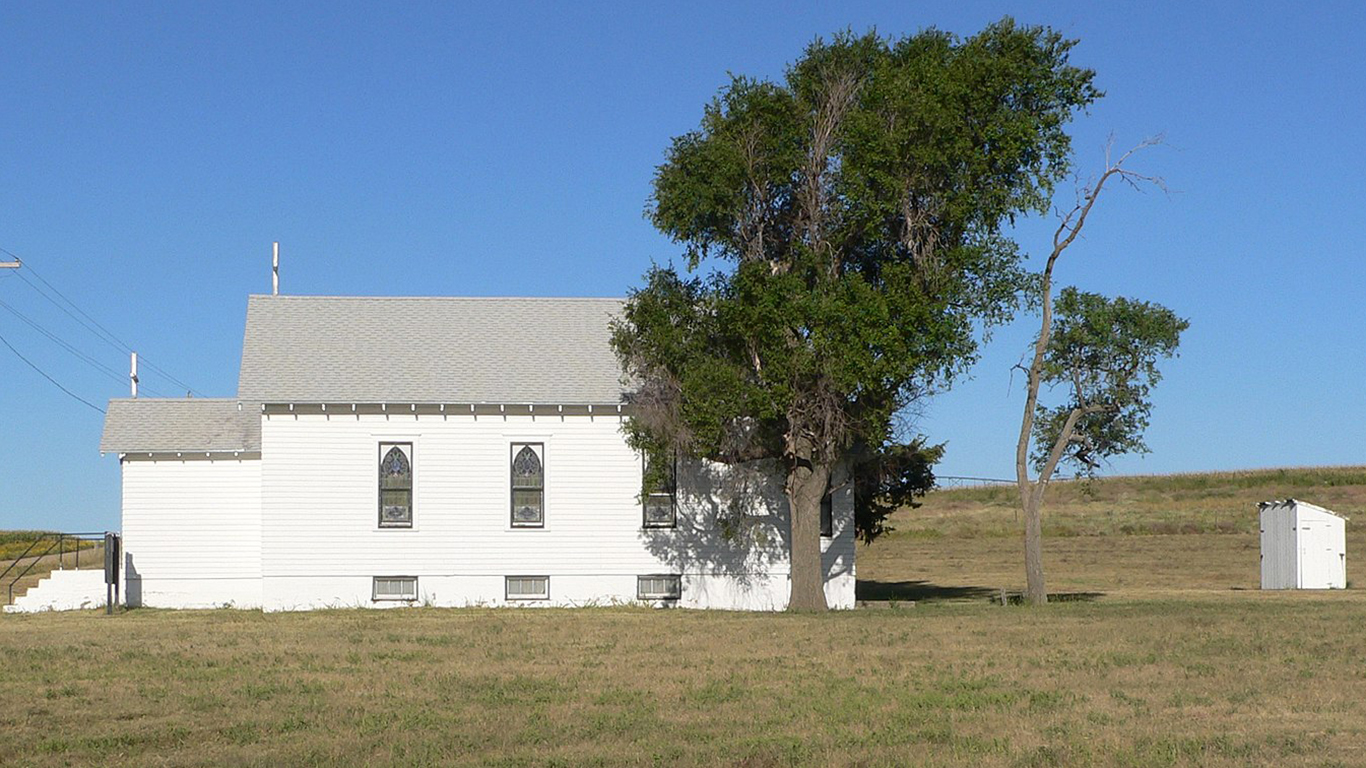
27. Nebraska: Hayes County
> GDP change 2013-2018: -36.9% (county) +8.7% (state)
> 2018 county GDP: $41.3 million (0.0% of state GDP)
> Fastest shrinking industry: Agriculture, forestry, fishing and hunting
> Unemployment change 2013-2018: -1.2 ppt. (3.4% to 2.2%)
> Median household income: $45,515 (county) $59,116 (state)
> Largest place in county: Hayes Center
[recirclink id=563869]
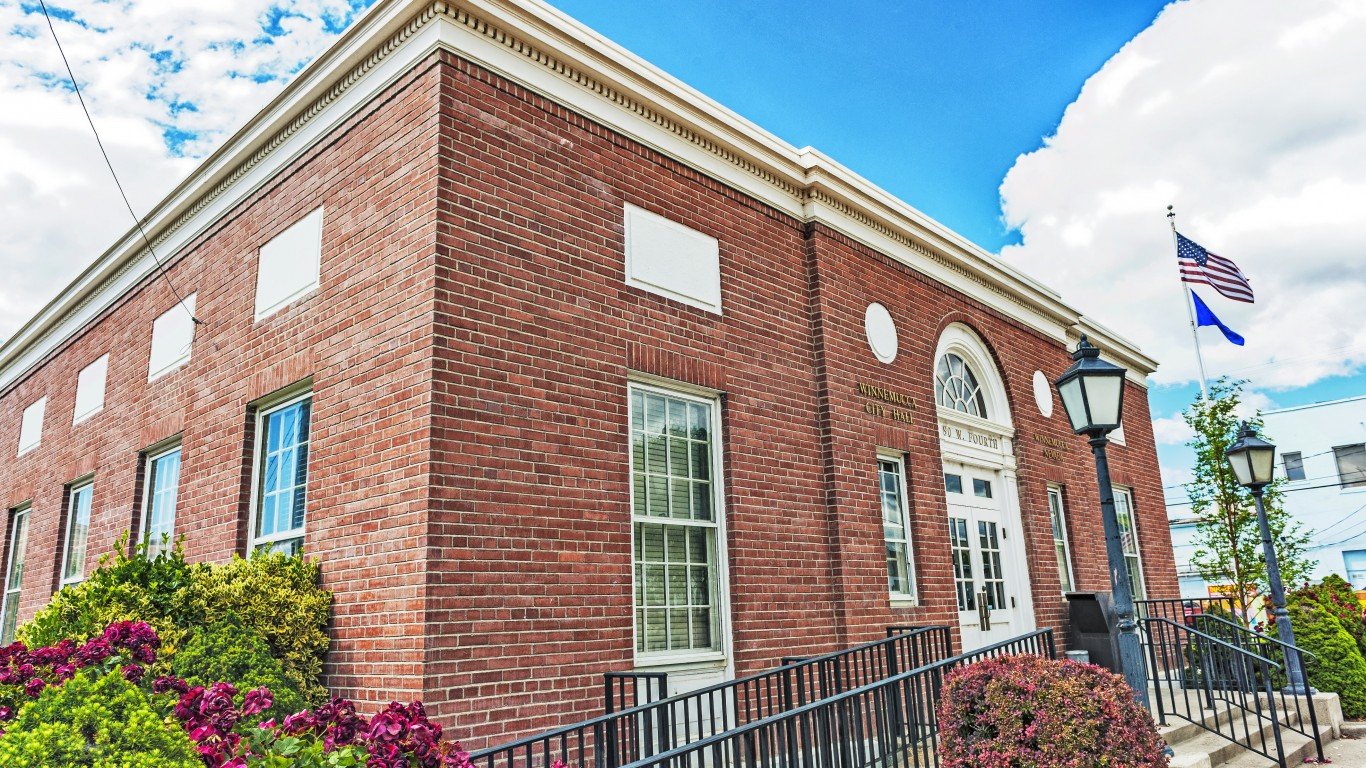
28. Nevada: Humboldt County
> GDP change 2013-2018: -17.8% (county) +16.8% (state)
> 2018 county GDP: $1.2 billion (0.8% of state GDP)
> Fastest shrinking industry: Construction
> Unemployment change 2013-2018: -2.8 ppt. (6.2% to 3.4%)
> Median household income: $70,373 (county) $57,598 (state)
> Largest place in county: Winnemucca
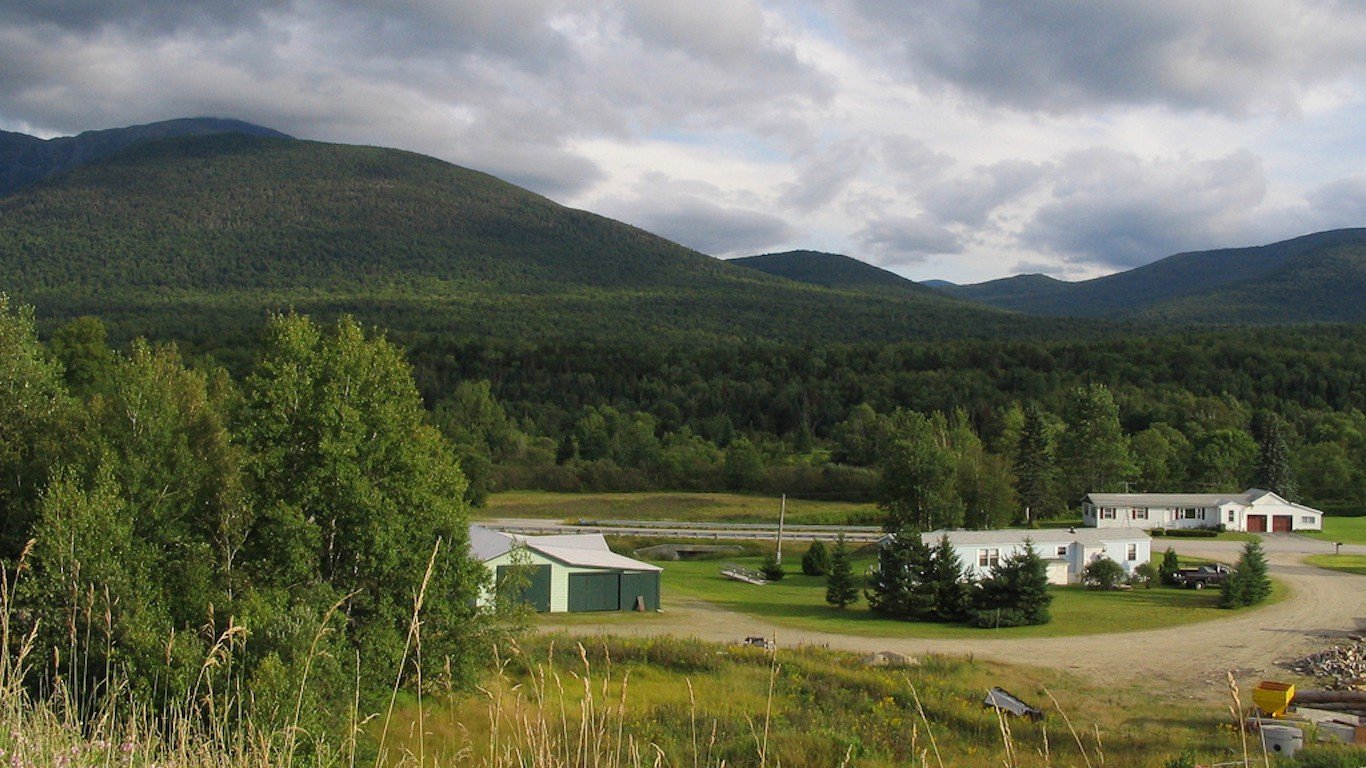
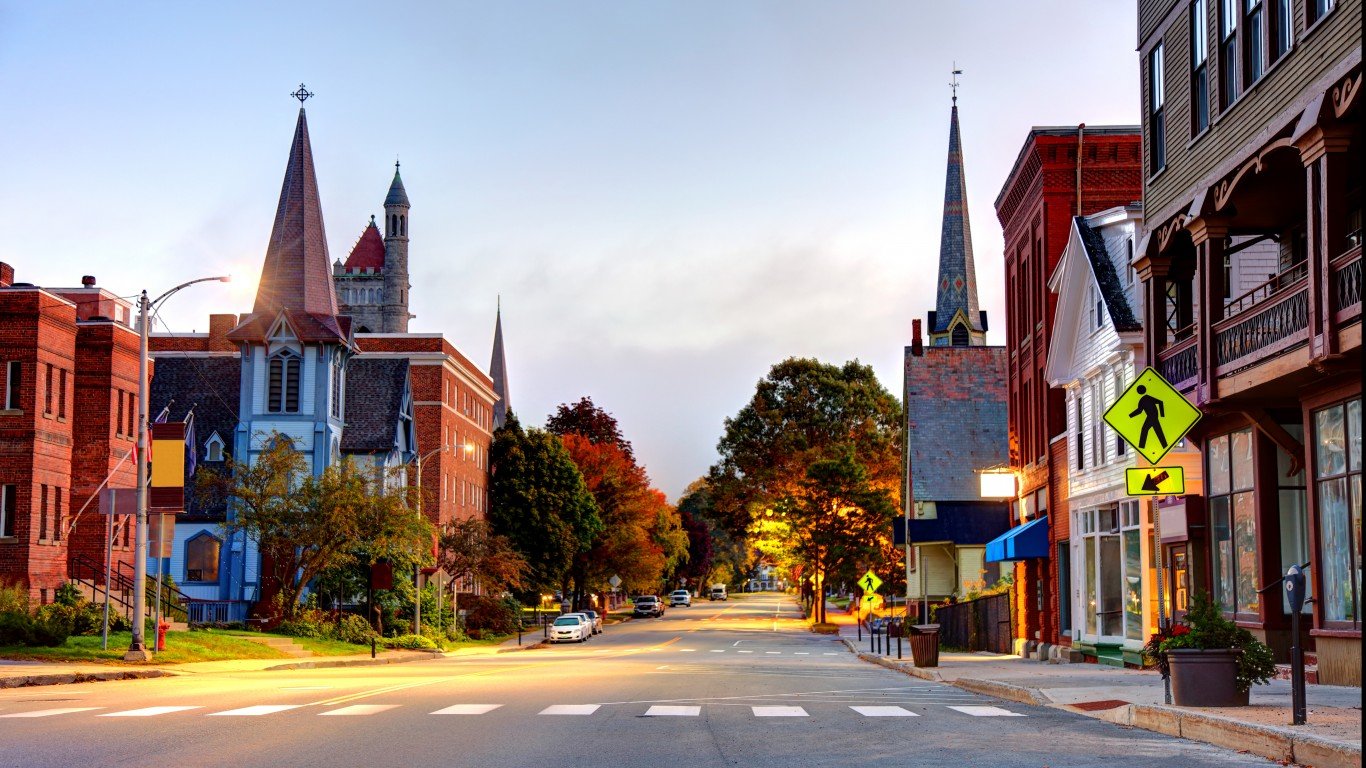
29. New Hampshire: Coos County
> GDP change 2013-2018: +0.4% (county) +10.2% (state)
> 2018 county GDP: $1.1 billion (1.5% of state GDP)
> Fastest shrinking industry: Finance and insurance
> Unemployment change 2013-2018: -2.9 ppt. (6.1% to 3.2%)
> Median household income: $45,696 (county) $74,057 (state)
> Largest place in county: Berlin
[in-text-ad-2]
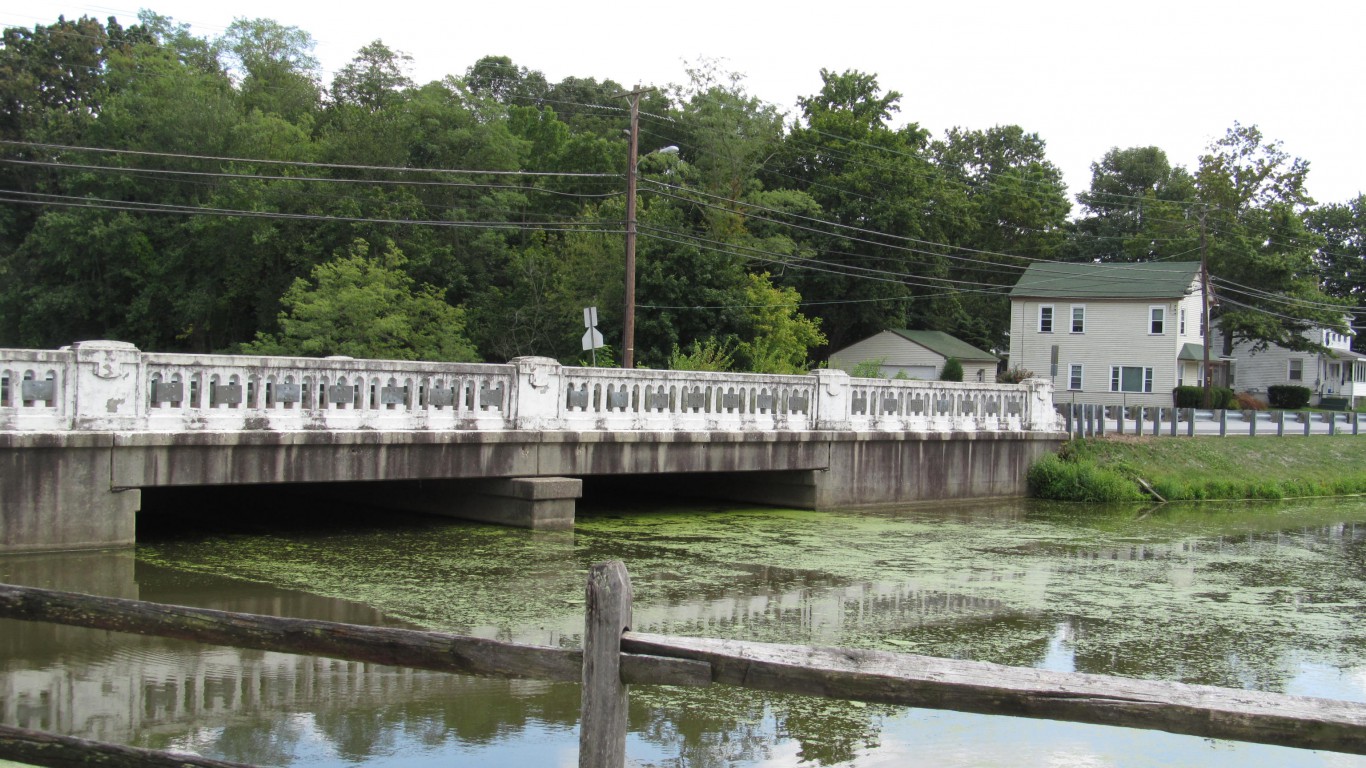
30. New Jersey: Salem County
> GDP change 2013-2018: -12.5% (county) +6.2% (state)
> 2018 county GDP: $5.0 billion (0.9% of state GDP)
> Fastest shrinking industry: Administrative and support and waste management and remediation services
> Unemployment change 2013-2018: -5.0 ppt. (10.4% to 5.4%)
> Median household income: $64,309 (county) $79,363 (state)
> Largest place in county: Pennsville
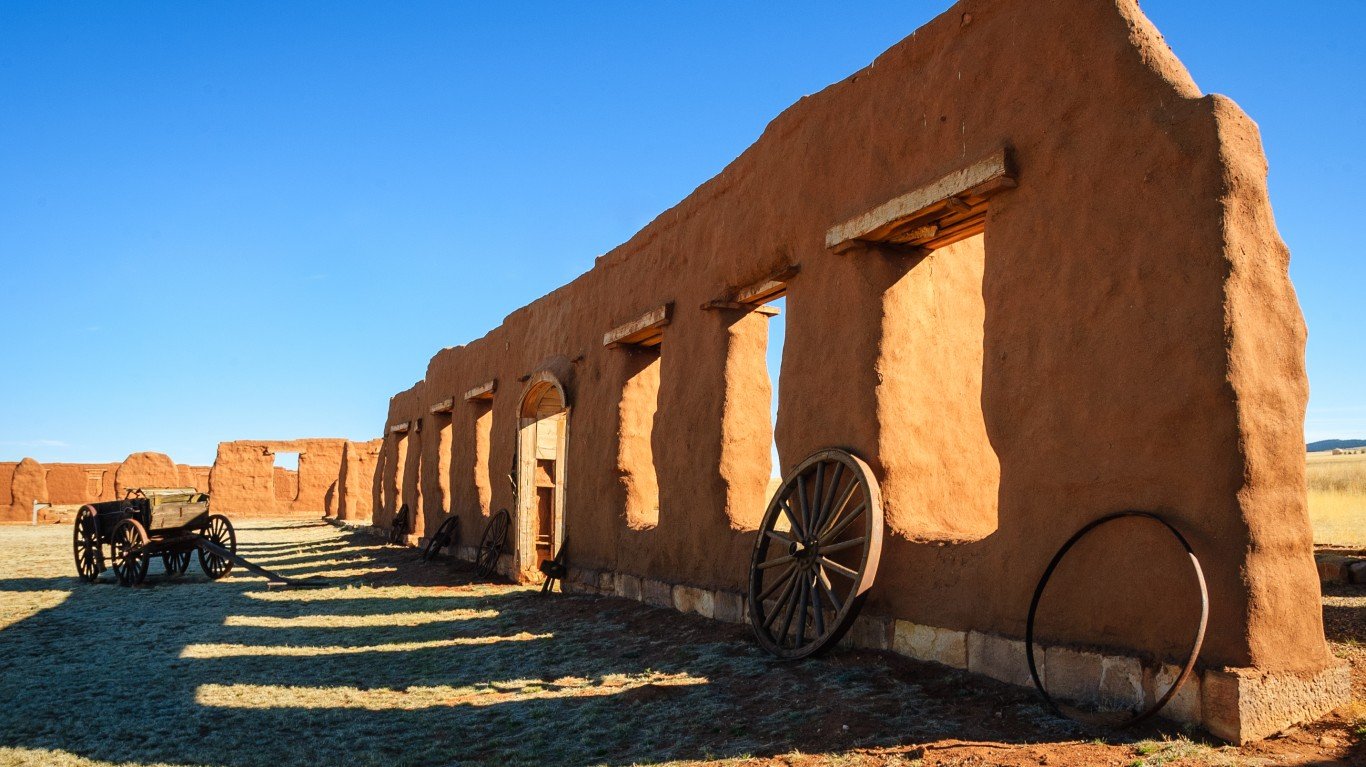
31. New Mexico: Mora County
> GDP change 2013-2018: -42.7% (county) +8.2% (state)
> 2018 county GDP: $76.6 million (0.1% of state GDP)
> Fastest shrinking industry: Transportation and warehousing
> Unemployment change 2013-2018: -5.6 ppt. (11.7% to 6.1%)
> Median household income: $26,968 (county) $48,059 (state)
> Largest place in county: Wagon Mound
[in-text-ad]
32. New York: Jefferson County
> GDP change 2013-2018: -8.1% (county) +8.8% (state)
> 2018 county GDP: $5.9 billion (0.4% of state GDP)
> Fastest shrinking industry: Government and government enterprises
> Unemployment change 2013-2018: -3.6 ppt. (9.2% to 5.6%)
> Median household income: $52,268 (county) $65,323 (state)
> Largest place in county: Watertown
[recirclink id=569002]
33. North Carolina: Tyrrell County
> GDP change 2013-2018: -22.2% (county) +11.7% (state)
> 2018 county GDP: $105.3 million (0.0% of state GDP)
> Fastest shrinking industry: Agriculture, forestry, fishing and hunting
> Unemployment change 2013-2018: -6.6 ppt. (12.9% to 6.3%)
> Median household income: $35,472 (county) $52,413 (state)
> Largest place in county: Columbia
34. North Dakota: Slope County
> GDP change 2013-2018: -48.6% (county) +0.7% (state)
> 2018 county GDP: $57.3 million (0.1% of state GDP)
> Fastest shrinking industry: Manufacturing
> Unemployment change 2013-2018: +0.2 ppt. (2.1% to 2.3%)
> Median household income: $63,942 (county) $63,473 (state)
> Largest place in county: Marmarth
[in-text-ad-2]
35. Ohio: Adams County
> GDP change 2013-2018: -44.1% (county) +9.9% (state)
> 2018 county GDP: $835.3 million (0.1% of state GDP)
> Fastest shrinking industry: Utilities
> Unemployment change 2013-2018: -5.6 ppt. (12.7% to 7.1%)
> Median household income: $36,894 (county) $54,533 (state)
> Largest place in county: West Union
36. Oklahoma: Harmon County
> GDP change 2013-2018: -37.4% (county) +10.7% (state)
> 2018 county GDP: $70.3 million (0.0% of state GDP)
> Fastest shrinking industry: Agriculture, forestry, fishing and hunting
> Unemployment change 2013-2018: -1.4 ppt. (4.3% to 2.9%)
> Median household income: $41,607 (county) $51,424 (state)
> Largest place in county: Hollis
[in-text-ad]
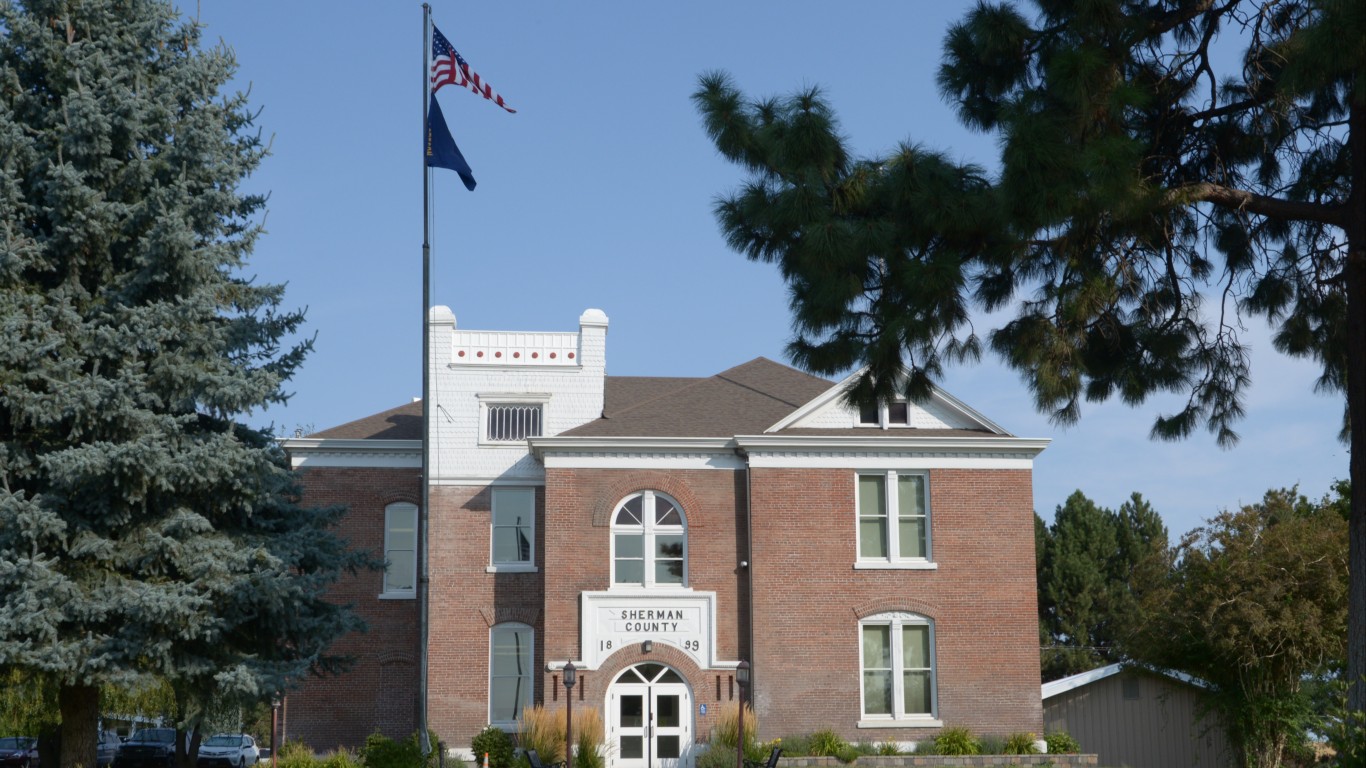
37. Oregon: Sherman County
> GDP change 2013-2018: -13.7% (county) +23.2% (state)
> 2018 county GDP: $583.9 million (0.3% of state GDP)
> Fastest shrinking industry: Utilities
> Unemployment change 2013-2018: -5.2 ppt. (9.3% to 4.1%)
> Median household income: $48,056 (county) $59,393 (state)
> Largest place in county: Wasco
[recirclink id=531165]

38. Pennsylvania: Indiana County
> GDP change 2013-2018: -11.4% (county) +9.3% (state)
> 2018 county GDP: $3.9 billion (0.5% of state GDP)
> Fastest shrinking industry: Mining, quarrying, and oil and gas extraction
> Unemployment change 2013-2018: -2.8 ppt. (7.7% to 4.9%)
> Median household income: $46,877 (county) $59,445 (state)
> Largest place in county: Indiana
39. Rhode Island: Kent County
> GDP change 2013-2018: -0.5% (county) +3.0% (state)
> 2018 county GDP: $8.1 billion (15.1% of state GDP)
> Fastest shrinking industry: Finance and insurance
> Unemployment change 2013-2018: -5.0 ppt. (8.7% to 3.7%)
> Median household income: $70,223 (county) $63,296 (state)
> Largest place in county: Warwick
[in-text-ad-2]
40. South Carolina: Clarendon County
> GDP change 2013-2018: -7.2% (county) +15.8% (state)
> 2018 county GDP: $551.3 million (0.3% of state GDP)
> Fastest shrinking industry: Agriculture, forestry, fishing and hunting
> Unemployment change 2013-2018: -5.6 ppt. (10.3% to 4.7%)
> Median household income: $37,525 (county) $51,015 (state)
> Largest place in county: Manning
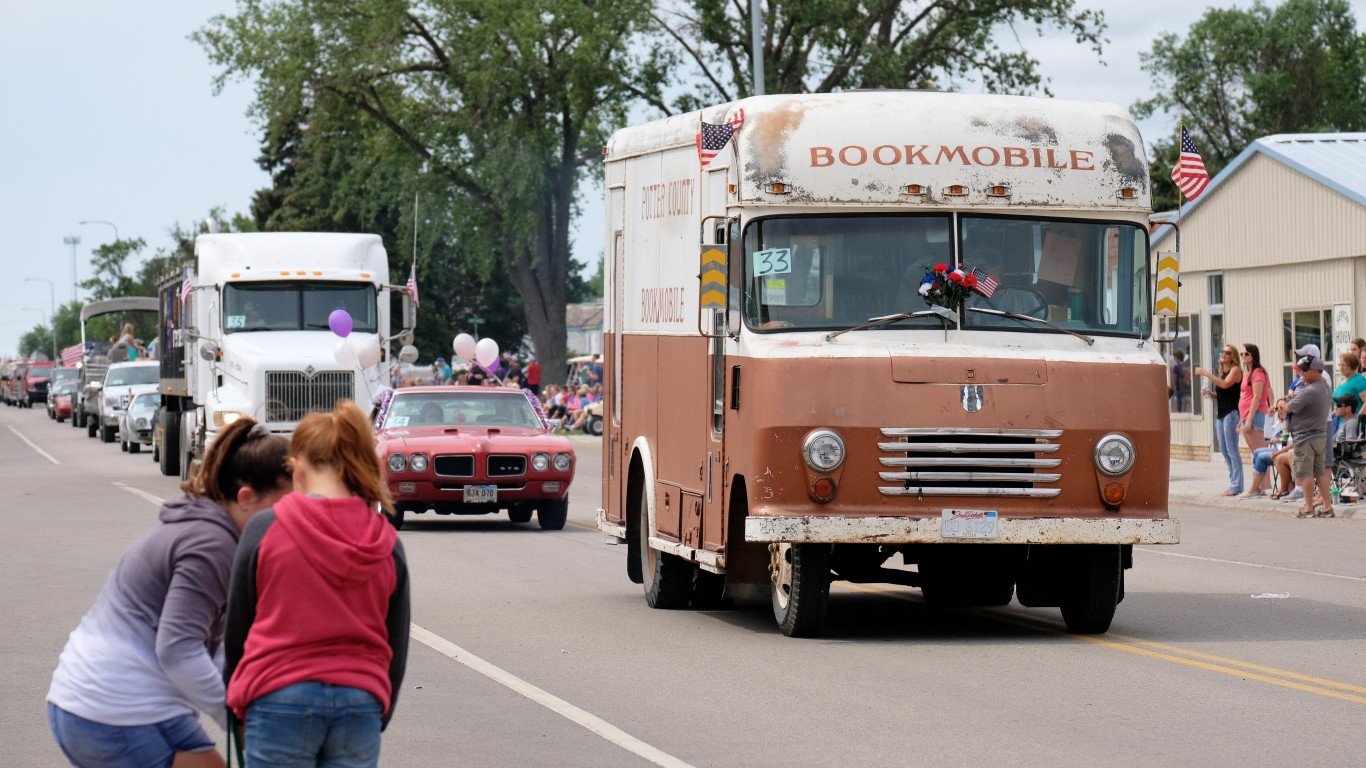
41. South Dakota: Potter County
> GDP change 2013-2018: -50.3% (county) +6.6% (state)
> 2018 county GDP: $137.6 million (0.3% of state GDP)
> Fastest shrinking industry: Agriculture, forestry, fishing and hunting
> Unemployment change 2013-2018: -0.3 ppt. (3.8% to 3.5%)
> Median household income: $53,600 (county) $56,499 (state)
> Largest place in county: Gettysburg
[in-text-ad]
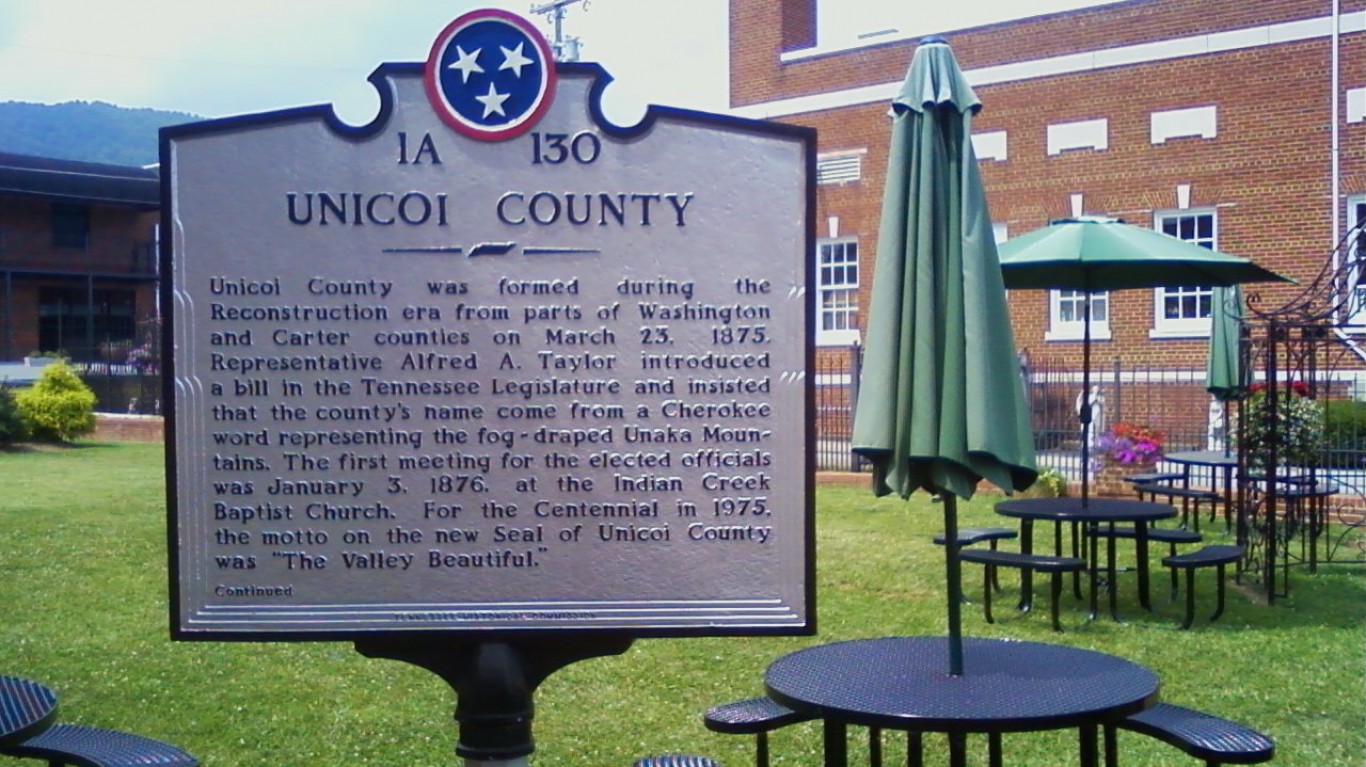
42. Tennessee: Unicoi County
> GDP change 2013-2018: -13.1% (county) +12.9% (state)
> 2018 county GDP: $494.8 million (0.2% of state GDP)
> Fastest shrinking industry: Construction
> Unemployment change 2013-2018: -5.6 ppt. (10.5% to 4.9%)
> Median household income: $39,851 (county) $50,972 (state)
> Largest place in county: Erwin
[recirclink id=569954]
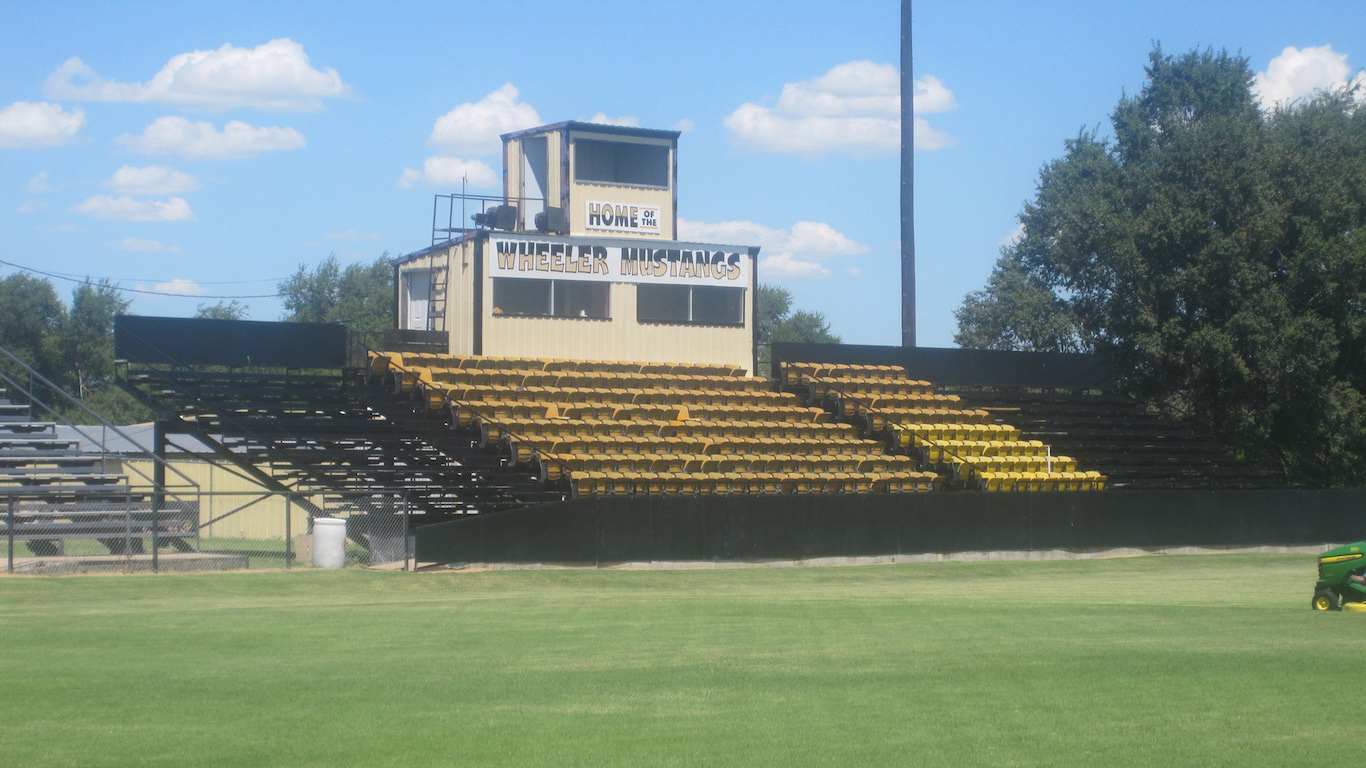
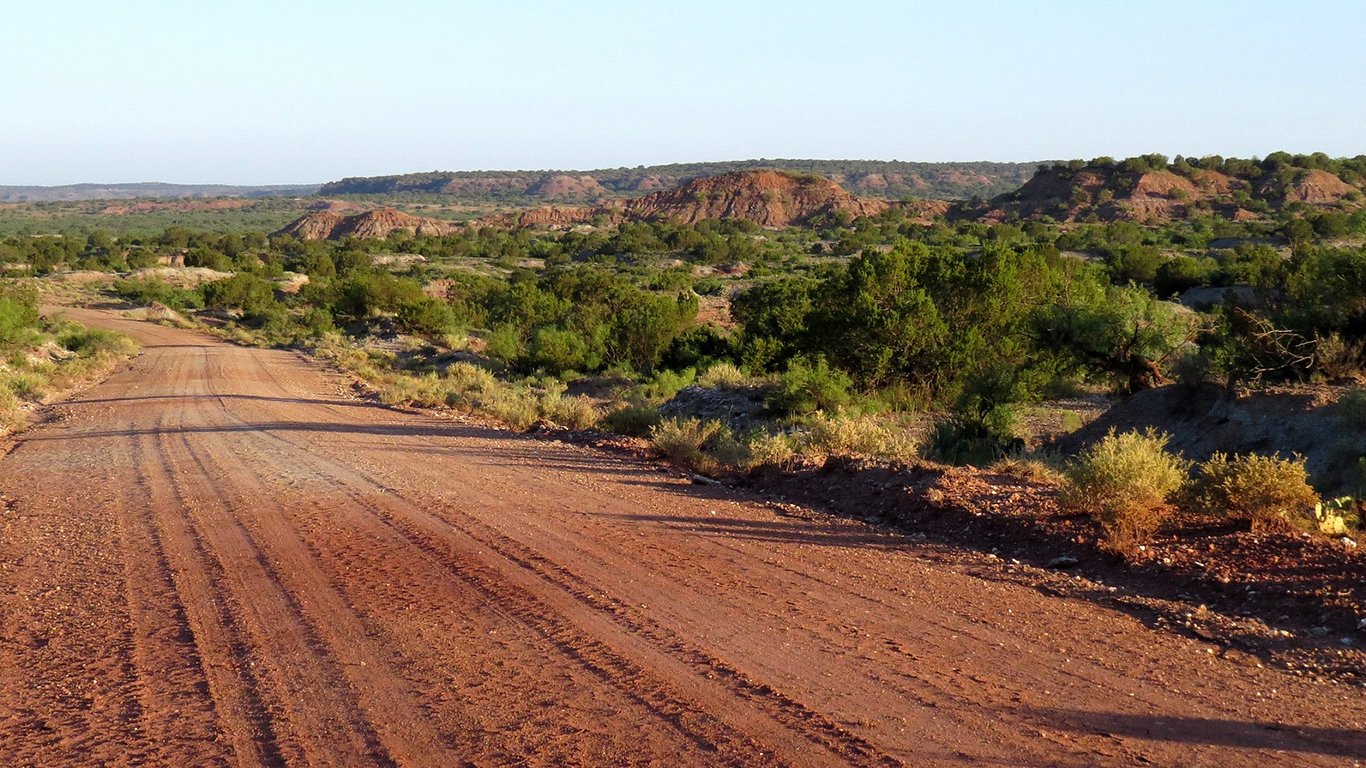
43. Texas: Wheeler County
> GDP change 2013-2018: -43.6% (county) +16.3% (state)
> 2018 county GDP: $1.1 billion (0.1% of state GDP)
> Fastest shrinking industry: Utilities
> Unemployment change 2013-2018: -1.1 ppt. (4.3% to 3.2%)
> Median household income: $49,352 (county) $59,570 (state)
> Largest place in county: Shamrock
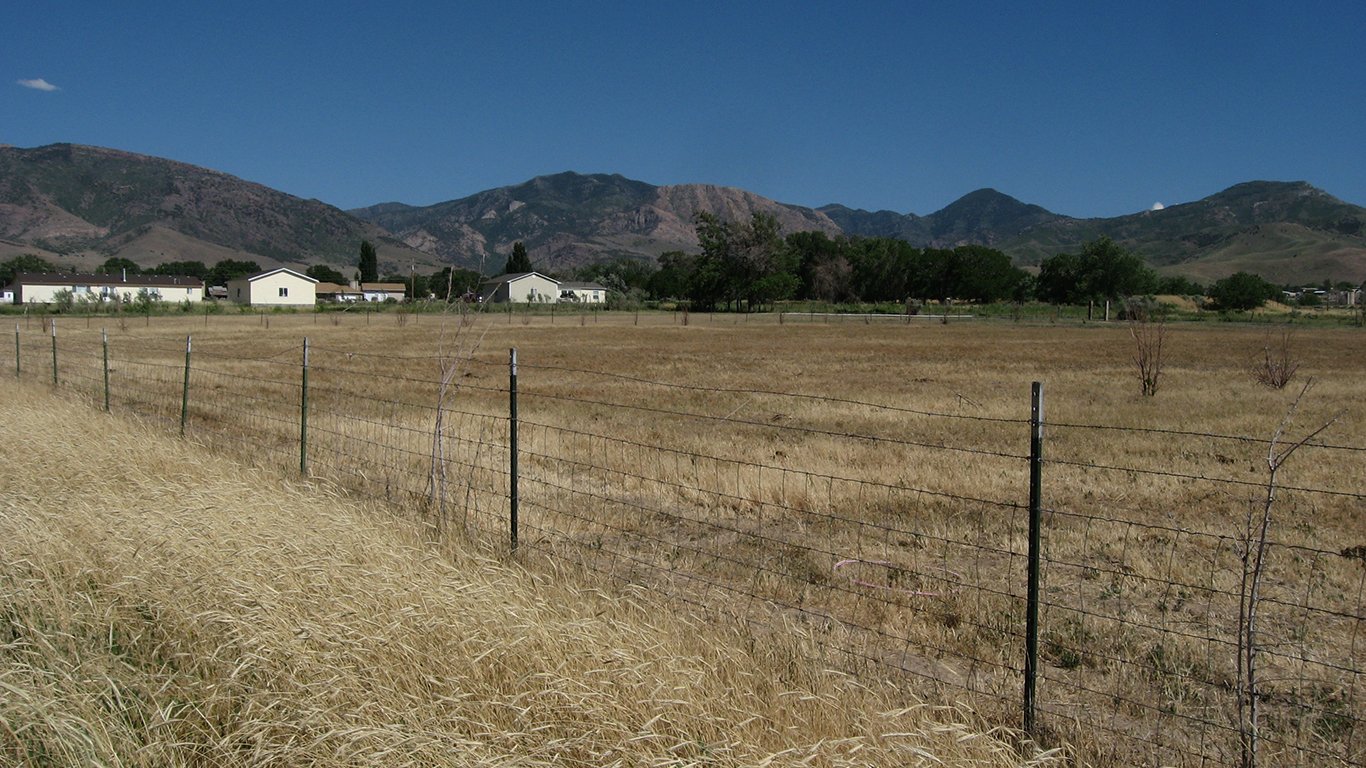
44. Utah: Millard County
> GDP change 2013-2018: -8.4% (county) +20.4% (state)
> 2018 county GDP: $773.8 million (0.5% of state GDP)
> Fastest shrinking industry: Agriculture, forestry, fishing and hunting
> Unemployment change 2013-2018: -0.8 ppt. (4.1% to 3.3%)
> Median household income: $60,445 (county) $68,374 (state)
> Largest place in county: Delta
[in-text-ad-2]
45. Vermont: Caledonia County
> GDP change 2013-2018: -1.7% (county) +4.4% (state)
> 2018 county GDP: $1.0 billion (3.4% of state GDP)
> Fastest shrinking industry: Mining, quarrying, and oil and gas extraction
> Unemployment change 2013-2018: -2.0 ppt. (5.3% to 3.3%)
> Median household income: $49,348 (county) $60,076 (state)
> Largest place in county: St. Johnsbury
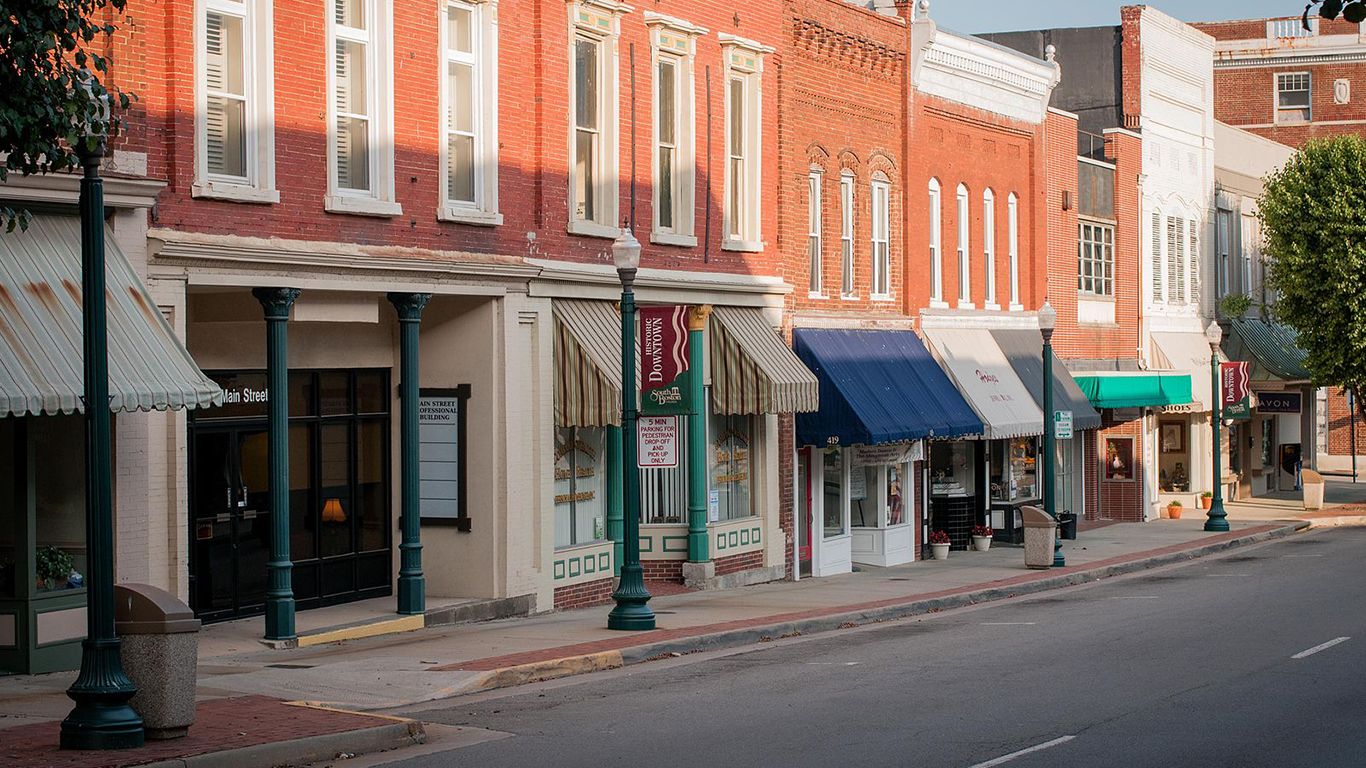
46. Virginia: Halifax County
> GDP change 2013-2018: -13.2% (county) +6.8% (state)
> 2018 county GDP: $1.3 billion (0.3% of state GDP)
> Fastest shrinking industry: Educational services
> Unemployment change 2013-2018: -5.0 ppt. (9.1% to 4.1%)
> Median household income: $42,289 (county) $71,564 (state)
> Largest place in county: South Boston
[in-text-ad]
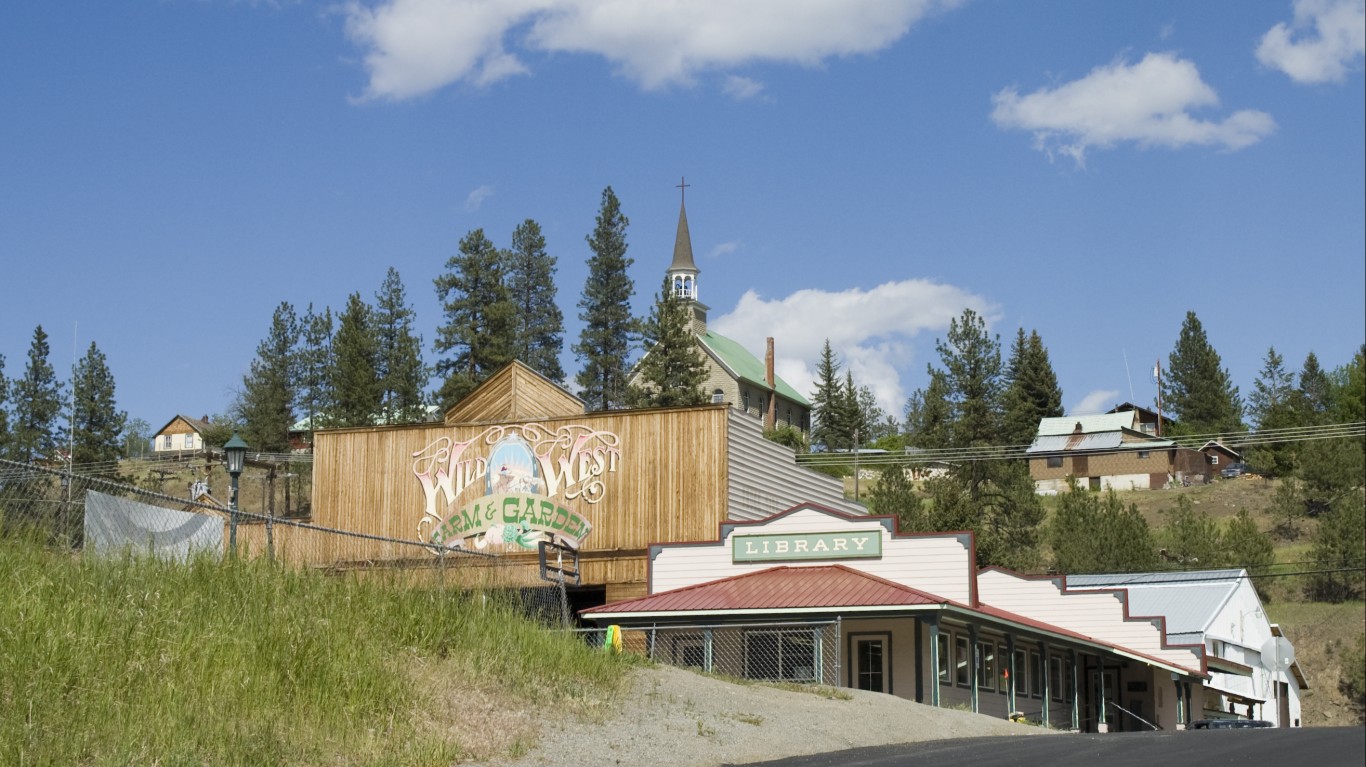
47. Washington: Ferry County
> GDP change 2013-2018: -1.8% (county) +24.5% (state)
> 2018 county GDP: $193.3 million (0.0% of state GDP)
> Fastest shrinking industry: Mining, quarrying, and oil and gas extraction
> Unemployment change 2013-2018: -1.8 ppt. (13.5% to 11.7%)
> Median household income: $41,924 (county) $70,116 (state)
> Largest place in county: Republic
[recirclink id=563869]
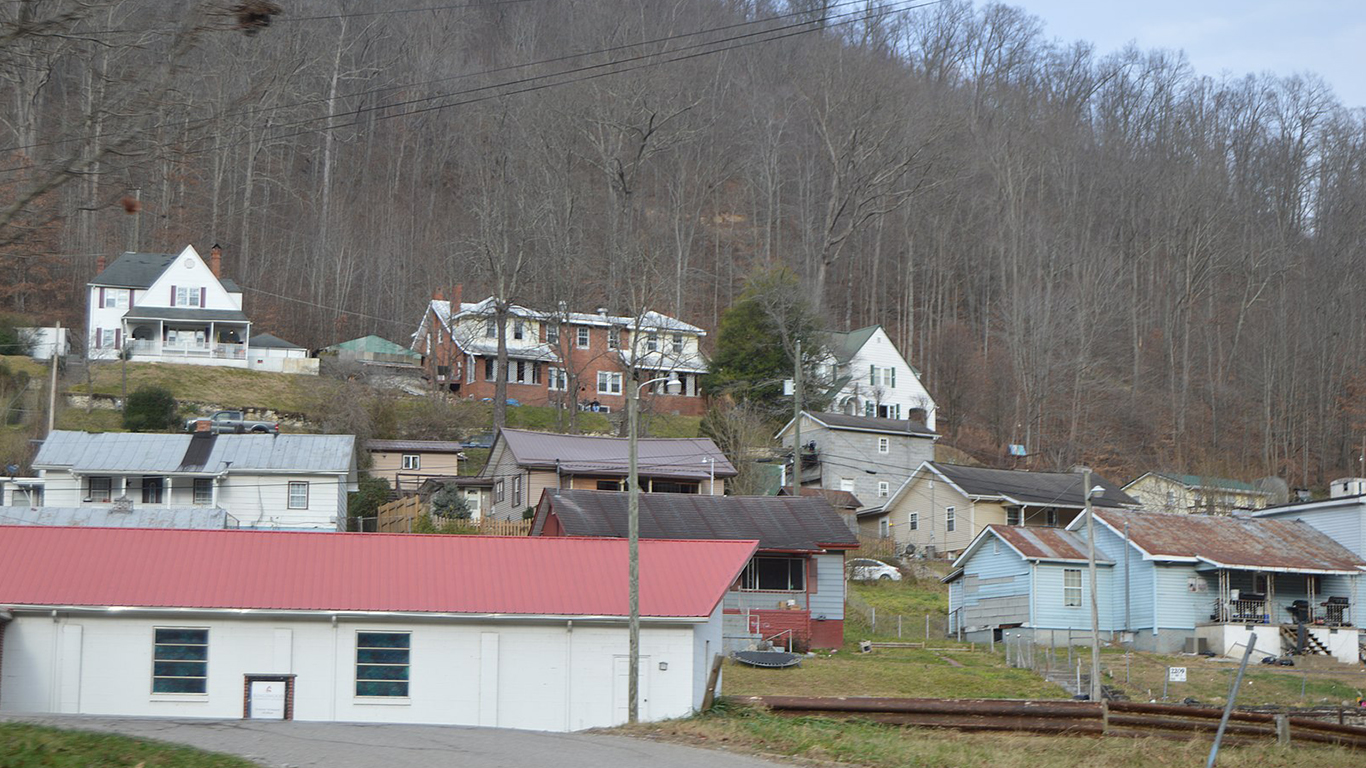
48. West Virginia: Boone County
> GDP change 2013-2018: -46.2% (county) +1.9% (state)
> 2018 county GDP: $663.2 million (0.9% of state GDP)
> Fastest shrinking industry: Mining, quarrying, and oil and gas extraction
> Unemployment change 2013-2018: -3.5 ppt. (9.6% to 6.1%)
> Median household income: $38,642 (county) $44,921 (state)
> Largest place in county: Madison
49. Wisconsin: Waushara County
> GDP change 2013-2018: -5.9% (county) +9.2% (state)
> 2018 county GDP: $560.2 million (0.2% of state GDP)
> Fastest shrinking industry: Mining, quarrying, and oil and gas extraction
> Unemployment change 2013-2018: -5.1 ppt. (8.6% to 3.5%)
> Median household income: $51,195 (county) $59,209 (state)
> Largest place in county: Redgranite
[in-text-ad-2]
50. Wyoming: Johnson County
> GDP change 2013-2018: -19.2% (county) -1.2% (state)
> 2018 county GDP: $439.0 million (1.2% of state GDP)
> Fastest shrinking industry: Construction
> Unemployment change 2013-2018: -1.1 ppt. (5.1% to 4.0%)
> Median household income: $55,991 (county) $62,268 (state)
> Largest place in county: Buffalo
Methodology
To determine the fastest shrinking local economy in every state, 24/7 Wall St. calculated the change in real GDP from 2013 to 2018 for every U.S. county or county equivalent with data from the Bureau of Economic Analysis. GDP figures are chained to 2012 dollars. All data on industry level GDP also came from the BEA.
Average annual unemployment rates for 2018 and 2013 came from the Bureau of Labor Statistics. Data on population and median household income are five year estimates for 2018 and are from the U.S. Census Bureau’s American Community Survey. Largest place in the county is based on population ACS population estimates and places can include cities, towns, villages, and Census designated places.
Independent cities in Virginia were excluded from analysis.
Contact [email protected] for any questions or corrections.