[cnxvideo id=”890001″ placement=”ros”]
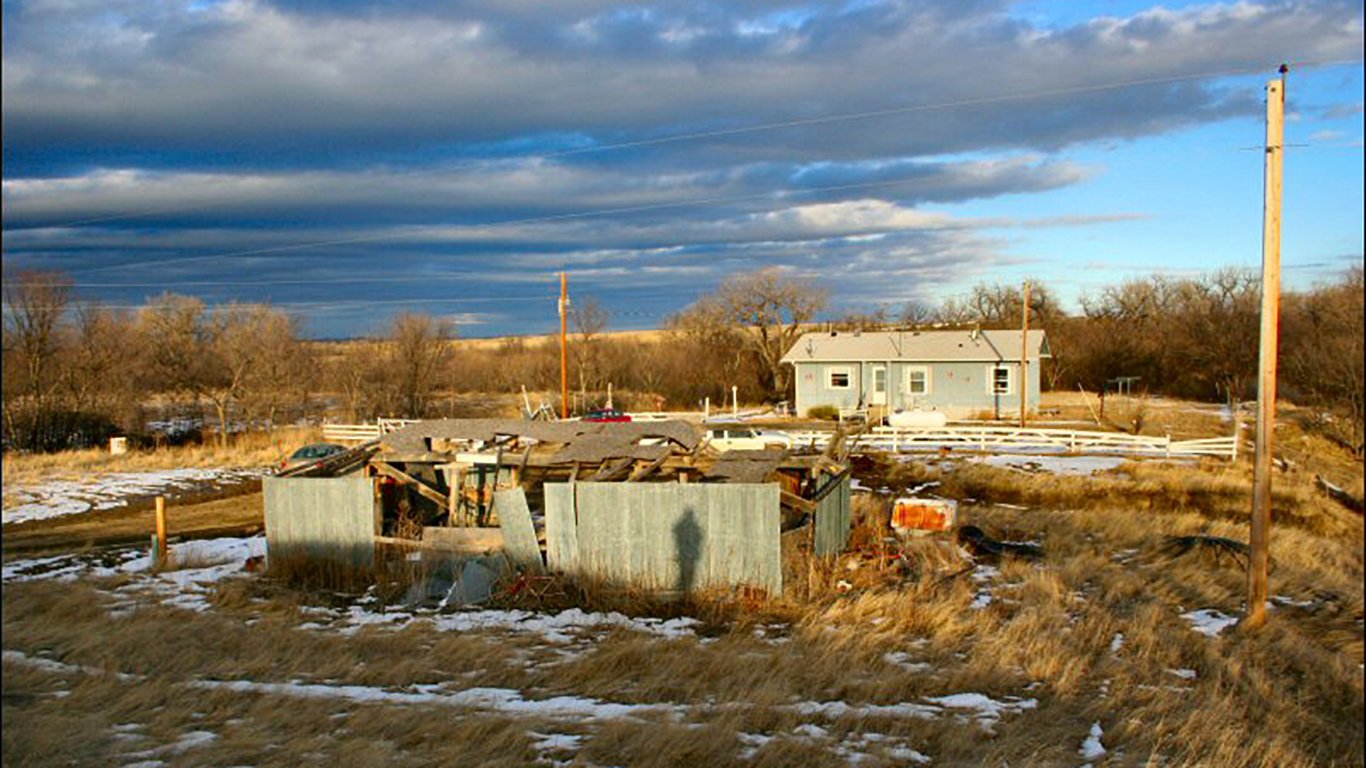
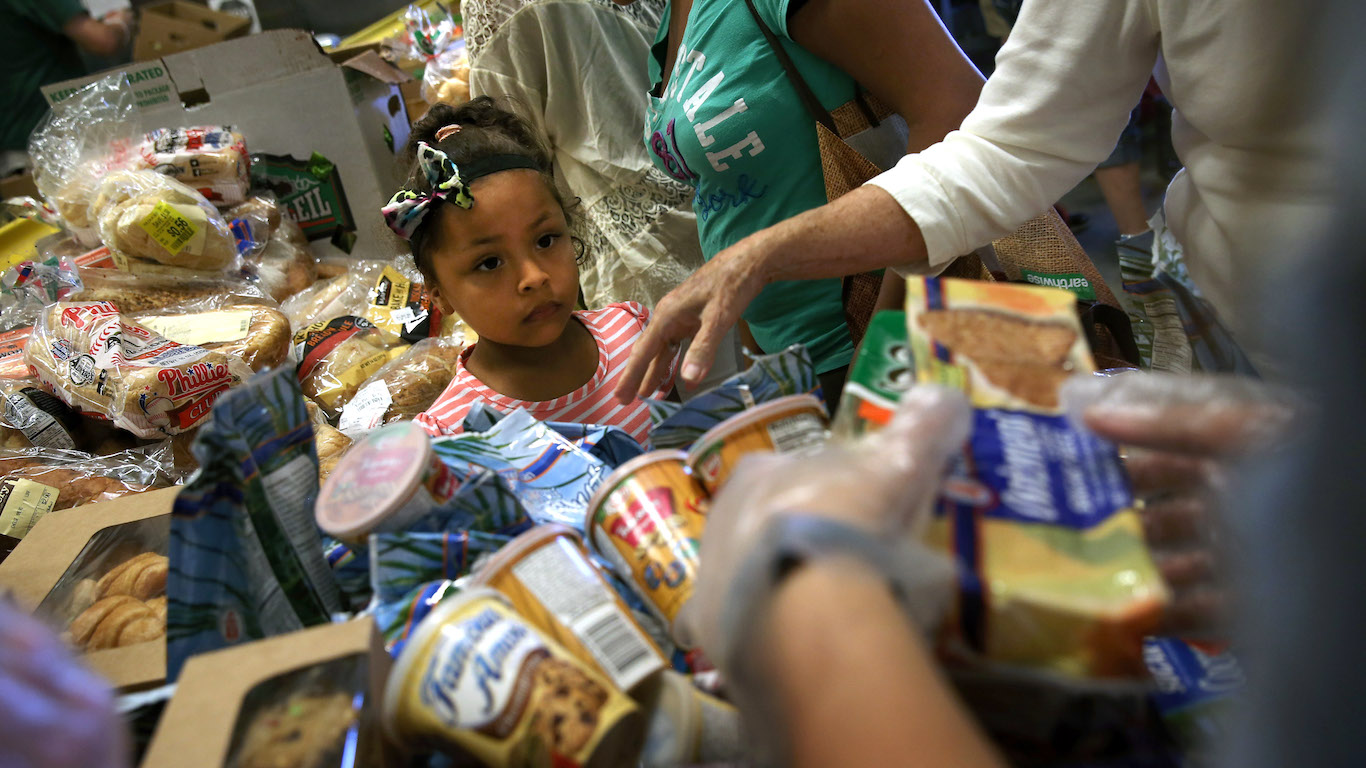
The American Dream is the idea that through sacrifice and hard work, a person from any background can attain success — typically characterized by upward economic mobility. While millions of Americans are a living testimony that the American Dream is still alive, there are parts of the country that tell a very different story.
Conceptually, the American Dream is based on the assumption that success depends on one’s choices. However, broader conditions related to the community and environment — particularly during one’s childhood — can also play a considerable role.
The Equality of Opportunity Project — now part of the Opportunity Insights program at Harvard University — reviewed the estimated economic impact of growing up poor in nearly 3,000 county and county equivalents in the United States. 24/7 Wall St. reviewed the report to identify the counties with the least upward mobility among low-income populations.
To determine economic mobility, the EOP estimated the income of young adults after growing up in a low income household in each county. In the counties on this list — those with the worst upward economic mobility nationwide — income losses were the highest. A 26 year old who grew up in a low-income household in one of these counties earns an annual income of anywhere from $201 to $484 less for each year of childhood spent there than the national income per capita among 26 year olds. Depending on how many years and the average annual loss, this can amount to thousand of dollars in lost income every year.
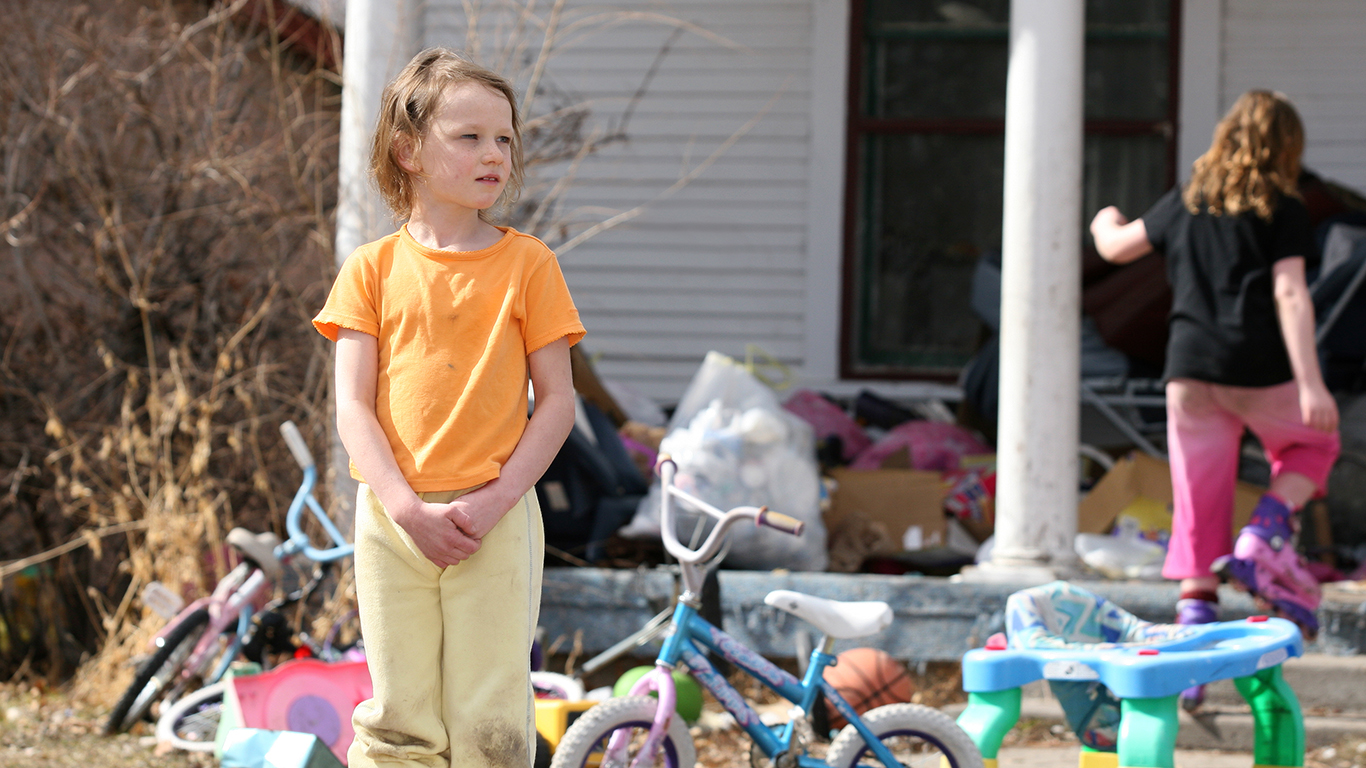
Environmental conditions such as living below the poverty line, being raised by a single parent, or even having parents with lower educational attainment have all been shown to have a negative effect on the likelihood of upward mobility later in life. Not surprisingly, these conditions are more common than average in nearly every county and county equivalent on this list. Economic opportunity also tends to be limited in these counties, with many reporting high unemployment. Here is a look at the cities that lost the most jobs in the last five years.
Several of the economically disadvantaged areas on this list contain an American Indian reservation. Native Americans commonly face extreme generational poverty resulting, in part, from their historical mistreatment by the U.S. government. There are also some unique conditions associated with reservations that may affect upward economic mobility. For example, reservation land is often communally owned, making it difficult for local residents to build wealth through homeownership. Here is a look at the states with the most Indian reservations and tribal areas.
Click here to see the counties where the American Dream is dead
Click here to read our methodology

50. Macon County, Alabama
> Avg. annual income loss per year of childhood residence: $201
> Household income per capita: $24,917
> Poverty rate: 25.8%
> Dec. 2019 unemployment: 3.6%
> Population: 19,054
> Largest place in county: Tuskegee
Macon County is one of two counties in Alabama to rank on this list of counties with poor upward mobility for low-income residents. A 26 year old who grew up in a low-income household in the county earns $201 less annually than the national income per capita among 26 year olds for each year he or she spent growing up there.
More than one in every four Macon County residents live below the poverty line, well above the 14.1% national poverty rate. Like most counties on this list, Macon has shed jobs in recent years. Between 2010 and 2018, the number of people working in the county declined by 10.8%.
[in-text-ad]
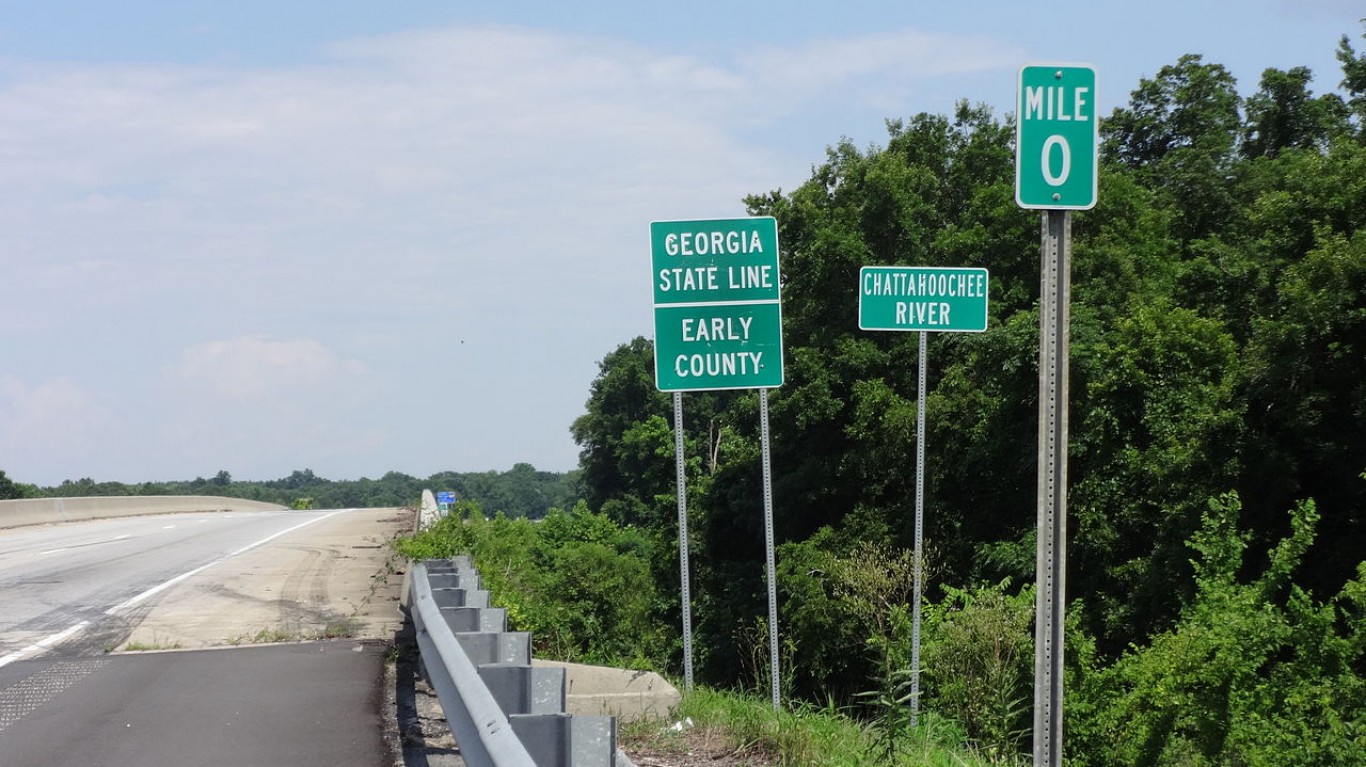
49. Early County, Georgia
> Avg. annual income loss per year of childhood residence: $201
> Household income per capita: $30,163
> Poverty rate: 28.8%
> Dec. 2019 unemployment: 3.6%
> Population: 10,348
> Largest place in county: Blakely
Children who grow up in poverty are more likely to perform worse than their peers in school and less likely than average to graduate from high school. In Early County, Georgia, 40.4% of children live below the poverty line. The effects of such conditions are likely felt throughout adulthood. A 26 year old who grew up poor in Early County earns about $201 less than national annual income per capita for every year he or she spent in the county as a child.
[recirclink id=595626]

48. Fairfield County, South Carolina
> Avg. annual income loss per year of childhood residence: $202
> Household income per capita: $28,030
> Poverty rate: 22.9%
> Dec. 2019 unemployment: 3.9%
> Population: 22,712
> Largest place in county: Winnsboro
As is the case in most of the counties on this list, economic opportunities are vanishing in Fairfield County, South Carolina. Overall employment in the county fell by 6.8%. The county’s unemployment rate as of December 2019 was 3.9%, higher than the 3.4% national unemployment rate. A 26 year old who grew up in a low-income household in Fairfield County earns $202 less than the national annual income per capita among 26 year olds for each year he or she spent growing up there.

47. Rolette County, North Dakota
> Avg. annual income loss per year of childhood residence: $202
> Household income per capita: $22,565
> Poverty rate: 29.3%
> Dec. 2019 unemployment: 7.3%
> Population: 14,603
> Largest place in county: Belcourt
North Dakota’s Rolette County forms part of the state’s border with Canada. Twenty-six year olds who grew up in low-income households in the county are estimated to have an average annual income loss of $202 for each year they spent in the county in their childhood.
A number of counties on this list are home to a large Native American population, a group that, due in large part to historical mistreatment by the U.S. government, tends to struggle economically today. With the Turtle Mountain Reservation located in the county, nearly 80% of the population of Rolette are American Indian.
[in-text-ad-2]

46. Atlantic County, New Jersey
> Avg. annual income loss per year of childhood residence: $203
> Household income per capita: $38,869
> Poverty rate: 14.3%
> Dec. 2019 unemployment: 5.4%
> Population: 268,539
> Largest place in county: Atlantic City
Atlantic County, home to Atlantic City, is the only county in New Jersey to rank on this list. As is often the case among the counties on this list, economic opportunity is scarce in Atlantic County. Between 2010 and 2018, the number of people employed in the county fell by 5.1% and the unemployment rate stands at 5.4%, well above the comparable 3.4% national rate. The lack of opportunity may be pushing people out of Atlantic County. Over the same period, the county’s population declined by 1.7%, even as the U.S. population grew by 6.2%.

45. Hoke County, North Carolina
> Avg. annual income loss per year of childhood residence: $203
> Household income per capita: $24,807
> Poverty rate: 21.0%
> Dec. 2019 unemployment: 4.4%
> Population: 53,239
> Largest place in county: Raeford
Upward economic mobility is relatively limited in Hoke County, North Carolina. For each year spent in the county as a child living in a low-income household, a 26 year old earns $203 less than the national income per capita for that age.
Like most places on this list, Hoke County is largely rural and relatively poor. The annual household income per capita is less than $25,000 a year, and nearly one in every 10 households live on an income of less than $10,000 per year.
[in-text-ad]
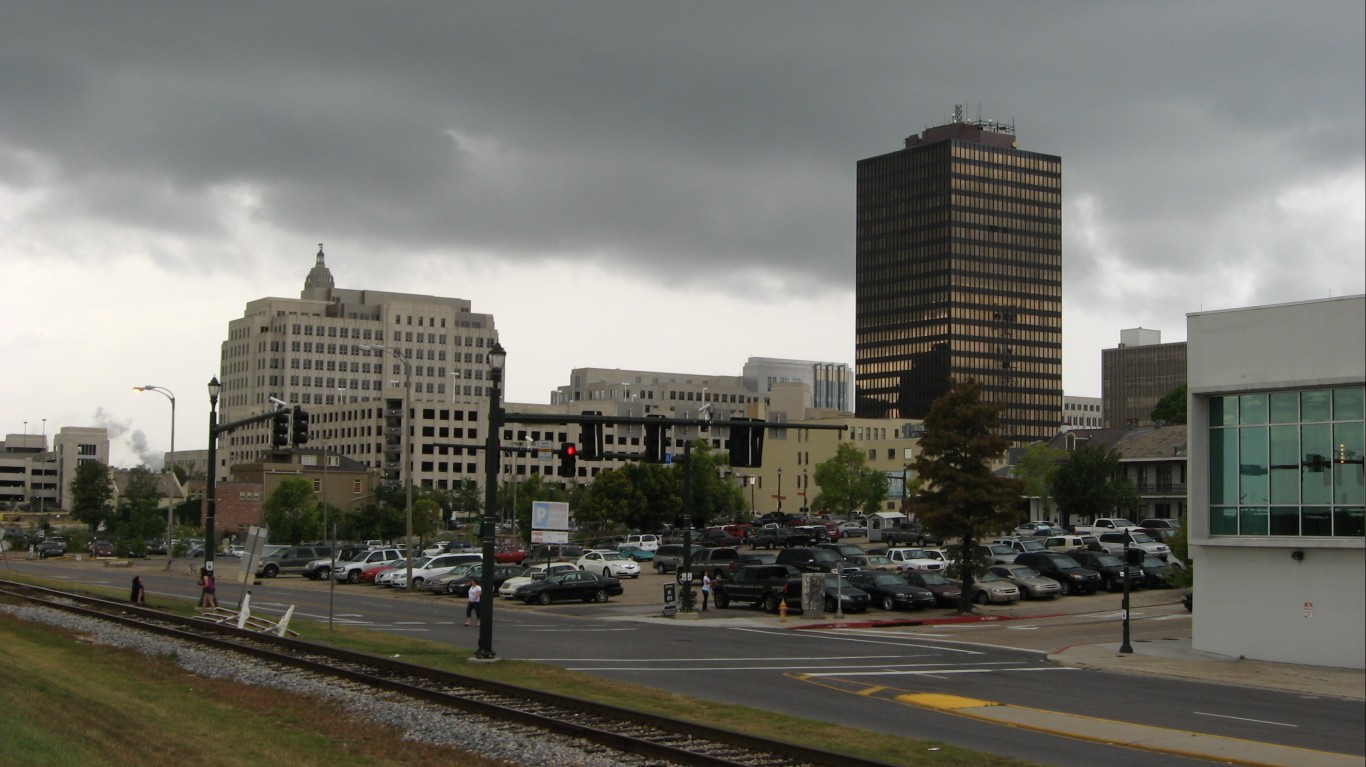
44. East Baton Rouge Parish, Louisiana
> Avg. annual income loss per year of childhood residence: $203
> Household income per capita: $35,064
> Poverty rate: 18.3%
> Dec. 2019 unemployment: 4.4%
> Population: 444,094
> Largest place in parish: Baton Rouge
In Louisiana’s East Baton Rouge Parish, 46.1% of children live in single-parent households, well above the 33.0% national share. Such conditions likely affect many of those children well into adulthood as, statistically, the more time spent as a child in East Baton Rouge, the greater the likelihood of reduced earning potential in adulthood. A 26-year old who grew up in a low-income household in East Baton Rouge earns an estimated $203 less for each year he or she spent in the parish as a child than the national annual income per capita for that age.
[recirclink id=595196]

43. Spalding County, Georgia
> Avg. annual income loss per year of childhood residence: $203
> Household income per capita: $31,155
> Poverty rate: 21.6%
> Dec. 2019 unemployment: 3.3%
> Population: 64,719
> Largest place in county: Griffin
Spalding is one of seven counties in Georgia to rank on this list. Upward economic mobility is limited in the area, as 26 year olds who grew up there earn about $203 less than the national income per capita for that age per every year they spent there as a child.
Like most places on this list, Spalding is relatively poor. More than one in every five area residents live in poverty, and nearly one in every 10 households live on less than $10,000 a year.
42. Greene County, Alabama
> Avg. annual income loss per year of childhood residence: $204
> Household income per capita: $27,644
> Poverty rate: 38.7%
> Dec. 2019 unemployment: 4.8%
> Population: 8,426
> Largest place in county: Eutaw
Twenty-six year olds who grew up in Greene County, Alabama, earn about $204 less annually than their peers nationwide for every year they spent in the county as a child.
Children who grow up in poverty face considerable disadvantages to success later in life, and in Greene County, 44% of children 17 and younger live below the poverty line, well above the 18.0% national child poverty rate.
[in-text-ad-2]

41. Baldwin County, Georgia
> Avg. annual income loss per year of childhood residence: $204
> Household income per capita: $26,337
> Poverty rate: 26.2%
> Dec. 2019 unemployment: 3.8%
> Population: 45,286
> Largest place in county: Milledgeville
A decline in opportunities in the area is likely contributing to the low economic mobility in the region. In Baldwin, employment has declined by 2% between 2010 and 2018, even as it has grown in the vast majority of counties over the same period.
Children who grow up in a single-parent household are far more likely to struggle economically than those who grow up in a two-parent household. In Baldwin County, 47% of children live in a household with a single parent, one of the higher shares of any county.

40. Guilford County, North Carolina
> Avg. annual income loss per year of childhood residence: $205
> Household income per capita: $41,339
> Poverty rate: 15.9%
> Dec. 2019 unemployment: 3.5%
> Population: 523,582
> Largest place in county: Greensboro
Compared to other counties on this list, Guilford County has a relatively high household income per capita, at $41,338.
However, income inequality in the county is extremely high, and prospects for upward economic mobility for the county’s low-income residents are poor. In the county, which is made up largely of the Greensboro area, a 26 year old who grew up in a low-income household has an annual income of $205 less than the national income per capita among 26 year olds for each year he or she spent growing up there.
[in-text-ad]

39. Terrell County, Georgia
> Avg. annual income loss per year of childhood residence: $205
> Household income per capita: $26,851
> Poverty rate: 31.9%
> Dec. 2019 unemployment: 4.0%
> Population: 8,859
> Largest place in county: Dawson
Children living in Terrell County, Georgia, are more likely to live below the poverty line than children in nearly every other part of the country. The county’s child poverty rate of 44.5% is well above the comparable national rate of 18.0%.
The conditions associated with poverty can hamper a child’s chances for upward economic mobility later in life. A 26 year old who grew up in a low-income household in Terrell County earns about $205 less than the national income per capita for each year he or she spent growing up there.
[recirclink id=601025]

38. Crittenden County, Arkansas
> Avg. annual income loss per year of childhood residence: $206
> Household income per capita: $27,744
> Poverty rate: 22.2%
> Dec. 2019 unemployment: 3.8%
> Population: 49,013
> Largest place in county: West Memphis
In Crittenden County, Arkansas, economic mobility is extremely poor. A 26 year old who grew up in the county earns on average $206 less than the U.S. per capita income for 26 year olds for each childhood year he or she spent there.
The county has a very high poverty rate, at 22.2%, and poverty is also very geographically segregated — meaning poverty is highly concentrated in certain parts of the county. Growing up in a neighborhood with concentrated poverty has been shown to have a substantial impact on economic mobility.
37. Gadsden County, Florida
> Avg. annual income loss per year of childhood residence: $208
> Household income per capita: $25,763
> Poverty rate: 24.6%
> Dec. 2019 unemployment: 3.4%
> Population: 46,017
> Largest place in county: Quincy
Gadsden County, Florida, which is just the west of Tallahassee and is part of the panhandle region of the state, has the worst economic mobility of any county in the state. A 26 year old who grew up in the county earns an estimated $208 less than the U.S. per capita income for 26 year olds for each childhood year he or she spent there.
Children who grow up in single parent households are more likely to struggle economically, and in Gadsden, approximately 60% of children live in a household with a single parent, one of the highest shares of any county in the country.
[in-text-ad-2]
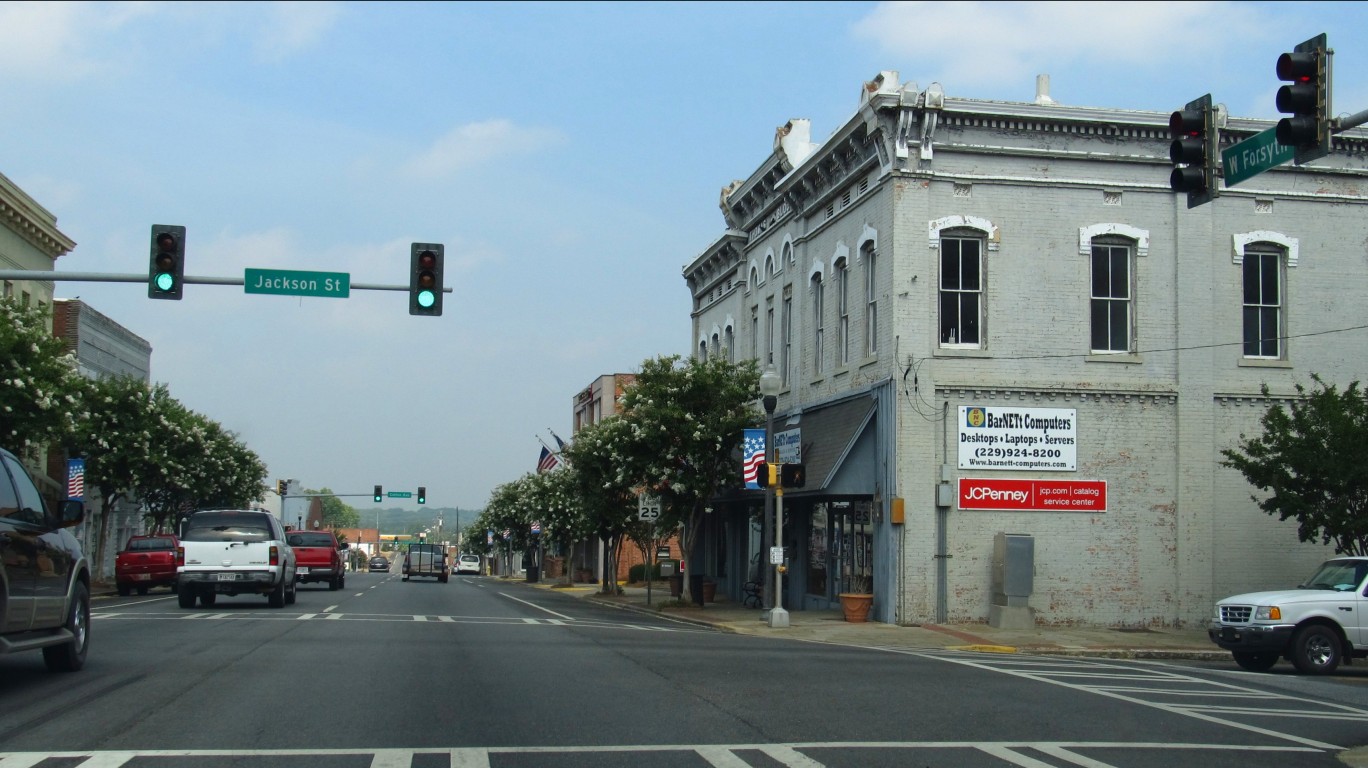
36. Sumter County, Georgia
> Avg. annual income loss per year of childhood residence: $208
> Household income per capita: $28,432
> Poverty rate: 27.8%
> Dec. 2019 unemployment: 4.3%
> Population: 30,352
> Largest place in county: Americus
The jobless rate in Sumter County, Georgia, stands at 4.3% as of December 2019, well above the comparable 3.4% national unemployment rate. The relative lack of employment opportunities may partially explain low economic mobility for those who grew up in the area. A 26 year old who grew up in a low-income household in Sumter County earns about $208 less than the national income per capita among 26 year olds for each year he or she spent growing up there.
Lack of economic opportunity may be pushing residents away from the county. Between 2010 and 2018, the number of people living in Sumter County fell by 7.6%.

35. East Carroll Parish, Louisiana
> Avg. annual income loss per year of childhood residence: $210
> Household income per capita: $18,062
> Poverty rate: 48.6%
> Dec. 2019 unemployment: 11.7%
> Population: 7,225
> Largest place in parish: Lake Providence
East Carroll Parish, Louisiana, is one of the least healthy counties in the United States. In 2019, an estimated 38% of adults reported being in fair or poor health, compared to 16.0% of adults nationwide. Poor health outcomes are closely tied to poverty, and those who are in poor health can often find it harder to earn higher incomes.
East Carroll also has one of the highest shares of children living with single parents of any county or county equivalent in the country, at 73.3% of all children, compared to a national share of 33.0% of children.
[in-text-ad]
34. Robeson County, North Carolina
> Avg. annual income loss per year of childhood residence: $212
> Household income per capita: $24,221
> Poverty rate: 28.1%
> Dec. 2019 unemployment: 4.7%
> Population: 133,442
> Largest place in county: Lumberton
Children living in single-parent households are more likely to struggle in school and also in the workforce, which can in turn affect their ability to exit poverty. In North Carolina’s Robeson County, 50.3% of children live in single-parent households, well above the 33.0% national share. Such conditions likely affect many of those children well into adulthood.
Twenty-six year olds who grew up in lower-income households in the county earns an estimated $212 less for each year he or she spent there as a child than the national annual per capita income among 26 year olds.
[recirclink id=591355]

33. Hancock County, Georgia
> Avg. annual income loss per year of childhood residence: $214
> Household income per capita: $17,928
> Poverty rate: 24.1%
> Dec. 2019 unemployment: 5.6%
> Population: 8,535
> Largest place in county: Sparta
Children growing up in poverty face obstacles and challenges that make upward economic mobility far more difficult than for most other people. In Hancock, a rural county southeast of Atlanta, 44.7% of residents age 17 and younger live below the poverty line, more than double the national child poverty rate of 18.0%.
Children in the county are also more likely than most to face other disadvantages, including those associated with being raised by a single parent. Across Hancock County, 51.5% of children live in single parent households, well above the 33.0% national average.

32. Quitman County, Mississippi
> Avg. annual income loss per year of childhood residence: $214
> Household income per capita: $22,166
> Poverty rate: 35.5%
> Dec. 2019 unemployment: 8.7%
> Population: 7,372
> Largest place in county: Marks
Quitman County is among several Mississippi counties with poor economic mobility. Children who grow up in poverty tend to face a number of obstacles to achieving economic prosperity that other children do not. In Quitman County, located in the northwest part of the state, a staggering 55% of children live in poverty, one of the highest child poverty rates of any county in the U.S. and far higher than the nationwide rate of 18.0%e.
Extreme poverty is also often especially difficult to escape from, and about 1 in 5 households in the state have incomes of less than $10,000 annually, approximately three times the comparable national rate.
[in-text-ad-2]

31. Grenada County, Mississippi
> Avg. annual income loss per year of childhood residence: $215
> Household income per capita: $26,818
> Poverty rate: 24.5%
> Dec. 2019 unemployment: 4.8%
> Population: 21,278
> Largest place in county: Grenada
A 26 year old who grew up in a low-income household in Grenada County, Mississippi, earns $215 less than the national income per capita among 26 year olds for each year he or she spent growing up there.
Like many of the counties on this list, single-parent households — often a major contributing factor to poor economic mobility — are especially common in the county. An estimated 54% of children in the county live in a single-parent household.

30. St. Louis, Missouri
> Avg. annual income loss per year of childhood residence: $216
> Household income per capita: $30,072
> Poverty rate: 24.2%
> Dec. 2019 unemployment: 3.9%
> Population: 311,273
St. Louis is an independent city outside any county jurisdiction. As a city, however, it ranks among the places where children are least likely to be upwardly economically mobile as adults. Children in St. Louis are far more likely than most American children to face serious economic disadvantages.
For example, 60.3% of children in the city live in single-parent households, nearly double the 33.0% share nationwide. Additionally, the city’s 38.4% child poverty rate is well above the comparable national rate of 18%.
[in-text-ad]
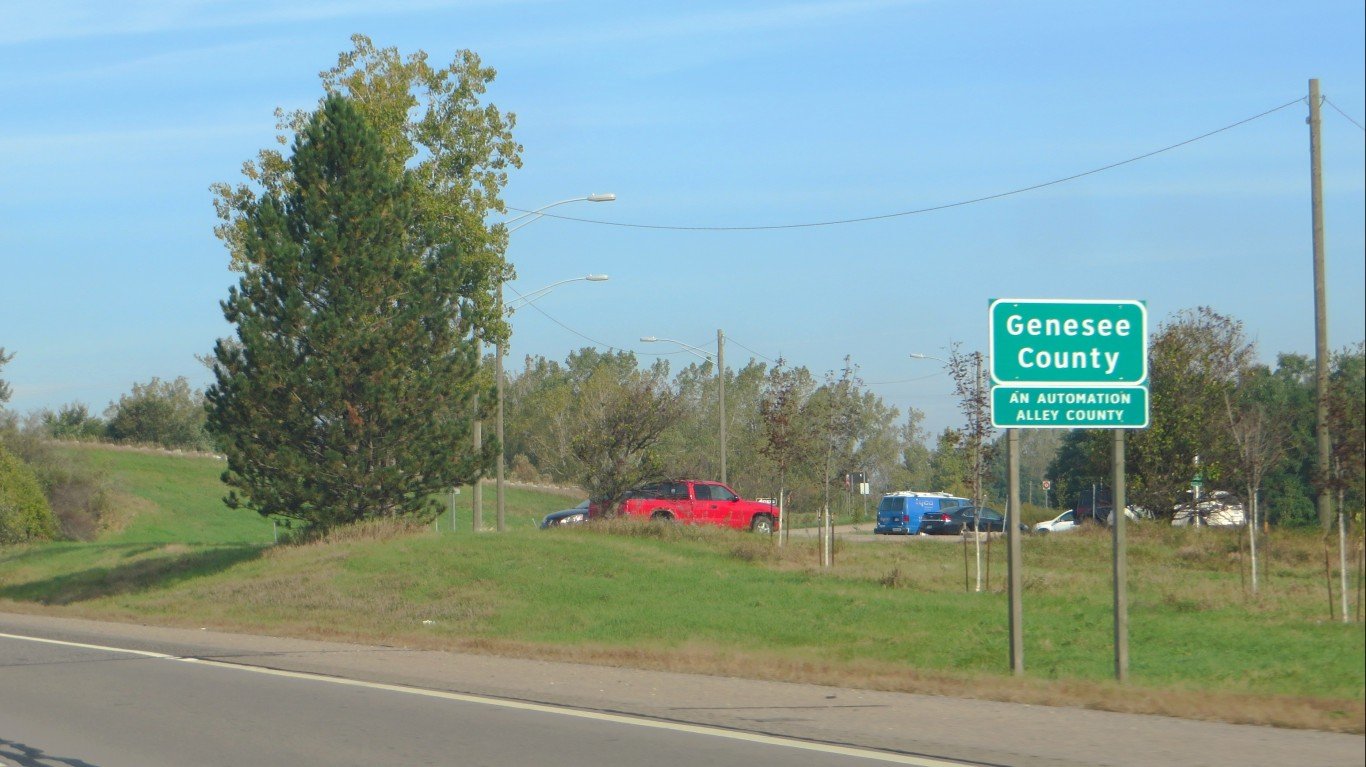
29. Genesee County, Michigan
> Avg. annual income loss per year of childhood residence: $217
> Household income per capita: $38,963
> Poverty rate: 19.8%
> Dec. 2019 unemployment: 4.0%
> Population: 409,361
> Largest place in county: Flint
Michigan’s Genesee County is a relatively poor area, with a 19.8% poverty rate. In areas where a large share of residents are struggling financially, more residents are likely to need to rely on government assistance to meet their basic needs. Across the county, more than one in every five households rely on SNAP benefits, or food stamps, to afford food.
Poor children living in the area are at a considerable disadvantage for upward economic mobility. A 26 year old who grew up in a low-income household in Genesee County earns about $217 less annually than the national income per capita for 26 year olds for each year spent growing up there.
[recirclink id=569002]
28. Washington County, Mississippi
> Avg. annual income loss per year of childhood residence: $218
> Household income per capita: $26,530
> Poverty rate: 33.3%
> Dec. 2019 unemployment: 8.3%
> Population: 47,086
> Largest place in county: Greenville
In Washington County, Mississippi, close to 70% of children live in single-parent households, one of the highest shares in the country and well more than double the national share of 33.0% of children. As is often the case with counties on this list, income inequality is extremely high. Those in the county with incomes at the 80th percentile earn nearly six times the incomes of those in the 20th percentile.
27. Scotland County, North Carolina
> Avg. annual income loss per year of childhood residence: $219
> Household income per capita: $29,071
> Poverty rate: 27.7%
> Dec. 2019 unemployment: 5.8%
> Population: 35,262
> Largest place in county: Laurinburg
Employment opportunities are relatively scarce in Scotland County, North Carolina. Between 2010 and 2018, overall employment declined by 4.1%. The county’s unemployment rate of 5.8% is well above the comparable 3.4% national rate. The lack of opportunity may be driving people out of the area. In the years between 2010 and 2018, the number of people living in Scotland County fell by 2.9%.
The low likelihood of upward economic mobility for children in low-income households is partially due to several disadvantages, including being raised by a single parent. Some 52% of local children live in single-parent households, compared to 33% of children nationwide.
[in-text-ad-2]

26. Oktibbeha County, Mississippi
> Avg. annual income loss per year of childhood residence: $219
> Household income per capita: $24,040
> Poverty rate: 30.0%
> Dec. 2019 unemployment: 5.0%
> Population: 49,481
> Largest place in county: Starkville
Oktibbeha is a rural county in central Mississippi. Some 30% of all county residents live below the poverty line, making Oktibbeha one of the poorest places in the United States. Poor children in the area are at a considerable disadvantage for upward economic mobility. An adult in their mid-20s who grows up in a low-income household in Oktibbeha County will earn about $219 less annually than the national average income per capita for each year he or she spent growing up there.

25. Bolivar County, Mississippi
> Avg. annual income loss per year of childhood residence: $223
> Household income per capita: $22,311
> Poverty rate: 34.6%
> Dec. 2019 unemployment: 7.7%
> Population: 32,592
> Largest place in county: Cleveland
In Bolivar County in Mississippi, almost 40% of children live in poverty, which is more than double the national child poverty rate. Children who grow up in very poor households are likely to face many obstacles to achieving economic prosperity in the United States. Almost 20% of households in the county live on an annual incomes of less than $10,000, more than three times the national share of extremely low-income households. An estimated 65% of children in the county live in single-parent households, or nearly double the national share.
[in-text-ad]

24. Sunflower County, Mississippi
> Avg. annual income loss per year of childhood residence: $228
> Household income per capita: $18,895
> Poverty rate: 31.5%
> Dec. 2019 unemployment: 10.7%
> Population: 26,532
> Largest place in county: Indianola
In Sunflower County in Mississippi, just 72.9% of adults have a high school diploma. It can be more difficult for those with lower educational attainment to earn higher wages and to be upwardly economically mobile.
A lack of available jobs may also seriously limit the potential for residents to improve their economic situation. In Sunflower County, the number of people employed decreased by 8.6% between 2010 and 2018, even as total nationwide employment increased by 14.3% over the same period. The county’s unemployment rate as of December 2019 was 10.7%, one of the highest unemployment rates in the country.
[recirclink id=601039]

23. Allendale County, South Carolina
> Avg. annual income loss per year of childhood residence: $229
> Household income per capita: $21,262
> Poverty rate: 26.8%
> Dec. 2019 unemployment: 4.6%
> Population: 9,214
> Largest place in county: Allendale
Allendale County, South Carolina, is located in the southern part of the state, to the west of Charleston. Children who are raised by parents with a college education are more likely to do well in school and be better prepared for upward economic mobility. In Allendale County, however, just 9.4% of adults have a bachelor’s degree compared to 31.5% of adults nationwide.
Most children in the area face the additional disadvantages associated with poverty. The county’s child poverty rate is a staggering 51.6%, nearly the highest of any U.S. county.
22. Tallahatchie County, Mississippi
> Avg. annual income loss per year of childhood residence: $230
> Household income per capita: $21,421
> Poverty rate: 30.6%
> Dec. 2019 unemployment: 6.3%
> Population: 14,361
> Largest place in county: Charleston
Tallahatchie County is a rural county in northern Mississippi. As is often the case among the counties on this list, economic opportunity is scarce in Tallahatchie. The unemployment rate stands at 6.3% as of December 2019, well above the comparable 3.4% national rate. A lack of job opportunities may be pushing people out of the county. Between 2010 and 2018, the county’s population declined by 6.0%, even as the U.S. population grew by 6.2%.
[in-text-ad-2]

21. Nome Census Area, Alaska
> Avg. annual income loss per year of childhood residence: $230
> Household income per capita: $29,589
> Poverty rate: 23.1%
> Dec. 2019 unemployment: 9.2%
> Population: 9,925
> Largest place in county: Nome
26 year olds who grew up in the Nome Census Area in Alaska are less likely to be upwardly economically mobile than average, due in part to a number of disadvantages. For example, children who are raised by adults with a college education are more likely to do well in school and have success in the workforce. In Nome, however, just 14.6% of adults have a bachelor’s degree compared to 31.5% of adults nationwide.
Many children in the area face the additional disadvantages associated with poverty. The area’s child poverty rate is 26.9%, well above the 18.0% national rate.
20. Big Horn County, Montana
> Avg. annual income loss per year of childhood residence: $230
> Household income per capita: $20,646
> Poverty rate: 26.2%
> Dec. 2019 unemployment: 6.7%
> Population: 13,376
> Largest place in county: Hardin
Like a number of counties on this list, Big Horn County is primarily made up of Native Americans, a group that — perhaps more than any demographic group — has long faced debilitating poverty and struggled with upward economic mobility largely as a result of historical mistreatment by the U.S. government. The county is home to reservations of the Crow and Northern Cheyenne nations.
Like many areas with limited economic mobility, child poverty is relatively common in Big Horn County. Approximately a third of children live in poverty in the county, compared to 18.0% of children nationwide.
[in-text-ad]

19. Roanoke, Virginia
> Avg. annual income loss per year of childhood residence: $233
> Household income per capita: $34,745
> Poverty rate: 20.5%
> Dec. 2019 unemployment: 2.7%
> Population: 99,621
Some of Virginia’s cities are independent and are governed similar to counties, including Roanoke, which has some of the worst upward economic mobility of any county or county equivalent in the United States. A 26 year old who grew up in a low-income household in Roanoke, Virginia earns $233 less than the national income per capita among 26 year olds for each year he or she spent growing up there.
Children who grow up in single-parent households face a number of obstacles to achieving upward economic mobility, and in Roanoke, approximately half of children live in a single-parent household, compared to the national share of about one-third.
[recirclink id=601025]
18. Dewey County, South Dakota
> Avg. annual income loss per year of childhood residence: $235
> Household income per capita: $19,529
> Poverty rate: 30.2%
> Dec. 2019 unemployment: 7.0%
> Population: 5,779
> Largest place in county: North Eagle Butte
Like a number of counties on this list, Dewey County is primarily occupied by Native Americans, who commonly face extreme generational poverty resulting, in part, from their historic mistreatment by Americans and the U.S. government. In the county, which is home to the Cheyenne River Reservation, approximately 78% of the population is American Indian.
Those who live in extremely low-income conditions are likely to face many obstacles to prosperity. In Dewey County, 30.2% of residents live in poverty, over double the national poverty rate and one of the highest rates of any county.

17. Hinds County, Mississippi
> Avg. annual income loss per year of childhood residence: $235
> Household income per capita: $32,627
> Poverty rate: 22.2%
> Dec. 2019 unemployment: 4.9%
> Population: 241,774
> Largest place in county: Jackson
Like many counties in Mississippi, adults who grew up in Hinds County, which includes the state capital of Jackson, are likely to earn less than their peers nationwide for each year they spent there.
Like many counties on this list, Hinds County is shedding jobs. Between 2010 and 2018, the number of employed people in the county declined by 2.0%, even as employment nationwide increased by 14.3% over the same period. The county’s unemployment rate of 4.9% in December 2019 was higher than the national unemployment rate of 3.4%.
[in-text-ad-2]

16. Leflore County, Mississippi
> Avg. annual income loss per year of childhood residence: $236
> Household income per capita: $23,465
> Poverty rate: 39.2%
> Dec. 2019 unemployment: 7.7%
> Population: 29,804
> Largest place in county: Greenwood
A 26 year old who grew up in a low-income household in Leflore County, Mississippi, earns $236 less than the national income per capita among 26 year olds for each year he or she spent growing up there.
Children who grow up in single-parent households are more likely to struggle economically than those who live in a household with two parents. In Leflore County, close to two-thirds of children live in single-parent households, one of the highest shares of any county in the country.

15. Richmond City, Virginia
> Avg. annual income loss per year of childhood residence: $240
> Household income per capita: $35,536
> Poverty rate: 24.5%
> Dec. 2019 unemployment: 2.8%
> Population: 223,787
Richmond is one of two Virginia independent cities — which have similar government structures to counties — to appear on this list of counties where the American dream is dead. Of the two, Richmond ranks as the worst based on estimated income loss as a result of living in the city. A 26 year old who grew up in a low-income household in Richmond earns $240 less than the national annual income per capita among 26 year olds for each year he or she spent growing up there.
[in-text-ad]

14. Clarke County, Georgia
> Avg. annual income loss per year of childhood residence: $242
> Household income per capita: $26,220
> Poverty rate: 31.3%
> Dec. 2019 unemployment: 2.7%
> Population: 124,602
> Largest place in county: Athens
Clarke County is the worst ranked of the seven counties in Georgia to make this list based on estimated income loss for each year living in the county as a child in a low-income household. The county, which is home to the city of Athens, has a very high poverty rate, at 31.3%. Poverty in the county is also very geographically segregated — meaning poverty is highly concentrated in certain parts of the area. Growing up in a neighborhood with concentrated poverty has been shown to have a substantial negative impact on economic mobility.
[recirclink id=591355]

13. Claiborne County, Mississippi
> Avg. annual income loss per year of childhood residence: $242
> Household income per capita: $19,485
> Poverty rate: 44.0%
> Dec. 2019 unemployment: 10.8%
> Population: 9,120
> Largest place in county: Port Gibson
Economic opportunities are scarce in Claiborne County, Mississippi. A staggering 10.8% of the local labor force is out of work, more than triple the 3.4% national unemployment rate. Employment growth has also been weak in the area in recent years, with the number of people working climbing by just 1.8% between 2010 and 2018, well below the comparable 14.3% employment growth nationwide.
The majority of children who grow up in the rural, western Mississippi county face the considerable disadvantage of being raised by a single parent. A staggering 65.9% of children in the county live in a single-parent household, nearly double the 33.0% of American children nationwide.

12. Kusilvak Census Area, Alaska
> Avg. annual income loss per year of childhood residence: $245
> Household income per capita: $19,557
> Poverty rate: 40.5%
> Dec. 2019 unemployment: 15.7%
> Population: 8,198
> Largest place in area: N/A
Children who grow up in low income households in Alaska’s Kusilvak Census Area are far less likely than average to be upwardly mobile economically. This is partially due to the pervasiveness of childhood poverty — which can substantially hamper child development and reduce the likelihood of success later in life. A staggering 47.4% of children in the area live below the poverty line compared to the 18.0% national child poverty rate.
As is often the case in the counties and county equivalents on this list, economic opportunities are limited in Kusilvak. The local unemployment rate stands at 15.7%, more than quadruple the comparable 3.4% national jobless rate.
[in-text-ad-2]
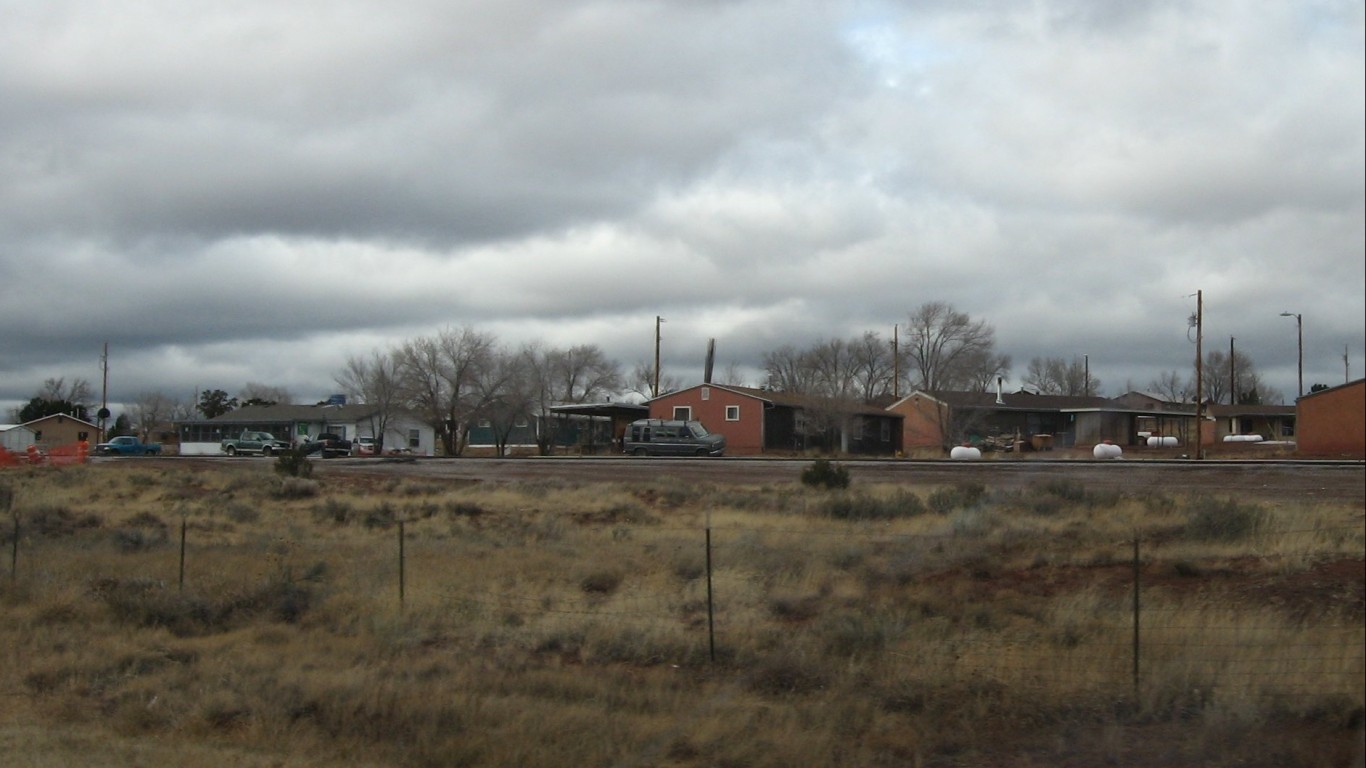
11. McKinley County, New Mexico
> Avg. annual income loss per year of childhood residence: $248
> Household income per capita: $19,744
> Poverty rate: 36.0%
> Dec. 2019 unemployment: 6.4%
> Population: 72,849
> Largest place in county: Gallup
McKinley County, New Mexico, is one of several counties on this list that partially or entirely encompases an Indian reservation. Native American reservations typically rank among the most economically disadvantaged communities in the country, in part because reservation land is often communally owned, making it difficult for local residents to build wealth through homeownership. Across McKinley County, 42.8% of children live below the poverty line.
Widespread financial hardship is due in large part to a lack of economic opportunity. Between 2010 and 2018, employment in the county declined by 3.9%. And the county’s jobless rate of 6.4% as of December 2019 is well above the comparable 3.4% national rate.

10. Tunica County, Mississippi
> Avg. annual income loss per year of childhood residence: $249
> Household income per capita: $22,618
> Poverty rate: 21.9%
> Dec. 2019 unemployment: 6.4%
> Population: 10,170
> Largest place in county: Tunica
Tunica is a rural county located in northwestern Mississippi. A 26 year old who grew up in a low-income household in the county earns about $249 less annually for each year he or she spent growing up there, compared to the national income per capita of all 26 year olds.
The disadvantages of growing up in the county are likely tied to several socioeconomic indicators. For one, the majority of children in the area — 71.5% — grow up in single-parent households, a far greater share than the 33.0% of children nationwide. Additionally, children of college-educated parents are more likely than their peers to succeed academically and later in life, and in Tunica County, just 16.8% of adults have a bachelor’s degree, compared to 31.5% nationwide.
[in-text-ad]

9. Humphreys County, Mississippi
> Avg. annual income loss per year of childhood residence: $254
> Household income per capita: $21,846
> Poverty rate: 38.1%
> Dec. 2019 unemployment: 11.1%
> Population: 8,539
> Largest place in county: Belzoni
Humphreys is a rural county located in west-central Mississippi. A 26 year old who grew up in a low-income household in the county earns an estimated $254 less annually for each year he or she spent growing up there, compared to the national income per capita of all 26 year olds.
Economic opportunities appear limited for residents of Humphreys County. Between 2010 and 2018 overall the number of people working in the area fell by a staggering 28.2%. Currently, the unemployment rate stands at 11.1%, well above the comparable 3.4% national rate.
[recirclink id=595196]

8. Glacier County, Montana
> Avg. annual income loss per year of childhood residence: $263
> Household income per capita: $23,252
> Poverty rate: 33.3%
> Dec. 2019 unemployment: 7.4%
> Population: 13,699
> Largest place in county: Cut Bank
Glacier County ranks as the worst for upward economic mobility in Montana and one of the worst nationwide. For each year spent in the county as a child living in a low-income household, a 26 year old earns $263 less than the national income per capita for that age.
The county is home to the Blackfeet Indian Reservation, and approximately two-thirds of the population identify as American Indian, a group that continues to face serious economic disadvantages in the United States. Income inequality is extremely high in the county, as a household in the 80th percentile of incomes earns roughly seven times as much as a household in the 20th percentile of income.
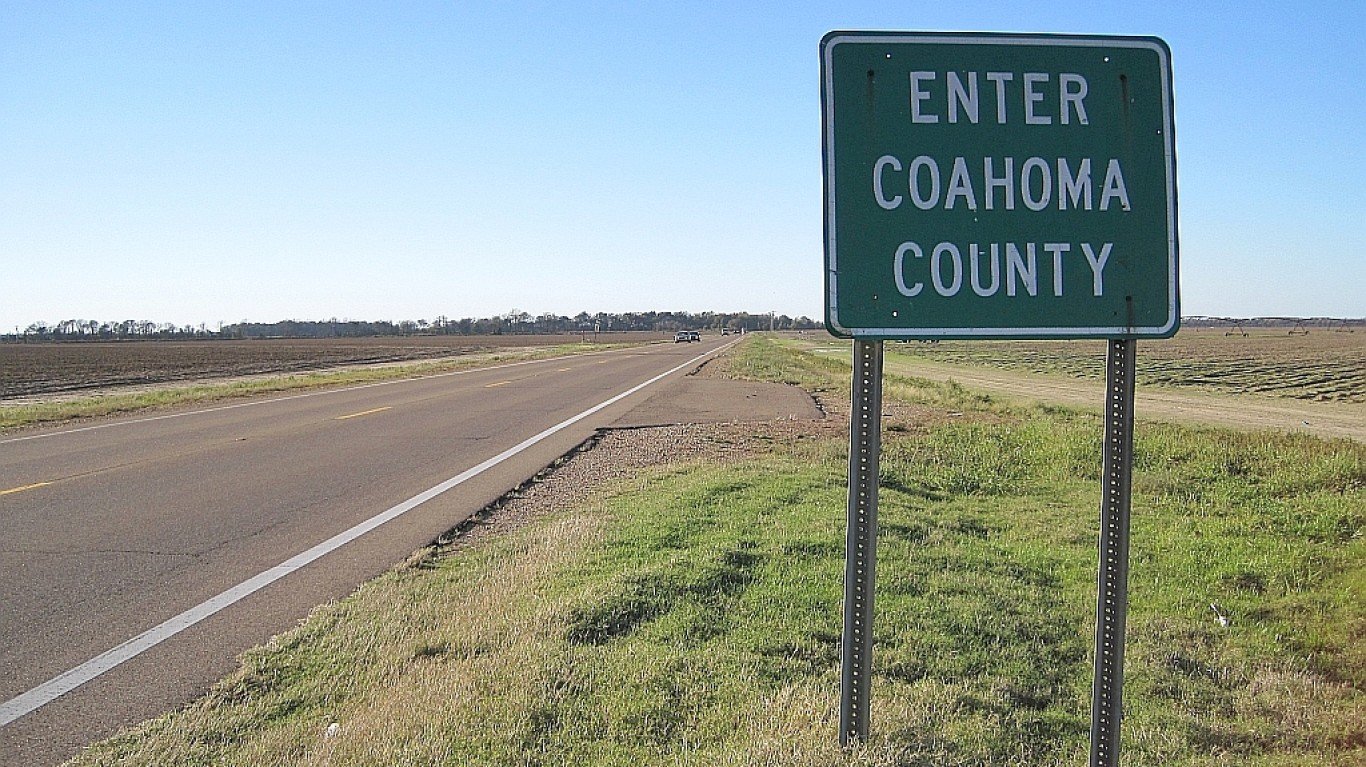
7. Coahoma County, Mississippi
> Avg. annual income loss per year of childhood residence: $273
> Household income per capita: $25,675
> Poverty rate: 34.0%
> Dec. 2019 unemployment: 7.8%
> Population: 23,802
> Largest place in county: Clarksdale
Of the 13 Mississippi counties to rank on this list, Coahoma County, located in the northwestern section of the state, ranks as the worst. As is the case in much of the state, economic opportunities are limited in the county. Between 2010 and 2018, overall employment fell in the area by a staggering 9.8%. The county’s unemployment rate as of December 2019 was 7.8%, well above the comparable 3.4% national rate.
Children who grow up below the poverty line face disadvantages that make success in school and later in life less likely. In Coahoma County, over half of all residents age 17 and younger live below the poverty line, one of the higher child poverty rates in the country.
[in-text-ad-2]
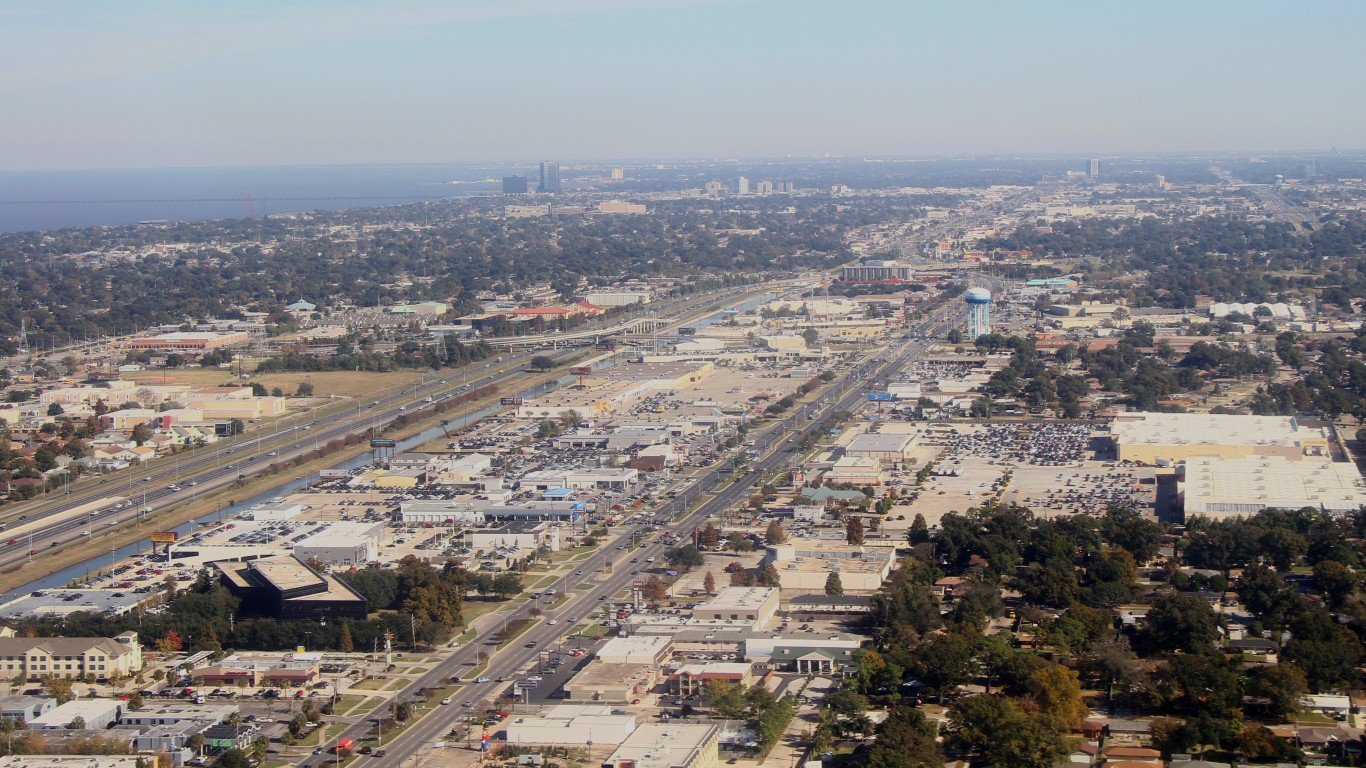
6. Orleans Parish, Louisiana
> Avg. annual income loss per year of childhood residence: $276
> Household income per capita: $31,246
> Poverty rate: 24.6%
> Dec. 2019 unemployment: 4.8%
> Population: 389,648
> Largest place in parish: New Orleans
Unlike many other counties and county equivalents on this list, Orleans Parish, which includes New Orleans, covers a major city and population center. A 26 year old who grew up in a low-income household in the county earns about $276 less annually for each year he or she spent growing up there, compared to the national income per capita of all 26 year olds.
Children who grow up below the poverty line face disadvantages that make success in school and in the workforce less likely. In Orleans Parish, more than one-third of all residents age 17 and younger live below the poverty line.

5. Forsyth County, North Carolina
> Avg. annual income loss per year of childhood residence: $286
> Household income per capita: $41,647
> Poverty rate: 17.6%
> Dec. 2019 unemployment: 3.2%
> Population: 371,573
> Largest place in county: Winston-Salem
Of the five North Carolina counties on this list, Forsyth, located in the northern part of the state around the city of Winston-Salem, ranks as the worst. A 26 year old who grew up in a low-income household in the county earns about $286 less annually for each year he or she spent growing up there, compared to the national income per capita of all 26 year olds.
Like many areas with limited economic mobility, child poverty is relatively common in Forsyth County — about one-quarter of all children in the area live in poverty, compared to 18.0% of children nationwide.
[in-text-ad]
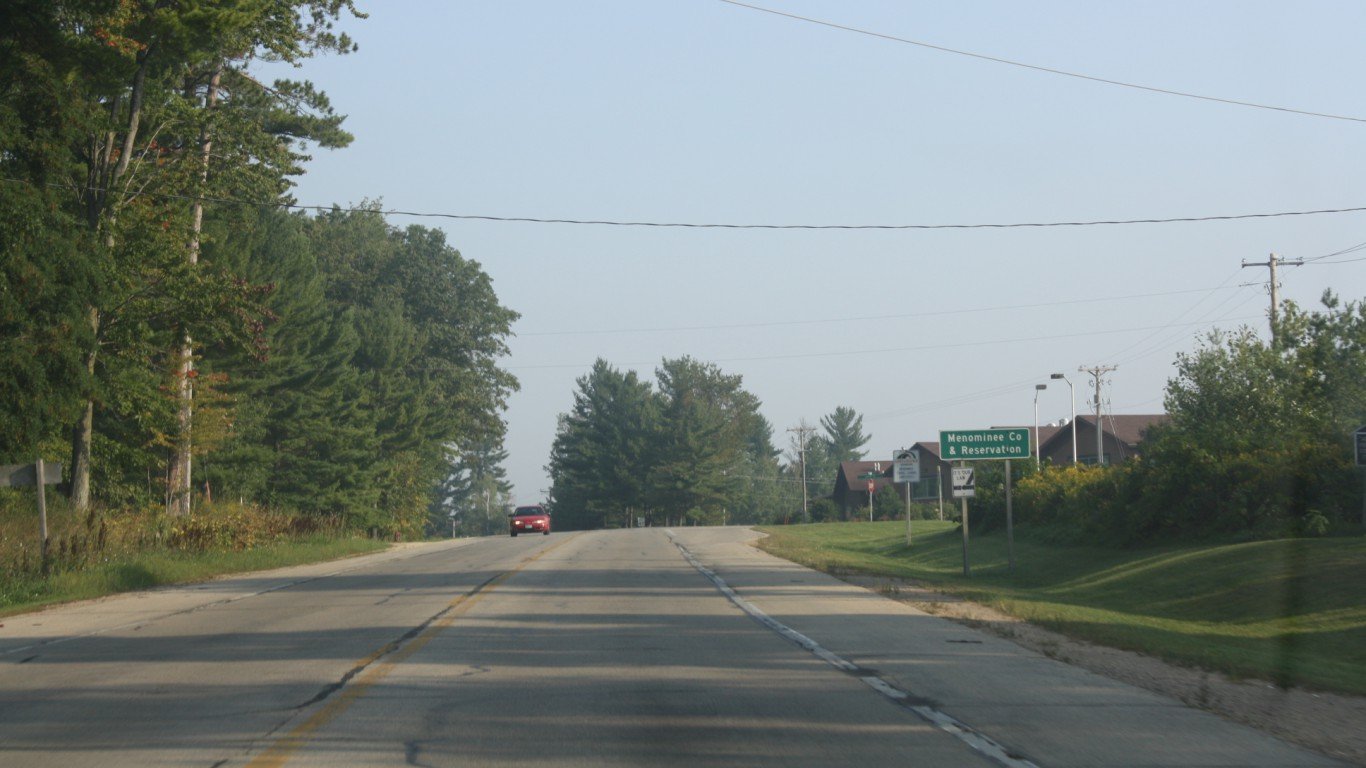
4. Menominee County, Wisconsin
> Avg. annual income loss per year of childhood residence: $313
> Household income per capita: $21,942
> Poverty rate: 32.6%
> Dec. 2019 unemployment: 6.5%
> Population: 4,579
> Largest place in county: Keshena
Menominee County is the worst ranked on our list that is not in the Dakotas. Menominee is home to the Menominee Reservation, and over 80% of the county’s residents are American Indian, a group that has long struggled economically for a wide range of historical reasons.
Menonminee, like many of the counties on this list, has very poor health outcomes. Almost one-third of adults report being in fair or poor health, compared to 16.0% of adults nationwide. Poor health and poverty are closely tied. Living in poverty can lead to worse health outcomes as a result of lower access to adequate care and nutrition as well as an increased likelihood of unhealthy behavior. At the same time, poor health can make it harder for people to earn higher incomes.
[recirclink id=595626]

3. Sioux County, North Dakota
> Avg. annual income loss per year of childhood residence: $318
> Household income per capita: $16,103
> Poverty rate: 36.5%
> Dec. 2019 unemployment: 2.8%
> Population: 4,413
> Largest place in county: Cannon Ball
Sioux County ranks as the third worst county for upward economic mobility nationwide. For each year spent in the county as a child living in a low-income household, a 26 year old earns $318 less than the national figure for 26 year olds. Income inequality is extremely high in the county, as a household in the 80th percentile of incomes earns roughly seven times as much as a household in the 20th percentile in the county. Nationwide, a household in the 80th percentile has an income 4.9 times higher than the income of a household in the 20th percentile.

2. Todd County, South Dakota
> Avg. annual income loss per year of childhood residence: $441
> Household income per capita: $16,641
> Poverty rate: 55.1%
> Dec. 2019 unemployment: 6.6%
> Population: 10,146
> Largest place in county: Rosebud
Like many of the counties on our list, Todd County, South Dakota is home to a substantial Native American population, a group that has long faced serious disadvantages that have made economic mobility more difficult than for others living in the United States. The county is home to the Rosebud Indian Reservation.
A 26 year old who grew up in a low-income household in the county earns $441 less annually than the national income per capita among 26 year olds for each year he or she spent growing up there. Children who grow up in a single-parent household, are far more likely to struggle economically than those who grow up in a two-parent household. In Todd County, 73.7% of children live in a household with a single parent, well more than double the national share and one of the highest shares of any county.
[in-text-ad-2]

1. Oglala Lakota County, South Dakota
> Avg. annual income loss per year of childhood residence: $484
> Household income per capita: $13,647
> Poverty rate: 49.3%
> Dec. 2019 unemployment: 10.0%
> Population: 14,335
> Largest place in county: N/A
Oglala Lakota County, South Dakota, ranks as the worst county for upward economic mobility nationwide. For each year spent in the county as a child living in a low-income household, a 26 year old earns a staggering $484 less than the national income per capita for that age, the biggest income loss of any county in the country. The county is home to part of the Pine Ridge Reservation, and nearly 90% of county residents are American Indian, a group that has long struggled economically due to a range of historic factors.
Those who have acquired an education are more likely to earn better wages and potentially transcend a low-income upbringing. In Oglala Lakota County, 76.0% of adults have a high school diploma, and only 11.8% have a bachelor’s degree, each well below the national shares of 87.7% and 31.5%, respectively.
Methodology
To identify the counties where the American dream is dead, 24/7 Wall St. reviewed the effect on household income earned in adulthood for every year of childhood spent in nearly 3,000 U.S. counties and county equivalents from data published by The Equality of Opportunity Project. Researchers at the organization used data from 1996-2012 tax returns to study the long-term economic outcomes of approximately 50 million children.
This annual effect on adult earnings is called the exposure effect and is measured as the percentage gained or lost from the per capita annual household income — $26,090 — for a 26-year-old in the bottom quartile of U.S. earners. To find the average income lost in each county per year, we multiplied the exposure effect by this income threshold.
The Equality of Opportunity Project publishes economic mobility-related research and data files for public use. It receives funding from Stanford University, Harvard University, the National Science Foundation, and several charitable groups, including the Robert Wood Johnson Foundation.
Population figures, poverty rates, educational attainment, income inequality for each county came from the U.S. Census Bureau’s 2018 American Community Survey and are 5-year averages.
December 2019 unemployment rates are not seasonally adjusted and are from the U.S. Bureau of Labor Statistics. Employment change also came from the BLS.
The share of children growing up in single-parent households and various health measures came from County Health Rankings & Roadmaps, a Robert Wood Johnson Foundation and University of Wisconsin Population Health Institute joint program.
Contact [email protected] for any questions or corrections.