[cnxvideo id=”768861″ placement=”ros”]The allure of the American dream is the promise of equal opportunity, which allows a person achieve any goal. This means economic opportunity and mobility to any American, and especially to new generations. While debate rages on about just how widespread the experience of the American dream is, research certainly indicates it is not uniform across the country.
While opportunities and upward income mobility exist in some areas, they are nearly non-existent in others and have been falling sharply in recent decades.
It used to be that the vast majority of children ended up earning more than their parents. Today, however, the situation is considerably different. According to recent research on intergenerational mobility, approximately 90% of those born in the 1940s earned more than their parents, while only about 50% of those born in the 1980s do.
The Equality of Opportunity Project — now part of the Opportunity Insights program at Harvard University — considered average incomes of 26-year-olds raised in the bottom quartile of income in 2,973 U.S. counties and county equivalents (such as parishes, boroughs, Census Areas, and certain cities). A 26-year-old from this background who earns more than the national average for the bottom quartile is said to have managed upward income mobility.
The researchers found that neighborhood environments have substantial effects on children’s long-term economic outcomes. The probability of earning in adulthood more than $26,090 — the average annual income for the bottom quartile nationally — declines every year of childhood spent in nearly 1,000 low-income counties. To highlight the substantial geographic variation of this pattern, 24/7 Wall St. reviewed the 50 counties and county equivalents where the average income losses are greatest.
Children growing up in counties with less concentrated poverty, less income inequality, better schools, a larger share of two-parent families, and lower crime rates are significantly more likely to surpass their parents later in life. The counties where the American dream is dead include some of the worst counties to live in.
Click here to see the counties where the American dream is dead
Methodology
To identify the counties where the American dream is dead, 24/7 Wall St. reviewed the effect on household income earned in adulthood for every year of childhood spent in 2,973 U.S. counties and county equivalents from data published by The Equality of Opportunity Project. Researchers at the organization used data from 1996-2012 tax returns to study the long-term economic outcomes of approximately 50 million children.
This annual effect on adult earnings is called the exposure effect and is measured as the percentage gained or lost from the average annual household income for a 26 year old in the bottom quartile of U.S. earners — $26,090. To find the average income lost per county per year, we multiplied the exposure effect by this income threshold.
The Equality of Opportunity Project publishes economic mobility-related research and data files for public use. It receives funding from Stanford University, Harvard University, the National Science Foundation, and several charitable groups, including the Robert Wood Johnson Foundation.
Population figures and poverty rates for each county came from the U.S. Census Bureau’s 2017 American Community Survey and are 5-year averages. February 2019 unemployment rates are seasonally adjusted from the U.S. Bureau of Labor Statistics.

50. Macon County, Alabama
> Avg. income loss per year of childhood residence: -$201
> Population: 19,358
> Household income per capita: $24,917
> Poverty rate: 25.9%
> Feb. 2019 unemployment rate: 5.6%
[in-text-ad]
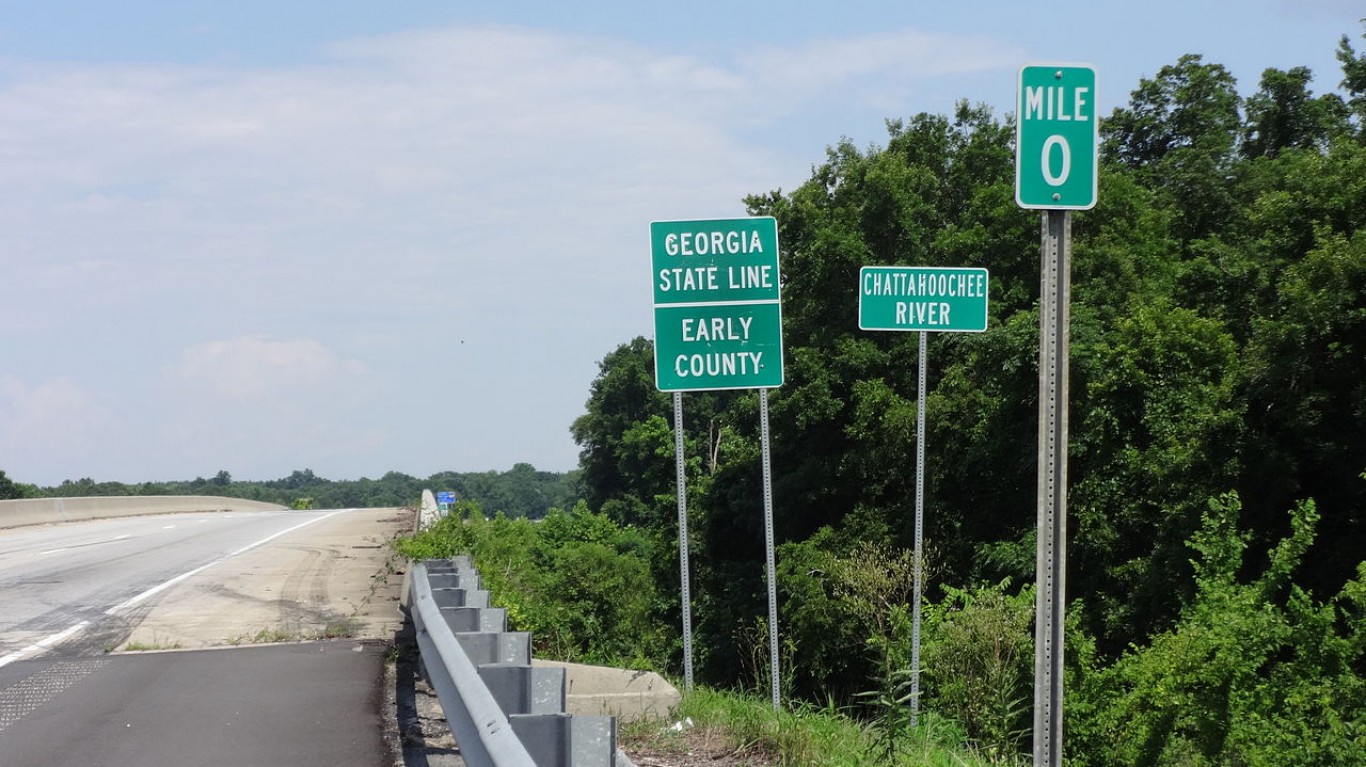
49. Early County, Georgia
> Avg. income loss per year of childhood residence: -$201
> Population: 10,405
> Household income per capita: $30,163
> Poverty rate: 27.5%
> Feb. 2019 unemployment rate: 4.5%
[recirclink id=486757]

48. Fairfield County, South Carolina
> Avg. income loss per year of childhood residence: -$202
> Population: 947,328
> Household income per capita: $28,030
> Poverty rate: 8.8%
> Feb. 2019 unemployment rate: 4.3%
47. Rolette County, North Dakota
> Avg. income loss per year of childhood residence: -$202
> Population: 14,657
> Household income per capita: $22,565
> Poverty rate: 32.4%
> Feb. 2019 unemployment rate: 8.5%
[in-text-ad-2]

46. Atlantic County, New Jersey
> Avg. income loss per year of childhood residence: -$203
> Population: 272,926
> Household income per capita: $38,869
> Poverty rate: 15.3%
> Feb. 2019 unemployment rate: 6.9%
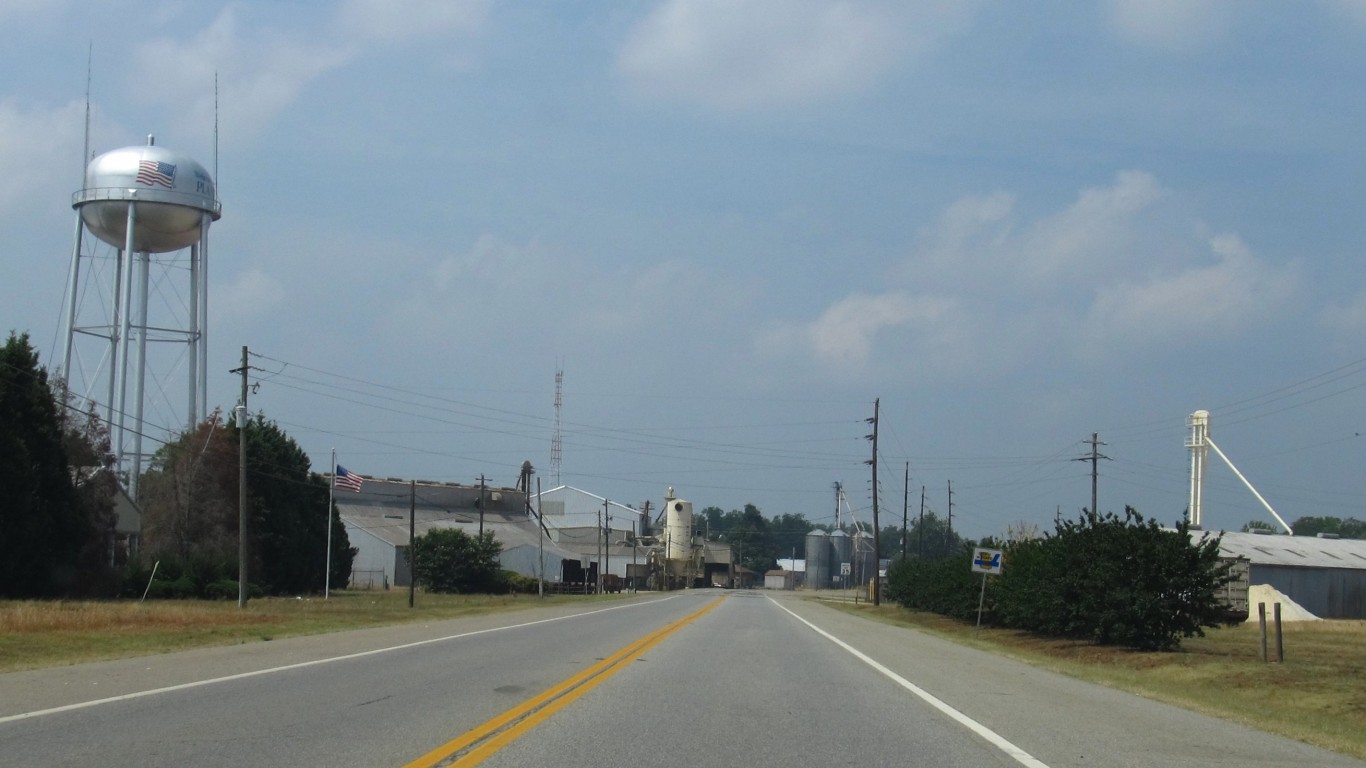
45. Hoke County, North Carolina
> Avg. income loss per year of childhood residence: -$203
> Population: 52,571
> Household income per capita: $24,807
> Poverty rate: 21.9%
> Feb. 2019 unemployment rate: 5.3%
[in-text-ad]

44. East Baton Rouge Parish, Louisiana
> Avg. income loss per year of childhood residence: -$203
> Population: 446,167
> Household income per capita: $35,064
> Poverty rate: 19.1%
> Feb. 2019 unemployment rate: 3.9%
[recirclink id=536182]

43. Spalding County, Georgia
> Avg. income loss per year of childhood residence: -$203
> Population: 64,192
> Household income per capita: $31,155
> Poverty rate: 21.6%
> Feb. 2019 unemployment rate: 4.7%
42. Greene County, Alabama
> Avg. income loss per year of childhood residence: -$204
> Population: 8,533
> Household income per capita: $27,644
> Poverty rate: 38.8%
> Feb. 2019 unemployment rate: 6.7%
[in-text-ad-2]
41. Baldwin County, Georgia
> Avg. income loss per year of childhood residence: -$204
> Population: 203,360
> Household income per capita: $26,337
> Poverty rate: 11.8%
> Feb. 2019 unemployment rate: 3.7%

40. Guilford County, North Carolina
> Avg. income loss per year of childhood residence: -$205
> Population: 517,197
> Household income per capita: $41,339
> Poverty rate: 16.7%
> Feb. 2019 unemployment rate: 4.4%
[in-text-ad]
39. Terrell County, Georgia
> Avg. income loss per year of childhood residence: -$205
> Population: 8,978
> Household income per capita: $26,851
> Poverty rate: 35.3%
> Feb. 2019 unemployment rate: 6.0%
[recirclink id=539174]

38. Crittenden County, Arkansas
> Avg. income loss per year of childhood residence: -$206
> Population: 49,278
> Household income per capita: $27,744
> Poverty rate: 23.5%
> Feb. 2019 unemployment rate: 5.0%

37. Gadsden County, Florida
> Avg. income loss per year of childhood residence: -$208
> Population: 46,113
> Household income per capita: $25,763
> Poverty rate: 24.4%
> Feb. 2019 unemployment rate: 4.4%
[in-text-ad-2]
36. Sumter County, Georgia
> Avg. income loss per year of childhood residence: -$208
> Population: 13,084
> Household income per capita: $28,432
> Poverty rate: 36.0%
> Feb. 2019 unemployment rate: 5.5%

35. East Carroll Parish, Louisiana
> Avg. income loss per year of childhood residence: -$210
> Population: 7,318
> Household income per capita: $18,062
> Poverty rate: 48.2%
> Feb. 2019 unemployment rate: 10.7%
[in-text-ad]
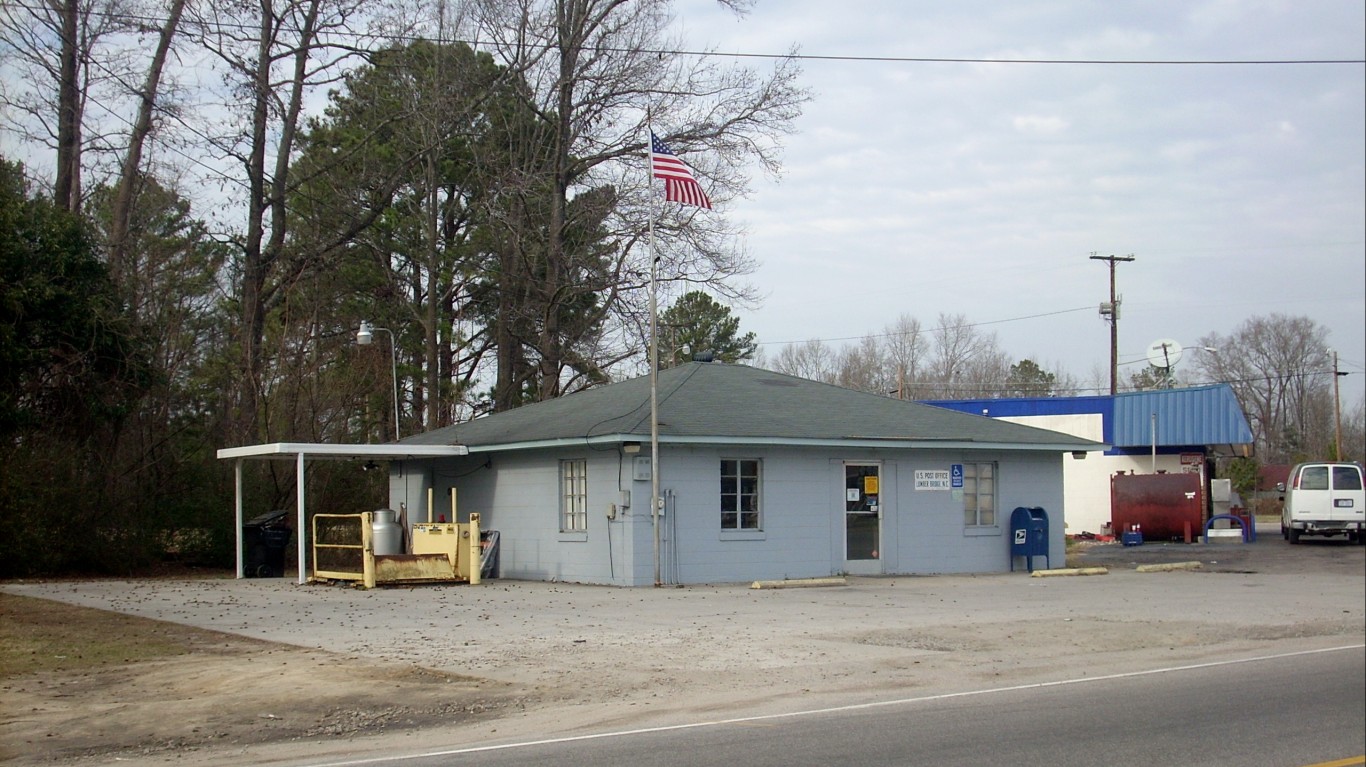
34. Robeson County, North Carolina
> Avg. income loss per year of childhood residence: -$212
> Population: 134,187
> Household income per capita: $24,221
> Poverty rate: 29.2%
> Feb. 2019 unemployment rate: 6.0%
[recirclink id=538433]
33. Hancock County, Georgia
> Avg. income loss per year of childhood residence: -$214
> Population: 8,667
> Household income per capita: $17,928
> Poverty rate: 30.0%
> Feb. 2019 unemployment rate: 6.3%
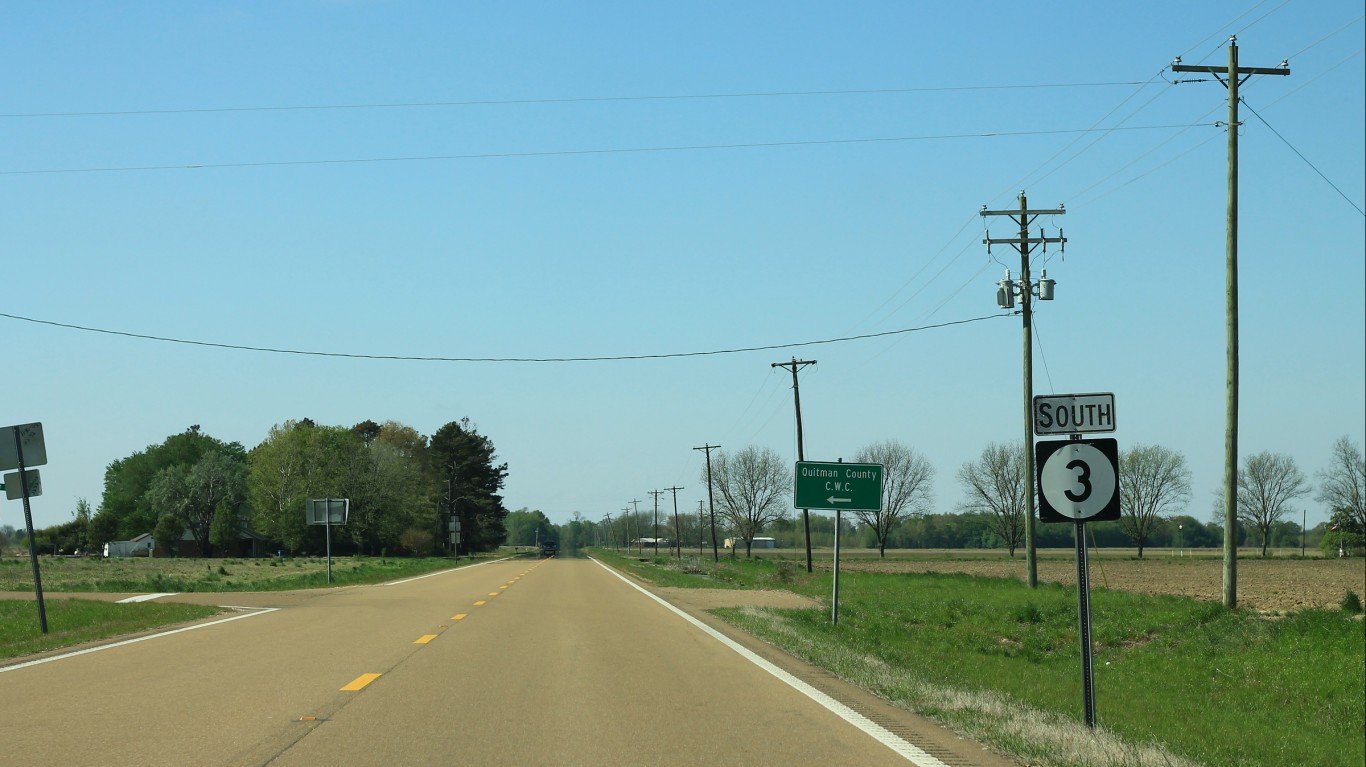
32. Quitman County, Mississippi
> Avg. income loss per year of childhood residence: -$214
> Population: 2,140
> Household income per capita: $22,166
> Poverty rate: 22.8%
> Feb. 2019 unemployment rate: 5.5%
[in-text-ad-2]
31. Grenada County, Mississippi
> Avg. income loss per year of childhood residence: -$215
> Population: 21,379
> Household income per capita: $26,818
> Poverty rate: 24.2%
> Feb. 2019 unemployment rate: 4.6%

30. St. Louis city, Missouri
> Avg. income loss per year of childhood residence: -$216
> Population: 314,867
> Household income per capita: $30,072
> Poverty rate: 25.0%
> Feb. 2019 unemployment rate: 4.1%
[in-text-ad]
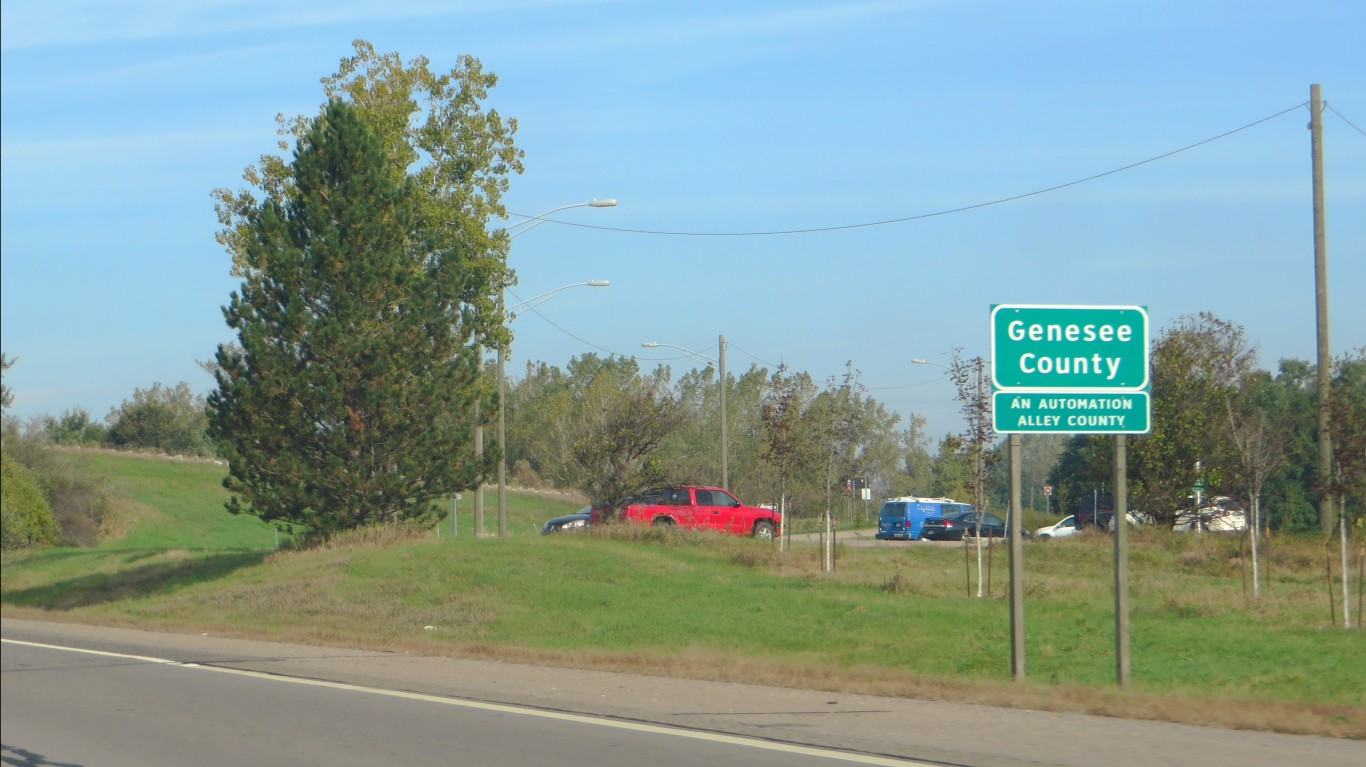
29. Genesee County, Michigan
> Avg. income loss per year of childhood residence: -$217
> Population: 410,881
> Household income per capita: $38,963
> Poverty rate: 20.0%
> Feb. 2019 unemployment rate: 4.9%
[recirclink id=514997]

28. Washington County, Mississippi
> Avg. income loss per year of childhood residence: -$218
> Population: 16,746
> Household income per capita: $26,530
> Poverty rate: 22.0%
> Feb. 2019 unemployment rate: 6.2%

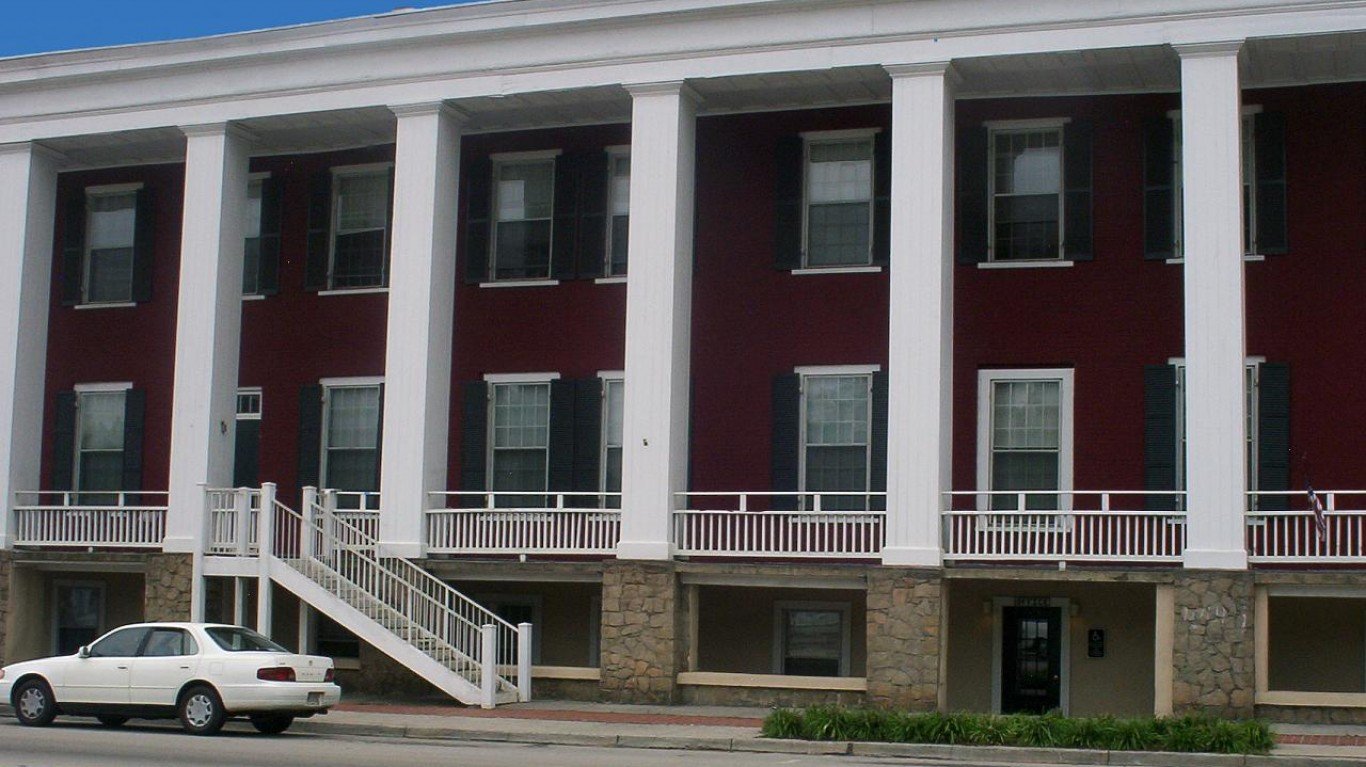
27. Scotland County, North Carolina
> Avg. income loss per year of childhood residence: -$219
> Population: 4,883
> Household income per capita: $29,071
> Poverty rate: 16.7%
> Feb. 2019 unemployment rate: 4.0%
[in-text-ad-2]

26. Oktibbeha County, Mississippi
> Avg. income loss per year of childhood residence: -$219
> Population: 49,392
> Household income per capita: $24,040
> Poverty rate: 29.8%
> Feb. 2019 unemployment rate: 4.5%

25. Bolivar County, Mississippi
> Avg. income loss per year of childhood residence: -$223
> Population: 33,121
> Household income per capita: $22,311
> Poverty rate: 37.4%
> Feb. 2019 unemployment rate: 6.5%
[in-text-ad]

24. Sunflower County, Mississippi
> Avg. income loss per year of childhood residence: -$228
> Population: 26,915
> Household income per capita: $18,895
> Poverty rate: 32.5%
> Feb. 2019 unemployment rate: 8.9%
[recirclink id=495253]

23. Allendale County, South Carolina
> Avg. income loss per year of childhood residence: -$229
> Population: 9,402
> Household income per capita: $21,262
> Poverty rate: 30.4%
> Feb. 2019 unemployment rate: 5.4%

22. Tallahatchie County, Mississippi
> Avg. income loss per year of childhood residence: -$230
> Population: 14,552
> Household income per capita: $21,421
> Poverty rate: 28.3%
> Feb. 2019 unemployment rate: 6.3%
[in-text-ad-2]

21. Nome Census Area, Alaska
> Avg. income loss per year of childhood residence: -$230
> Population: 9,869
> Household income per capita: $29,589
> Poverty rate: 24.9%
> Feb. 2019 unemployment rate: 12.9%

20. Big Horn County, Montana
> Avg. income loss per year of childhood residence: -$230
> Population: 13,290
> Household income per capita: $20,646
> Poverty rate: 26.8%
> Feb. 2019 unemployment rate: 9.2%
[in-text-ad]

19. Roanoke City, Virginia
> Avg. income loss per year of childhood residence: -$233
> Population: 99,572
> Household income per capita: $34,745
> Poverty rate: 21.6%
> Feb. 2019 unemployment rate: 3.3%
[recirclink id=491648]

18. Dewey County, South Dakota
> Avg. income loss per year of childhood residence: -$235
> Population: 4,904
> Household income per capita: $19,529
> Poverty rate: 18.6%
> Feb. 2019 unemployment rate: 2.0%

17. Hinds County, Mississippi
> Avg. income loss per year of childhood residence: -$235
> Population: 243,249
> Household income per capita: $32,627
> Poverty rate: 23.9%
> Feb. 2019 unemployment rate: 4.6%
[in-text-ad-2]

16. Leflore County, Mississippi
> Avg. income loss per year of childhood residence: -$236
> Population: 30,113
> Household income per capita: $23,465
> Poverty rate: 40.3%
> Feb. 2019 unemployment rate: 7.3%

15. Richmond City, Virginia
> Avg. income loss per year of childhood residence: -$240
> Population: 220,892
> Household income per capita: $35,536
> Poverty rate: 25.2%
> Feb. 2019 unemployment rate: 3.7%
[in-text-ad]

14. Clarke County, Georgia
> Avg. income loss per year of childhood residence: -$242
> Population: 24,625
> Household income per capita: $26,220
> Poverty rate: 25.3%
> Feb. 2019 unemployment rate: 7.6%
[recirclink id=490296]
13. Claiborne County, Mississippi
> Avg. income loss per year of childhood residence: -$242
> Population: 9,106
> Household income per capita: $19,485
> Poverty rate: 45.9%
> Feb. 2019 unemployment rate: 8.9%

12. Kusilvak Census Area, Alaska
> Avg. income loss per year of childhood residence: -$245
> Population: 8,129
> Household income per capita: $19,557
> Poverty rate: 39.1%
> Feb. 2019 unemployment rate: 22.2%
[in-text-ad-2]
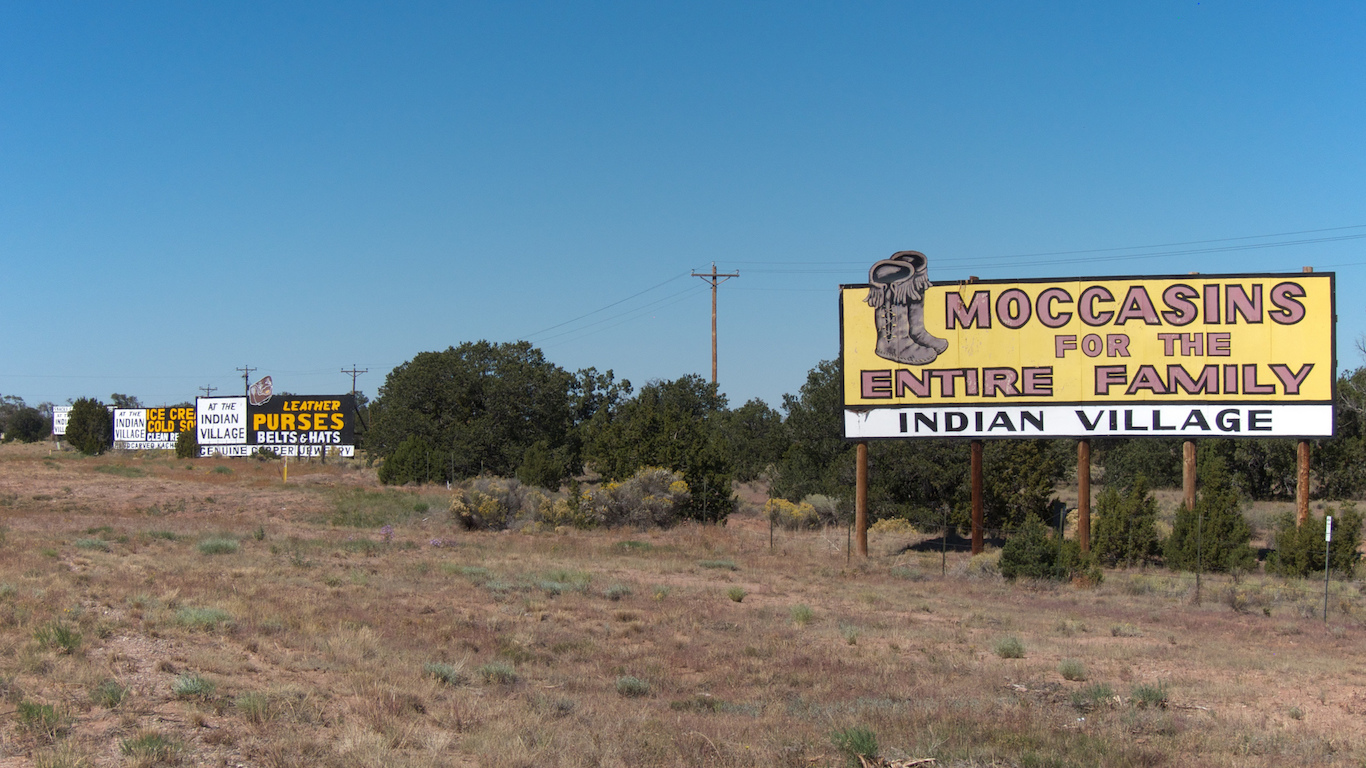
11. McKinley County, New Mexico
> Avg. income loss per year of childhood residence: -$248
> Population: 72,849
> Household income per capita: $19,744
> Poverty rate: 37.5%
> Feb. 2019 unemployment rate: 7.5%

10. Tunica County, Mississippi
> Avg. income loss per year of childhood residence: -$249
> Population: 10,276
> Household income per capita: $22,618
> Poverty rate: 27.0%
> Feb. 2019 unemployment rate: 6.2%
[in-text-ad]

9. Humphreys County, Mississippi
> Avg. income loss per year of childhood residence: -$254
> Population: 8,678
> Household income per capita: $21,846
> Poverty rate: 40.5%
> Feb. 2019 unemployment rate: 10.2%
[recirclink id=486757]

8. Glacier County, Montana
> Avg. income loss per year of childhood residence: -$263
> Population: 13,677
> Household income per capita: $23,252
> Poverty rate: 33.1%
> Feb. 2019 unemployment rate: 9.8%
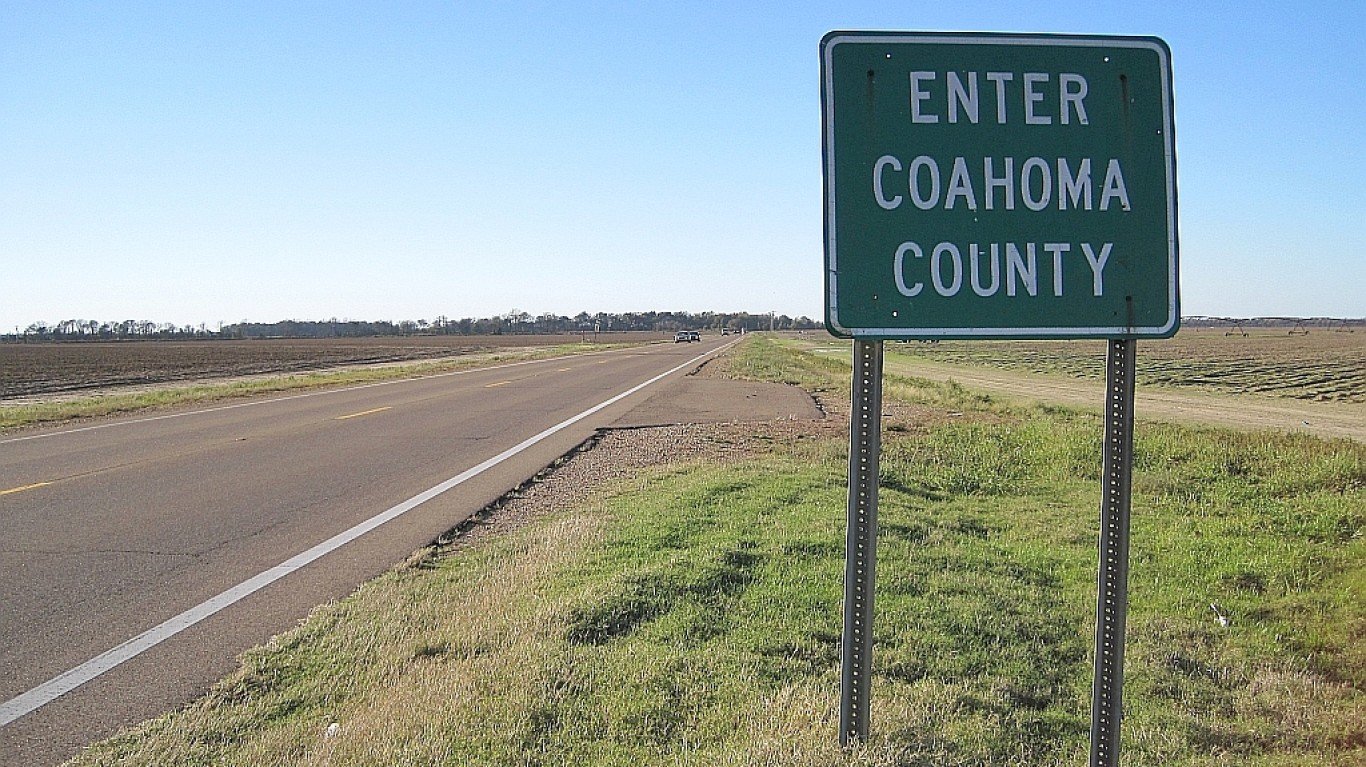
7. Coahoma County, Mississippi
> Avg. income loss per year of childhood residence: -$273
> Population: 24,296
> Household income per capita: $25,675
> Poverty rate: 36.2%
> Feb. 2019 unemployment rate: 7.6%
[in-text-ad-2]
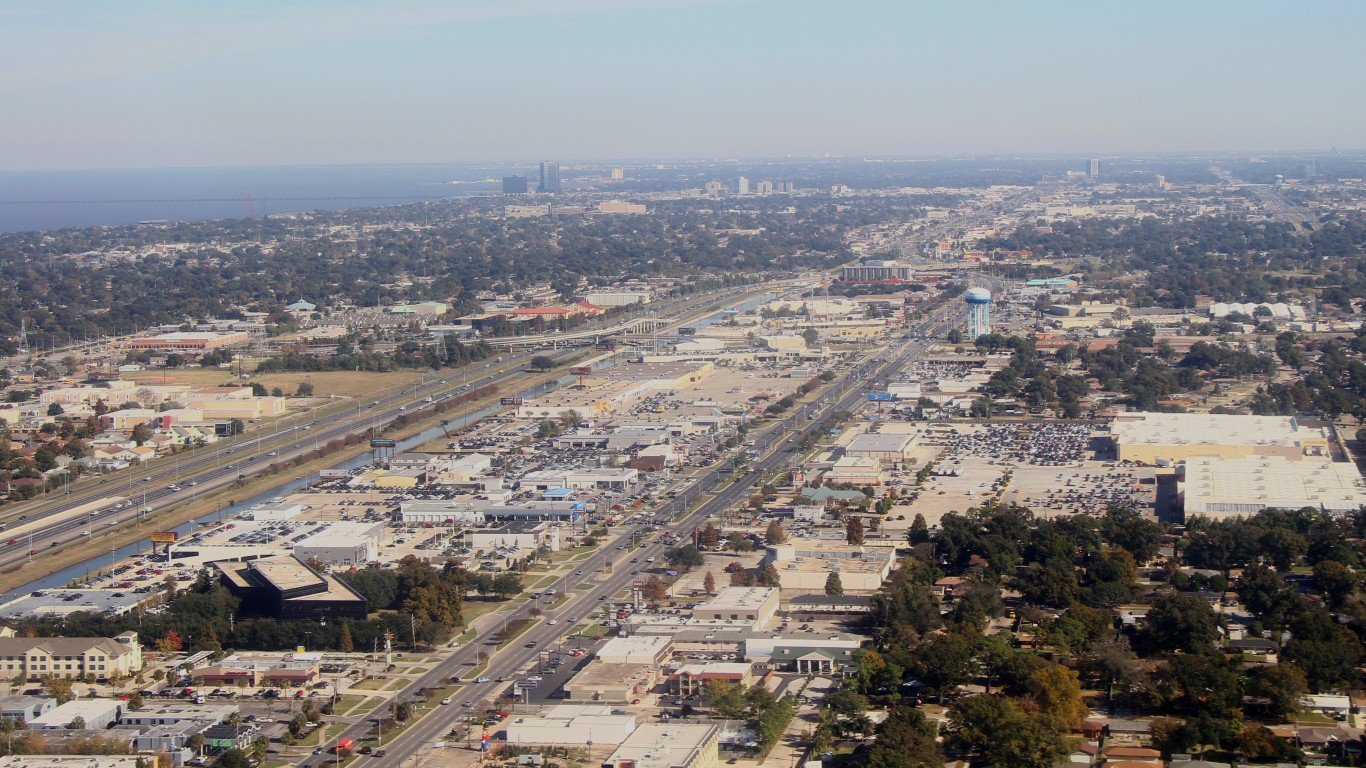
6. Orleans County, Louisiana
> Avg. income loss per year of childhood residence: -$276
> Population: 41,584
> Household income per capita: $31,246
> Poverty rate: 15.9%
> Feb. 2019 unemployment rate: 5.1%

5. Forsyth County, North Carolina
> Avg. income loss per year of childhood residence: -$286
> Population: 211,300
> Household income per capita: $41,647
> Poverty rate: 6.5%
> Feb. 2019 unemployment rate: 3.2%
[in-text-ad]
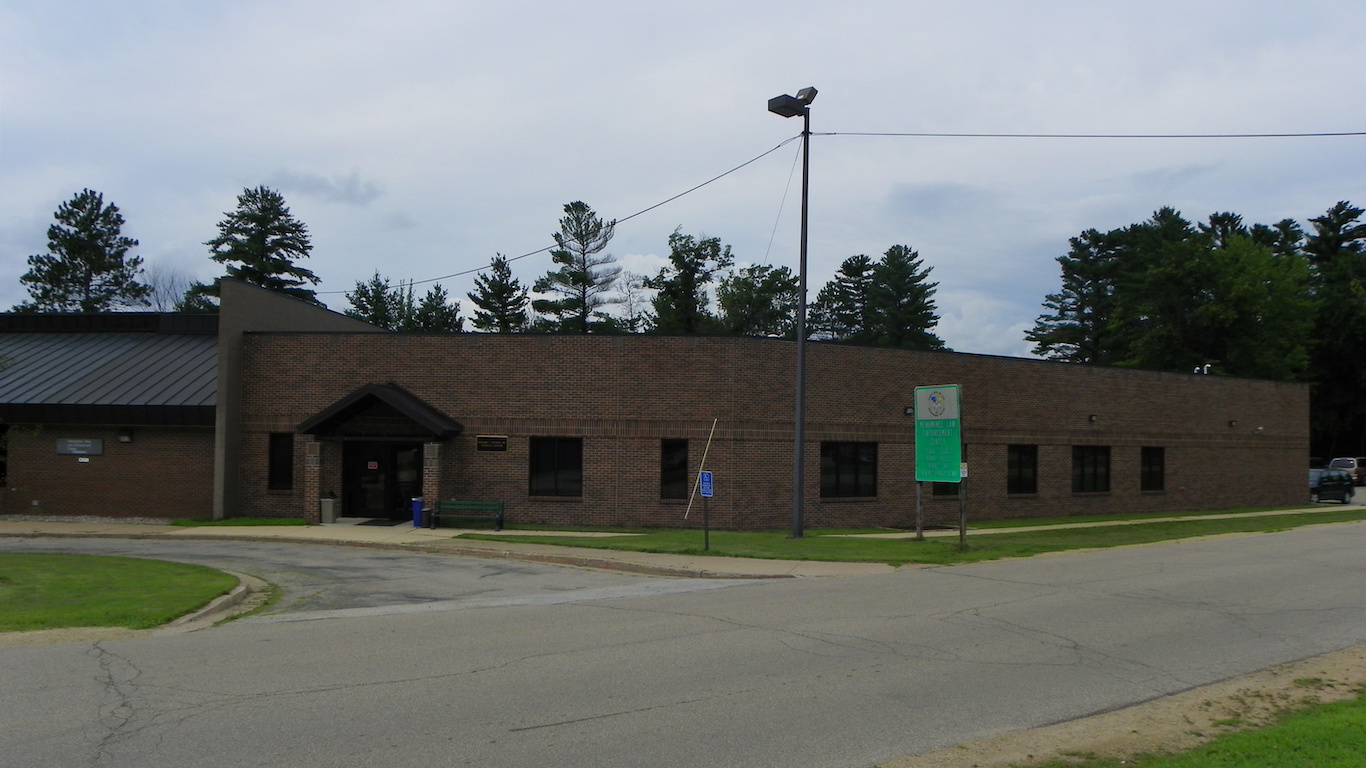
4. Menominee County, Wisconsin
> Avg. income loss per year of childhood residence: -$313
> Population: 23,389
> Household income per capita: $21,942
> Poverty rate: 13.5%
> Feb. 2019 unemployment rate: 4.1%
[recirclink id=536182]
3. Sioux County, North Dakota
> Avg. income loss per year of childhood residence: -$318
> Population: 34,692
> Household income per capita: $16,103
> Poverty rate: 7.9%
> Feb. 2019 unemployment rate: 2.2%
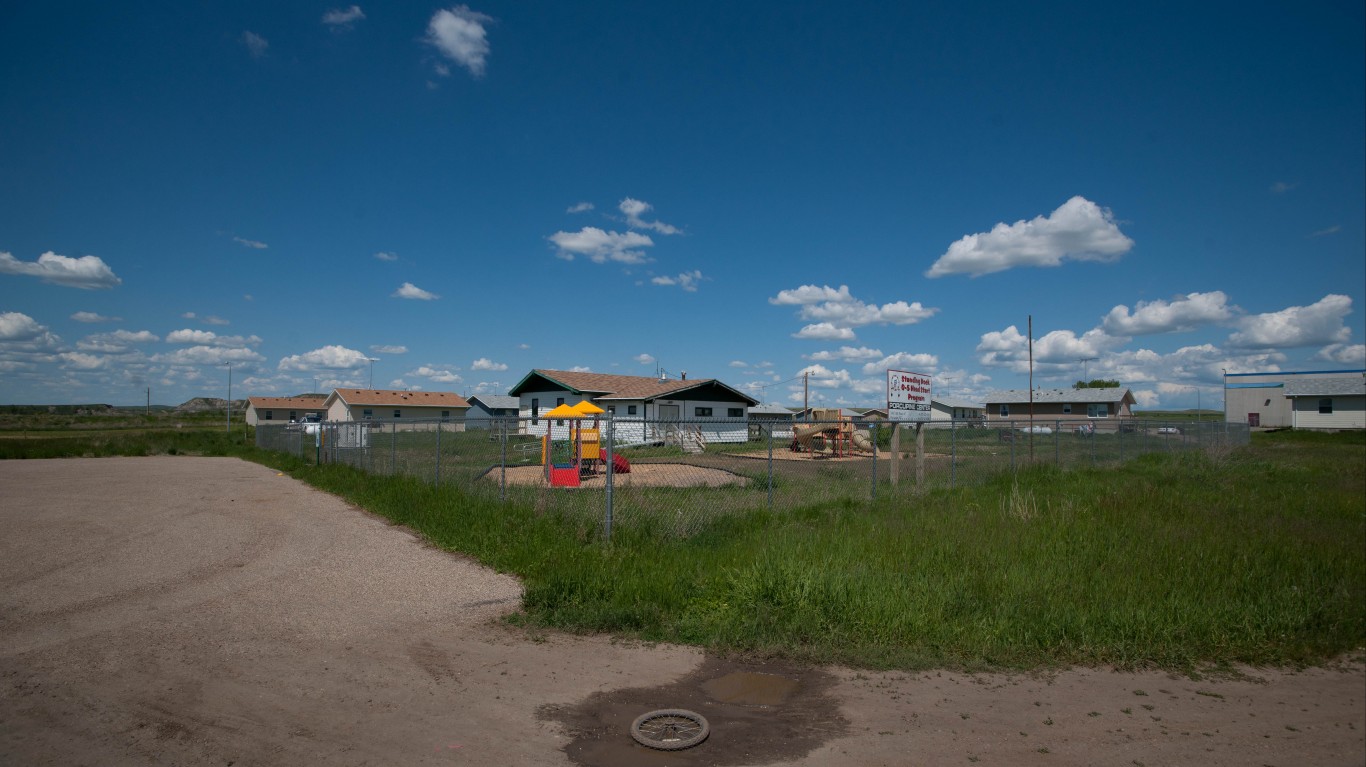
2. Todd County, South Dakota
> Avg. income loss per year of childhood residence: -$441
> Population: 12,377
> Household income per capita: $16,641
> Poverty rate: 20.1%
> Feb. 2019 unemployment rate: 4.0%
[in-text-ad-2]
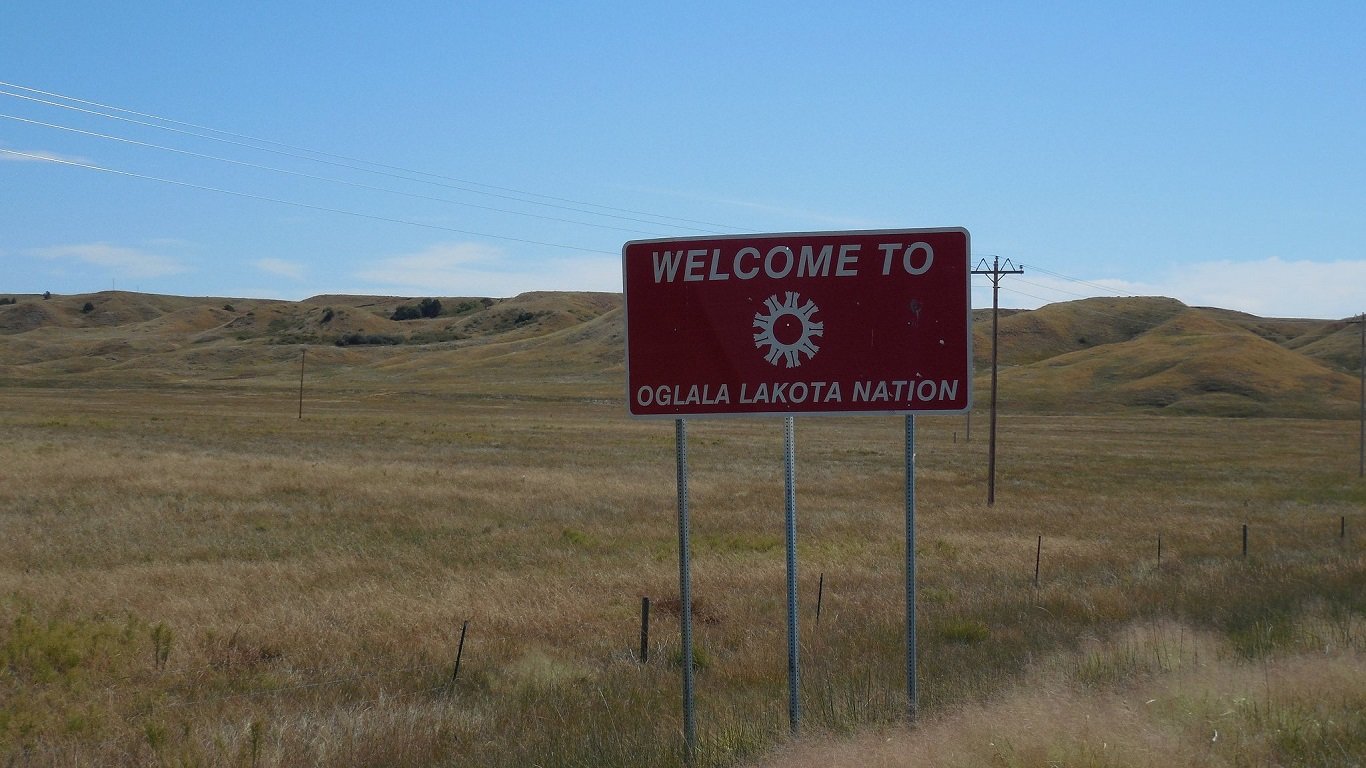
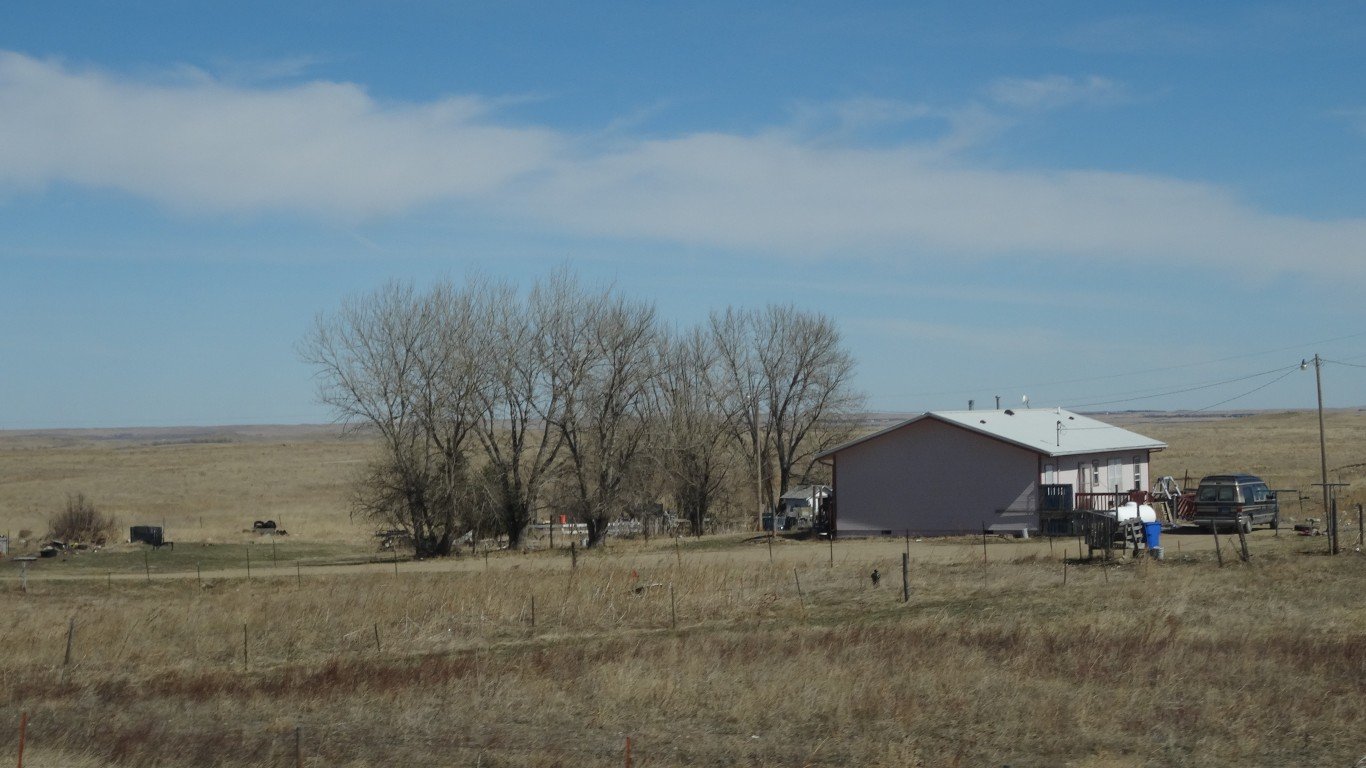
1. Oglala Lakota County, South Dakota
> Avg. income loss per year of childhood residence: -$484
> Population: 14,291
> Household income per capita: $13,647
> Poverty rate: 51.9%
> Feb. 2019 unemployment rate: 8.2%
Contact [email protected] for any questions or corrections.