
[cnxvideo id=”509523″ placement=”ros”]
Americans are less likely to move today than at any point in recent history. Over the 12 months ending in March 2019, the share of Americans who moved to a new home dipped below 10% for the first time since the U.S. Census Bureau began keeping track in 1947.
Still, an average of 35 million Americans have moved every year since 2010 — and in some cities, people are leaving much faster than they are arriving. To determine the cities Americans are abandoning in every state, 24/7 Wall St. used data from the Census Bureau’s Population Estimates Program and identified the metro area with the largest net-migration decline from April 1, 2010 to July 1, 2018 in every state.
Net migration is the difference between the number of new residents — either from other parts of the country or from abroad — and the number of residents who have moved elsewhere. It is not a measure of total population change, which is also a product of births and deaths.
It is important to note that four states — Delaware, New Hampshire. Rhode Island, and Vermont — have only one metropolitan area each, and each case reported a net migration increase. Additionally, Colorado, Florida, Nevada, Oregon, South Dakota, and Wyoming have no metro areas with a net migration decline between 2010 and 2018 .
Some of the most commonly cited reasons for packing up and moving to a new city are related to employment. Last year, more than one in every five moves were prompted by work-related reasons. In many of the cities Americans are abandoning, job availability is relatively low, as most have unemployment rates as high or higher than the 3.6% national rate. Here is a look at the hardest states to find full-time work.
Click here to see the cities Americans are abandoning in every state
Click here to see the cities Americans are flocking to in every state

1. Alabama: Montgomery
> Population change due to migration, 2010-2018: -12,144 (-3.2%)
> Overall population change, 2010-2018: -1,316 (-0.4%)
> 2018 population: 373,225
> Median household income: $51,943
> January 2020 unemployment: 2.7%
[in-text-ad]

2. Alaska: Fairbanks
> Population change due to migration, 2010-2018: -8,736 (-9.0%)
> Overall population change, 2010-2018: +1,386 (+1.4%)
> 2018 population: 98,971
> Median household income: $75,448
> January 2020 unemployment: 5.3%
[recirclink id=569954]

3. Arizona: Sierra Vista-Douglas
> Population change due to migration, 2010-2018: -7,484 (-5.7%)
> Overall population change, 2010-2018: -4,587 (-3.5%)
> 2018 population: 126,770
> Median household income: $50,495
> January 2020 unemployment: 5.5%

4. Arkansas: Pine Bluff
> Population change due to migration, 2010-2018: -11,360 (-11.3%)
> Overall population change, 2010-2018: -10,775 (-10.7%)
> 2018 population: 89,515
> Median household income: $37,314
> January 2020 unemployment: 5.3%
[in-text-ad-2]

5. California: Hanford-Corcoran
> Population change due to migration, 2010-2018: -14,567 (-9.5%)
> Overall population change, 2010-2018: -1,616 (-1.1%)
> 2018 population: 151,366
> Median household income: $61,663
> January 2020 unemployment: 7.6%

6. Colorado: None
[in-text-ad]

7. Connecticut: Norwich-New London
> Population change due to migration, 2010-2018: -9,732 (-3.6%)
> Overall population change, 2010-2018: -7,284 (-2.7%)
> 2018 population: 266,784
> Median household income: $67,197
> January 2020 unemployment: 3.6%
[recirclink id=648274]

8. Delaware: None

9. Florida: None
[in-text-ad-2]

10. Georgia: Hinesville
> Population change due to migration, 2010-2018: -8,248 (-10.6%)
> Overall population change, 2010-2018: +2,576 (+3.3%)
> 2018 population: 80,495
> Median household income: $47,234
> January 2020 unemployment: 3.5%

11. Hawaii: Urban Honolulu
> Population change due to migration, 2010-2018: -19,098 (-2.0%)
> Overall population change, 2010-2018: +26,874 (+2.8%)
> 2018 population: 980,080
> Median household income: $84,423
> January 2020 unemployment: 2.5%
[in-text-ad]

12. Idaho: Pocatello
> Population change due to migration, 2010-2018: -647 (-0.8%)
> Overall population change, 2010-2018: +4,296 (+5.2%)
> 2018 population: 87,138
> Median household income: $50,748
> January 2020 unemployment: 2.7%
[recirclink id=648269]

13. Illinois: Danville
> Population change due to migration, 2010-2018: -5,455 (-6.7%)
> Overall population change, 2010-2018: -4,819 (-5.9%)
> 2018 population: 76,806
> Median household income: $43,655
> January 2020 unemployment: 4.9%

14. Indiana: Muncie
> Population change due to migration, 2010-2018: -2,889 (-2.5%)
> Overall population change, 2010-2018: -2,892 (-2.5%)
> 2018 population: 114,772
> Median household income: $41,662
> January 2020 unemployment: 3.8%
[in-text-ad-2]

15. Iowa: Sioux City
> Population change due to migration, 2010-2018: -6,978 (-4.1%)
> Overall population change, 2010-2018: +482 (+0.3%)
> 2018 population: 169,045
> Median household income: $61,576
> January 2020 unemployment: 2.8%

16. Kansas: Manhattan
> Population change due to migration, 2010-2018: -2,405 (-2.6%)
> Overall population change, 2010-2018: +5,240 (+5.7%)
> 2018 population: 97,980
> Median household income: $49,200
> January 2020 unemployment: 2.8%
[in-text-ad]

17. Kentucky: Elizabethtown-Fort Knox
> Population change due to migration, 2010-2018: -811 (-0.5%)
> Overall population change, 2010-2018: +5,038 (+3.4%)
> 2018 population: 153,378
> Median household income: $51,147
> January 2020 unemployment: 4.2%
[recirclink id=637146]

18. Louisiana: Shreveport-Bossier City
> Population change due to migration, 2010-2018: -17,484 (-4.0%)
> Overall population change, 2010-2018: -3,470 (-0.8%)
> 2018 population: 436,341
> Median household income: $41,969
> January 2020 unemployment: 5.5%

19. Maine: Lewiston-Auburn
> Population change due to migration, 2010-2018: -1,753 (-1.6%)
> Overall population change, 2010-2018: -31 (-0.0%)
> 2018 population: 107,679
> Median household income: $49,697
> January 2020 unemployment: 2.9%
[in-text-ad-2]

20. Maryland: Cumberland
> Population change due to migration, 2010-2018: -2,899 (-2.8%)
> Overall population change, 2010-2018: -5,330 (-5.2%)
> 2018 population: 97,915
> Median household income: $44,607
> January 2020 unemployment: 5.3%

21. Massachusetts: Pittsfield
> Population change due to migration, 2010-2018: -1,606 (-1.2%)
> Overall population change, 2010-2018: -4,927 (-3.8%)
> 2018 population: 126,348
> Median household income: $60,476
> January 2020 unemployment: 3.5%
[in-text-ad]

22. Michigan: Flint
> Population change due to migration, 2010-2018: -23,255 (-5.5%)
> Overall population change, 2010-2018: -18,897 (-4.4%)
> 2018 population: 406,892
> Median household income: $48,127
> January 2020 unemployment: 4.7%
[recirclink id=649906]

23. Minnesota: Duluth
> Population change due to migration, 2010-2018: -450 (-0.2%)
> Overall population change, 2010-2018: -977 (-0.3%)
> 2018 population: 278,799
> Median household income: $53,767
> January 2020 unemployment: 4.3%

24. Mississippi: Jackson
> Population change due to migration, 2010-2018: -6,810 (-1.2%)
> Overall population change, 2010-2018: +12,534 (+2.2%)
> 2018 population: 580,166
> Median household income: $55,700
> January 2020 unemployment: 4.8%
[in-text-ad-2]

25. Missouri: St. Joseph
> Population change due to migration, 2010-2018: -2,781 (-2.2%)
> Overall population change, 2010-2018: -837 (-0.7%)
> 2018 population: 126,490
> Median household income: $53,321
> January 2020 unemployment: 3.1%

26. Montana: Great Falls
> Population change due to migration, 2010-2018: -2,252 (-2.8%)
> Overall population change, 2010-2018: +320 (+0.4%)
> 2018 population: 81,643
> Median household income: $49,948
> January 2020 unemployment: 3.3%
[in-text-ad]

27. Nebraska: Grand Island
> Population change due to migration, 2010-2018: -502 (-0.6%)
> Overall population change, 2010-2018: +3,238 (+4.0%)
> 2018 population: 85,088
> Median household income: $54,235
> January 2020 unemployment: 3.5%
[recirclink id=569954]

28. Nevada: None

29. New Hampshire: None
[in-text-ad-2]

30. New Jersey: Vineland-Bridgeton
> Population change due to migration, 2010-2018: -10,118 (-6.5%)
> Overall population change, 2010-2018: -5,661 (-3.6%)
> 2018 population: 150,972
> Median household income: $52,795
> January 2020 unemployment: 5.7%

31. New Mexico: Farmington
> Population change due to migration, 2010-2018: -11,873 (-9.1%)
> Overall population change, 2010-2018: -5,002 (-3.8%)
> 2018 population: 125,043
> Median household income: $44,841
> January 2020 unemployment: 5.7%
[in-text-ad]

32. New York: Watertown-Fort Drum
> Population change due to migration, 2010-2018: -14,329 (-12.3%)
> Overall population change, 2010-2018: -4,479 (-3.9%)
> 2018 population: 111,755
> Median household income: $53,146
> January 2020 unemployment: 5.8%
[recirclink id=648274]

33. North Carolina: Rocky Mount
> Population change due to migration, 2010-2018: -7,021 (-4.6%)
> Overall population change, 2010-2018: -6,354 (-4.2%)
> 2018 population: 146,021
> Median household income: $46,733
> January 2020 unemployment: 5.0%

34. North Dakota: Grand Forks
> Population change due to migration, 2010-2018: -1,071 (-1.1%)
> Overall population change, 2010-2018: +3,835 (+3.9%)
> 2018 population: 102,299
> Median household income: $54,659
> January 2020 unemployment: 2.6%
[in-text-ad-2]

35. Ohio: Lima
> Population change due to migration, 2010-2018: -5,125 (-4.8%)
> Overall population change, 2010-2018: -3,652 (-3.4%)
> 2018 population: 102,663
> Median household income: $49,063
> January 2020 unemployment: 4.2%

36. Oklahoma: Lawton
> Population change due to migration, 2010-2018: -11,422 (-8.8%)
> Overall population change, 2010-2018: -4,090 (-3.1%)
> 2018 population: 126,198
> Median household income: $52,034
> January 2020 unemployment: 3.5%
[in-text-ad]

37. Oregon: None
[recirclink id=648269]
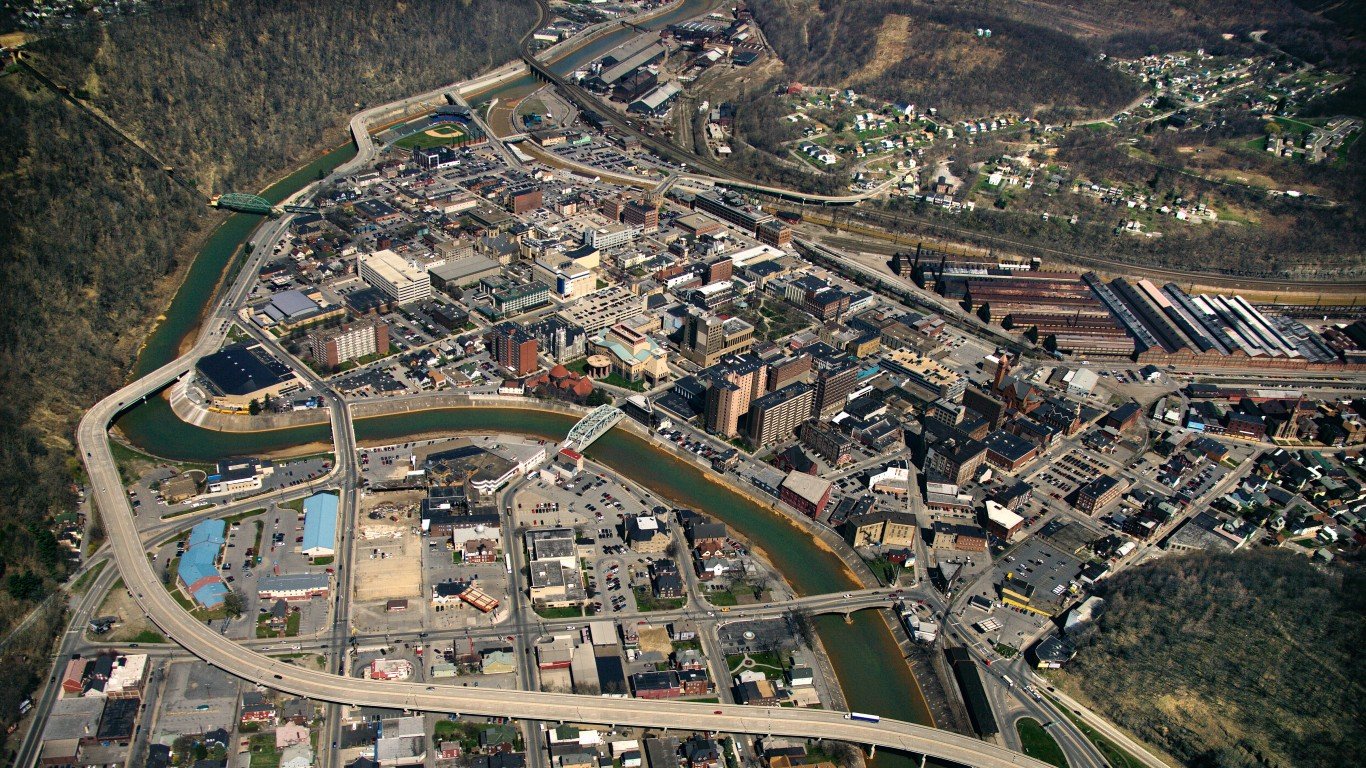
38. Pennsylvania: Johnstown
> Population change due to migration, 2010-2018: -7,980 (-5.6%)
> Overall population change, 2010-2018: -11,951 (-8.3%)
> 2018 population: 131,730
> Median household income: $45,084
> January 2020 unemployment: 5.6%

39. Rhode Island: None
[in-text-ad-2]

40. South Carolina: Sumter
> Population change due to migration, 2010-2018: -4,323 (-4.0%)
> Overall population change, 2010-2018: -978 (-0.9%)
> 2018 population: 106,512
> Median household income: $45,994
> January 2020 unemployment: 2.9%

41. South Dakota: None
[in-text-ad]

42. Tennessee: Memphis
> Population change due to migration, 2010-2018: -32,900 (-2.5%)
> Overall population change, 2010-2018: +25,791 (+1.9%)
> 2018 population: 1.4 million
> Median household income: $50,338
> January 2020 unemployment: 4.1%
[recirclink id=637146]

43. Texas: Brownsville-Harlingen
> Population change due to migration, 2010-2018: -20,487 (-5.0%)
> Overall population change, 2010-2018: +17,693 (+4.4%)
> 2018 population: 423,908
> Median household income: $38,378
> January 2020 unemployment: 5.6%

44. Utah: Logan
> Population change due to migration, 2010-2018: -680 (-0.5%)
> Overall population change, 2010-2018: +15,352 (+12.2%)
> 2018 population: 140,794
> Median household income: $59,414
> January 2020 unemployment: 1.9%
[in-text-ad-2]

45. Vermont: None

46. Virginia: Virginia Beach-Norfolk-Newport News
> Population change due to migration, 2010-2018: -20,469 (-1.2%)
> Overall population change, 2010-2018: +51,910 (+3.1%)
> 2018 population: 1.7 million
> Median household income: $65,604
> January 2020 unemployment: 2.9%
[in-text-ad]

47. Washington: Yakima
> Population change due to migration, 2010-2018: -9,471 (-3.9%)
> Overall population change, 2010-2018: +8,206 (+3.4%)
> 2018 population: 251,446
> Median household income: $51,555
> January 2020 unemployment: 6.8%
[recirclink id=649906]

48. West Virginia: Charleston
> Population change due to migration, 2010-2018: -12,194 (-5.4%)
> Overall population change, 2010-2018: -16,023 (-7.1%)
> 2018 population: 211,037
> Median household income: $40,806
> January 2020 unemployment: 5.0%

49. Wisconsin: Milwaukee-Waukesha-West Allis
> Population change due to migration, 2010-2018: -33,585 (-2.2%)
> Overall population change, 2010-2018: +20,159 (+1.3%)
> 2018 population: 1.6 million
> Median household income: $60,643
> January 2020 unemployment: 3.7%
[in-text-ad-2]

50. Wyoming: None
Contact [email protected] for any questions or corrections.