The City Americans Are Abandoning in Every State
DenisTangneyJr / Getty Images 36. Oklahoma: Lawton > Population change due to migration, 2010-2018: -11,422 (-8.8%) > Overall population change, 2010-2018: -4,090 (-3.1%) > 2018 population: 126,198 > Median household income: $52,034 > January 2020 unemployment: 3.5% mdurson / Getty…


Americans are less likely to move today than at any point in recent history. Over the 12 months ending in March 2019, the share of Americans who moved to a new home dipped below 10% for the first time since the U.S. Census Bureau began keeping track in 1947.
Still, an average of 35 million Americans have moved every year since 2010 — and in some cities, people are leaving much faster than they are arriving. To determine the cities Americans are abandoning in every state, 24/7 Wall St. used data from the Census Bureau’s Population Estimates Program and identified the metro area with the largest net-migration decline from April 1, 2010 to July 1, 2018 in every state.
Net migration is the difference between the number of new residents — either from other parts of the country or from abroad — and the number of residents who have moved elsewhere. It is not a measure of total population change, which is also a product of births and deaths.
It is important to note that four states — Delaware, New Hampshire. Rhode Island, and Vermont — have only one metropolitan area each, and each case reported a net migration increase. Additionally, Colorado, Florida, Nevada, Oregon, South Dakota, and Wyoming have no metro areas with a net migration decline between 2010 and 2018 .
Some of the most commonly cited reasons for packing up and moving to a new city are related to employment. Last year, more than one in every five moves were prompted by work-related reasons. In many of the cities Americans are abandoning, job availability is relatively low, as most have unemployment rates as high or higher than the 3.6% national rate. Here is a look at the hardest states to find full-time work.
Click here to see the cities Americans are abandoning in every state
Click here to see the cities Americans are flocking to in every state

1. Alabama: Montgomery
> Population change due to migration, 2010-2018: -12,144 (-3.2%)
> Overall population change, 2010-2018: -1,316 (-0.4%)
> 2018 population: 373,225
> Median household income: $51,943
> January 2020 unemployment: 2.7%

2. Alaska: Fairbanks
> Population change due to migration, 2010-2018: -8,736 (-9.0%)
> Overall population change, 2010-2018: +1,386 (+1.4%)
> 2018 population: 98,971
> Median household income: $75,448
> January 2020 unemployment: 5.3%

3. Arizona: Sierra Vista-Douglas
> Population change due to migration, 2010-2018: -7,484 (-5.7%)
> Overall population change, 2010-2018: -4,587 (-3.5%)
> 2018 population: 126,770
> Median household income: $50,495
> January 2020 unemployment: 5.5%

4. Arkansas: Pine Bluff
> Population change due to migration, 2010-2018: -11,360 (-11.3%)
> Overall population change, 2010-2018: -10,775 (-10.7%)
> 2018 population: 89,515
> Median household income: $37,314
> January 2020 unemployment: 5.3%

5. California: Hanford-Corcoran
> Population change due to migration, 2010-2018: -14,567 (-9.5%)
> Overall population change, 2010-2018: -1,616 (-1.1%)
> 2018 population: 151,366
> Median household income: $61,663
> January 2020 unemployment: 7.6%

6. Colorado: None
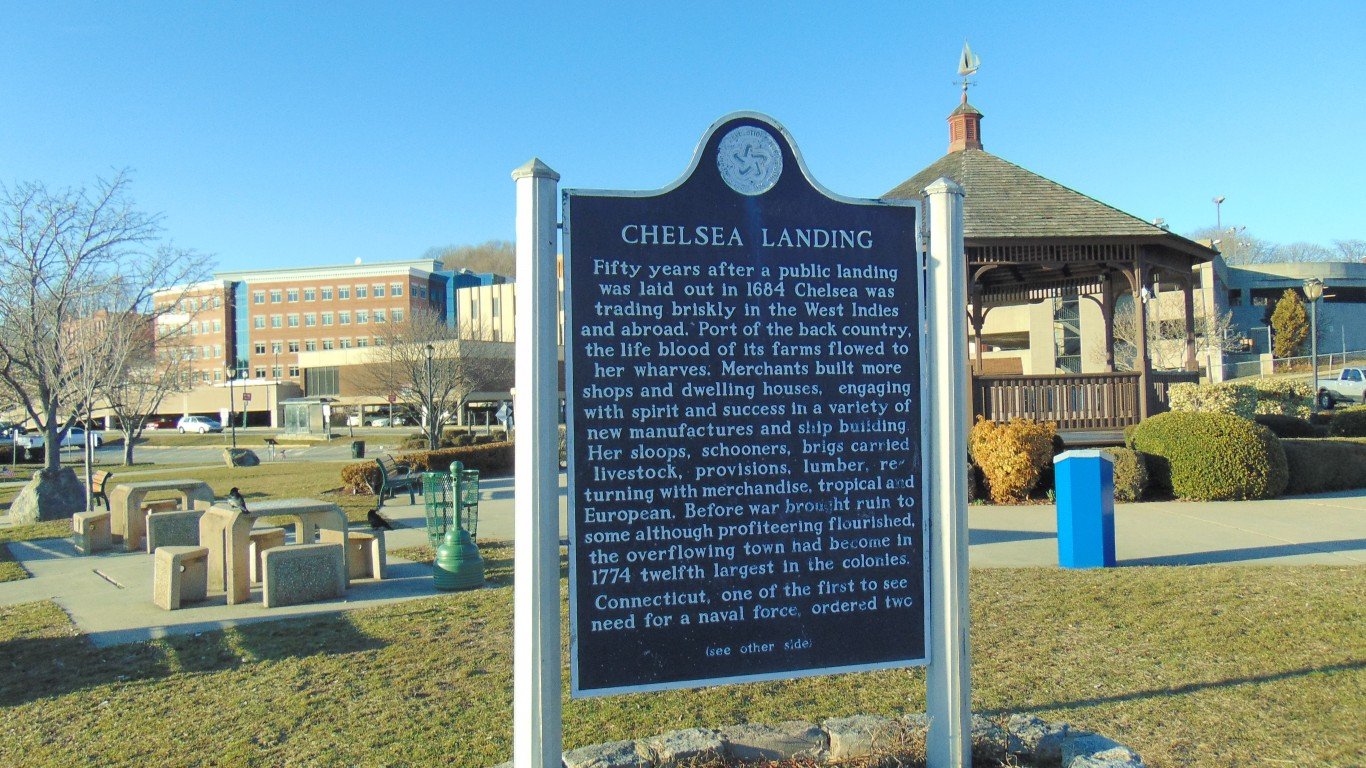
7. Connecticut: Norwich-New London
> Population change due to migration, 2010-2018: -9,732 (-3.6%)
> Overall population change, 2010-2018: -7,284 (-2.7%)
> 2018 population: 266,784
> Median household income: $67,197
> January 2020 unemployment: 3.6%

8. Delaware: None

9. Florida: None

10. Georgia: Hinesville
> Population change due to migration, 2010-2018: -8,248 (-10.6%)
> Overall population change, 2010-2018: +2,576 (+3.3%)
> 2018 population: 80,495
> Median household income: $47,234
> January 2020 unemployment: 3.5%

11. Hawaii: Urban Honolulu
> Population change due to migration, 2010-2018: -19,098 (-2.0%)
> Overall population change, 2010-2018: +26,874 (+2.8%)
> 2018 population: 980,080
> Median household income: $84,423
> January 2020 unemployment: 2.5%

12. Idaho: Pocatello
> Population change due to migration, 2010-2018: -647 (-0.8%)
> Overall population change, 2010-2018: +4,296 (+5.2%)
> 2018 population: 87,138
> Median household income: $50,748
> January 2020 unemployment: 2.7%
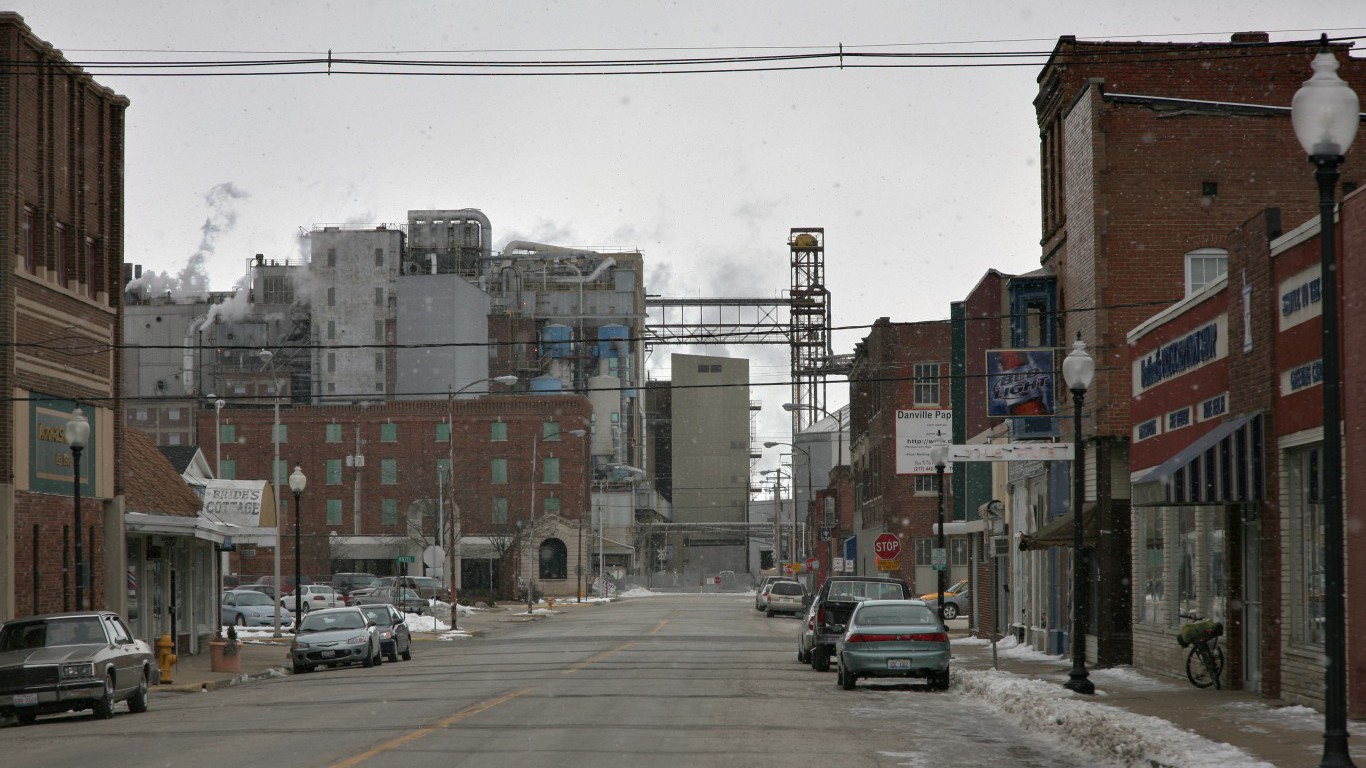
13. Illinois: Danville
> Population change due to migration, 2010-2018: -5,455 (-6.7%)
> Overall population change, 2010-2018: -4,819 (-5.9%)
> 2018 population: 76,806
> Median household income: $43,655
> January 2020 unemployment: 4.9%

14. Indiana: Muncie
> Population change due to migration, 2010-2018: -2,889 (-2.5%)
> Overall population change, 2010-2018: -2,892 (-2.5%)
> 2018 population: 114,772
> Median household income: $41,662
> January 2020 unemployment: 3.8%

15. Iowa: Sioux City
> Population change due to migration, 2010-2018: -6,978 (-4.1%)
> Overall population change, 2010-2018: +482 (+0.3%)
> 2018 population: 169,045
> Median household income: $61,576
> January 2020 unemployment: 2.8%

16. Kansas: Manhattan
> Population change due to migration, 2010-2018: -2,405 (-2.6%)
> Overall population change, 2010-2018: +5,240 (+5.7%)
> 2018 population: 97,980
> Median household income: $49,200
> January 2020 unemployment: 2.8%

17. Kentucky: Elizabethtown-Fort Knox
> Population change due to migration, 2010-2018: -811 (-0.5%)
> Overall population change, 2010-2018: +5,038 (+3.4%)
> 2018 population: 153,378
> Median household income: $51,147
> January 2020 unemployment: 4.2%

18. Louisiana: Shreveport-Bossier City
> Population change due to migration, 2010-2018: -17,484 (-4.0%)
> Overall population change, 2010-2018: -3,470 (-0.8%)
> 2018 population: 436,341
> Median household income: $41,969
> January 2020 unemployment: 5.5%

19. Maine: Lewiston-Auburn
> Population change due to migration, 2010-2018: -1,753 (-1.6%)
> Overall population change, 2010-2018: -31 (-0.0%)
> 2018 population: 107,679
> Median household income: $49,697
> January 2020 unemployment: 2.9%

20. Maryland: Cumberland
> Population change due to migration, 2010-2018: -2,899 (-2.8%)
> Overall population change, 2010-2018: -5,330 (-5.2%)
> 2018 population: 97,915
> Median household income: $44,607
> January 2020 unemployment: 5.3%

21. Massachusetts: Pittsfield
> Population change due to migration, 2010-2018: -1,606 (-1.2%)
> Overall population change, 2010-2018: -4,927 (-3.8%)
> 2018 population: 126,348
> Median household income: $60,476
> January 2020 unemployment: 3.5%

22. Michigan: Flint
> Population change due to migration, 2010-2018: -23,255 (-5.5%)
> Overall population change, 2010-2018: -18,897 (-4.4%)
> 2018 population: 406,892
> Median household income: $48,127
> January 2020 unemployment: 4.7%

23. Minnesota: Duluth
> Population change due to migration, 2010-2018: -450 (-0.2%)
> Overall population change, 2010-2018: -977 (-0.3%)
> 2018 population: 278,799
> Median household income: $53,767
> January 2020 unemployment: 4.3%

24. Mississippi: Jackson
> Population change due to migration, 2010-2018: -6,810 (-1.2%)
> Overall population change, 2010-2018: +12,534 (+2.2%)
> 2018 population: 580,166
> Median household income: $55,700
> January 2020 unemployment: 4.8%

25. Missouri: St. Joseph
> Population change due to migration, 2010-2018: -2,781 (-2.2%)
> Overall population change, 2010-2018: -837 (-0.7%)
> 2018 population: 126,490
> Median household income: $53,321
> January 2020 unemployment: 3.1%

26. Montana: Great Falls
> Population change due to migration, 2010-2018: -2,252 (-2.8%)
> Overall population change, 2010-2018: +320 (+0.4%)
> 2018 population: 81,643
> Median household income: $49,948
> January 2020 unemployment: 3.3%

27. Nebraska: Grand Island
> Population change due to migration, 2010-2018: -502 (-0.6%)
> Overall population change, 2010-2018: +3,238 (+4.0%)
> 2018 population: 85,088
> Median household income: $54,235
> January 2020 unemployment: 3.5%

28. Nevada: None

29. New Hampshire: None

30. New Jersey: Vineland-Bridgeton
> Population change due to migration, 2010-2018: -10,118 (-6.5%)
> Overall population change, 2010-2018: -5,661 (-3.6%)
> 2018 population: 150,972
> Median household income: $52,795
> January 2020 unemployment: 5.7%

31. New Mexico: Farmington
> Population change due to migration, 2010-2018: -11,873 (-9.1%)
> Overall population change, 2010-2018: -5,002 (-3.8%)
> 2018 population: 125,043
> Median household income: $44,841
> January 2020 unemployment: 5.7%

32. New York: Watertown-Fort Drum
> Population change due to migration, 2010-2018: -14,329 (-12.3%)
> Overall population change, 2010-2018: -4,479 (-3.9%)
> 2018 population: 111,755
> Median household income: $53,146
> January 2020 unemployment: 5.8%

33. North Carolina: Rocky Mount
> Population change due to migration, 2010-2018: -7,021 (-4.6%)
> Overall population change, 2010-2018: -6,354 (-4.2%)
> 2018 population: 146,021
> Median household income: $46,733
> January 2020 unemployment: 5.0%

34. North Dakota: Grand Forks
> Population change due to migration, 2010-2018: -1,071 (-1.1%)
> Overall population change, 2010-2018: +3,835 (+3.9%)
> 2018 population: 102,299
> Median household income: $54,659
> January 2020 unemployment: 2.6%

35. Ohio: Lima
> Population change due to migration, 2010-2018: -5,125 (-4.8%)
> Overall population change, 2010-2018: -3,652 (-3.4%)
> 2018 population: 102,663
> Median household income: $49,063
> January 2020 unemployment: 4.2%

36. Oklahoma: Lawton
> Population change due to migration, 2010-2018: -11,422 (-8.8%)
> Overall population change, 2010-2018: -4,090 (-3.1%)
> 2018 population: 126,198
> Median household income: $52,034
> January 2020 unemployment: 3.5%

37. Oregon: None

38. Pennsylvania: Johnstown
> Population change due to migration, 2010-2018: -7,980 (-5.6%)
> Overall population change, 2010-2018: -11,951 (-8.3%)
> 2018 population: 131,730
> Median household income: $45,084
> January 2020 unemployment: 5.6%

39. Rhode Island: None

40. South Carolina: Sumter
> Population change due to migration, 2010-2018: -4,323 (-4.0%)
> Overall population change, 2010-2018: -978 (-0.9%)
> 2018 population: 106,512
> Median household income: $45,994
> January 2020 unemployment: 2.9%

41. South Dakota: None

42. Tennessee: Memphis
> Population change due to migration, 2010-2018: -32,900 (-2.5%)
> Overall population change, 2010-2018: +25,791 (+1.9%)
> 2018 population: 1.4 million
> Median household income: $50,338
> January 2020 unemployment: 4.1%

43. Texas: Brownsville-Harlingen
> Population change due to migration, 2010-2018: -20,487 (-5.0%)
> Overall population change, 2010-2018: +17,693 (+4.4%)
> 2018 population: 423,908
> Median household income: $38,378
> January 2020 unemployment: 5.6%

44. Utah: Logan
> Population change due to migration, 2010-2018: -680 (-0.5%)
> Overall population change, 2010-2018: +15,352 (+12.2%)
> 2018 population: 140,794
> Median household income: $59,414
> January 2020 unemployment: 1.9%

45. Vermont: None

46. Virginia: Virginia Beach-Norfolk-Newport News
> Population change due to migration, 2010-2018: -20,469 (-1.2%)
> Overall population change, 2010-2018: +51,910 (+3.1%)
> 2018 population: 1.7 million
> Median household income: $65,604
> January 2020 unemployment: 2.9%

47. Washington: Yakima
> Population change due to migration, 2010-2018: -9,471 (-3.9%)
> Overall population change, 2010-2018: +8,206 (+3.4%)
> 2018 population: 251,446
> Median household income: $51,555
> January 2020 unemployment: 6.8%

48. West Virginia: Charleston
> Population change due to migration, 2010-2018: -12,194 (-5.4%)
> Overall population change, 2010-2018: -16,023 (-7.1%)
> 2018 population: 211,037
> Median household income: $40,806
> January 2020 unemployment: 5.0%

49. Wisconsin: Milwaukee-Waukesha-West Allis
> Population change due to migration, 2010-2018: -33,585 (-2.2%)
> Overall population change, 2010-2018: +20,159 (+1.3%)
> 2018 population: 1.6 million
> Median household income: $60,643
> January 2020 unemployment: 3.7%

50. Wyoming: None
Contact [email protected] for any questions or corrections.
Sam Stebbins is a writer at 247WallSt.com where his primary focus is on government policy, politics, companies, and broad social and economic trends. Sam has been writing in the money and news verticals for over 8 years and holds a bachelor's degree from Hobart College, which he earned in 2010. Sam resides in upstate New York and enjoys hiking, biking, canoeing, and skiing in the Adirondack Mountains and across the Northeast.