
As of May 5, the United States had over 1.2 million confirmed cases of COVID-19. Nearly 71,000 cases have been fatal. The novel coronavirus has spread very differently from state to state. New York’s case rate of over 1,600 per 100,000 residents is nearly 40 times the rate of the state with the lowest rate.
To determine the states with the highest number of COVID-19 cases per capita, 24/7 Wall St. reviewed data on confirmed COVID-19 cases and deaths as reported by local and state government health agencies. We calculated the confirmed cases and deaths for every 100,000 state residents using one-year population data from the U.S. Census Bureau’s 2018 American Community Survey. The number of cases per capita appears closely related to testing rates and population density as well as how early a state reported its first case. We included this information for every state. COVID-19 test statistics are for the most recent day for which data is available — 5/4. Population density statistics were obtained from the U.S. Census Bureau’s 2010 decennial census.
States are beginning to pull back on their social distancing measures and stay-at-home orders. As of May 5, most states either let their stay-at-home orders expire, or never implemented them at all.
Mark Seidner, associate professor of infectious diseases at Harvard University and clinician in the Division of Infectious Diseases at Massachusetts General Hospital, said reopening the economy “is in some ways a true experiment” because it is such an unprecedented situation. He added that “the worst thing that can happen is that we do this blindly, without measuring its effects, clearly and carefully, and understanding what’s working or what’s not working.” Here’s when every state plans to lift COVID-19 restrictions.
These states are reopening in an attempt to get their labor force back to work. The U.S. has experienced an unprecedented economic crisis in the wake of the coronavirus, with more than 30 million Americans filing for unemployment benefits since mid-March.
States with economies that rely on certain especially vulnerable industries have faced a much more severe unemployment problem than others. These are every state’s unemployment claims since COVID-19 shut the economy down.
Click here to see the states with the highest number of COVID-19 cases
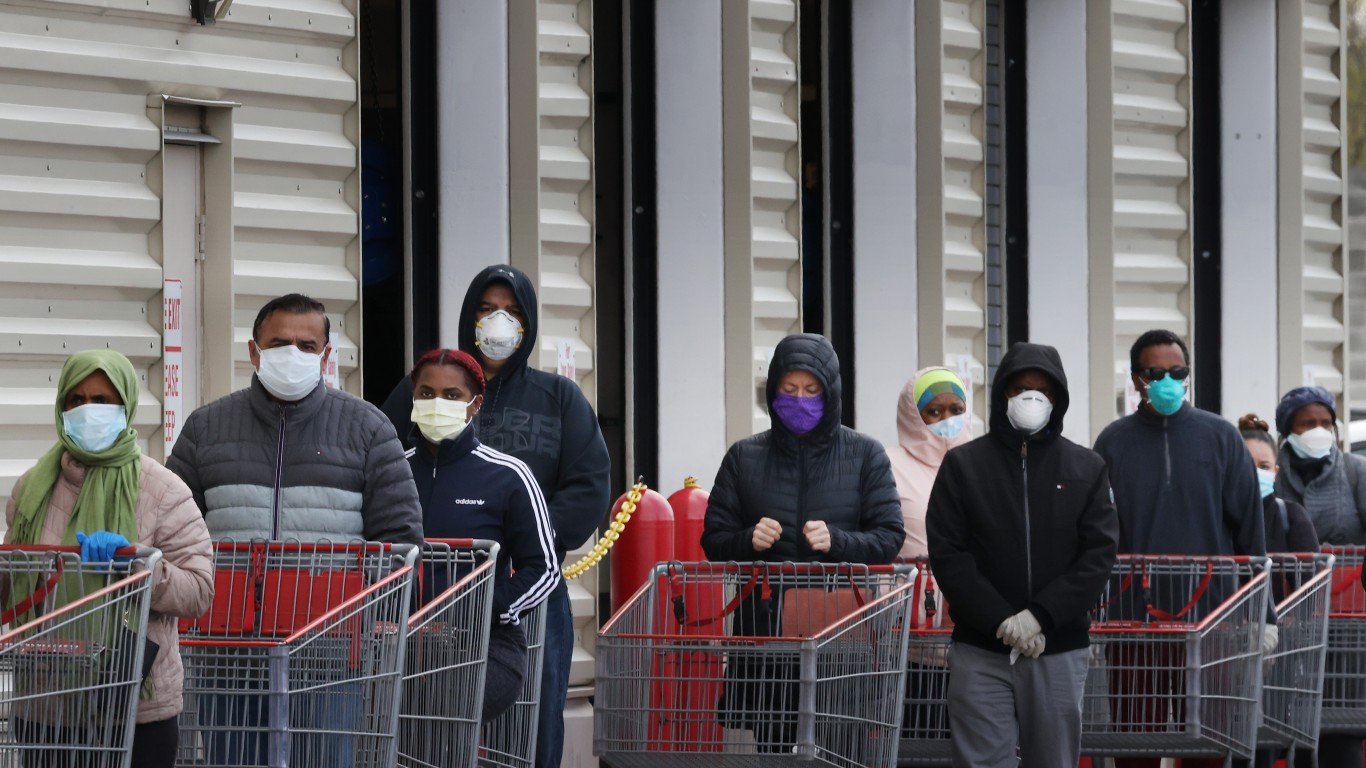
In the absence of a vaccine, social distancing is considered the best available means to slow the spread of an infectious disease. The Centers for Disease Control and Prevention recommends people maintain a distance of at least 6 feet from one another, not gather in groups, and stay out of crowded places.
50. Montana
> COVID-19 confirmed cases as of 5/4/2020: 42.9 per 100,000 (total: 456)
> Rank on April 28: the lowest
> COVID-19 related deaths as of 5/4/2020: 1.5 per 100,000 — 4th lowest (total: 16)
> Total testing rate as of 5/4/2020: 14.4 per 1,000 people — 7th lowest (total: 15,272)
> Positive test rate as of 5/4/2020: 3.0% — 4th lowest
> Date of first case: March 13
> Population density: 7.2 people per sq. mi. — 3rd lowest
> Total population: 1,062,305
[in-text-ad]
49. Hawaii
> COVID-19 confirmed cases as of 5/4/2020: 43.7 per 100,000 (total: 621)
> Rank on April 28: 2nd lowest
> COVID-19 related deaths as of 5/4/2020: 1.2 per 100,000 — the lowest (total: 17)
> Total testing rate as of 5/4/2020: 24.4 per 1,000 people — 18th highest (total: 34,711)
> Positive test rate as of 5/4/2020: 1.8% — 2nd lowest
> Date of first case: March 6
> Population density: 129.9 people per sq. mi. — 20th highest
> Total population: 1,420,491
48. Alaska
> COVID-19 confirmed cases as of 5/4/2020: 50.2 per 100,000 (total: 370)
> Rank on April 28: 3rd lowest
> COVID-19 related deaths as of 5/4/2020: 1.2 per 100,000 — 3rd lowest (total: 09)
> Total testing rate as of 5/4/2020: 29.5 per 1,000 people — 11th highest (total: 21,723)
> Positive test rate as of 5/4/2020: 1.7% — the lowest
> Date of first case: March 12
> Population density: 1.1 people per sq. mi. — the lowest
> Total population: 737,438

47. Oregon
> COVID-19 confirmed cases as of 5/4/2020: 65.8 per 100,000 (total: 2,759)
> Rank on April 28: 4th lowest
> COVID-19 related deaths as of 5/4/2020: 2.6 per 100,000 — 7th lowest (total: 109)
> Total testing rate as of 5/4/2020: 15.1 per 1,000 people — 11th lowest (total: 63,443)
> Positive test rate as of 5/4/2020: 4.3% — 8th lowest
> Date of first case: Feb. 28
> Population density: 42.6 people per sq. mi. — 13th lowest
> Total population: 4,190,713
[in-text-ad-2]
46. West Virginia
> COVID-19 confirmed cases as of 5/4/2020: 68.6 per 100,000 (total: 1,238)
> Rank on April 28: 5th lowest
> COVID-19 related deaths as of 5/4/2020: 2.8 per 100,000 — 9th lowest (total: 50)
> Total testing rate as of 5/4/2020: 30.4 per 1,000 people — 9th highest (total: 54,823)
> Positive test rate as of 5/4/2020: 2.3% — 3rd lowest
> Date of first case: March 17
> Population density: 74.5 people per sq. mi. — 22nd lowest
> Total population: 1,805,832

45. Wyoming
> COVID-19 confirmed cases as of 5/4/2020: 76.9 per 100,000 (total: 444)
> Rank on April 28: 6th lowest
> COVID-19 related deaths as of 5/4/2020: 1.2 per 100,000 — 2nd lowest (total: 07)
> Total testing rate as of 5/4/2020: 20.8 per 1,000 people — 24th highest (total: 11,996)
> Positive test rate as of 5/4/2020: 3.7% — 6th lowest
> Date of first case: March 11
> Population density: 5.9 people per sq. mi. — 2nd lowest
> Total population: 577,737
[in-text-ad]

44. Maine
> COVID-19 confirmed cases as of 5/4/2020: 85.9 per 100,000 (total: 1,150)
> Rank on April 28: 8th lowest
> COVID-19 related deaths as of 5/4/2020: 4.6 per 100,000 — 16th lowest (total: 61)
> Total testing rate as of 5/4/2020: 15.5 per 1,000 people — 14th lowest (total: 20,696)
> Positive test rate as of 5/4/2020: 5.6% — 12th lowest
> Date of first case: March 12
> Population density: 37.8 people per sq. mi. — 12th lowest
> Total population: 1,338,404
43. Oklahoma
> COVID-19 confirmed cases as of 5/4/2020: 102.6 per 100,000 (total: 4,044)
> Rank on April 28: 9th lowest
> COVID-19 related deaths as of 5/4/2020: 6.0 per 100,000 — 24th lowest (total: 238)
> Total testing rate as of 5/4/2020: 20.3 per 1,000 people — 25th highest (total: 79,892)
> Positive test rate as of 5/4/2020: 5.1% — 10th lowest
> Date of first case: March 6
> Population density: 56.4 people per sq. mi. — 16th lowest
> Total population: 3,943,079
42. Texas
> COVID-19 confirmed cases as of 5/4/2020: 112.6 per 100,000 (total: 32,332)
> Rank on April 28: 10th lowest
> COVID-19 related deaths as of 5/4/2020: 3.1 per 100,000 — 10th lowest (total: 884)
> Total testing rate as of 5/4/2020: 14.2 per 1,000 people — 6th lowest (total: 407,398)
> Positive test rate as of 5/4/2020: 7.9% — 19th lowest
> Date of first case: Feb. 12
> Population density: 106.9 people per sq. mi. — 22nd highest
> Total population: 28,701,845
[in-text-ad-2]
41. Arkansas
> COVID-19 confirmed cases as of 5/4/2020: 115.1 per 100,000 (total: 3,469)
> Rank on April 28: 14th lowest
> COVID-19 related deaths as of 5/4/2020: 2.7 per 100,000 — 8th lowest (total: 80)
> Total testing rate as of 5/4/2020: 18.1 per 1,000 people — 19th lowest (total: 54,608)
> Positive test rate as of 5/4/2020: 6.4% — 13th lowest
> Date of first case: March 11
> Population density: 56.7 people per sq. mi. — 17th lowest
> Total population: 3,013,825
40. Kentucky
> COVID-19 confirmed cases as of 5/4/2020: 117.4 per 100,000 (total: 5,245)
> Rank on April 28: 12th lowest
> COVID-19 related deaths as of 5/4/2020: 5.8 per 100,000 — 21st lowest (total: 261)
> Total testing rate as of 5/4/2020: 13.4 per 1,000 people — 4th lowest (total: 60,046)
> Positive test rate as of 5/4/2020: 8.7% — 23rd lowest
> Date of first case: March 6
> Population density: 110.6 people per sq. mi. — 21st highest
> Total population: 4,468,402
[in-text-ad]
39. North Carolina
> COVID-19 confirmed cases as of 5/4/2020: 118.0 per 100,000 (total: 12,256)
> Rank on April 28: 11th lowest
> COVID-19 related deaths as of 5/4/2020: 4.4 per 100,000 — 15th lowest (total: 452)
> Total testing rate as of 5/4/2020: 14.6 per 1,000 people — 8th lowest (total: 151,800)
> Positive test rate as of 5/4/2020: 8.1% — 21st lowest
> Date of first case: March 3
> Population density: 192.9 people per sq. mi. — 14th highest
> Total population: 10,383,620
38. Idaho
> COVID-19 confirmed cases as of 5/4/2020: 120.1 per 100,000 (total: 2,106)
> Rank on April 28: 16th lowest
> COVID-19 related deaths as of 5/4/2020: 3.6 per 100,000 — 13th lowest (total: 64)
> Total testing rate as of 5/4/2020: 17.2 per 1,000 people — 17th lowest (total: 30,146)
> Positive test rate as of 5/4/2020: 7.0% — 15th lowest
> Date of first case: March 13
> Population density: 21.0 people per sq. mi. — 7th lowest
> Total population: 1,754,208

37. Arizona
> COVID-19 confirmed cases as of 5/4/2020: 124.4 per 100,000 (total: 8,919)
> Rank on April 28: 13th lowest
> COVID-19 related deaths as of 5/4/2020: 5.0 per 100,000 — 18th lowest (total: 362)
> Total testing rate as of 5/4/2020: 11.9 per 1,000 people — the lowest (total: 85,253)
> Positive test rate as of 5/4/2020: 10.5% — 21st highest
> Date of first case: Jan. 26
> Population density: 62.9 people per sq. mi. — 19th lowest
> Total population: 7,171,646
[in-text-ad-2]

36. Minnesota
> COVID-19 confirmed cases as of 5/4/2020: 128.9 per 100,000 (total: 7,234)
> Rank on April 28: 7th lowest
> COVID-19 related deaths as of 5/4/2020: 7.6 per 100,000 — 21st highest (total: 428)
> Total testing rate as of 5/4/2020: 15.3 per 1,000 people — 13th lowest (total: 85,941)
> Positive test rate as of 5/4/2020: 8.4% — 22nd lowest
> Date of first case: March 6
> Population density: 64.5 people per sq. mi. — 20th lowest
> Total population: 5,611,179

35. South Carolina
> COVID-19 confirmed cases as of 5/4/2020: 132.9 per 100,000 (total: 6,757)
> Rank on April 28: 17th lowest
> COVID-19 related deaths as of 5/4/2020: 5.6 per 100,000 — 19th lowest (total: 283)
> Total testing rate as of 5/4/2020: 13.3 per 1,000 people — 3rd lowest (total: 67,771)
> Positive test rate as of 5/4/2020: 10.0% — 22nd highest
> Date of first case: March 6
> Population density: 158.8 people per sq. mi. — 18th highest
> Total population: 5,084,127
[in-text-ad]
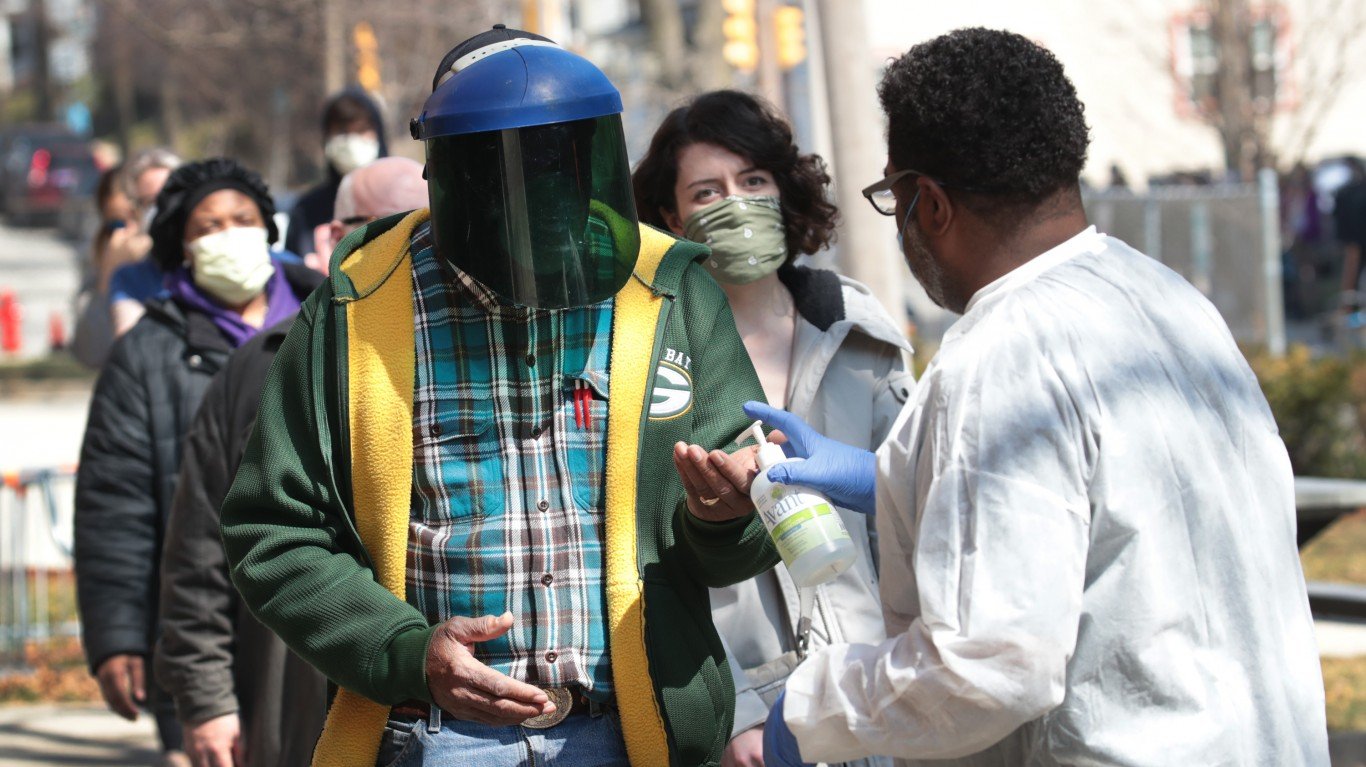
34. Wisconsin
> COVID-19 confirmed cases as of 5/4/2020: 141.7 per 100,000 (total: 8,236)
> Rank on April 28: 15th lowest
> COVID-19 related deaths as of 5/4/2020: 5.8 per 100,000 — 23rd lowest (total: 340)
> Total testing rate as of 5/4/2020: 15.3 per 1,000 people — 12th lowest (total: 88,703)
> Positive test rate as of 5/4/2020: 9.3% — 25th lowest
> Date of first case: Feb. 5
> Population density: 88.8 people per sq. mi. — 24th lowest
> Total population: 5,813,568

33. California
> COVID-19 confirmed cases as of 5/4/2020: 142.1 per 100,000 (total: 56,201)
> Rank on April 28: 18th lowest
> COVID-19 related deaths as of 5/4/2020: 5.8 per 100,000 — 20th lowest (total: 2,292)
> Total testing rate as of 5/4/2020: 19.7 per 1,000 people — 24th lowest (total: 779,902)
> Positive test rate as of 5/4/2020: 7.2% — 17th lowest
> Date of first case: Jan. 25
> Population density: 241.7 people per sq. mi. — 11th highest
> Total population: 39,557,045

32. Missouri
> COVID-19 confirmed cases as of 5/4/2020: 142.9 per 100,000 (total: 8,754)
> Rank on April 28: 19th lowest
> COVID-19 related deaths as of 5/4/2020: 5.8 per 100,000 — 22nd lowest (total: 358)
> Total testing rate as of 5/4/2020: 15.5 per 1,000 people — 15th lowest (total: 94,904)
> Positive test rate as of 5/4/2020: 9.2% — 24th lowest
> Date of first case: March 7
> Population density: 87.9 people per sq. mi. — 23rd lowest
> Total population: 6,126,452
[in-text-ad-2]
31. Vermont
> COVID-19 confirmed cases as of 5/4/2020: 144.8 per 100,000 (total: 907)
> Rank on April 28: 25th lowest
> COVID-19 related deaths as of 5/4/2020: 8.3 per 100,000 — 20th highest (total: 52)
> Total testing rate as of 5/4/2020: 28.0 per 1,000 people — 13th highest (total: 17,518)
> Positive test rate as of 5/4/2020: 5.2% — 11th lowest
> Date of first case: March 7
> Population density: 65.1 people per sq. mi. — 21st lowest
> Total population: 626,299
30. North Dakota
> COVID-19 confirmed cases as of 5/4/2020: 161.2 per 100,000 (total: 1,225)
> Rank on April 28: 21st lowest
> COVID-19 related deaths as of 5/4/2020: 3.3 per 100,000 — 12th lowest (total: 25)
> Total testing rate as of 5/4/2020: 45.7 per 1,000 people — 4th highest (total: 34,754)
> Positive test rate as of 5/4/2020: 3.5% — 5th lowest
> Date of first case: March 11
> Population density: 10.8 people per sq. mi. — 4th lowest
> Total population: 760,077
[in-text-ad]
29. Alabama
> COVID-19 confirmed cases as of 5/4/2020: 167.9 per 100,000 (total: 8,206)
> Rank on April 28: 24th lowest
> COVID-19 related deaths as of 5/4/2020: 6.3 per 100,000 — 25th highest (total: 310)
> Total testing rate as of 5/4/2020: 21.7 per 1,000 people — 22nd highest (total: 106,003)
> Positive test rate as of 5/4/2020: 7.7% — 18th lowest
> Date of first case: March 13
> Population density: 93.2 people per sq. mi. — 25th highest
> Total population: 4,887,871
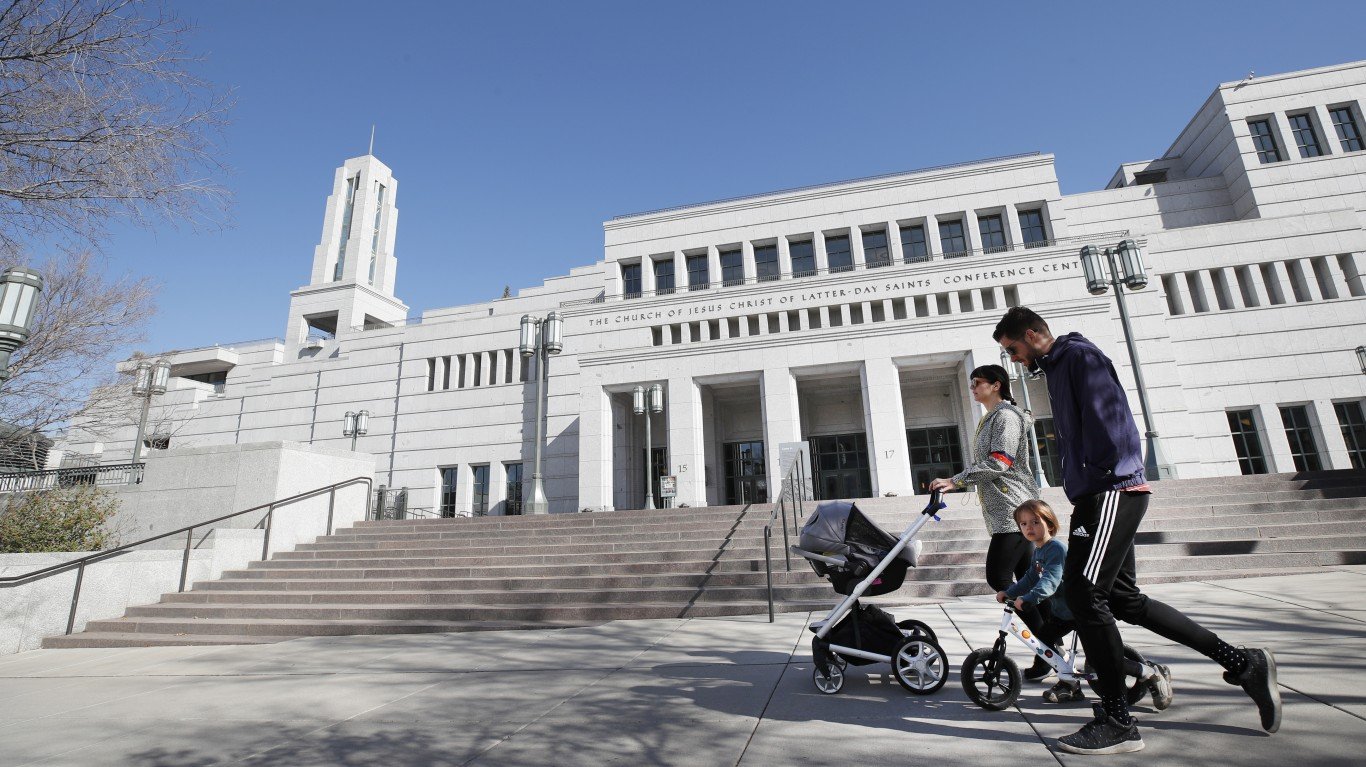
28. Utah
> COVID-19 confirmed cases as of 5/4/2020: 168.2 per 100,000 (total: 5,317)
> Rank on April 28: 22nd lowest
> COVID-19 related deaths as of 5/4/2020: 1.6 per 100,000 — 5th lowest (total: 50)
> Total testing rate as of 5/4/2020: 39.4 per 1,000 people — 5th highest (total: 124,661)
> Positive test rate as of 5/4/2020: 4.3% — 7th lowest
> Date of first case: Feb. 25
> Population density: 37.2 people per sq. mi. — 11th lowest
> Total population: 3,161,105
27. Ohio
> COVID-19 confirmed cases as of 5/4/2020: 175.1 per 100,000 (total: 20,474)
> Rank on April 28: 25th highest
> COVID-19 related deaths as of 5/4/2020: 8.3 per 100,000 — 19th highest (total: 975)
> Total testing rate as of 5/4/2020: 13.7 per 1,000 people — 5th lowest (total: 159,838)
> Positive test rate as of 5/4/2020: 12.8% — 20th highest
> Date of first case: March 9
> Population density: 260.8 people per sq. mi. — 10th highest
> Total population: 11,689,442
[in-text-ad-2]
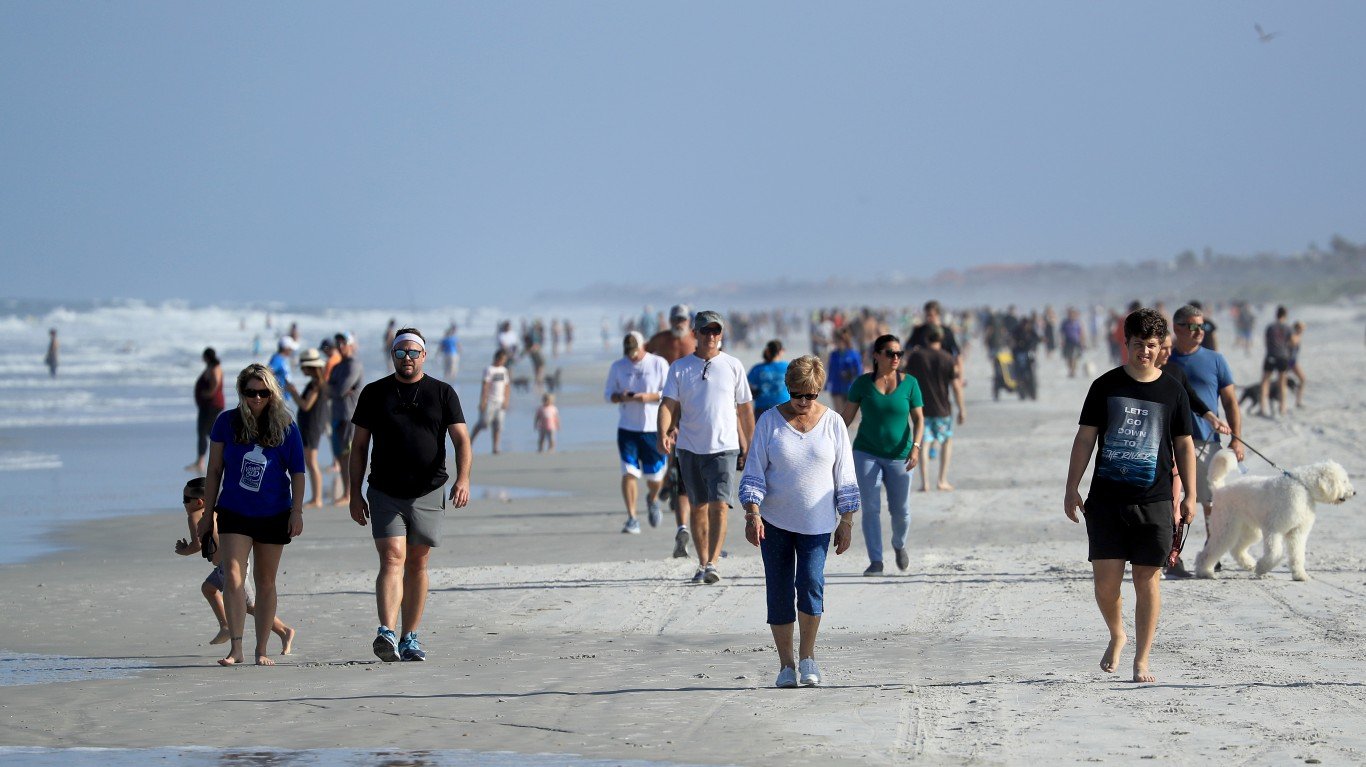
26. Florida
> COVID-19 confirmed cases as of 5/4/2020: 175.8 per 100,000 (total: 37,439)
> Rank on April 28: 22nd highest
> COVID-19 related deaths as of 5/4/2020: 6.9 per 100,000 — 23rd highest (total: 1,471)
> Total testing rate as of 5/4/2020: 22.0 per 1,000 people — 21st highest (total: 467,553)
> Positive test rate as of 5/4/2020: 8.0% — 20th lowest
> Date of first case: March 1
> Population density: 323.9 people per sq. mi. — 8th highest
> Total population: 21,299,325

25. Kansas
> COVID-19 confirmed cases as of 5/4/2020: 180.1 per 100,000 (total: 5,245)
> Rank on April 28: 20th lowest
> COVID-19 related deaths as of 5/4/2020: 4.7 per 100,000 — 17th lowest (total: 136)
> Total testing rate as of 5/4/2020: 13.3 per 1,000 people — 2nd lowest (total: 38,603)
> Positive test rate as of 5/4/2020: 13.6% — 18th highest
> Date of first case: March 7
> Population density: 35.4 people per sq. mi. — 10th lowest
> Total population: 2,911,510
[in-text-ad]

24. Nevada
> COVID-19 confirmed cases as of 5/4/2020: 185.5 per 100,000 (total: 5,630)
> Rank on April 28: 21st highest
> COVID-19 related deaths as of 5/4/2020: 8.8 per 100,000 — 17th highest (total: 266)
> Total testing rate as of 5/4/2020: 19.6 per 1,000 people — 23rd lowest (total: 59,437)
> Positive test rate as of 5/4/2020: 9.5% — 25th highest
> Date of first case: March 5
> Population density: 27.4 people per sq. mi. — 9th lowest
> Total population: 3,034,392
23. New Hampshire
> COVID-19 confirmed cases as of 5/4/2020: 190.8 per 100,000 (total: 2,588)
> Rank on April 28: 24th highest
> COVID-19 related deaths as of 5/4/2020: 6.3 per 100,000 — 25th lowest (total: 86)
> Total testing rate as of 5/4/2020: 19.8 per 1,000 people — 25th lowest (total: 26,870)
> Positive test rate as of 5/4/2020: 9.6% — 24th highest
> Date of first case: March 2
> Population density: 145.1 people per sq. mi. — 19th highest
> Total population: 1,356,458
22. New Mexico
> COVID-19 confirmed cases as of 5/4/2020: 192.4 per 100,000 (total: 4,031)
> Rank on April 28: 23rd lowest
> COVID-19 related deaths as of 5/4/2020: 7.4 per 100,000 — 22nd highest (total: 156)
> Total testing rate as of 5/4/2020: 39.0 per 1,000 people — 6th highest (total: 81,720)
> Positive test rate as of 5/4/2020: 4.9% — 9th lowest
> Date of first case: March 11
> Population density: 17.2 people per sq. mi. — 6th lowest
> Total population: 2,095,428
[in-text-ad-2]

21. Tennessee
> COVID-19 confirmed cases as of 5/4/2020: 200.5 per 100,000 (total: 13,571)
> Rank on April 28: 23rd highest
> COVID-19 related deaths as of 5/4/2020: 3.2 per 100,000 — 11th lowest (total: 219)
> Total testing rate as of 5/4/2020: 31.2 per 1,000 people — 8th highest (total: 211,443)
> Positive test rate as of 5/4/2020: 6.4% — 14th lowest
> Date of first case: March 5
> Population density: 160.6 people per sq. mi. — 17th highest
> Total population: 6,770,010
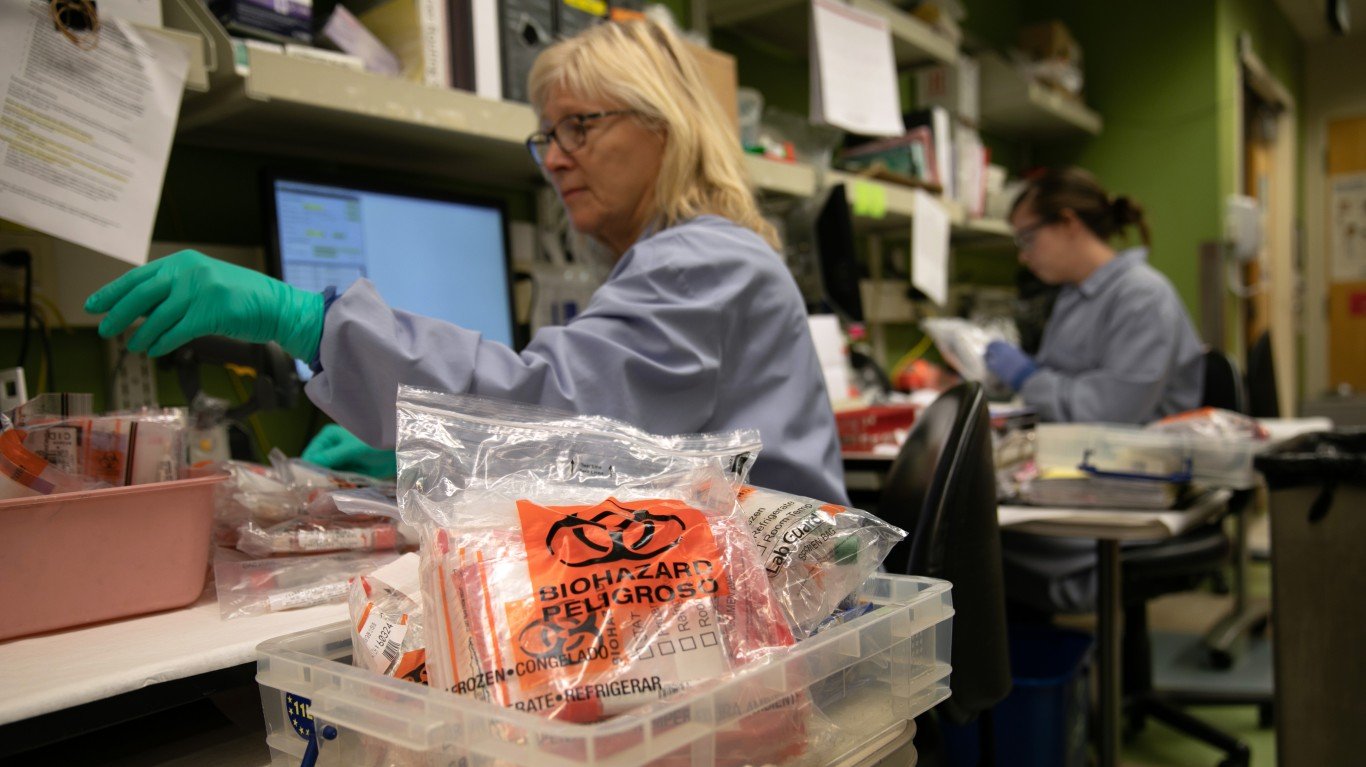
20. Washington
> COVID-19 confirmed cases as of 5/4/2020: 205.2 per 100,000 (total: 15,462)
> Rank on April 28: 18th highest
> COVID-19 related deaths as of 5/4/2020: 11.2 per 100,000 — 15th highest (total: 841)
> Total testing rate as of 5/4/2020: 28.7 per 1,000 people — 12th highest (total: 216,320)
> Positive test rate as of 5/4/2020: 7.1% — 16th lowest
> Date of first case: Jan. 21
> Population density: 105.7 people per sq. mi. — 23rd highest
> Total population: 7,535,591
[in-text-ad]

19. Virginia
> COVID-19 confirmed cases as of 5/4/2020: 237.8 per 100,000 (total: 20,256)
> Rank on April 28: 20th highest
> COVID-19 related deaths as of 5/4/2020: 8.4 per 100,000 — 18th highest (total: 713)
> Total testing rate as of 5/4/2020: 15.0 per 1,000 people — 10th lowest (total: 127,938)
> Positive test rate as of 5/4/2020: 15.8% — 15th highest
> Date of first case: March 7
> Population density: 199.1 people per sq. mi. — 13th highest
> Total population: 8,517,685
18. Mississippi
> COVID-19 confirmed cases as of 5/4/2020: 263.8 per 100,000 (total: 7,877)
> Rank on April 28: 16th highest
> COVID-19 related deaths as of 5/4/2020: 10.4 per 100,000 — 16th highest (total: 310)
> Total testing rate as of 5/4/2020: 26.7 per 1,000 people — 15th highest (total: 79,677)
> Positive test rate as of 5/4/2020: 9.9% — 23rd highest
> Date of first case: March 11
> Population density: 61.7 people per sq. mi. — 18th lowest
> Total population: 2,986,530

17. Georgia
> COVID-19 confirmed cases as of 5/4/2020: 280.4 per 100,000 (total: 29,499)
> Rank on April 28: 15th highest
> COVID-19 related deaths as of 5/4/2020: 11.9 per 100,000 — 14th highest (total: 1,255)
> Total testing rate as of 5/4/2020: 19.1 per 1,000 people — 20th lowest (total: 200,814)
> Positive test rate as of 5/4/2020: 14.7% — 16th highest
> Date of first case: March 2
> Population density: 177.0 people per sq. mi. — 16th highest
> Total population: 10,519,475
[in-text-ad-2]

16. Colorado
> COVID-19 confirmed cases as of 5/4/2020: 296.8 per 100,000 (total: 16,907)
> Rank on April 28: 14th highest
> COVID-19 related deaths as of 5/4/2020: 14.9 per 100,000 — 13th highest (total: 851)
> Total testing rate as of 5/4/2020: 14.6 per 1,000 people — 9th lowest (total: 83,266)
> Positive test rate as of 5/4/2020: 20.3% — 7th highest
> Date of first case: March 5
> Population density: 54.7 people per sq. mi. — 14th lowest
> Total population: 5,695,564

15. South Dakota
> COVID-19 confirmed cases as of 5/4/2020: 302.4 per 100,000 (total: 2,668)
> Rank on April 28: 12th highest
> COVID-19 related deaths as of 5/4/2020: 2.4 per 100,000 — 6th lowest (total: 21)
> Total testing rate as of 5/4/2020: 21.2 per 1,000 people — 23rd highest (total: 18,713)
> Positive test rate as of 5/4/2020: 14.3% — 17th highest
> Date of first case: March 10
> Population density: 11.4 people per sq. mi. — 5th lowest
> Total population: 882,235
[in-text-ad]
14. Indiana
> COVID-19 confirmed cases as of 5/4/2020: 306.4 per 100,000 (total: 20,507)
> Rank on April 28: 13th highest
> COVID-19 related deaths as of 5/4/2020: 17.2 per 100,000 — 12th highest (total: 1,151)
> Total testing rate as of 5/4/2020: 16.9 per 1,000 people — 16th lowest (total: 113,297)
> Positive test rate as of 5/4/2020: 18.1% — 11th highest
> Date of first case: March 6
> Population density: 183.7 people per sq. mi. — 15th highest
> Total population: 6,691,878
13. Nebraska
> COVID-19 confirmed cases as of 5/4/2020: 315.3 per 100,000 (total: 6,083)
> Rank on April 28: 19th highest
> COVID-19 related deaths as of 5/4/2020: 4.0 per 100,000 — 14th lowest (total: 78)
> Total testing rate as of 5/4/2020: 18.0 per 1,000 people — 18th lowest (total: 34,675)
> Positive test rate as of 5/4/2020: 17.5% — 12th highest
> Date of first case: Feb. 17
> Population density: 24.9 people per sq. mi. — 8th lowest
> Total population: 1,929,268
12. Iowa
> COVID-19 confirmed cases as of 5/4/2020: 320.4 per 100,000 (total: 10,111)
> Rank on April 28: 17th highest
> COVID-19 related deaths as of 5/4/2020: 6.6 per 100,000 — 24th highest (total: 207)
> Total testing rate as of 5/4/2020: 19.2 per 1,000 people — 22nd lowest (total: 60,569)
> Positive test rate as of 5/4/2020: 16.7% — 13th highest
> Date of first case: March 8
> Population density: 56.1 people per sq. mi. — 15th lowest
> Total population: 3,156,145
[in-text-ad-2]
11. Pennsylvania
> COVID-19 confirmed cases as of 5/4/2020: 391.1 per 100,000 (total: 50,092)
> Rank on April 28: 10th highest
> COVID-19 related deaths as of 5/4/2020: 19.2 per 100,000 — 10th highest (total: 2,458)
> Total testing rate as of 5/4/2020: 19.2 per 1,000 people — 21st lowest (total: 245,590)
> Positive test rate as of 5/4/2020: 20.4% — 6th highest
> Date of first case: March 6
> Population density: 278.1 people per sq. mi. — 9th highest
> Total population: 12,807,060

10. Michigan
> COVID-19 confirmed cases as of 5/4/2020: 439.7 per 100,000 (total: 43,950)
> Rank on April 28: 8th highest
> COVID-19 related deaths as of 5/4/2020: 41.4 per 100,000 — 6th highest (total: 4,135)
> Total testing rate as of 5/4/2020: 22.2 per 1,000 people — 20th highest (total: 222,193)
> Positive test rate as of 5/4/2020: 19.8% — 8th highest
> Date of first case: March 10
> Population density: 103.4 people per sq. mi. — 24th highest
> Total population: 9,995,915
[in-text-ad]

9. Maryland
> COVID-19 confirmed cases as of 5/4/2020: 448.8 per 100,000 (total: 27,117)
> Rank on April 28: 11th highest
> COVID-19 related deaths as of 5/4/2020: 21.3 per 100,000 — 8th highest (total: 1,290)
> Total testing rate as of 5/4/2020: 23.2 per 1,000 people — 19th highest (total: 140,103)
> Positive test rate as of 5/4/2020: 19.4% — 9th highest
> Date of first case: March 5
> Population density: 487.1 people per sq. mi. — 5th highest
> Total population: 6,042,718

8. Illinois
> COVID-19 confirmed cases as of 5/4/2020: 501.1 per 100,000 (total: 63,840)
> Rank on April 28: 9th highest
> COVID-19 related deaths as of 5/4/2020: 20.9 per 100,000 — 9th highest (total: 2,662)
> Total testing rate as of 5/4/2020: 26.1 per 1,000 people — 16th highest (total: 333,147)
> Positive test rate as of 5/4/2020: 19.2% — 10th highest
> Date of first case: Jan. 24
> Population density: 220.0 people per sq. mi. — 12th highest
> Total population: 12,741,080
7. Delaware
> COVID-19 confirmed cases as of 5/4/2020: 546.7 per 100,000 (total: 5,288)
> Rank on April 28: 7th highest
> COVID-19 related deaths as of 5/4/2020: 18.8 per 100,000 — 11th highest (total: 182)
> Total testing rate as of 5/4/2020: 24.9 per 1,000 people — 17th highest (total: 24,110)
> Positive test rate as of 5/4/2020: 21.9% — 4th highest
> Date of first case: March 11
> Population density: 388.6 people per sq. mi. — 6th highest
> Total population: 967,171
[in-text-ad-2]

6. Louisiana
> COVID-19 confirmed cases as of 5/4/2020: 636.8 per 100,000 (total: 29,673)
> Rank on April 28: 6th highest
> COVID-19 related deaths as of 5/4/2020: 42.7 per 100,000 — 5th highest (total: 1,991)
> Total testing rate as of 5/4/2020: 38.8 per 1,000 people — 7th highest (total: 180,931)
> Positive test rate as of 5/4/2020: 16.4% — 14th highest
> Date of first case: March 9
> Population density: 89.0 people per sq. mi. — 25th lowest
> Total population: 4,659,978

5. Connecticut
> COVID-19 confirmed cases as of 5/4/2020: 839.0 per 100,000 (total: 29,973)
> Rank on April 28: 5th highest
> COVID-19 related deaths as of 5/4/2020: 71.5 per 100,000 — 3rd highest (total: 2,556)
> Total testing rate as of 5/4/2020: 29.5 per 1,000 people — 10th highest (total: 105,330)
> Positive test rate as of 5/4/2020: 28.5% — 3rd highest
> Date of first case: March 8
> Population density: 644.5 people per sq. mi. — 4th highest
> Total population: 3,572,665
[in-text-ad]
4. Rhode Island
> COVID-19 confirmed cases as of 5/4/2020: 939.5 per 100,000 (total: 9,933)
> Rank on April 28: 4th highest
> COVID-19 related deaths as of 5/4/2020: 33.6 per 100,000 — 7th highest (total: 355)
> Total testing rate as of 5/4/2020: 72.3 per 1,000 people — the highest (total: 76,435)
> Positive test rate as of 5/4/2020: 13.0% — 19th highest
> Date of first case: March 1
> Population density: 684.3 people per sq. mi. — 2nd highest
> Total population: 1,057,315

3. Massachusetts
> COVID-19 confirmed cases as of 5/4/2020: 1,000.9 per 100,000 (total: 69,087)
> Rank on April 28: 3rd highest
> COVID-19 related deaths as of 5/4/2020: 59.3 per 100,000 — 4th highest (total: 4,090)
> Total testing rate as of 5/4/2020: 47.0 per 1,000 people — 3rd highest (total: 324,268)
> Positive test rate as of 5/4/2020: 21.3% — 5th highest
> Date of first case: Feb. 1
> Population density: 654.0 people per sq. mi. — 3rd highest
> Total population: 6,902,149

2. New Jersey
> COVID-19 confirmed cases as of 5/4/2020: 1,439.8 per 100,000 (total: 128,269)
> Rank on April 28: 2nd highest
> COVID-19 related deaths as of 5/4/2020: 88.8 per 100,000 — 2nd highest (total: 7,910)
> Total testing rate as of 5/4/2020: 27.9 per 1,000 people — 14th highest (total: 248,319)
> Positive test rate as of 5/4/2020: 51.7% — the highest
> Date of first case: March 4
> Population density: 1,021.3 people per sq. mi. — the highest
> Total population: 8,908,520
[in-text-ad-2]

1. New York
> COVID-19 confirmed cases as of 5/4/2020: 1,632.1 per 100,000 (total: 318,953)
> Rank on April 28: the highest
> COVID-19 related deaths as of 5/4/2020: 99.3 per 100,000 — the highest (total: 19,415)
> Total testing rate as of 5/4/2020: 51.5 per 1,000 people — 2nd highest (total: 1,007,310)
> Positive test rate as of 5/4/2020: 31.7% — 2nd highest
> Date of first case: March 1
> Population density: 358.2 people per sq. mi. — 7th highest
> Total population: 19,542,209
Take This Retirement Quiz To Get Matched With An Advisor Now (Sponsored)
Are you ready for retirement? Planning for retirement can be overwhelming, that’s why it could be a good idea to speak to a fiduciary financial advisor about your goals today.
Start by taking this retirement quiz right here from SmartAsset that will match you with up to 3 financial advisors that serve your area and beyond in 5 minutes. Smart Asset is now matching over 50,000 people a month.
Click here now to get started.
Thank you for reading! Have some feedback for us?
Contact the 24/7 Wall St. editorial team.

 24/7 Wall St.
 24/7 Wall St.




 24/7 Wall St.
