
Tens of millions of Americans relocate every year, whether it is for work, family, or retirement. Over the years, migration patterns develop as certain parts of the country have more job opportunities, better weather, or more desirable amenities than others. These areas can experience a significant increase in their populations because of the large influx of new residents.
To determine the cities Americans are flocking to, 24/7 Wall St. used data from the U.S. Census Bureau’s Population Estimates Program. Cities were ranked based on the increase in population due to net migration from April 1, 2010 to July 1, 2019. Supplemental data on income, educational attainment, adults age 65 and older, and poverty came from the Census Bureau’s 2018 American Community Survey. Seasonally adjusted data on the May 2020 unemployment rate came from the U.S. Bureau of Labor Statistics.
Each of the 25 cities with the largest increase in population due to net migration over the past decade is either in the South or West. Florida dominates the list, with a dozen metro areas showing population increases due to net migration of at least 15% from 2010 to 2019. The only other states with multiple cities on the list are South Carolina, with three, and Texas and Idaho, with two each.
Economic opportunity may be driving some of these moves, but many are also due to retirement. As the baby boomer generation begins to age out of the workforce, retirees are heading for the warmer climates that the southern and western parts of the country offer over the Northeast. Because these warmer areas are such desirable retirement destinations, housing and services there may be more expensive, as thousands of residents are hoping to live in the same areas, making prices competitive. This is what it costs to retire comfortably in every state.
The 2020 migration patterns will likely look very different from those in the decade before. Many Americans have already left larger urban centers to avoid COVID-19 outbreaks or because they lost their jobs in the resulting economic fallout. Also, Florida’s recent spike in cases will likely drive thousands of residents to safer parts of the country. These are the states with the most COVID-19 cases.
These are the cities Americans are flocking to.

25. Charleston-North Charleston, SC
> Population change due to migration, 2010-2019: +15.2% (+101,288)
> Overall population change, 2010-2019: +20.7% (+137,477)
> Change in employed population, 2010-2019: +29.9% (+88,893)
> 2019 population estimate: 802,122
Charleston ranks among the cities Americans are flocking to as over 101,000 more Americans moved to the area than moved away from it between 2010 and 2019. This accounts for a 15.2% increase in the population due to migration.
Many of those who moved were likely attracted by the strong job market in Charleston and the surrounding area. The Charleston metro area consistently had a relatively low annual unemployment rate from 2010 to 2019, and the improvement of its job market well outpaced that of the overall U.S. market. In 2010, Charleston’s 9.3% unemployment rate was just slightly lower than the U.S. rate of 9.6%. By 2019, just 2.4% of Charleston’s labor force was unemployed, lower than all but 13 other metro areas.
[in-text-ad]

24. Homosassa Springs, FL
> Population change due to migration, 2010-2019: +15.4% (+21,756)
> Overall population change, 2010-2019: +6.0% (+8,427)
> Change in employed population, 2010-2019: -1.1% (-498)
> 2019 population estimate: 149,657
Homosassa Springs is one of 12 Florida metro areas in which the population increased more than 15% due to migration alone. From 2010 to 2019, 21,756 more people moved to Homosassa Springs than moved away from it. This increase was likely driven by retirees flocking to the area — the metro area has a relatively large share of senior citizens.
Typically, when the number of people working in an area declines, this indicates economic difficulties. But this may not be the case in Homosassa Springs, with so many people in the area aging out of the workforce. Less than a third of Homosassa Springs residents are working.
[recirclink id=605680]

23. Boise City, ID
> Population change due to migration, 2010-2019: +15.4% (+95,236)
> Overall population change, 2010-2019: +21.5% (+132,636)
> Change in employed population, 2010-2019: +35.3% (+95,413)
> 2019 population estimate: 749,202
Boise is one of two Idaho metro areas with among the largest percentage increases in population due to migration since 2010. Over 95,000 more people moved to the Boise area than moved away from it over the past decade, a 15.4% increase. When factoring in the birth and death rates, Boise’s population grew 21.5% overall in the last decade.
People often relocate in search of new or better jobs, and Boise has one of the country’s best job markets. Boise’s annual unemployment rate has been consistently lower than the U.S. rate. In 2019, it was a full percentage point lower than the national rate, at 2.7%. From 2010 to 2019, the number of people working in Boise increased 35.3% — the 10th largest increase in the country.

22. Hilton Head Island-Bluffton-Beaufort, SC
> Population change due to migration, 2010-2019: +15.6% (+29,093)
> Overall population change, 2010-2019: +18.8% (+35,185)
> Change in employed population, 2010-2019: +26.8% (+18,653)
> 2019 population estimate: 222,195
Through net migration, the Hilton Head Island area of South Carolina grew by more than 29,000 people from 2010 to 2019. It is one of 18 U.S. urban centers in which more than a quarter of the population is 65 or older, indicating it is a popular destination for retirees.
Like many other cities with large inflows of people over the past decade, the Hilton Head area is in the South, near bodies of water. It sits at the southern tip of South Carolina, along the coast of the Atlantic Ocean. It also has a relatively strong job market, with annual unemployment rates that have consistently been lower than that of the U.S. overall. The Hilton Head Island metro area has a median household income of $63,723, about $1,400 higher than the U.S. median.
[in-text-ad-2]

21. Prescott, AZ
> Population change due to migration, 2010-2019: +15.8% (+33,299)
> Overall population change, 2010-2019: +11.4% (+24,082)
> Change in employed population, 2010-2019: +18.5% (+15,914)
> 2019 population estimate: 235,099
From 2010 to 2019, over 33,000 more people moved to Prescott, Arizona than moved away from it — a 15.8% increase over the 2010 population. The Central Arizona area appears to be a popular place for seniors to relocate, as 31.7% of the population is age 65 or older — the eighth highest percentage in the country.
Like many other communities with a large number of senior residents, there were far more deaths in Prescott than births, which offset some of the population increases from migration. The community recorded 17,021 births compared with 26,532 deaths. This 4.5% natural decline in population was one of the largest in the country.

20. Raleigh, NC
> Population change due to migration, 2010-2019: +16.0% (+180,756)
> Overall population change, 2010-2019: +23.0% (+260,292)
> Change in employed population, 2010-2019: +31.2% (+168,178)
> 2019 population estimate: 1,390,785
Raleigh, North Carolina is one of just 20 American metro areas with a population increase of at least 16% due to migration from 2010 to 2019. It is the metro area in North Carolina that has grown the fastest from migration.
Many people have likely moved to Raleigh because of its strong economy. The metro area has a median household income over $75,000, compared with the U.S. median of just under $62,000. Raleigh also has a poverty rate of 8.9%, well below the 13.3% rate nationwide.
[in-text-ad]

19. Crestview-Fort Walton Beach-Destin, FL
> Population change due to migration, 2010-2019: +16.1% (+38,062)
> Overall population change, 2010-2019: +20.7% (+48,939)
> Change in employed population, 2010-2019: +19.0% (+19,934)
> 2019 population estimate: 284,809
With a 16.1% increase to its 2010 population due to migration, the Crestview-Fort Walton Beach-Destin metro area is one of a dozen areas in Florida with a large influx of people relative to its size. Over 38,000 more people moved to this part of the Florida panhandle than moved away from it between 2010 and 2019.
The Destin metro area has consistently had a lower annual unemployment rate each year since 2010. In 2019, its unemployment rate was a full percentage point lower than the U.S. rate. Even during the COVID-19 pandemic, it has a relatively low share of its labor force out of work, reporting an 11.3% unemployment rate for May 2020, compared with the 13.3% rate nationwide.
[recirclink id=563294]

18. Coeur d’Alene, ID
> Population change due to migration, 2010-2019: +16.7% (+23,102)
> Overall population change, 2010-2019: +19.7% (+27,231)
> Change in employed population, 2010-2019: +25.9% (+15,912)
> 2019 population estimate: 165,697
From 2010 to 2019, 23,102 more people moved to Coeur d’Alene, Idaho than moved away from it — a 16.7% increase from the 2010 population. Overall, the population of this part of Idaho’s panhandle increased by 19.7%, when taking into account births and deaths.
However, despite Coeur d’Alene’s population growth, its international migration was actually negative. This means that more people moved away from Coeur d’Alene to another country than moved to it from abroad.
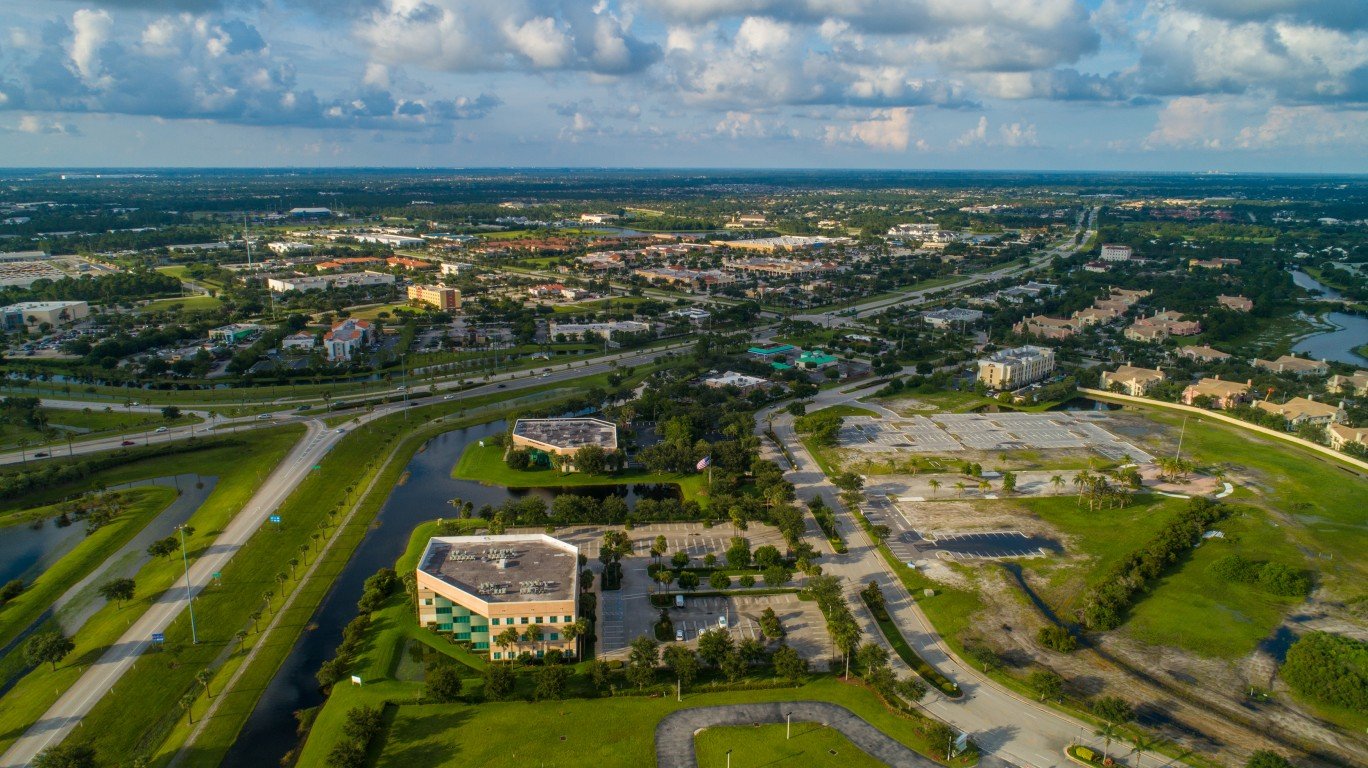
17. Port St. Lucie, FL
> Population change due to migration, 2010-2019: +16.8% (+71,121)
> Overall population change, 2010-2019: +15.4% (+65,190)
> Change in employed population, 2010-2019: +23.9% (+40,728)
> 2019 population estimate: 489,297
Port St. Lucie is on the east coast of Florida, roughly between Orlando and Miami. Over 71,000 more people moved to the metro area than moved away from it — a 16.8% increase compared with the 2010 population.
Like many of the metro areas on this list, particularly those in Florida, Port St. Lucie has a relatively large population of people aged 65 and older, at 26.5%. This is a higher percentage than all but a dozen other metro areas, indicating it is a popular place for Americans to retire.
[in-text-ad-2]
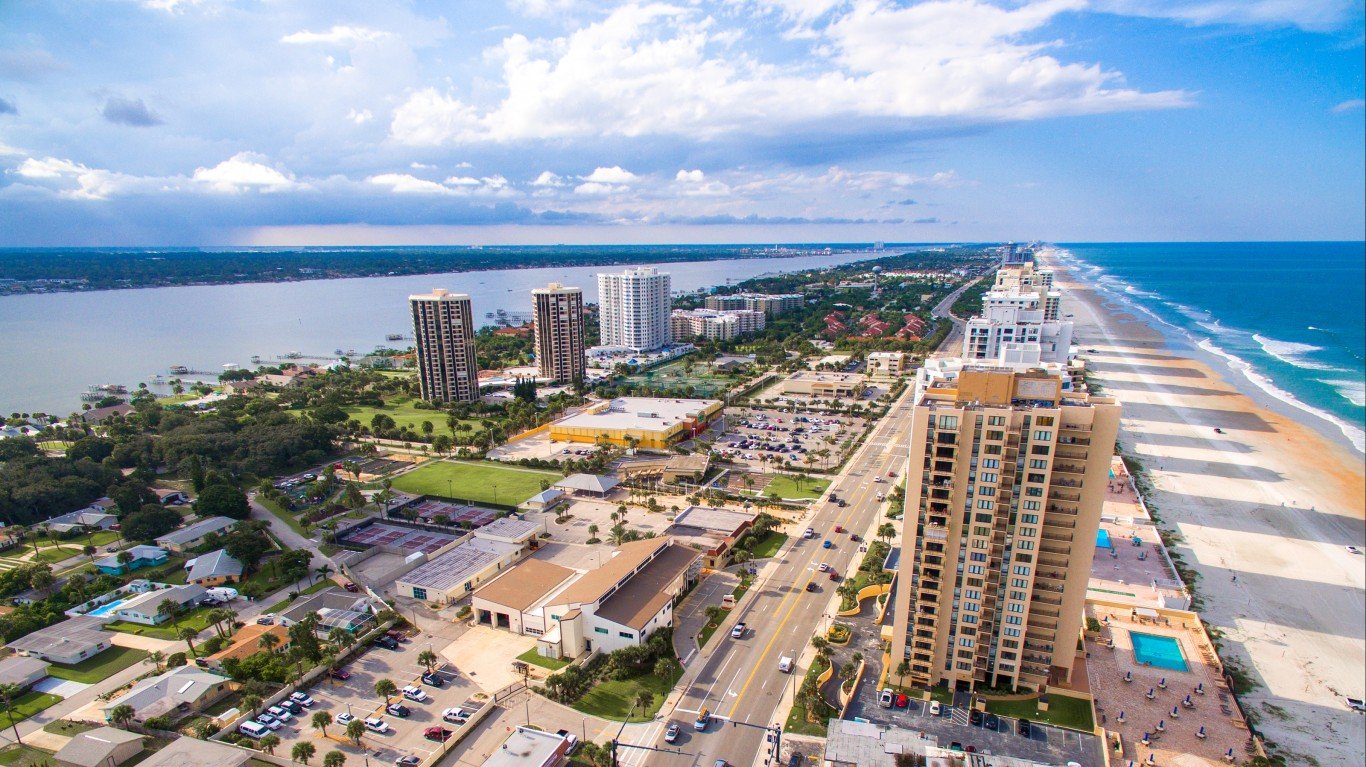
16. Deltona-Daytona Beach-Ormond Beach, FL
> Population change due to migration, 2010-2019: +16.8% (+99,352)
> Overall population change, 2010-2019: +13.2% (+78,077)
> Change in employed population, 2010-2019: +18.6% (+45,584)
> 2019 population estimate: 668,365
Nearly 100,000 more people moved to the Deltona-Daytona Beach-Ormond Beach metro area in Florida than moved away from it over the past decade. This resulted in a 16.8% increase in the 2010 population due to migration.
In spite of this, the overall population only increased 13.2% — this is because the area reported nearly 74,000 deaths, compared with just over 52,000 births during that time period. This is likely because of the relatively large number of seniors in the Daytona metro area — 25.6% of residents are 65 or older, as compared with 16.0% of all Americans.

15. Orlando-Kissimmee-Sanford, FL
> Population change due to migration, 2010-2019: +17.3% (+368,588)
> Overall population change, 2010-2019: +22.2% (+473,748)
> Change in employed population, 2010-2019: +30.6% (+309,707)
> 2019 population estimate: 2,608,147
The Orlando area’s population increased to over 2.6 million people, as 368,588 more people moved to that part of Central Florida than moved away from it. Many of these people were likely attracted by the area’s relatively strong job market. The Orlando area has had a lower unemployment rate than the U.S. overall since 2013.
The population change due to migration in the Orlando area is unique among the cities Americans are relocating to because of how much of its migration came from overseas. While 186,592 people moved to the Orlando area from other parts of the country, nearly 182,000 people came to the area from another country.
[in-text-ad]

14. Midland, TX
> Population change due to migration, 2010-2019: +17.3% (+24,557)
> Overall population change, 2010-2019: +28.9% (+40,932)
> Change in employed population, 2010-2019: +56.2% (+38,885)
> 2019 population estimate: 182,603
Midland is one of two metro areas in Texas to have a large population increase due to net migration over the past decade. The West Texas area had 24,557 more people move to it than move away from it between 2010 and 2019. Midland’s overall population increased by 28.9% during that time, as it also reported an 11.2% natural population increase because births were far more common than deaths.
Midland, largely reliant on the oil and natural gas industry, consistently had one of the best job markets in the country throughout the last decade. The number of people working in the area increased by 56.2% — from roughly 69,000 to 108,000 — between 2010 and 2019. It has also consistently had one of the lowest unemployment rates each year. In 2019, its 2.1% unemployment rate was the fourth lowest of all U.S. metro areas.
[recirclink id=685994]

13. Lakeland-Winter Haven, FL
> Population change due to migration, 2010-2019: +18.7% (+112,597)
> Overall population change, 2010-2019: +20.4% (+122,704)
> Change in employed population, 2010-2019: +20.4% (+49,804)
> 2019 population estimate: 724,777
As you may expect from a place named Winter Haven, many people move to the Lakeland-Winter Haven area, located in Central Florida, for its climate. The metro area increased in size from just over 602,000 people in 2010 to nearly 725,000 in 2019. The majority of this increase was driven by migration, as nearly 90,000 people moved to this area from elsewhere in the country over the past decade.
Like many other places with warm climates, the Lakeland-Winter Haven area is a popular tourist destination. It features the world’s largest Legoland and numerous lakes and golf courses. These tourist-friendly areas have been hit especially hard by the COVID-19 outbreak. In May 2019, its unemployment rate was 3.9%, slightly above that of the U.S. By May 2020, it had increased to 19.4%, well above the 13.3% U.S. rate.

12. Greeley, CO
> Population change due to migration, 2010-2019: +19.4% (+49,035)
> Overall population change, 2010-2019: +28.3% (+71,665)
> Change in employed population, 2010-2019: +38.3% (+45,874)
> 2019 population estimate: 324,492
Greeley, just about 50 miles north of Denver, is the only Colorado city to rank among the fastest growing, based on net migration. Just over 49,000 more people moved to the Greeley metro area than moved away from it in the past decade. Unlike many other cities Americans are flocking to, there were many more births than deaths in Greeley from 2010 to 2019.
The Greeley area has a number of positive economic indicators. Its median household income is nearly $14,000 higher than the U.S. median. Its poverty rate of 10.8% is also well below the U.S. poverty rate of 13.1%.
[in-text-ad-2]

11. Naples-Immokalee-Marco Island, FL
> Population change due to migration, 2010-2019: +19.6% (+63,056)
> Overall population change, 2010-2019: +19.7% (+63,380)
> Change in employed population, 2010-2019: +36.3% (+46,613)
> 2019 population estimate: 384,902
From 2010 to 2019, over 63,000 more people moved to the Naples-Immokalee-Marco Island, Florida metro area than moved away from it — a 19.6% increase compared with the 2010 population. This area in southwestern Florida now has a population of nearly 385,000 people.
The Naples area has a relatively high share of affluent residents, with 11.8% of households earning at least $200,000 per year. For comparison, just 7.6% of U.S. houses earn that much. The area also has one of the nation’s highest median home values, at nearly $370,000.

10. Sebastian-Vero Beach, FL
> Population change due to migration, 2010-2019: +20.3% (+27,992)
> Overall population change, 2010-2019: +15.9% (+21,895)
> Change in employed population, 2010-2019: +19.1% (+10,101)
> 2019 population estimate: 159,923
The Sebastian-Vero Beach, Florida metro area is one of just 10 urban centers in which the population has increased by over 20% due to migration between 2010 and 2019.
Of the area’s nearly 160,000 residents, 32.6% are 65 or older — the fifth highest share in the country. It is one of several southern metro areas that thousands of seniors have chosen to retire in, but its improving job market has likely also drawn in new residents as well. In 2010, the Sebastian metro area had an unemployment rate of 13.9%, well above the 9.6% U.S. rate. But by 2019, the area’s unemployment rate was 3.8%, nearly in line with the national rate.
[in-text-ad]

9. Austin-Round Rock, TX
> Population change due to migration, 2010-2019: +20.7% (+355,902)
> Overall population change, 2010-2019: +29.8% (+510,760)
> Change in employed population, 2010-2019: +39.2% (+338,914)
> 2019 population estimate: 2,227,083
The population of the Austin-Round Rock, Texas metro area grew by 20.7% due to migration alone in the past decade — an increase of nearly 356,000 people. Of the 10 cities with the highest population increases due to migration from 2010 to 2019, the Austin area is the only one that does not have an outsized share of senior citizens. In fact, just 10.8% of Austin residents are 65 or older, compared with 16.0% of Americans overall. Just 13 other metro areas have a lower share of seniors.
The Texas capital’s strong economy has likely attracted thousands of people to the area. Austin has consistently had a much lower unemployment rate than the U.S. overall over the past decade, and its median household income of nearly $77,000 is well above the U.S. median of $61,937.
[recirclink id=564685]
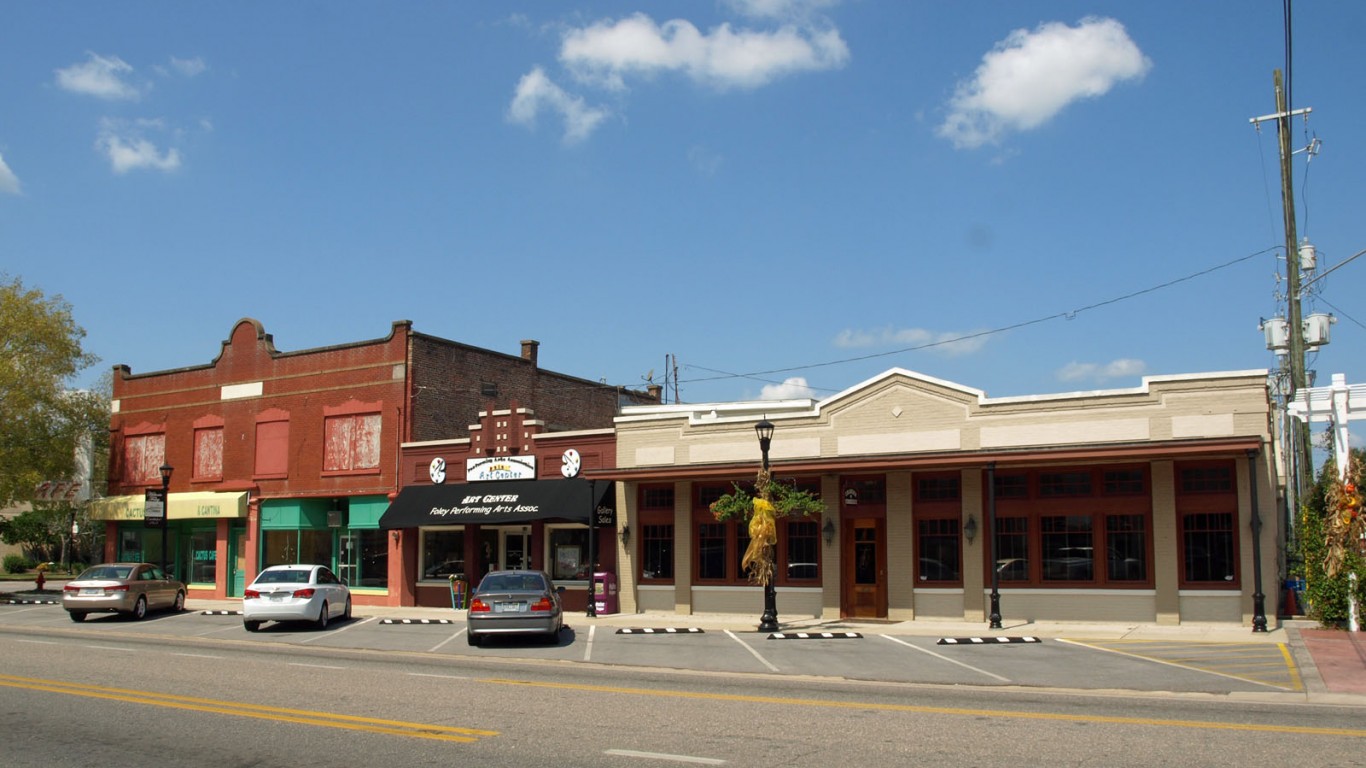
8. Daphne-Fairhope-Foley, AL
> Population change due to migration, 2010-2019: +21.3% (+38,880)
> Overall population change, 2010-2019: +22.5% (+40,969)
> Change in employed population, 2010-2019: +26.0% (+19,555)
> 2019 population estimate: 223,234
The population of the Daphne-Fairhope-Foley metro area increased by over 20% due to migration over the past decade, as nearly 39,000 more people moved to the area than moved away from it.
The Daphne area is not especially affluent, as its median household income is $56,813, compared with the U.S. median of $61,937. Yet just 8.9% of the area is impoverished, compared with 13.1% of all Americans.

7. St. George, UT
> Population change due to migration, 2010-2019: +21.7% (+29,998)
> Overall population change, 2010-2019: +28.6% (+39,441)
> Change in employed population, 2010-2019: +45.2% (+22,985)
> 2019 population estimate: 177,556
Because of the influx of new people moving to the St. George, Utah metro area, its population grew by nearly 30,000 in the past decade, a 21.7% increase. This is by far the largest percentage increase of anywhere in Utah and one of the largest gains in the country.
The number of people working in St. George increased 45.2% from 2010 to 2019, the second highest share of any U.S. metro area. This was likely driven by a combination of the population influx and the improving job market. St. George’s 2010 annual unemployment rate was 10.5%. By 2019, it had declined to 3.0%.
[in-text-ad-2]

6. North Port-Sarasota-Bradenton, FL
> Population change due to migration, 2010-2019: +22.8% (+160,197)
> Overall population change, 2010-2019: +19.2% (+134,683)
> Change in employed population, 2010-2019: +28.4% (+79,095)
> 2019 population estimate: 836,995
Over 160,000 more people moved to the North Port-Sarasota-Bradenton metro area of Florida from 2010 to 2019 than moved away from it — a 22.8% increase over the 2010 population. In the North Port metro area, 32.2% of residents are 65 or older — more than double the U.S. rate — which indicates this part of Florida is an attractive place for retirees.
But the economic conditions of the area have likely attracted new residents as well. Few job markets have improved as much as that of the North Port metro area. From 2010 to 2019, its unemployment rate declined 8.4 percentage points, compared with the U.S. decline of 5.9 percentage points.

5. Bend-Redmond, OR
> Population change due to migration, 2010-2019: +23.0% (+36,236)
> Overall population change, 2010-2019: +25.3% (+39,964)
> Change in employed population, 2010-2019: +32.0% (+22,366)
> 2019 population estimate: 197,692
The Bend, Oregon metro area reported almost 40,000 more people in 2019 than it did in 2010. Nearly all of that growth was driven by migration, as over 36,000 more people moved to Bend than moved away from it.
Nearly all of the cities Americans are flocking to have a positive net migration from other countries of at least a few thousand people. Yet over the past decade, more people have left Bend, Oregon, to live overseas than have come from outside the U.S. to live there.
[in-text-ad]

4. Cape Coral-Fort Myers, FL
> Population change due to migration, 2010-2019: +24.6% (+152,286)
> Overall population change, 2010-2019: +24.5% (+151,822)
> Change in employed population, 2010-2019: +36.0% (+89,326)
> 2019 population estimate: 770,577
The Cape Coral-Fort Myers metro area had the fourth largest population change due to migration from 2010 to 2019 in America, though it was just the third largest in Florida. Migration increased the area’s population by 24.5%, as it attracted 152,286 more residents than it lost in the past decade.
Like many other cities on this list, the Cape Coral metro area likely attracted so many new residents because of its strengthening economy and desirability as a retirement destination. The area has the 12th highest share of senior citizens, at 28.7%. Its annual unemployment rate also dropped 9.4 percentage points, to 3.1%, from 2010 to 2019 — one of the largest declines in the country.
[recirclink id=726588]

3. Punta Gorda, FL
> Population change due to migration, 2010-2019: +26.4% (+42,167)
> Overall population change, 2010-2019: +18.1% (+28,943)
> Change in employed population, 2010-2019: +19.7% (+11,393)
> 2019 population estimate: 188,910
Punta Gorda, Florida is one of just three U.S. metro areas in which the population increased by more than 26.4% due to migration from 2010 to 2019. Over 42,000 more people moved to the area than moved away from it over the past decade.
Punta Gorda, on the western coast of Florida, is a popular destination for retirees. It is one of just two metro areas in the country in which more than 40% of all residents are at least 65 years old. The area offers good weather and amenities that may help attract seniors.
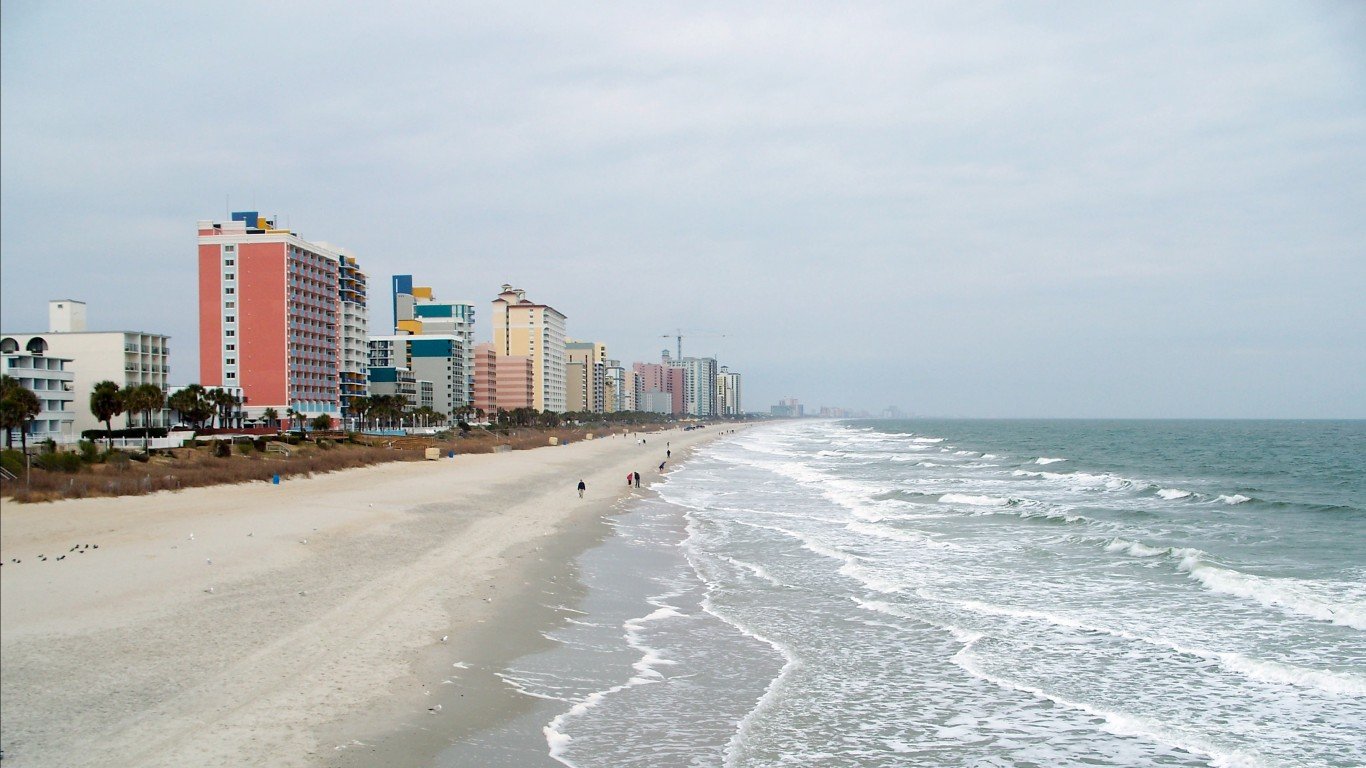
2. Myrtle Beach-Conway-North Myrtle Beach, SC-NC
> Population change due to migration, 2010-2019: +32.6% (+122,581)
> Overall population change, 2010-2019: +32.0% (+120,326)
> Change in employed population, 2010-2019: +25.2% (+39,273)
> 2019 population estimate: 496,901
Myrtle Beach is one of just two metro areas in the country in which the population increased by over 30% due to migration in the past decade. The metro area comprises the northern part of South Carolina, as well as the southern part of North Carolina along the Atlantic Ocean. It now has nearly 500,000 residents, as over 122,000 more people moved to Myrtle Beach than moved away from it from 2010 to 2019.
A popular vacation destination, the Myrtle Beach area’s economy has been severely impacted by the COVID-19 pandemic as people halted travel plans. The metro area’s unemployment rate is one of the highest in the country, at 18.7%
[in-text-ad-2]
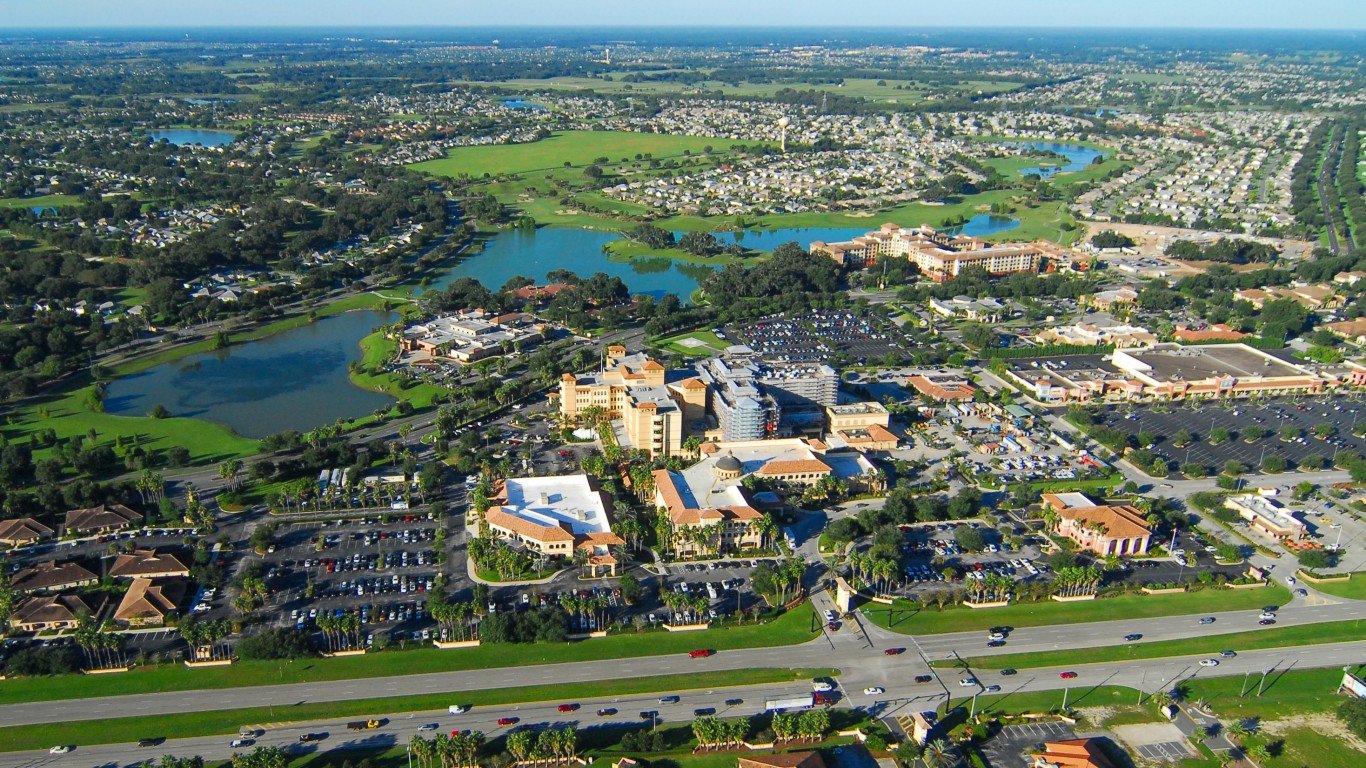
1. The Villages, FL
> Population change due to migration, 2010-2019: +52.3% (+48,895)
> Overall population change, 2010-2019: +41.7% (+39,000)
> Change in employed population, 2010-2019: +41.8% (+9,171)
> 2019 population estimate: 132,420
The population of The Villages, Florida, has expanded due to migration more than any other metro area in the country by a significant margin. Its population increased 52.3% due to migration — nearly 20 percentage points beyond the next closest city. The Villages bills itself as “a collection of quaint retirement neighborhoods,” and tens of thousands of seniors have moved to the Central Florida community since 2010.
As you would expect from such a large community designed for seniors, there were fewer births in The Villages than in any other U.S. metro area, and there were just over 31,000 people working in the metro area, out of a population of 132,420.
Contact [email protected] for any questions or corrections.