Consumer economies — like that of the United States, where consumer spending accounts for 70% of economic activity — are highly exposed to slowdown in a pandemic. Since the coronavirus reached American shores, the U.S. has shed millions of jobs, and GDP plummeted by nearly a third in a single quarter, the largest decline on record.
Leading up to the pandemic, the U.S. economy was, by many indicators, relatively healthy. Unemployment was at historic lows, the Dow Jones Industrial Average was hovering near record highs, and GDP had grown for the longest consecutive period in history.
The current recession has not affected each state equally. Some states have suffered far steeper job losses than others. Similarly, strong economic growth in recent years, as well as more financially secure populations, meant that some states were better equipped to absorb the shock of COVID-19 than others.
To determine the states with the best and worst economies, both in the years leading up to the pandemic and during it, 24/7 Wall St. created an index of four measures — economic growth, employment growth, the poverty rate, and the unemployment rate. Data came from the Bureau of Economic Analysis, the Bureau of Labor Statistics, and the U.S. Census Bureau.
Due to the unemployment crisis caused by the pandemic, the June unemployment rate is higher in nearly every state than it was in June 2019. In all but a dozen states, overall employment is lower than it was at the same time in 2015. Several of the states where the largest share of jobs have disappeared have economies that are heavily dependent on industries susceptible to slowdown during the pandemic, such as tourism and oil extraction. Here is a look at the U.S. industries being devastated by the coronavirus.
It is important to note that the time period states were ranked for GDP growth — the first quarter of 2015 through the first quarter in 2020 — does not account for much of the period since the pandemic was declared a national emergency in mid-March. Still, this measure, in addition to the poverty rate, is indicative of the overall economic health and financial security of state residents going into the pandemic. Here is a look at the place in every state where COVID-19 is growing fastest.
Click here to see the states with the best and worst economies
Click here to read our methodology

1. Utah
> 5 yr. annualized GDP growth rate through Q1 2020: +3.4% (2nd highest)
> 5 yr. annualized employment growth rate through June 2020: +2.4% (the highest)
> June 2020 unemployment rate: 5.1% (2nd lowest)
> Poverty rate: 9.0% (4th lowest)
Utah’s economy ranks as the best of any state. At a time when COVID-19 has sent unemployment soaring into the double digits across much of the country, Utah’s monthly jobless rate stands at 5.1%, less than half the 11.1% national unemployment rate for June.
Even before the coronavirus hit American shores, economic conditions in Utah were far stronger than they were in most of the country. From the first quarter in 2015 through the first quarter in 2020, Utah’s economy grew at an annual rate of 3.4%, compared to the 1.9% national GDP growth rate. Utah is one of only seven states with a poverty rate below 10%.
[in-text-ad]
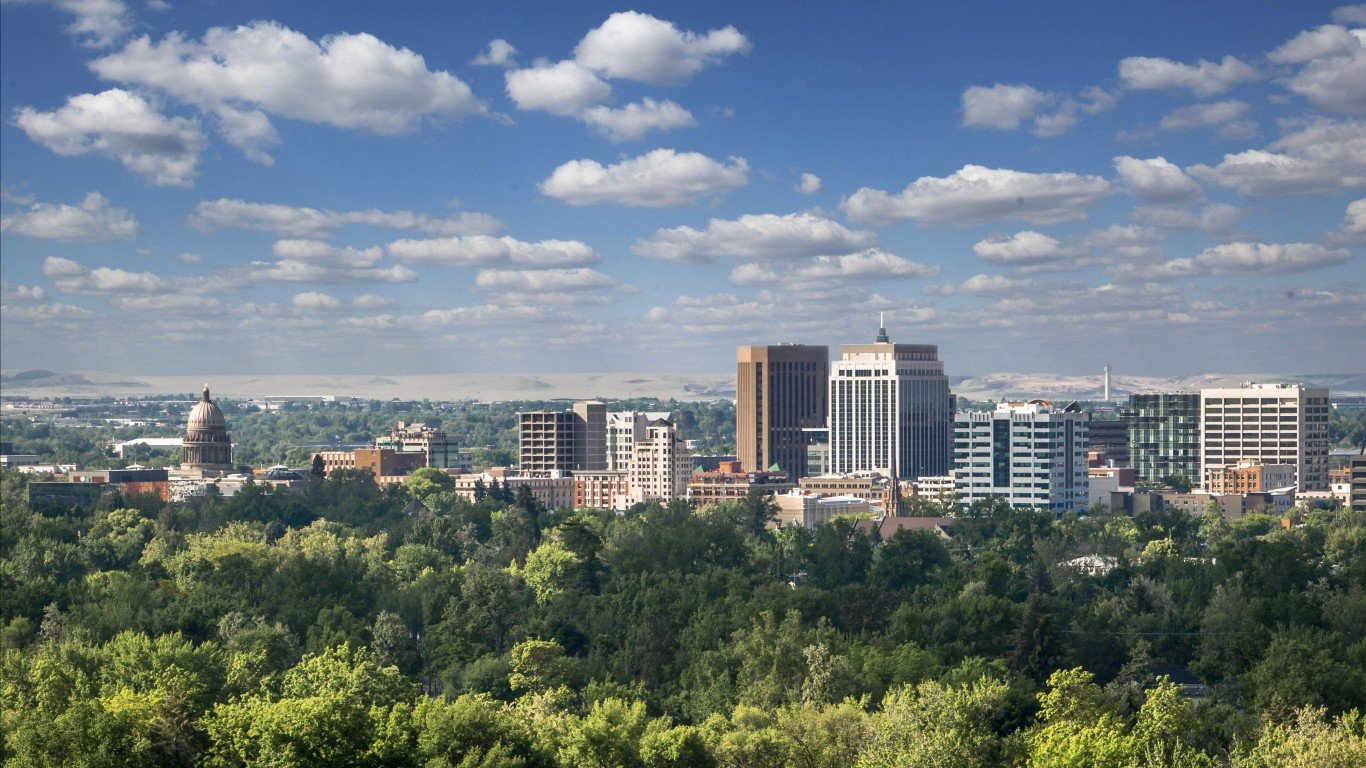
2. Idaho
> 5 yr. annualized GDP growth rate through Q1 2020: +2.8% (9th highest)
> 5 yr. annualized employment growth rate through June 2020: +2.0% (2nd highest)
> June 2020 unemployment rate: 5.6% (3rd lowest)
> Poverty rate: 11.8% (20th lowest)
Like many other states that rank well on this list, Idaho’s job market has, so far, weathered the COVID-19 pandemic relatively well. Only 5.6% of Idaho’s labor force was unemployed in June, the third lowest unemployment rate after only Utah and Kentucky. Unlike the U.S. as a whole, where employment fell by 2.7% from June 2015 to June 2020, Idaho has added jobs in the last five years, with overall employment climbing 10.5%.
Idaho’s job growth has helped fuel economic growth. The state’s GDP has climbed by an annual rate of 2.8% every year since 2015, faster than the vast majority of states. As is the case with many of the best ranking states on this list, Idaho’s population has been booming in recent years. Idaho also has the sixth lowest crime rate of any state.
[recirclink id=730208]

3. Washington
> 5 yr. annualized GDP growth rate through Q1 2020: +3.9% (the highest)
> 5 yr. annualized employment growth rate through June 2020: +1.3% (3rd highest)
> June 2020 unemployment rate: 9.8% (21st highest)
> Poverty rate: 10.3% (9th lowest)
Though it was one of the first states to deal with the COVID pandemic, Washington’s economy has fared better throughout the crisis compared to most states. Even though the state’s unemployment rate was among the highest in the country in June 2018 and 2019, it stood at 9.8% in June 2020, below the nationwide rate of 11.1%. Washington has the fifth lowest share of its labor force in jobs that are at high risk of being lost due to the pandemic, at 15.0%.
Even ahead of the pandemic, Washington’s economy was growing faster than any other state. From 2015’s first quarter through 2020’s first quarter, the state’s GDP expanded by 21.2%, by far the highest increase of any state. This growth was bolstered by the state’s robust information sector, thanks to tech behemoths like Amazon and Microsoft.

4. Colorado
> 5 yr. annualized GDP growth rate through Q1 2020: +2.9% (6th highest)
> 5 yr. annualized employment growth rate through June 2020: +0.9% (5th highest)
> June 2020 unemployment rate: 10.5% (17th highest)
> Poverty rate: 9.6% (7th lowest)
Each of the four states with the best economies is in the West, including Colorado. In most of the country, overall employment has fallen in the last five years. In Colorado, however, employment climbed by an average of 0.9% annually over the same period.
Colorado has also reported stronger than average GDP growth in recent years. Driven in part by rapid growth in the information industry, as well as professional, scientific, and technical services, average annual economic growth in Colorado from Q1 2015 through Q1 2020 was 2.9%, higher than in all but five states. Cities in the state, including Boulder, Colorado Springs, and Denver, have attracted new offices and second headquarters of tech giants like Apple, Facebook, and Netflix in recent years.
[in-text-ad-2]

5. Maryland
> 5 yr. annualized GDP growth rate through Q1 2020: +1.6% (18th highest)
> 5 yr. annualized employment growth rate through June 2020: -0.3% (15th highest)
> June 2020 unemployment rate: 8.0% (18th lowest)
> Poverty rate: 9.0% (4th lowest)
Maryland has the best economy of any state on the East Coast or in the South, and the fifth best economy nationwide. Unlike the other states that rank in the top five on this list, Maryland has fewer people working in it today than it did five years ago. Still, its June unemployment rate of 8.0% is well below the comparable national rate of 11.1%. Additionally, Maryland’s economy has grown at an annual rate of 1.6% since 2015, driven in part by rapid growth in industries like information and mining.
Jobs in Maryland are also more likely to be well paying than those in most of the country. The median annual household income in the state is $83,242, the most of any state and over $20,000 more than the national median. Additionally, only 9.0% of Maryland’s population lives below the poverty line, compared to 13.1% of Americans nationwide.

6. Arizona
> 5 yr. annualized GDP growth rate through Q1 2020: +3.0% (5th highest)
> 5 yr. annualized employment growth rate through June 2020: +1.2% (4th highest)
> June 2020 unemployment rate: 10.0% (20th highest)
> Poverty rate: 14.0% (14th highest)
Only four states have reported faster annual GDP growth since 2015 than Arizona. Over the last half decade, the state’s economy grew at an annualized rate of 3.0%, compared to 1.9% nationwide. Over the same period, information and construction were the state’s fastest-growing industries.
Population growth can help drive GDP growth, and between 2010 and 2019, Arizona’s population grew by 9.3% from migration alone, more than every other state other than Florida and Nevada. Population growth is also likely driving job growth. The number of people working in Arizona climbed by 6.0% from June 2015 to June 2020. Meanwhile, across the U.S. as a whole, employment fell by 2.7% over the same period.
[in-text-ad]

7. Nebraska
> 5 yr. annualized GDP growth rate through Q1 2020: +1.2% (23rd lowest)
> 5 yr. annualized employment growth rate through June 2020: +0.2% (10th highest)
> June 2020 unemployment rate: 6.7% (7th lowest)
> Poverty rate: 11.0% (16th lowest)
Since mid-March, around the time President Donald Trump declared COVID-19 a national emergency, only 17.4% of Nebraska’s labor force filed for unemployment, nearly the smallest share of any state. COVID-19’s relatively small impact on Nebraska’s job market helps explain why the state’s June unemployment rate of 6.7% was lower than that of all but six other states, and well below the 11.1% national jobless rate. Additionally, unlike in most states, there are more people working in Nebraska today than there were five years ago.
While employment growth has been strong and unemployment low in Nebraska, economic growth has been somewhat less impressive. Over the last five years, the state’s GDP grew at an annualized rate of just 1.2%, below the 1.9% annualized national economic growth.
[recirclink id=730179]
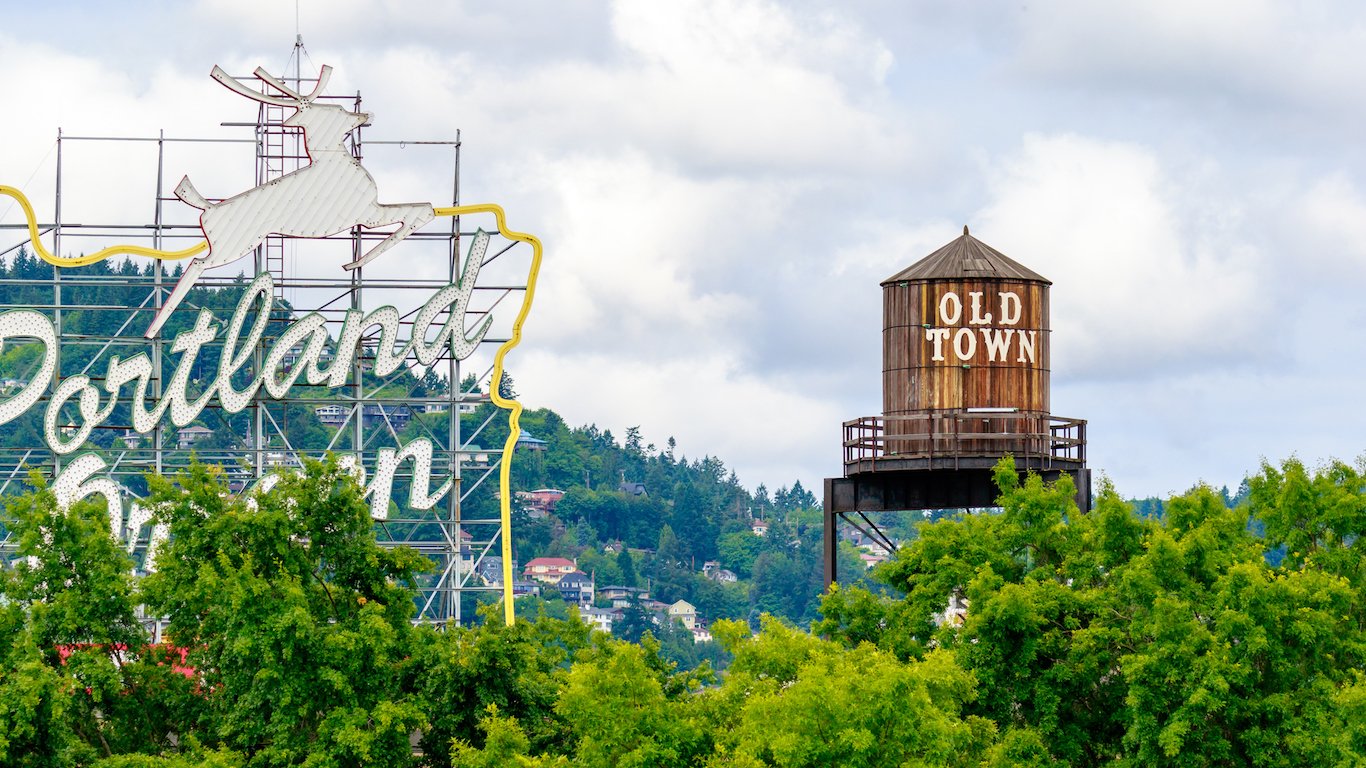
8. Oregon
> 5 yr. annualized GDP growth rate through Q1 2020: +3.2% (3rd highest)
> 5 yr. annualized employment growth rate through June 2020: +0.5% (7th highest)
> June 2020 unemployment rate: 11.2% (14th highest)
> Poverty rate: 12.6% (25th lowest)
Oregon’s GDP increased 17.3% from the first quarter of 2015 to the first quarter of 2020 — the third highest GDP growth rate among all states, well above the 9.8% national GDP growth. Oregon is one of just a dozen states in which there were more people working in June 2020 than there were in June 2015, with nearly 45,000 more people employed. This 2.4% increase is the seventh highest among states. Comparatively, the U.S. had 2.7% fewer people working in June 2020 compared to five years prior.
The GDP increase is likely due in part to the state’s population growth from 2010 to 2019. The state’s population grew by 7.6% in that time from migration alone — more than triple the national rate.

9. Minnesota
> 5 yr. annualized GDP growth rate through Q1 2020: +1.5% (21st highest)
> 5 yr. annualized employment growth rate through June 2020: -0.3% (16th highest)
> June 2020 unemployment rate: 8.6% (23rd lowest)
> Poverty rate: 9.6% (7th lowest)
Minnesota is one of only two states that rank in the top 10 on this list where there are fewer people working today than there were five years ago. Still, job losses have not been as steep as they have been nationwide. Overall employment has fallen by 1.4% in Minnesota from June 2015 through June 2020, compared to a 2.7% decline nationwide. Relatively limited job losses help explain why, at 8.6%, Minnesota’s June unemployment rate is considerably lower than the 11.1% national rate.
Minnesota’s economy also ranks favorably among states due to the relatively small share of residents facing serious financial hardship. Only 9.6% of people in the state live below the poverty line compared to 13.1% of all Americans.
[in-text-ad-2]

10. Georgia
> 5 yr. annualized GDP growth rate through Q1 2020: +2.5% (11th highest)
> 5 yr. annualized employment growth rate through June 2020: +0.3% (8th highest)
> June 2020 unemployment rate: 7.6% (14th lowest)
> Poverty rate: 14.3% (12th highest)
Georgia’s economy ranks as the second best on the East Coast or in the South, and 10th best among all states. Despite having higher than average employment in industries at high risk of slowdown during the pandemic, Georgia’s unemployment rate compares favorably to that of the nation as a whole. As of June, 7.6% of the state’s labor force was out of work, compared to 11.1% of the U.S. labor force. Georgia is one of only a dozen states where there are more people working today than there were five years ago.
While Georgia’s job market is relatively strong, state residents are more likely to live in poverty than most Americans. Georgia has a 14.3% poverty rate, higher than most states and the 13.1% national poverty rate.

11. Maine
> 5 yr. annualized GDP growth rate through Q1 2020: +1.7% (16th highest)
> 5 yr. annualized employment growth rate through June 2020: -0.9% (24th lowest)
> June 2020 unemployment rate: 6.6% (6th lowest)
> Poverty rate: 11.6% (19th lowest)
Maine ranks as having the best economy in New England and 11th best of all states. Despite relatively stagnant population growth in recent years, Maine has reported better economic growth than most states. From the first quarter in 2015 through the first quarter in 2020, Maine’s annualized GDP growth rate was 1.7%. The increase in economic output was driven in part by rapid growth in the state’s mining, quarrying, and gas extraction industry, as well as management and information.
Maine’s job market has also proven relatively resilient during the COVID-19 pandemic. As of June, the state’s unemployment rate stood at 6.6%, lower than all but five other states and the 11.1% national rate.
[in-text-ad]

12. Virginia
> 5 yr. annualized GDP growth rate through Q1 2020: +1.5% (23rd highest)
> 5 yr. annualized employment growth rate through June 2020: -0.4% (18th highest)
> June 2020 unemployment rate: 8.4% (20th lowest)
> Poverty rate: 10.7% (12th lowest)
As is the case in most states, there are fewer people working in Virginia now than there were five years ago. Still, the 1.8% overall decline in employment in the state from June 2015 to June 2020 is less severe than the comparable 2.7% decline nationwide. For those who are working in the state, incomes are slightly higher than average. Per capita personal income in Virginia is $57,910 per year, compared to the national figure of $54,526.
The higher incomes in the state may explain why residents are less likely to live in poverty than most Americans. Virginia’s poverty rate of 10.7% is below the 13.1% national poverty rate.
[recirclink id=730289]

13. South Carolina
> 5 yr. annualized GDP growth rate through Q1 2020: +2.6% (10th highest)
> 5 yr. annualized employment growth rate through June 2020: +0.8% (6th highest)
> June 2020 unemployment rate: 8.7% (25th lowest)
> Poverty rate: 15.3% (9th highest)
As is the case in much of the South, incomes are generally low in South Carolina. Per capita income in the state is just $43,702 a year, about $11,000 less than the national average. Additionally, the state’s 15.3% poverty rate is well above the 13.1% national rate.
Still, South Carolina’s economy has grown relatively rapidly in recent years. Over the last half decade, South Carolina’s GDP grew by 13.6% — more than most states and well above the 9.8% economic growth nationwide.

14. Kansas
> 5 yr. annualized GDP growth rate through Q1 2020: +1.6% (17th highest)
> 5 yr. annualized employment growth rate through June 2020: -0.8% (25th highest)
> June 2020 unemployment rate: 7.5% (11th lowest)
> Poverty rate: 12.0% (21st lowest)
Largely due to COVID-19, there were fewer people working in Kansas in June 2020 than there were five years prior. Still, the state’s job market appears to have weathered the pandemic better than most, so far. As of June, the state’s unemployment rate stood at 7.5%, lower than most other states’ jobless rates and the 11.1% national rate.
The stronger job market may partially explain why people in Kansas are less likely to live in poverty than the typical American. Kansas’s poverty rate of 12.0% is slightly lower than the 13.1% national rate.
[in-text-ad-2]

15. Texas
> 5 yr. annualized GDP growth rate through Q1 2020: +2.4% (12th highest)
> 5 yr. annualized employment growth rate through June 2020: +0.2% (9th highest)
> June 2020 unemployment rate: 8.6% (23rd lowest)
> Poverty rate: 14.9% (11th highest)
The GDP of Texas grew at an annualized rate of 2.4% over the past five years, as compared to the 1.9% nationwide rate. This was driven in part by the state’s rapidly expanding population. The state’s population grew by 15.3% from 2010 through 2019. Though Texas is the leading oil and gas producer in the nation, the state’s management, utilities, and information sectors grew rapidly over the past five years, stimulating the state’s economy.
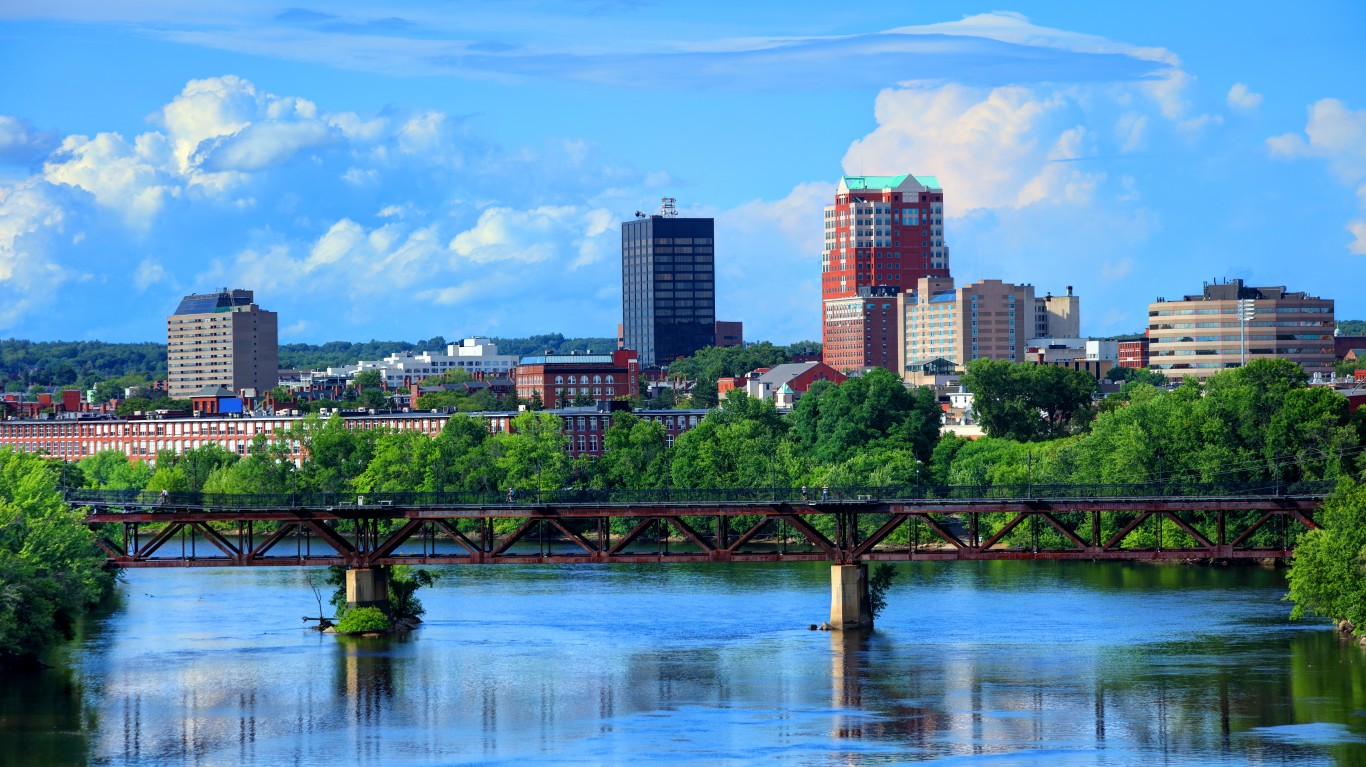
16. New Hampshire
> 5 yr. annualized GDP growth rate through Q1 2020: +2.0% (14th highest)
> 5 yr. annualized employment growth rate through June 2020: -1.8% (9th lowest)
> June 2020 unemployment rate: 11.8% (13th highest)
> Poverty rate: 7.6% (the lowest)
New Hampshire is one of 14 states in which GDP expanded by an average of at least 2.0% annually over the past five years. New Hampshire residents have been among the least likely to struggle financially. The state has the lowest poverty rate of any state at 7.6%, about half of the U.S. poverty rate. Personal income per capita in the state is $61,429, well above the U.S. income of $54,526.
Still, New Hampshire has been hit relatively hard by the pandemic. The state’s employment declined by 12.9% from June 2019 to June 2020, as compared to a 8.6% nationwide decline. New Hampshire had the third lowest unemployment rate in June 2019, at 2.5%. By June 2020, it had the 13th highest, at 11.8%.
[in-text-ad]

17. Montana
> 5 yr. annualized GDP growth rate through Q1 2020: +0.9% (12th lowest)
> 5 yr. annualized employment growth rate through June 2020: +0.1% (11th highest)
> June 2020 unemployment rate: 7.1% (8th lowest)
> Poverty rate: 13.0% (22nd highest)
Economic growth has been relatively slow in Montana in recent years. From the first quarter of 2015 through Q1 2020, Montana’s GDP grew by only 4.4%, or at an annualized rate of 0.9% per year, compared to 9.8% five-year growth and 1.9% annualized growth nationwide. In the state, the arts, entertainment, and recreation industry contracted the most, followed by manufacturing and agriculture.
Despite sluggish economic growth, employment has not declined as much in Montana compared to most states. Largely due to the novel coronavirus, in most of the country, there are fewer people working now than there were half a decade ago. In Montana, one of only 12 states with positive job growth, employment has climbed 0.4% since June 2015.
[recirclink id=729976]

18. South Dakota
> 5 yr. annualized GDP growth rate through Q1 2020: +1.0% (17th lowest)
> 5 yr. annualized employment growth rate through June 2020: -0.1% (13th highest)
> June 2020 unemployment rate: 7.2% (9th lowest)
> Poverty rate: 13.1% (20th highest)
Due in large part to COVID-19, there were fewer people working in South Dakota in June 2020 than the same time in 2019. Still, the state’s employment decline of 3.1% was one of the smallest such declines of any state over that period. For context, employment fell 8.6% nationwide over that period.
Additionally, despite the slight decline in five-year employment, South Dakota’s job market is healthier than that of most states. As of June, unemployment stood at 7.2% in South Dakota, well below the 11.1% national jobless rate.

19. Florida
> 5 yr. annualized GDP growth rate through Q1 2020: +2.8% (7th highest)
> 5 yr. annualized employment growth rate through June 2020: -0.7% (23rd highest)
> June 2020 unemployment rate: 10.4% (18th highest)
> Poverty rate: 13.6% (17th highest)
Florida’s economy relies heavily on tourism, an industry hit hard by the COVID-19 pandemic. Partially as a result, there are over 1 million fewer people working in the state now than there were at the same time last year. The state’s June unemployment rate of 10.4% is also higher than that of most other states.
Despite the number of jobs that have disappeared in Florida, the state has reported relatively strong economic growth in recent years. Since 2015, Florida’s GDP climbed 15.0%, faster than all but half a dozen states and the comparable 9.8% national GDP growth.
[in-text-ad-2]

20. North Carolina
> 5 yr. annualized GDP growth rate through Q1 2020: +1.6% (19th highest)
> 5 yr. annualized employment growth rate through June 2020: -0.3% (17th highest)
> June 2020 unemployment rate: 7.6% (14th lowest)
> Poverty rate: 14.0% (14th highest)
North Carolina’s real GDP grew at an average of 1.6% per year from 2015 to 2020, a higher growth rate than 31 other states. This increase was largely driven by expansion in the professional, scientific, and technical service sector, which grew at an average of 6.2% annually from 2015 to 2020.
North Carolina’s labor force has been much less dramatically affected by the COVID-19 pandemic than most other states. The state’s unemployment rate increased by just 1.7 percentage points, compared to the 5.8 percentage point increase nationwide. North Carolina’s unemployment rate of 7.6% is well below the 11.1% U.S. rate.
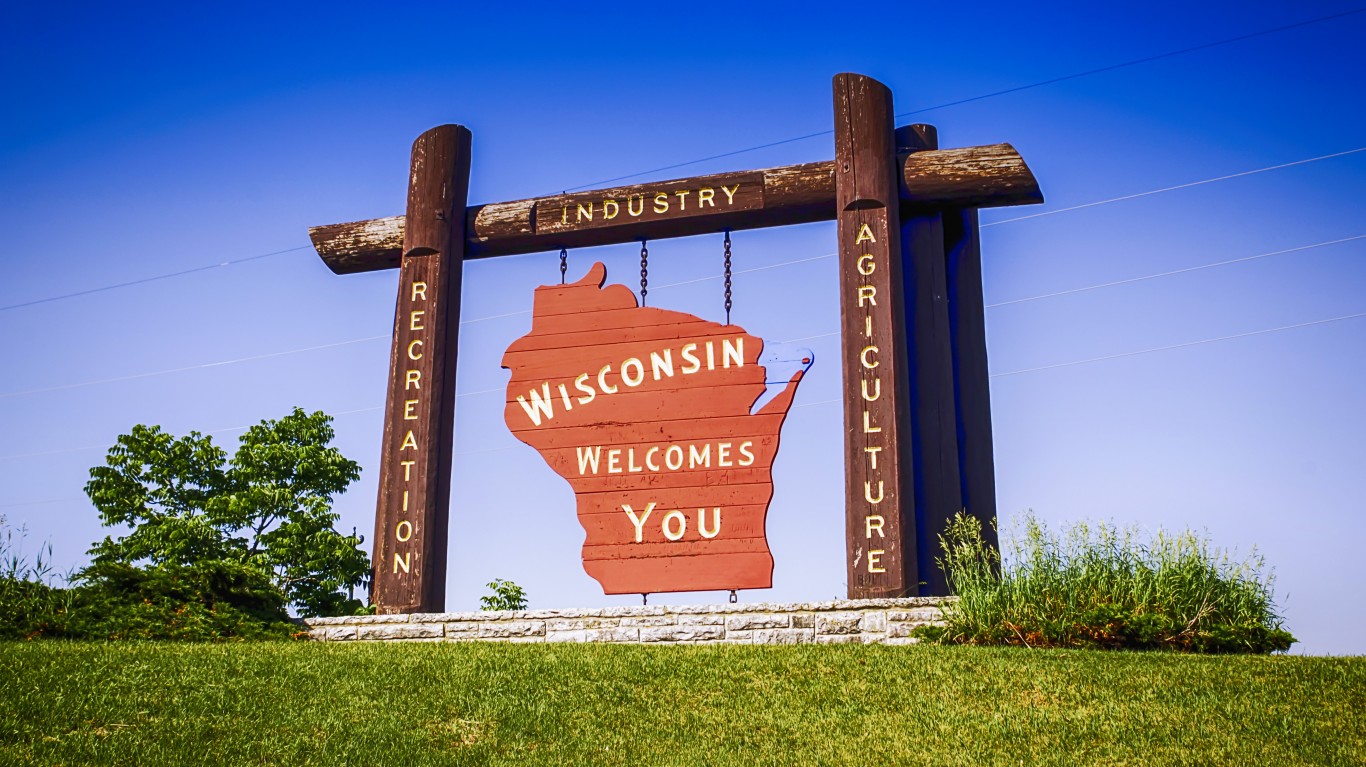
21. Wisconsin
> 5 yr. annualized GDP growth rate through Q1 2020: +1.2% (24th lowest)
> 5 yr. annualized employment growth rate through June 2020: -1.0% (21st lowest)
> June 2020 unemployment rate: 8.5% (21st lowest)
> Poverty rate: 11.0% (16th lowest)
Due in large part to COVID-19, there are about 200,000 fewer people working in Wisconsin now than there were a year ago. Still, unemployment is lower than average in the state. As of June 2020, 8.5% of the labor force in Wisconsin was unemployed, well below the national unemployment rate of 11.1%.
While Wisconsin’s job market is healthier than most states’ amid the pandemic, the state’s economic growth has been relatively slow in recent years. From the beginning of 2015 through the first quarter of 2020, Wisconsin’s GDP climbed by just 6.4%, slower than the 9.8% national growth during that time. Economic expansion in the state was hampered by declining output in several industries, including accommodation and food services and finance and insurance.
[in-text-ad]

22. Kentucky
> 5 yr. annualized GDP growth rate through Q1 2020: +0.9% (13th lowest)
> 5 yr. annualized employment growth rate through June 2020: -0.4% (19th highest)
> June 2020 unemployment rate: 4.3% (the lowest)
> Poverty rate: 16.9% (6th highest)
Kentucky’s June 2020 unemployment rate of 4.3% is the lowest of all states. Yet the nation-lowest unemployment rate does not tell the whole story, as Kentucky is one of three states in which more than half of the state’s labor force filed for unemployment benefits since March 15, at 56%. One reason for the low jobless rate is that many unemployed workers stopped looking for a job, according to Kentucky’s Center for Business and Economic Research.
Still, Kentucky’s job market has recovered somewhat recently, with employment increasing in all nonfarm sectors in June
[recirclink id=729914]

23. Vermont
> 5 yr. annualized GDP growth rate through Q1 2020: +1.1% (19th lowest)
> 5 yr. annualized employment growth rate through June 2020: -1.4% (14th lowest)
> June 2020 unemployment rate: 9.4% (25th highest)
> Poverty rate: 11.0% (16th lowest)
Vermont’s GDP grew at an average of 1.1% annually from 2015 to 2020, well below the 1.9% annualized growth rate nationwide. Economic expansion was likely hampered by low population growth during that time. Vermont had the third lowest population increase due to natural change, at 0.3%, and there were more people who moved out of Vermont than moved to it during those years.
Vermont’s median household income of $60,782 is roughly $1,000 lower than that of the U.S. as a whole. Though Vermont had among the lowest unemployment rates in the years before the COVID-19 pandemic, a much higher share of the state’s workforce is now unemployed, at 9.4%, the 25th highest unemployment rate.

24. Tennessee
> 5 yr. annualized GDP growth rate through Q1 2020: +2.0% (15th highest)
> 5 yr. annualized employment growth rate through June 2020: -0.1% (14th highest)
> June 2020 unemployment rate: 9.7% (23rd highest)
> Poverty rate: 15.3% (9th highest)
Economic growth has been strong in Tennessee over the last half decade. The state’s GDP increased by 10.3% since 2015, or an average of 2.0% annually. Only 14 states reported faster economic growth.
Despite the robust economic growth, poverty in Tennessee remains high. The state’s poverty rate of 15.3% is one of the highest in the country. For comparison, the national poverty rate stands at 13.1%.
[in-text-ad-2]

25. Missouri
> 5 yr. annualized GDP growth rate through Q1 2020: +0.9% (15th lowest)
> 5 yr. annualized employment growth rate through June 2020: -1.0% (23rd lowest)
> June 2020 unemployment rate: 7.9% (15th lowest)
> Poverty rate: 13.2% (19th highest)
From the start of 2015 through 2020’s first quarter, Missouri’s real GDP increased by an average of 0.9% per year, about half of the annual average increase nationwide. Pre-pandemic, Missouri’s median household income of $54,478 was about $7,500 below the U.S. median and it had one of the higher poverty rates among states.
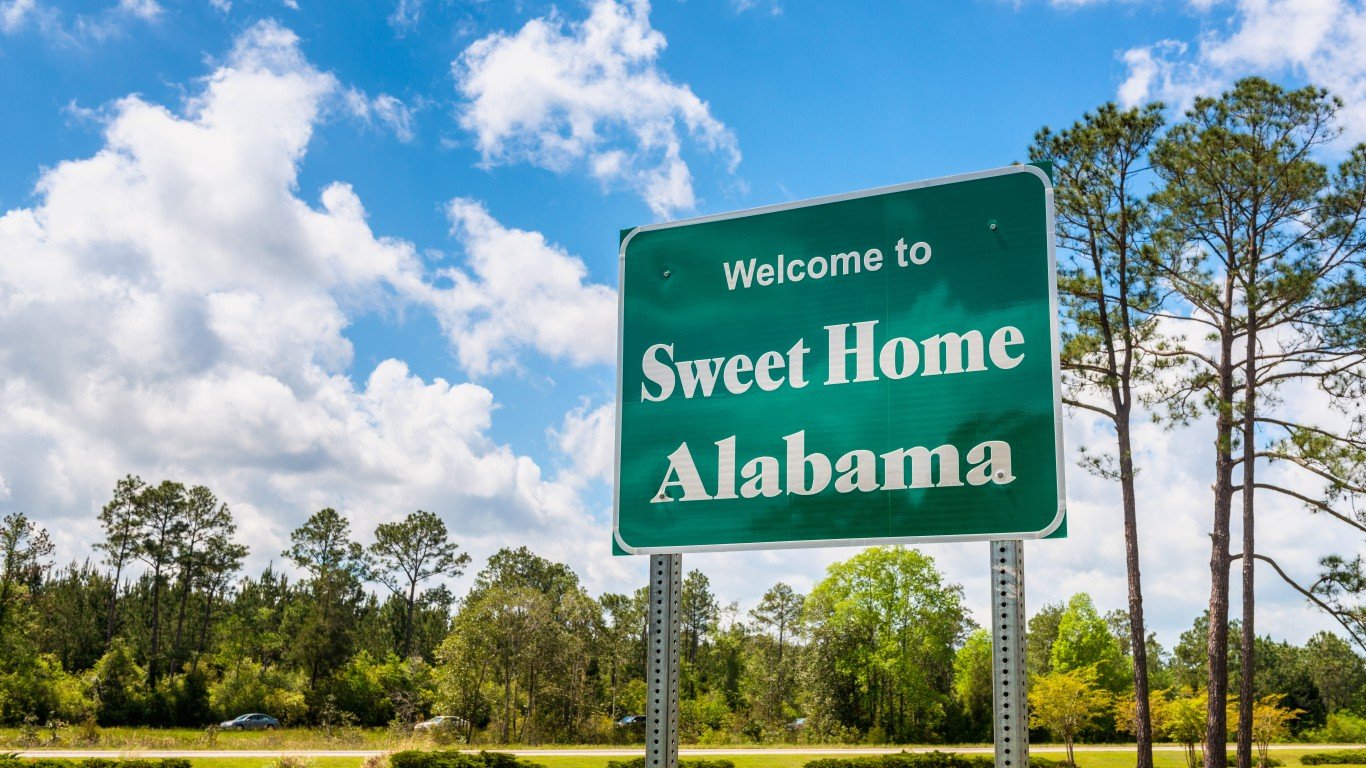
26. Alabama
> 5 yr. annualized GDP growth rate through Q1 2020: +1.5% (22nd highest)
> 5 yr. annualized employment growth rate through June 2020: +0.0% (12th highest)
> June 2020 unemployment rate: 7.5% (11th lowest)
> Poverty rate: 16.8% (7th highest)
Alabama is one of only 12 states where employment has not declined in the last five years. Still, due in large part to COVID-19, there are about 142,000 fewer people working in the state now than there were in June 2019. Despite those job losses, Alabama’s 7.5% unemployment rate is lower than in the vast majority of states and well below the 11.1% national rate.
While Alabama’s labor force are more likely to be employed than the typical American worker, many jobs in the state are not well paying. Per capita income in Alabama is just $42,240 per year, well below the comparable national figure of $54,526. The lower incomes in Alabama likely contribute to the state’s higher poverty rate. A staggering 16.8% of Alabama residents live on poverty level incomes, a larger share than in all but six other states.
[in-text-ad]

27. Iowa
> 5 yr. annualized GDP growth rate through Q1 2020: +0.5% (9th lowest)
> 5 yr. annualized employment growth rate through June 2020: -1.6% (13th lowest)
> June 2020 unemployment rate: 8.0% (18th lowest)
> Poverty rate: 11.2% (18th lowest)
June employment in Iowa hit a five year high in 2019, when there were nearly 1.7 million people working in the state. Due in large part to COVID-19, there were only 1.5 million people working in the state as of June 2020, a 10.7% decline from last year and a 7.6% decline from five years ago.
With falling employment, economic growth has also been sluggish in Iowa. Since 2015, Iowa’s GDP increased by only 2.7% for an annualized rate of just 0.5%. Meanwhile, the U.S. economy expanded by 9.8% for an annualized rate of 1.9%.
[recirclink id=730208]

28. Connecticut
> 5 yr. annualized GDP growth rate through Q1 2020: +0.4% (7th lowest)
> 5 yr. annualized employment growth rate through June 2020: -1.1% (20th lowest)
> June 2020 unemployment rate: 9.8% (21st highest)
> Poverty rate: 10.4% (10th lowest)
Over the last five years, economic growth has been slower in Connecticut than in all but half a dozen other states. Connecticut’s GDP increased by only 2.0% since 2015, for an annualized rate of just 0.4%. Meanwhile, the U.S. economy expanded by 9.8% for an annualized rate of 1.9%. One explanation for the sluggish economic growth is slow population growth. About 64,000 more people left Connecticut between 2010 and 2019 than moved in.
Several industries were a drag on the Connecticut economy in the last five years. Arts and entertainment contracted at an annualized rate of 1.7%, and the output of the state’s wholesale trade trade industry fell by an average of 1.3% per year.

29. Nevada
> 5 yr. annualized GDP growth rate through Q1 2020: +2.8% (8th highest)
> 5 yr. annualized employment growth rate through June 2020: -0.6% (20th highest)
> June 2020 unemployment rate: 15.0% (4th highest)
> Poverty rate: 12.9% (23rd highest)
Before the pandemic, Nevada had one of the fastest growing economies in the country. The state’s GDP grew at an annualized rate of 2.8% over the last five years. This was likely related to the high net migration in the state. Nevada’s population grew by 9.5% from net migration over the last decade, the second highest such growth of any state.
Nevada has been one of the most severely affected by COVID-19 due to its large tourism industry. Prior to the pandemic over a third of workers were in jobs that were at a high risk of being lost amid the pandemic, nearly double the national rate. More than 40% of the Nevada labor force filed for unemployment since mid-March, and the state now has the fourth-highest unemployment rate in the nation.
[in-text-ad-2]

30. North Dakota
> 5 yr. annualized GDP growth rate through Q1 2020: -1.2% (the lowest)
> 5 yr. annualized employment growth rate through June 2020: -1.4% (15th lowest)
> June 2020 unemployment rate: 6.1% (4th lowest)
> Poverty rate: 10.7% (12th lowest)
No state economy contracted more than North Dakota’s over the past five years. While the U.S. GDP grew at an annualized rate of 1.9% from 2015 to 2020, North Dakota’s economy shrank at an annualized rate of 1.2% each year.
Still, members of the North Dakota labor force are more likely to have a job than those in almost any other state. The state has consistently had one of the lowest unemployment rates over the past five years, and even in June of 2020, after the pandemic hit, North Dakota’s 6.1% unemployment rate was lower than all but three other states.

31. Wyoming
> 5 yr. annualized GDP growth rate through Q1 2020: -0.6% (3rd lowest)
> 5 yr. annualized employment growth rate through June 2020: -1.2% (17th lowest)
> June 2020 unemployment rate: 7.6% (14th lowest)
> Poverty rate: 11.1% (17th lowest)
Wyoming is one of only four states with an economy that contracted over the five years since the first quarter in 2015. Over that period, Wyoming’s GDP contracted by 2.8%, for an annualized rate of -0.6%. Meanwhile, the U.S. economy expanded by 9.8% for an annualized rate of 1.9%.
GDP growth can be driven in part by population growth, and between 2010 and 2019, about 10,000 more people left Wyoming than moved in. Several industries have also contracted substantially in the state in recent years. Wholesale trade contracted at an annualized rate of 3.7% from 2015 to 2020. Over the same period, the economic output of the state’s construction industry fell by 3.6% per year on average, and finance and insurance reported a 3.0% annualized decline.
[in-text-ad]

32. Indiana
> 5 yr. annualized GDP growth rate through Q1 2020: +1.1% (22nd lowest)
> 5 yr. annualized employment growth rate through June 2020: -0.6% (21st highest)
> June 2020 unemployment rate: 11.2% (14th highest)
> Poverty rate: 13.1% (20th highest)
Largely due to COVID-19, there were about 250,000 fewer people working in Indiana in June than there were the same month in 2019. The rapid employment decline drove the state’s jobless rate up to 11.2% from just 3.3% the previous year. Nationwide, the comparable June unemployment rate was 11.1%.
Economic growth in Indiana has also been relatively sluggish. The state’s GDP grew at an annual rate of just 1.1% over the five years ending in the first quarter of 2020. Meanwhile, the U.S. economy expanded at an annualized rate of 1.9%. Over the same period, several industries, including arts and entertainment, as well as mining, quarrying, and oil extraction, contracted, presenting a drag on Indiana’s economic growth.
[recirclink id=730179]

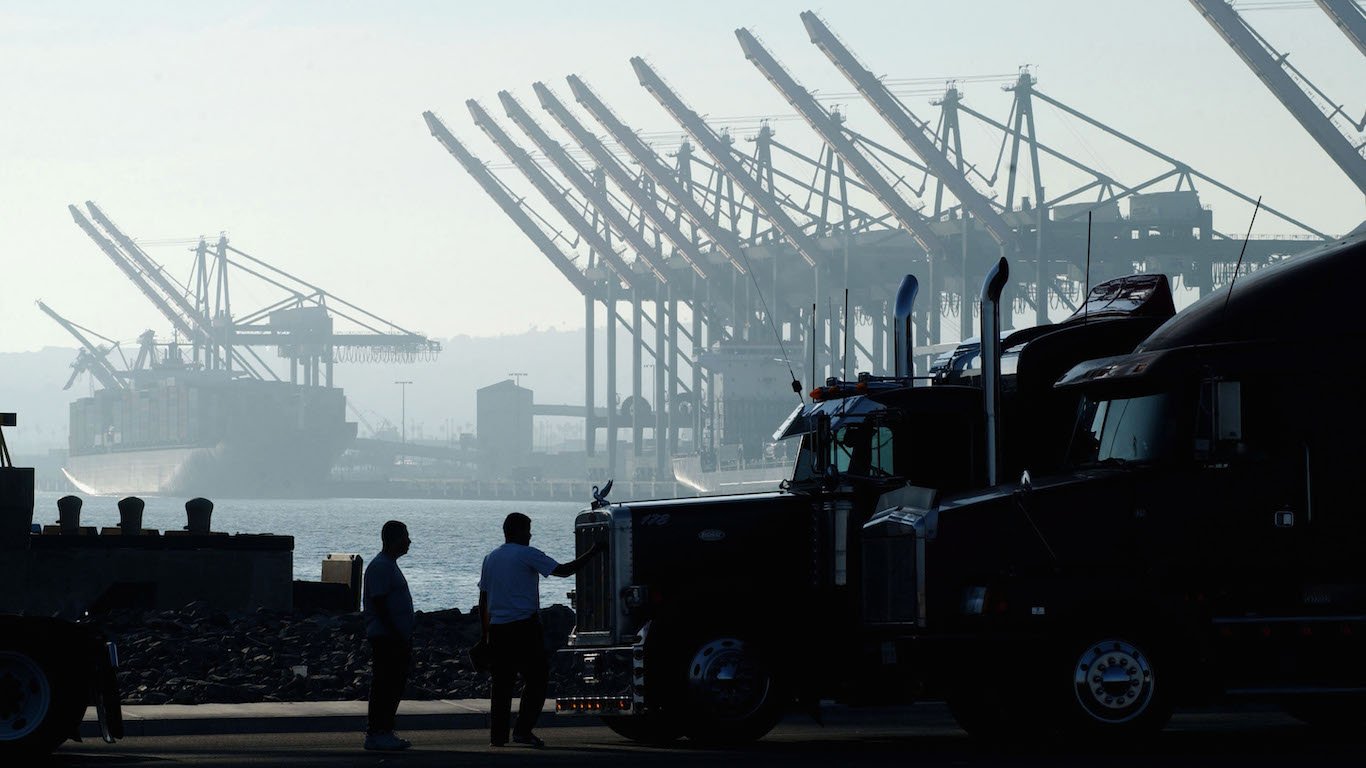
33. California
> 5 yr. annualized GDP growth rate through Q1 2020: +3.0% (4th highest)
> 5 yr. annualized employment growth rate through June 2020: -1.8% (10th lowest)
> June 2020 unemployment rate: 14.9% (5th highest)
> Poverty rate: 12.8% (25th highest)
California has consistently had one of the highest unemployment rates in the country in recent years. The COVID-19 pandemic has only made matters worse, as the equivalent of 38.3% of the state’s labor force has filed for unemployment since March 15. The state now has the fifth highest unemployment rate at 14.9%.
Yet California, with its nation’s largest labor force of 19.4 million people, has by the highest GDP of any state, at nearly $2.8 trillion in the first quarter of 2020. It has also been one of the fastest growing, expanding at an annualized rate of 3.0% from 2015 to 2020, the fourth highest GDP growth rate of any state.

34. Oklahoma
> 5 yr. annualized GDP growth rate through Q1 2020: +0.4% (6th lowest)
> 5 yr. annualized employment growth rate through June 2020: -1.2% (19th lowest)
> June 2020 unemployment rate: 6.6% (6th lowest)
> Poverty rate: 15.6% (8th highest)
Though Oklahoma’s June unemployment rate of 6.6% is lower than it is in most of the country, the state lags behind most other states in several other key economic measures.
Since 2015, Oklahoma’s GDP increased by only 1.8%, for an annualized rate of just 0.4%. Meanwhile, the U.S. economy expanded by 9.8% for an annualized rate of 1.9%. Additionally, the state’s relatively strong job market does not appear to be doing enough to ensure financial security for many in the state. Per capita annual income in Oklahoma is just $46,267, well below the $54,526 national average. Similarly, 15.6% of state residents live on poverty level incomes, compared to 13.1% of Americans nationwide.
[in-text-ad-2]

35. Ohio
> 5 yr. annualized GDP growth rate through Q1 2020: +1.1% (21st lowest)
> 5 yr. annualized employment growth rate through June 2020: -1.0% (22nd lowest)
> June 2020 unemployment rate: 10.9% (16th highest)
> Poverty rate: 13.9% (16th highest)
Due largely to COVID-19, Ohio’s June unemployment rate of 10.9% is more than double what it was a year prior, at 4.1%. Over that period, the state shed nearly 400,000 jobs — the first time in at least half a decade that employment fell year-over-year in the month of June in the state. The decline more than erased all the job gains in the state since June 2015.
Economic growth has also been sluggish in Ohio. Since 2015, Ohio’s GDP increased by only 5.6% for an annualized rate of just 1.1%. Over the same period, the U.S. economy expanded by 9.8% for an annualized rate of 1.9%. The industries that have shrunk the most over the last five years in the state include accommodation and food services and finance and insurance.

36. Arkansas
> 5 yr. annualized GDP growth rate through Q1 2020: +1.1% (20th lowest)
> 5 yr. annualized employment growth rate through June 2020: -0.9% (25th lowest)
> June 2020 unemployment rate: 8.0% (18th lowest)
> Poverty rate: 17.2% (5th highest)
The economy of Arkansas ranks as one of the worst among all states in large part because of its poverty rate. Some 17.2% of state residents live below the poverty line. Arkansas also has the third lowest median household income at just over $47,000, nearly $15,000 below the U.S. median.
The GDP of Arkansas increased at an annual rate of 1.1% over the past five years, well below the 1.9% annualized increase of the U.S. overall. Still, the state’s unemployment rate has consistently been below the U.S. rate, and that has continued throughout 2020. Just 8.0% of the Arkansas labor force is out of work, compared to the 11.1% U.S. unemployment rate.
[in-text-ad]

37. Pennsylvania
> 5 yr. annualized GDP growth rate through Q1 2020: +1.3% (25th highest)
> 5 yr. annualized employment growth rate through June 2020: -1.9% (8th lowest)
> June 2020 unemployment rate: 13.0% (9th highest)
> Poverty rate: 12.2% (23rd lowest)
At 13.0%, Pennsylvania has the ninth highest unemployment rate of any state. The state’s jobless rate climbed 7.7 percentage points over the last five years, the 10th largest increase of any state.
Pennsylvania’s economy has not expanded as quickly as the U.S. economy overall. The state’s GDP grew at an annualized rate of 1.3% from 2015 to 2020, well behind the U.S. rate of 1.9% over the same period.
[recirclink id=730289]
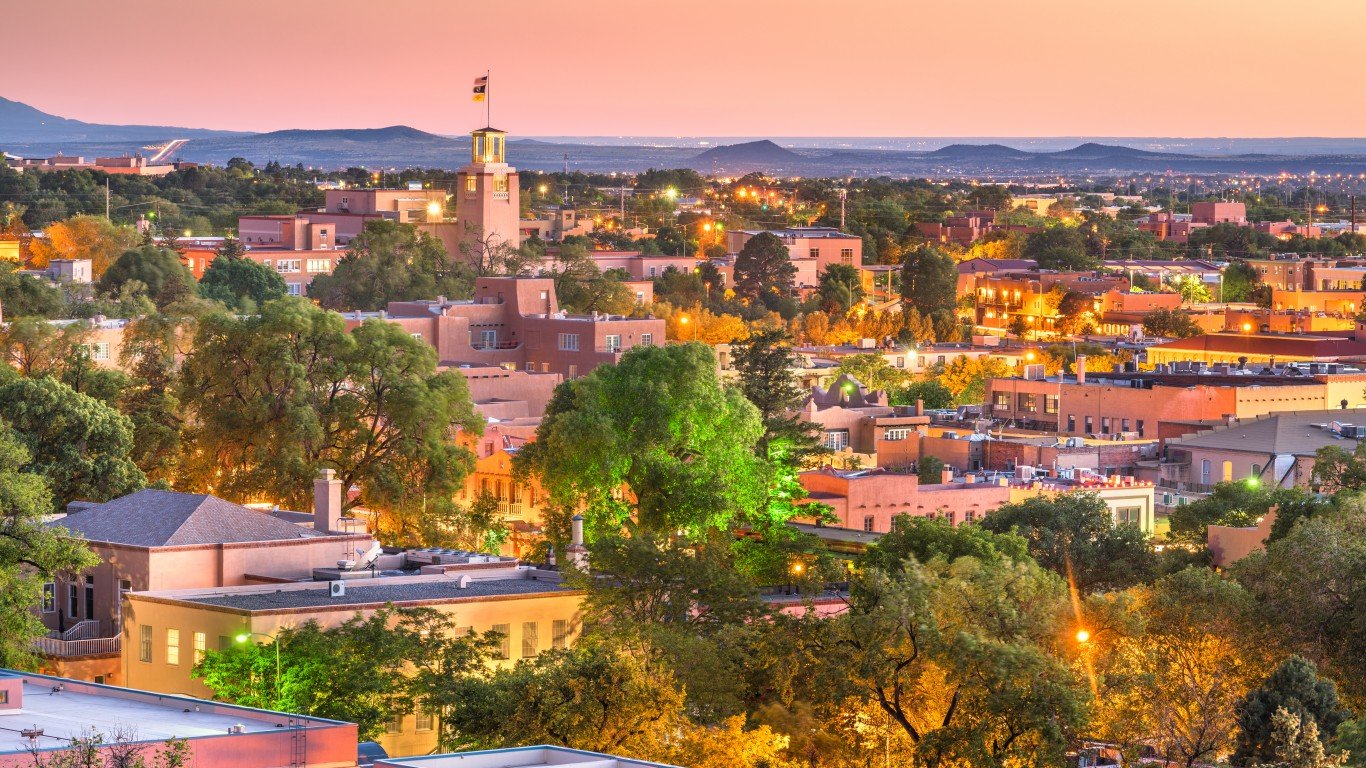
38. New Mexico
> 5 yr. annualized GDP growth rate through Q1 2020: +1.3% (25th lowest)
> 5 yr. annualized employment growth rate through June 2020: -0.7% (22nd highest)
> June 2020 unemployment rate: 8.3% (19th lowest)
> Poverty rate: 19.5% (2nd highest)
New Mexico’s unemployment rate of 8.3% is lower than in most states and well below the 11.1% national jobless rate. Still, despite a relatively current strong job market, New Mexico is one of the poorest states in the country. About one in every five New Mexico residents live below the poverty line, the second highest poverty rate of any state.
Economic growth has also been slow in recent years. Between the first quarter of 2015 and the first quarter of 2020, New Mexico’s economy grew by just 6.5%. Over the same period, the U.S. economy grew by 9.8%.

39. Massachusetts
> 5 yr. annualized GDP growth rate through Q1 2020: +2.0% (13th highest)
> 5 yr. annualized employment growth rate through June 2020: -2.3% (4th lowest)
> June 2020 unemployment rate: 17.4% (the highest)
> Poverty rate: 10.0% (8th lowest)
By several measures, Massachusetts’s economy is in better shape than that of most states. GDP growth has been relatively strong in the state in recent years, and residents are far less likely to live below the poverty line than most Americans. However, the coronavirus has recently devastated the job market in the state.
As of June, a staggering 17.4% of the labor force in Massachusetts was out of work, the highest unemployment rate of any state in the country. The same month, the U.S. jobless rate stood at 11.1%. In June 2019, the Massachusetts unemployment rate was just 2.9%. Over the year since, the state has shed more than 662,000 jobs.
[in-text-ad-2]

40. Hawaii
> 5 yr. annualized GDP growth rate through Q1 2020: +1.5% (20th highest)
> 5 yr. annualized employment growth rate through June 2020: -4.1% (the lowest)
> June 2020 unemployment rate: 13.9% (8th highest)
> Poverty rate: 8.8% (2nd lowest)
No state has lost more jobs since 2015 than Hawaii. The total number of employed state residents decreased at an annual rate of 4.1% each of the last five years. While the pandemic took a toll on the tourism-dependent state, employment has fallen each June since 2017. Hawaii’s June 2020 unemployment rate of 13.9% is higher than all but seven other states.
Despite steady job losses, Hawaii’s GDP grew at an annualized rate of 1.5% from 2015 to 2020, a higher growth rate than most states, but still slower than the annualized U.S. GDP growth of 1.9%. Hawaii’s poverty rate of 8.8% was the second lowest of all states.

41. Rhode Island
> 5 yr. annualized GDP growth rate through Q1 2020: +0.7% (10th lowest)
> 5 yr. annualized employment growth rate through June 2020: -1.6% (12th lowest)
> June 2020 unemployment rate: 12.4% (11th highest)
> Poverty rate: 12.9% (23rd highest)
Rhode Island’s economy ranks as the worst in the New England region and 10th worst nationwide. As is the case in neighboring Massachusetts, Rhode Island’s job market has been devastated by COVID-19. The state’s June unemployment rate of 12.4% is more than triple what it was a year prior, at 3.6%. Over that period, the state shed over 53,000 jobs — the first time in the state in at least half a decade employment fell year-over-year in the month of June. The decline more than erased all the job gains in the state since June 2015.
Even before the pandemic, economic growth in Rhode Island has been slow. The state’s economy grew by only 3.4% between Q1 2015 and Q1 2020. Over the same period, the U.S. economy grew by 9.8%.
[in-text-ad]

42. New Jersey
> 5 yr. annualized GDP growth rate through Q1 2020: +0.9% (14th lowest)
> 5 yr. annualized employment growth rate through June 2020: -2.2% (6th lowest)
> June 2020 unemployment rate: 16.6% (2nd highest)
> Poverty rate: 9.5% (5th lowest)
Like many other states in the Northeast — a region hit hard by COVID-19, with cases surging in the earlier weeks and months of the pandemic — New Jersey is now struggling with a severe unemployment problem. As of June, the state’s 16.6% jobless rate was second highest in the country, trailing only Massachusetts. There are nearly 550,000 fewer people working in New Jersey now than there were at the same time last year.
GDP growth has also been relatively slow in New Jersey in recent years. Over the five years since the first quarter of 2015, the state’s economy expanded by just 4.7%, less than half the comparable 9.8% national growth.
[recirclink id=729976]

43. Michigan
> 5 yr. annualized GDP growth rate through Q1 2020: +1.4% (24th highest)
> 5 yr. annualized employment growth rate through June 2020: -1.3% (16th lowest)
> June 2020 unemployment rate: 14.8% (6th highest)
> Poverty rate: 14.1% (13th highest)
Michigan added tens of thousands of jobs each year from 2015 to 2019. But the pandemic has severely impacted employment in the state — the equivalent of 36.5% of the labor force has filed for unemployment since mid-March. The June 2020 unemployment rate of 14.8% was higher than all but five other states and well above the U.S. unemployment rate of 11.1% for that month.
Though Michigan’s GDP increased at an annual rate of 1.4% since 2015, this growth was likely hampered by people moving out of the state. From 2010 to 2019, over 73,000 more people moved out of Michigan than moved to it, equivalent to 0.7% of the 2010 population.

44. Alaska
> 5 yr. annualized GDP growth rate through Q1 2020: +0.0% (4th lowest)
> 5 yr. annualized employment growth rate through June 2020: -2.4% (3rd lowest)
> June 2020 unemployment rate: 12.4% (11th highest)
> Poverty rate: 10.9% (13th lowest)
Alaska is one of just three states in which the equivalent of over half of the labor force has filed for unemployment since March 15. The state’s job market has long been in decline, contracting each year since 2015 for an annualized employment decline of 2.4% over the past five years.
Alaska had the highest monthly unemployment rate every June from 2016 to 2019, at over 6% each year. Though in June 2020 the state’s unemployment rate doubled from the previous year’s rate to 12.4%, it no longer ranked the highest but 11th among states. Alaska is one of just four states in which the GDP actually shrank from 2015 to 2020. Alaska also has the second highest crime rate in America.
[in-text-ad-2]

45. Illinois
> 5 yr. annualized GDP growth rate through Q1 2020: +1.0% (16th lowest)
> 5 yr. annualized employment growth rate through June 2020: -2.0% (7th lowest)
> June 2020 unemployment rate: 14.6% (7th highest)
> Poverty rate: 12.1% (22nd lowest)
Only six states have a higher unemployment rate than Illinois, where 14.6% of the labor force is out of a job. Between June 2015 and June 2019, Illinois added some 66,000 jobs. Between June 2019 and June 2020, however, a period in which COVID-19 took a toll on the state’s job market, Illinois shed a staggering 645,000 jobs.
The coronavirus is only the latest struggle in a state where economic conditions have already been weak. For example, over the five years ending with the first quarter of 2020, Illinois’ economy grew by 4.9% — half the growth rate of the U.S. economy over the same period. Population growth can trigger economic growth, but there were nearly 160,000 fewer people living in Illinois in 2019 than there were in 2010.

46. Delaware
> 5 yr. annualized GDP growth rate through Q1 2020: -1.0% (2nd lowest)
> 5 yr. annualized employment growth rate through June 2020: -0.7% (24th highest)
> June 2020 unemployment rate: 12.5% (10th highest)
> Poverty rate: 12.5% (24th lowest)
Until 2020, and the COVID-19 recession, Delaware had steadily added jobs. June employment in the state climbed every year from 2015 to 2019. By June 2020, however, there were nearly 42,000 fewer people working in Delaware than there were the same time the previous year. Over the same one-year period, unemployment in Delaware spiked from 3.7%, in line with the national rate at the time, to 12.5%, well above the comparable 11.1% national rate.
Over the five years ending with the first quarter of 2020, Delaware’s economy contracted by 5.0%, the second largest GDP decline of any state.
[in-text-ad]
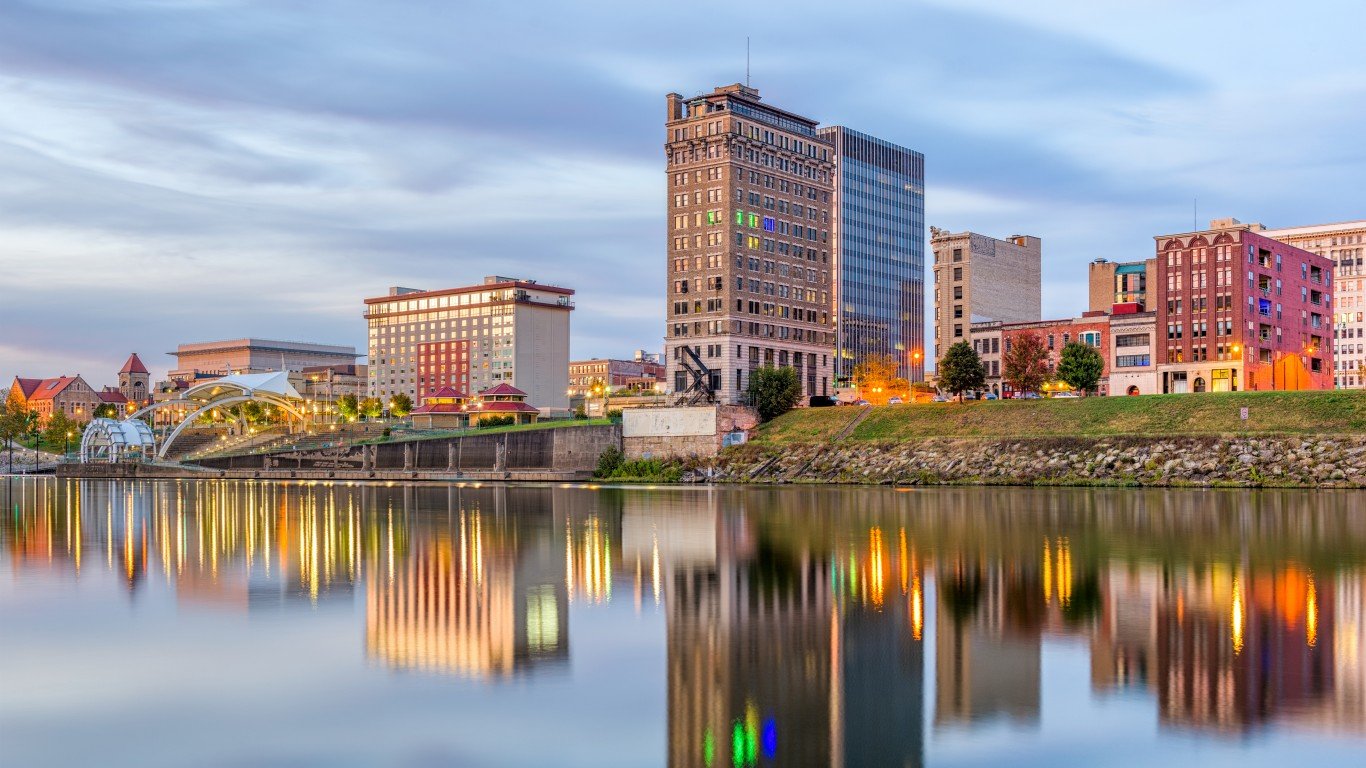
47. West Virginia
> 5 yr. annualized GDP growth rate through Q1 2020: +0.4% (8th lowest)
> 5 yr. annualized employment growth rate through June 2020: -1.2% (18th lowest)
> June 2020 unemployment rate: 10.4% (18th highest)
> Poverty rate: 17.8% (4th highest)
West Virginia has the nation’s fourth highest poverty rate at 17.8%, significantly higher than the 13.1% nationwide poverty rate. The state also has the lowest median household income, at $44,097, nearly $18,000 less than the U.S. median. The state’s economy has been relatively sluggish, growing at an annualized rate of just 0.4% from 2015 to 2020, well below the nationwide 1.9% growth rate.
West Virginia consistently had one of the highest unemployment rates over the past five years, yet the state was not as harshly affected by COVID-19 as most others. Its unemployment rate increased just 3.4 percentage points, as compared to the 5.8 percentage point nationwide uptick. Still, at 10.4%, West Virginia’s unemployment rate remains higher than in most other states.
[recirclink id=729914]
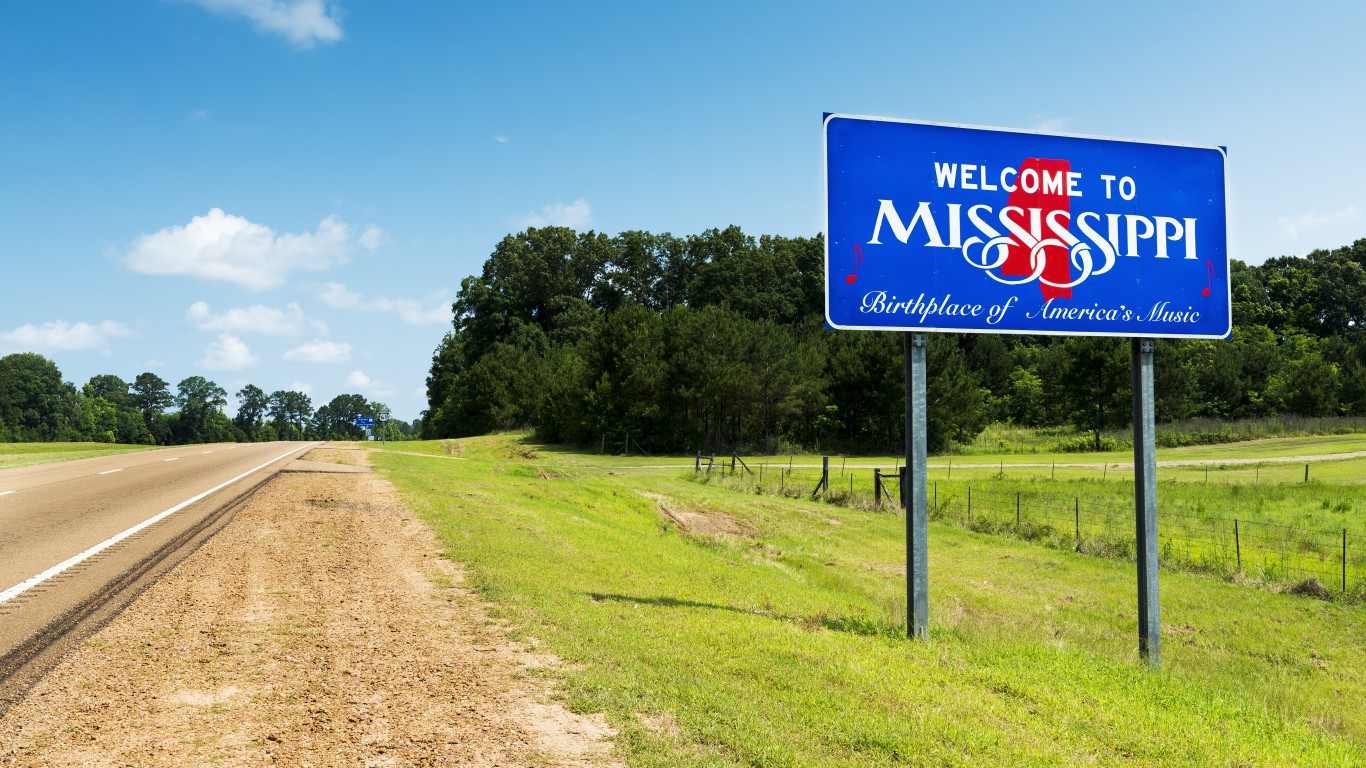
48. Mississippi
> 5 yr. annualized GDP growth rate through Q1 2020: +0.8% (11th lowest)
> 5 yr. annualized employment growth rate through June 2020: -1.7% (11th lowest)
> June 2020 unemployment rate: 8.7% (25th lowest)
> Poverty rate: 19.7% (the highest)
Mississippi’s unemployment rate of 8.7% is well below the comparable 11.1% national jobless rate. Still, despite the relatively strong job market, Mississippi is the poorest state in the country. Nearly 20% Mississippi residents live below the poverty line, compared to 13.1% of all Americans.
Economic growth has also been slow in recent years. Between the first quarter of 2015 and the first quarter in 2020, Mississippi’s economy grew by just 4.0%. Over the same period, the U.S. economy grew by 9.8%.

49. New York
> 5 yr. annualized GDP growth rate through Q1 2020: +1.0% (18th lowest)
> 5 yr. annualized employment growth rate through June 2020: -2.7% (2nd lowest)
> June 2020 unemployment rate: 15.7% (3rd highest)
> Poverty rate: 13.6% (17th highest)
Though it is home to a city widely regarded as the financial capital of the world, New York has one of the worst economies of any state, largely due to the COVID-19 pandemic. As the primary U.S. hotspot during the early months of the outbreak, businesses were more harshly affected than in most other places. As a result the number of people working in the state fell from 9.1 million in June 2019 to fewer than 8 million a year later. The state’s unemployment rate spiked to 15.7%, the third-highest in the nation.
Even prior to the pandemic, New Yorkers faced economic challenges as the state has a relatively high poverty rate, at 13.6%. Population growth in the state between 2010 to 2019 was also relatively slow, due in large part to outward migration. Over 680,000 more people left the state than moved into it, equivalent to 3.5% of the 2010 population, the third largest migration decline among states. This outward migration can hamper economic growth and may be a key reason for the state’s low annualized GDP growth from 2015 to 2020, at roughly half of the 1.9% U.S. rate.
[in-text-ad-2]

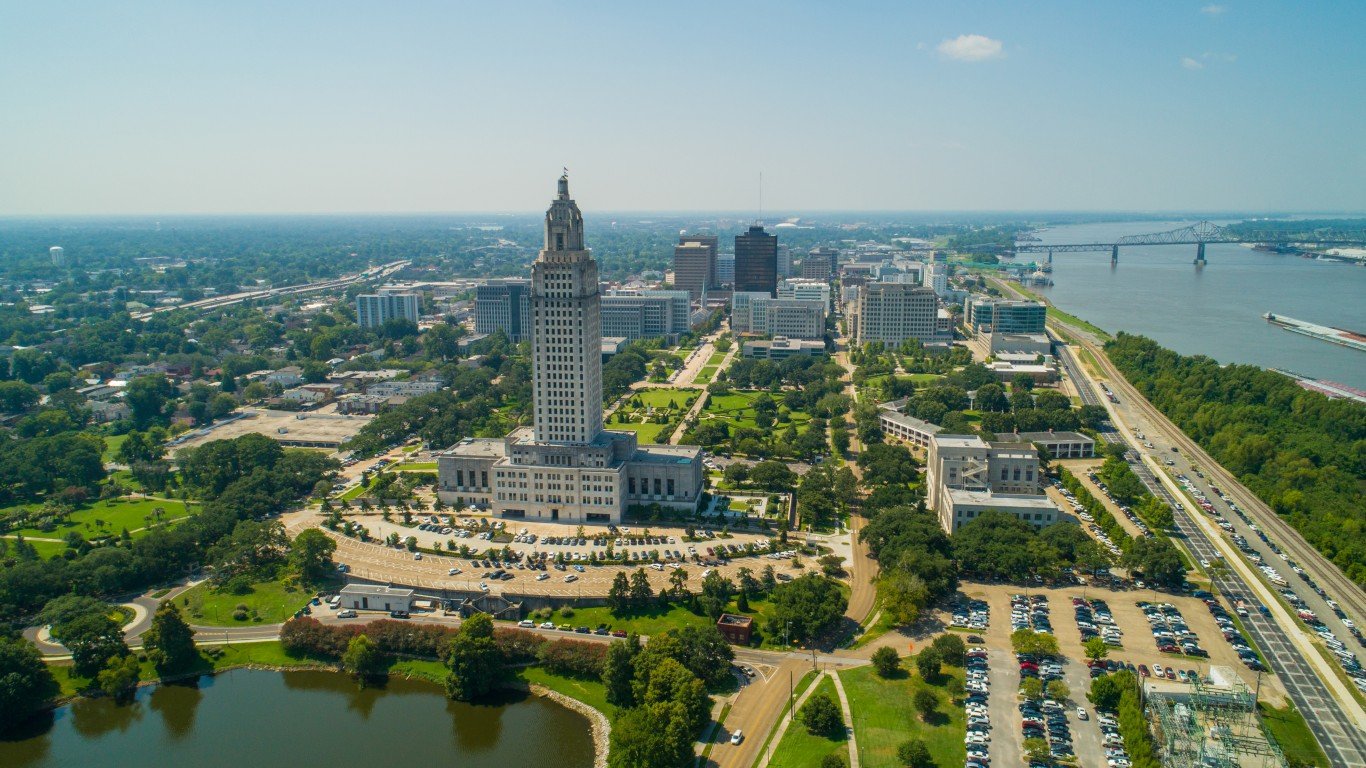
50. Louisiana
> 5 yr. annualized GDP growth rate through Q1 2020: +0.2% (5th lowest)
> 5 yr. annualized employment growth rate through June 2020: -2.3% (5th lowest)
> June 2020 unemployment rate: 9.7% (23rd highest)
> Poverty rate: 18.6% (3rd highest)
Louisiana’s economy ranks as the worst in the nation, largely due to the share of residents living on poverty level income. The state’s 18.6% poverty rate is third highest among states and well above the comparable 13.1% national rate. It is the third highest ranked state in terms of crime.
Though Louisiana’s unemployment rate of 9.7% is lower than the 11.1% national rate, it is higher than the jobless rate in most states. Additionally, few states have had a steeper employment decline over the last five years than Louisiana. The number of people working in the state fell by 10.9% between June 2015 and June 2020, far worse than the 2.7% national decline.
Methodology
To determine the states with the best and worst economies, 24/7 Wall St. ranked states based on an index comprising five measures: GDP growth, job growth, unemployment rate, poverty rate, and the bachelor’s degree attainment rate among adults. The average annual GDP growth rate from Q1 2015 to Q1 2020 came from the Bureau of Economic Analysis and was included in the index at full weight. The average annual employment growth rate from June 2015 to June 2020 came from the Bureau of Labor Statistics and was included in the index at full weight. The seasonally-adjusted unemployment rate as of June 2020 also came from the BLS and was included in the index at full weight. The share of adults living below the poverty line came from the U.S. Census Bureau’s 2018 American Community Survey and was included in the index at full weight.
In addition to the components in the index, we considered additional state data. Real GDP and contributions to real GDP growth by industry came from the BEA. Median household income, college attainment rate, and the share of workers commuting outside of the state for work came from the 2018 ACS. The affordability ratio of median home value to median household income is a 24/7 Wall St. calculation based on ACS data. Data on regional price parity, a measure of cost of living, came from the BEA and is for 2018. Population change due to natural causes and net migration from 2010 to 2019 came from the U.S. Census Bureau. All data are for the most recent period available.
Contact [email protected] for any questions or corrections.