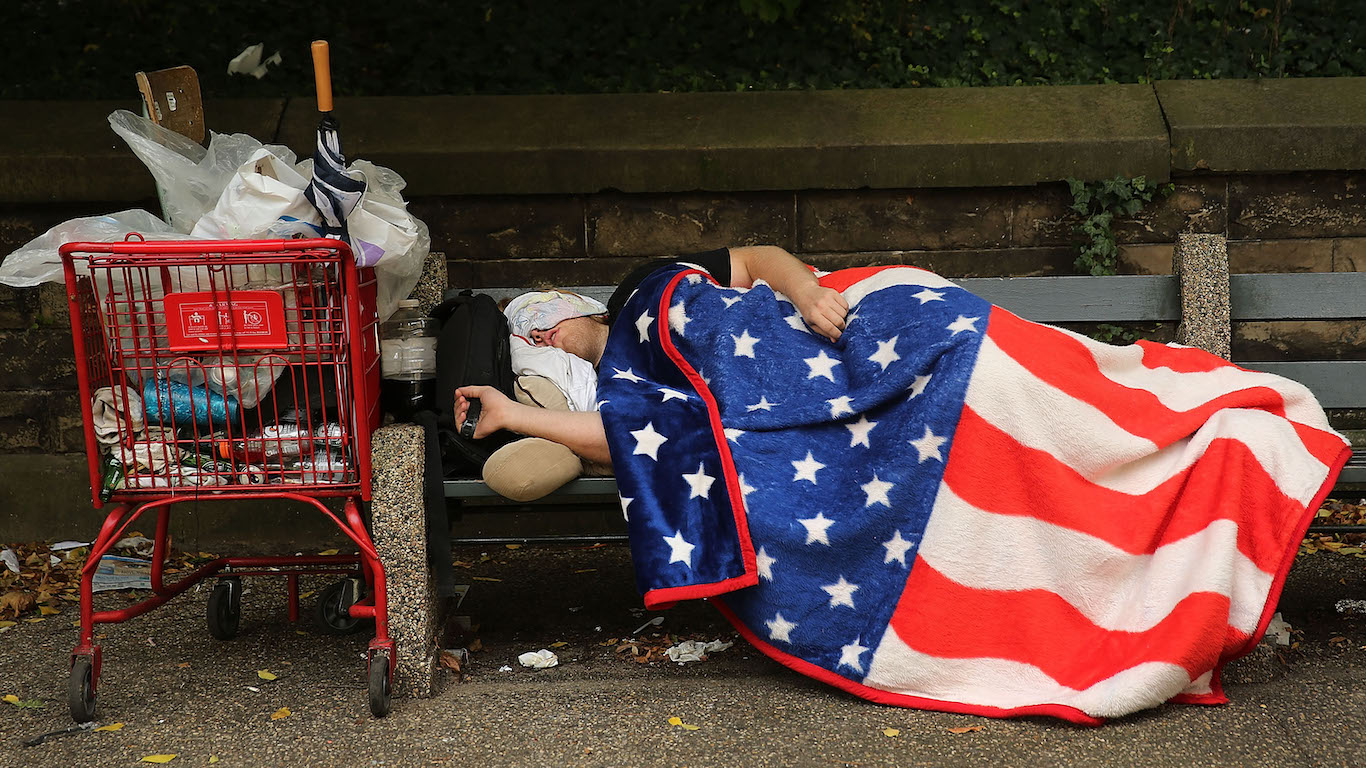
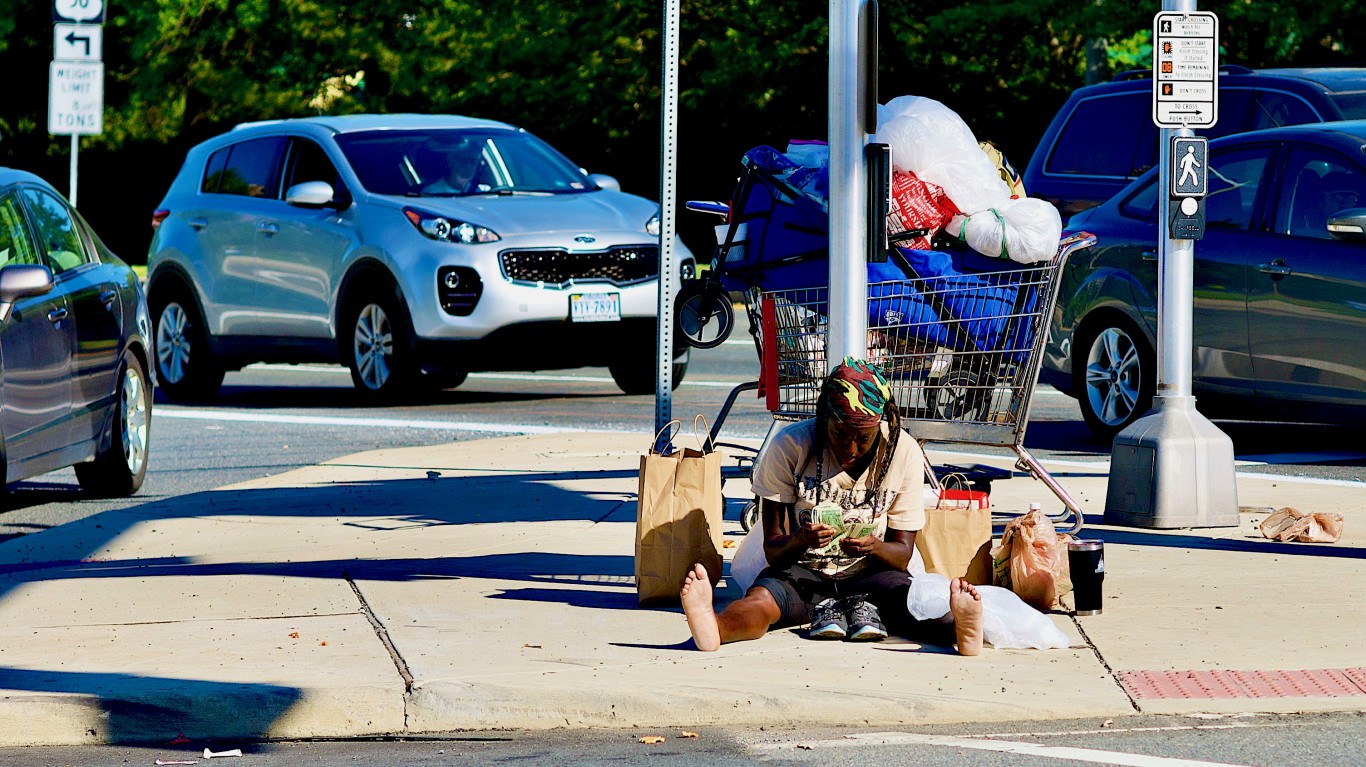
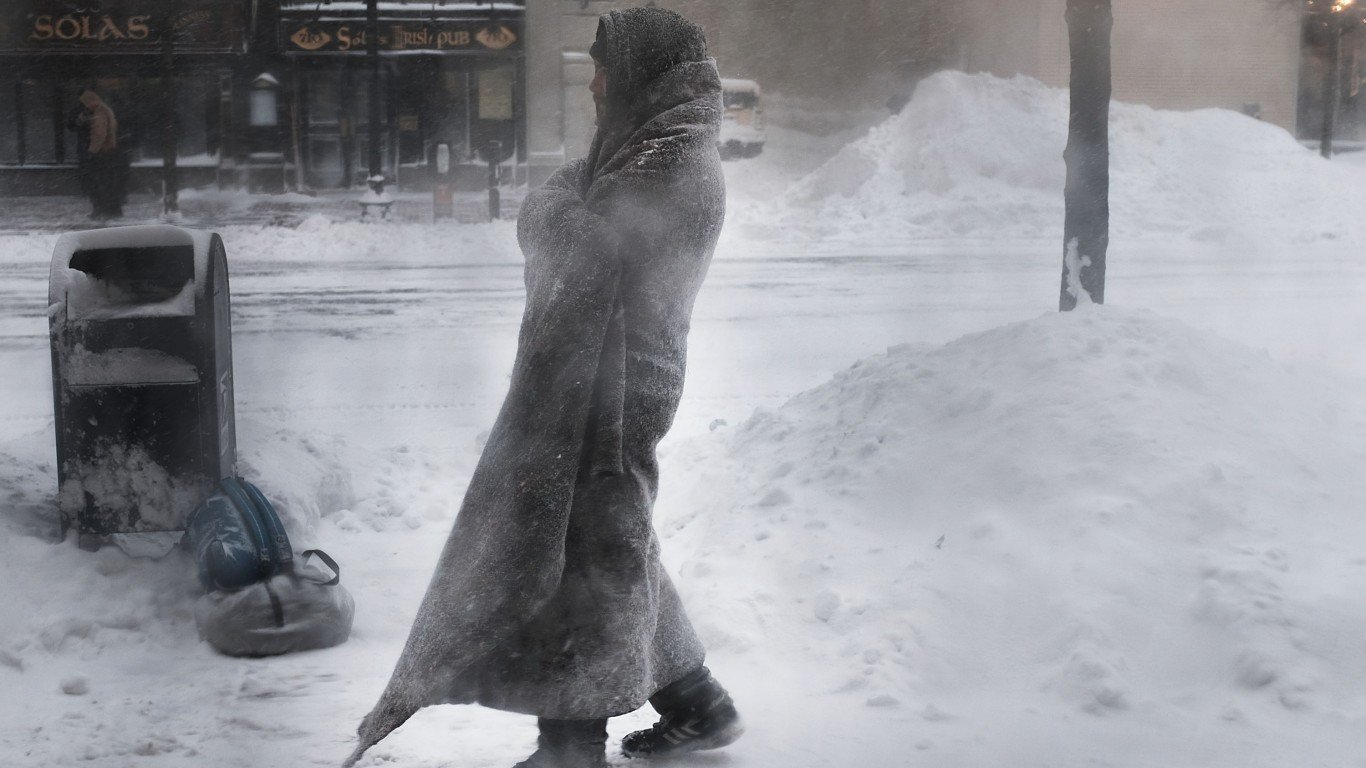
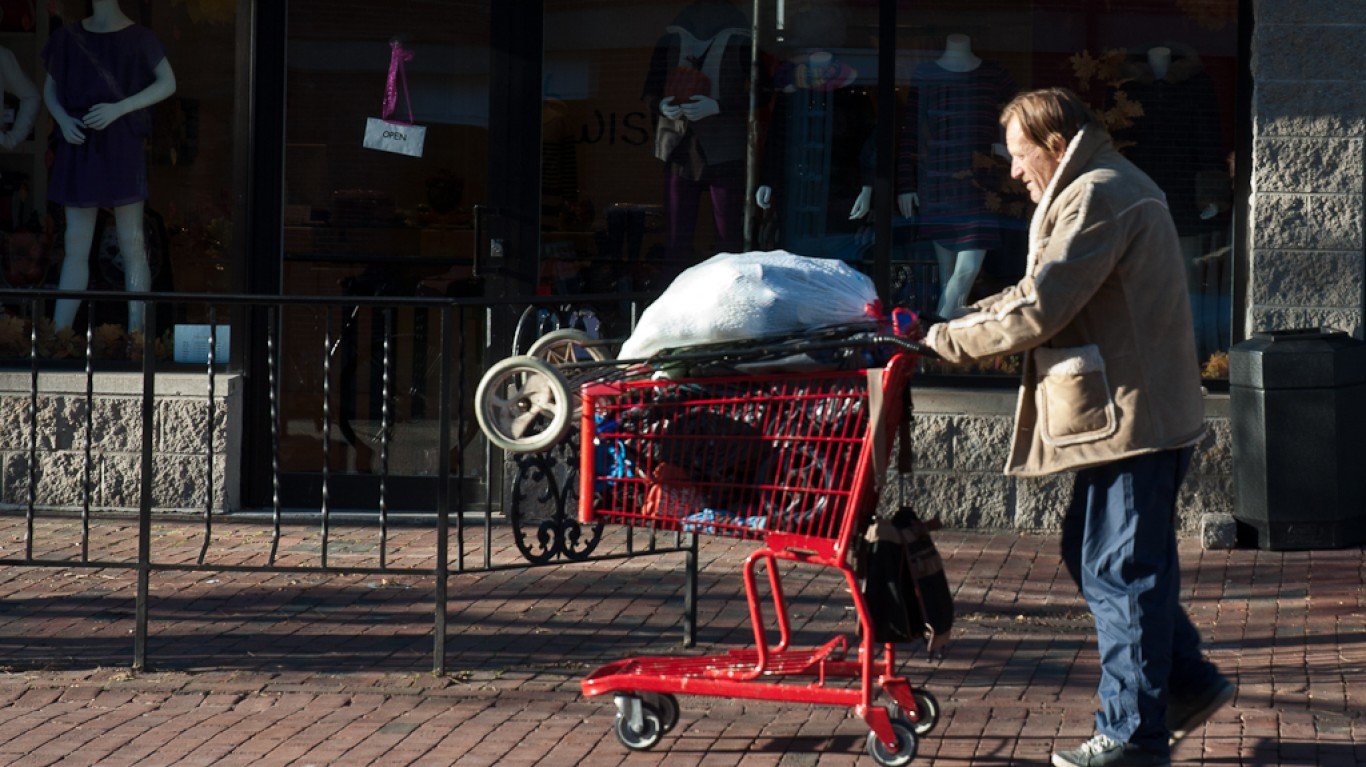
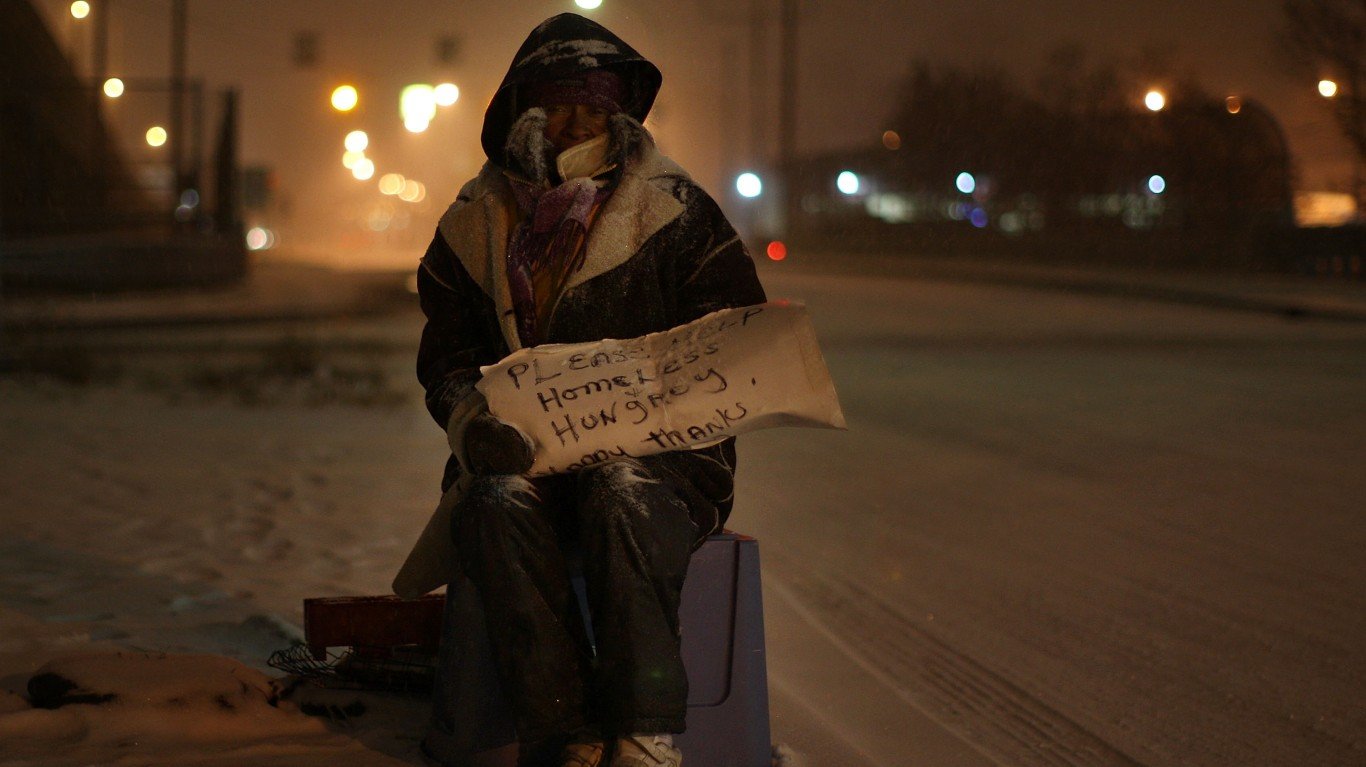
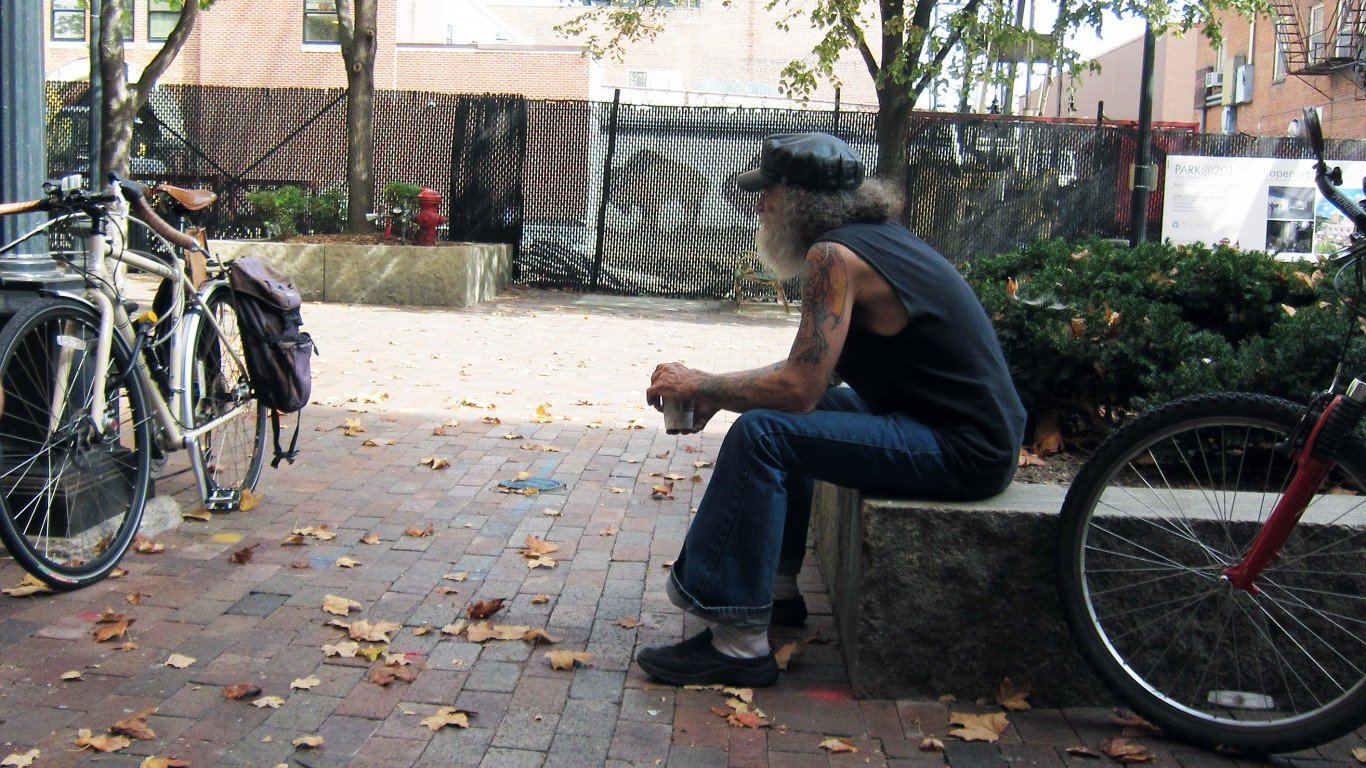
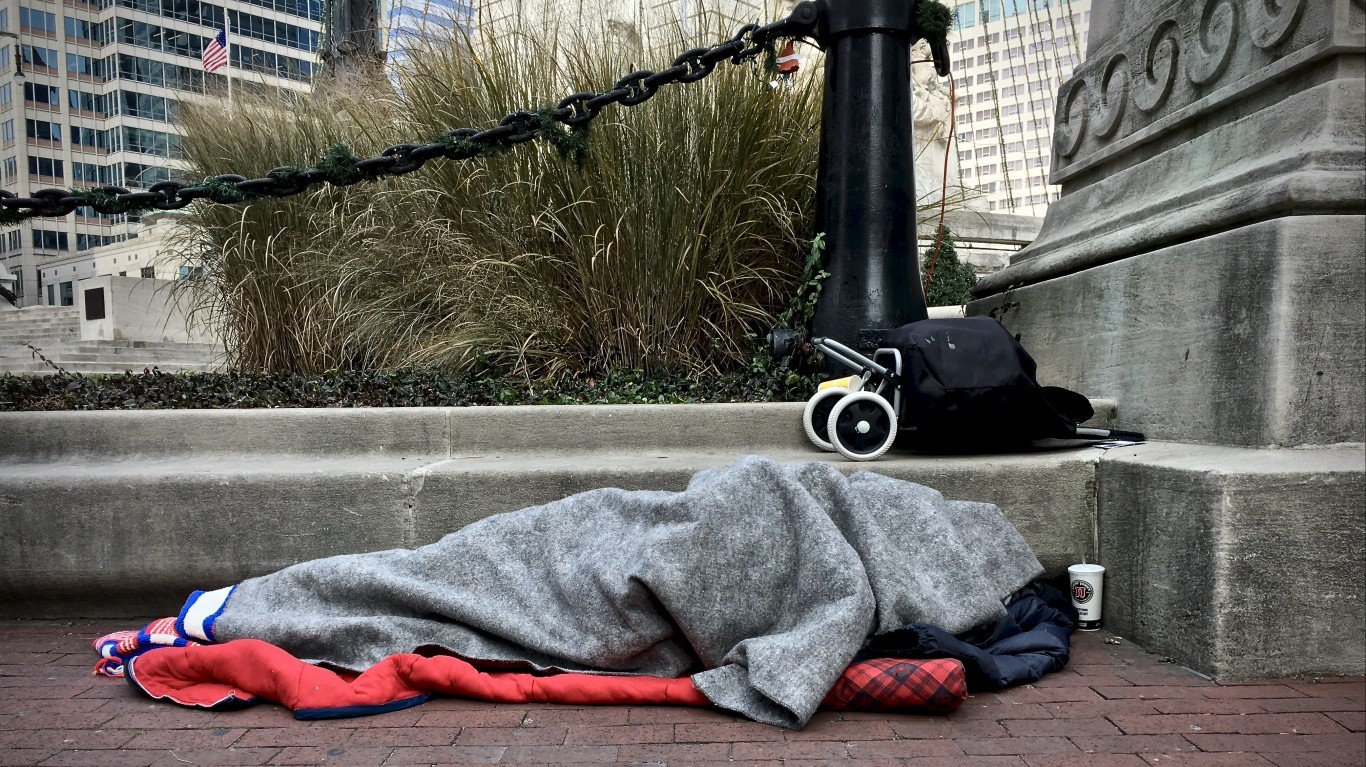
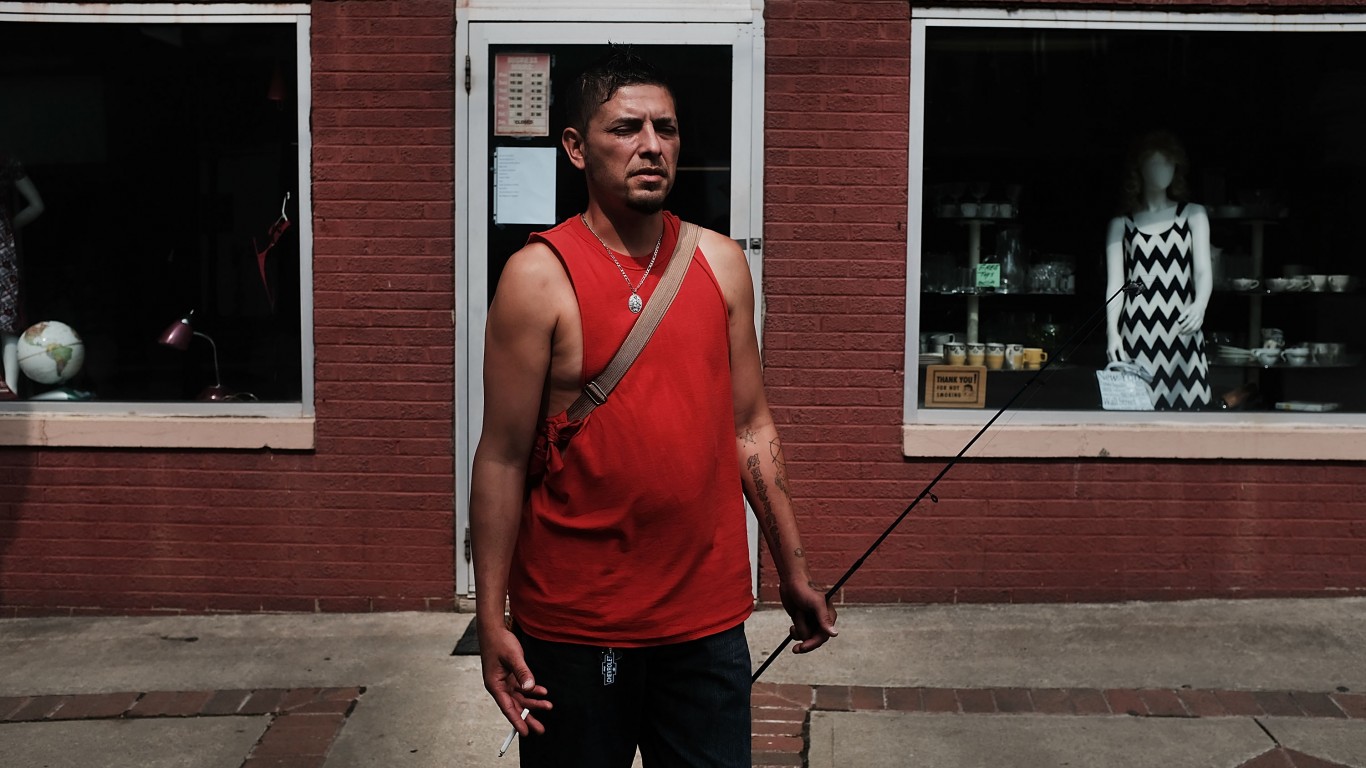
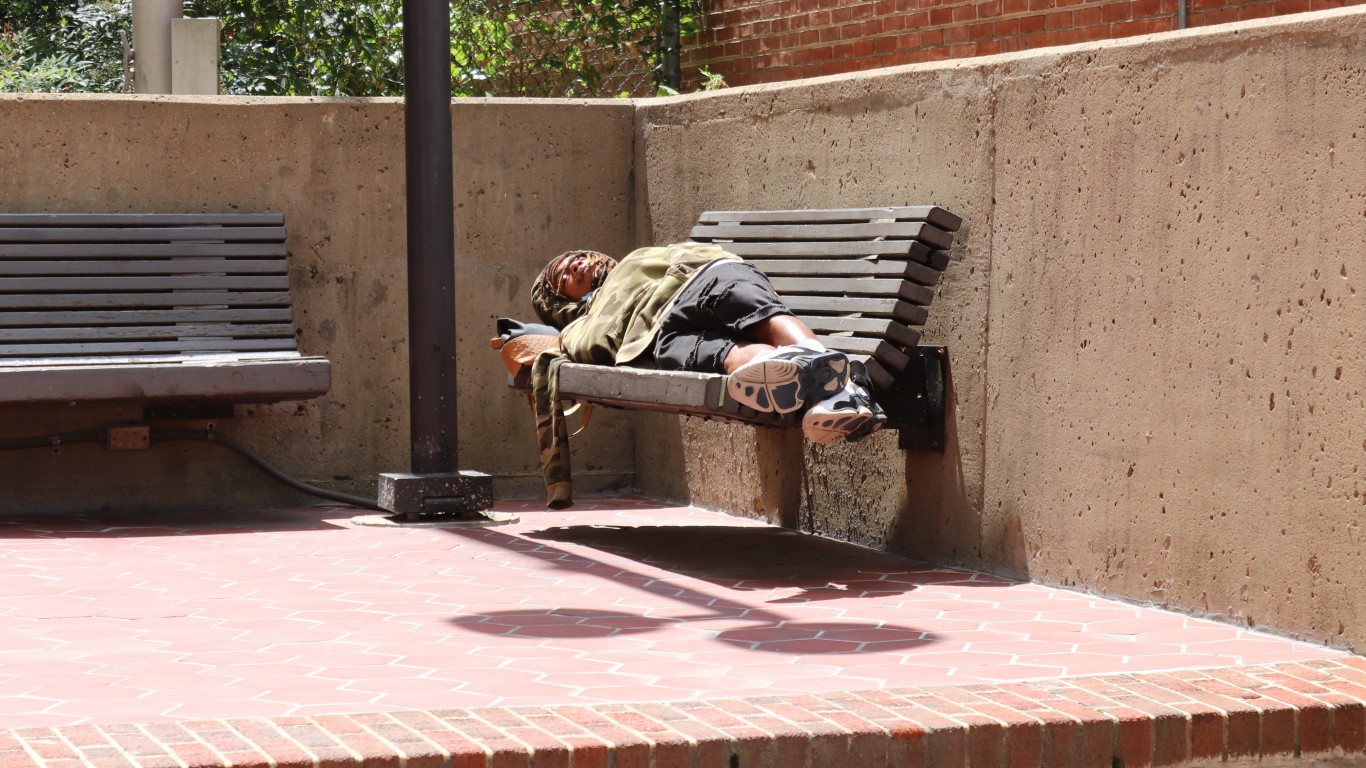
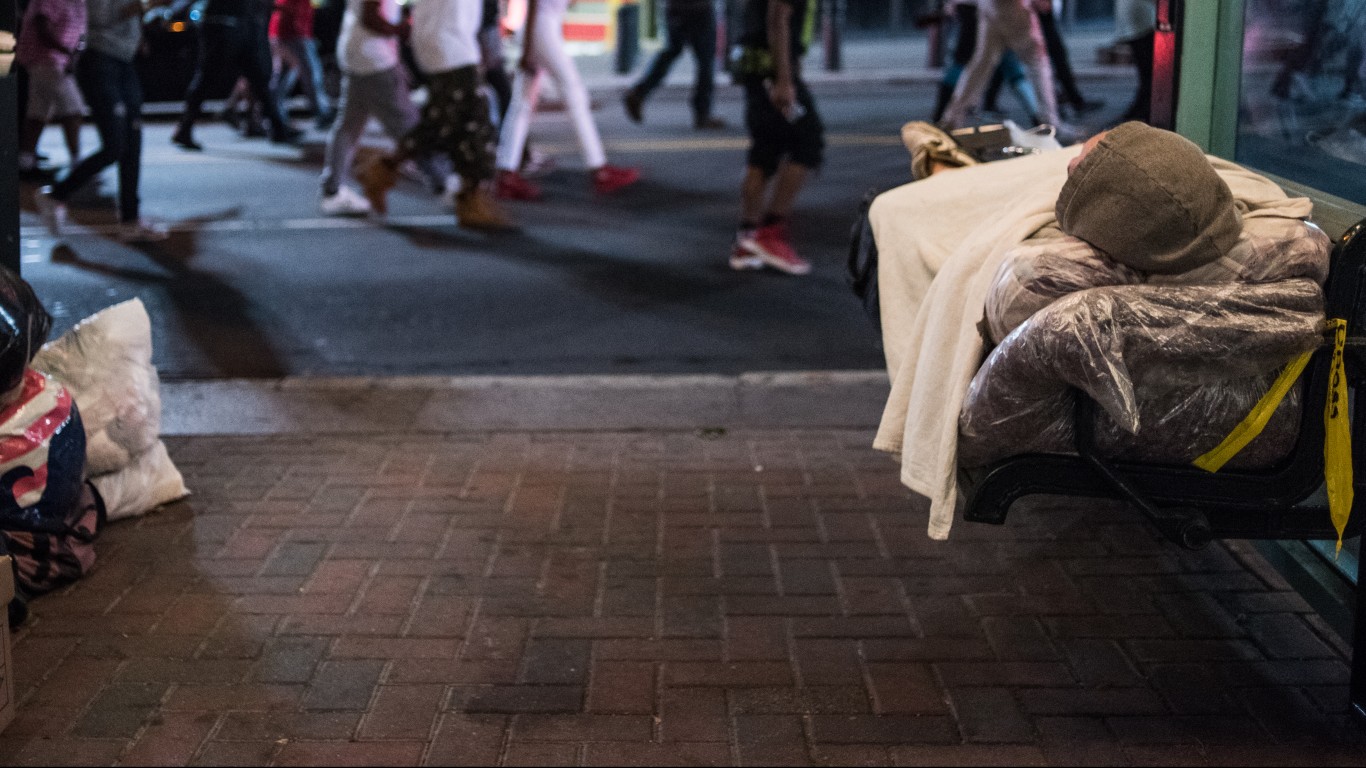
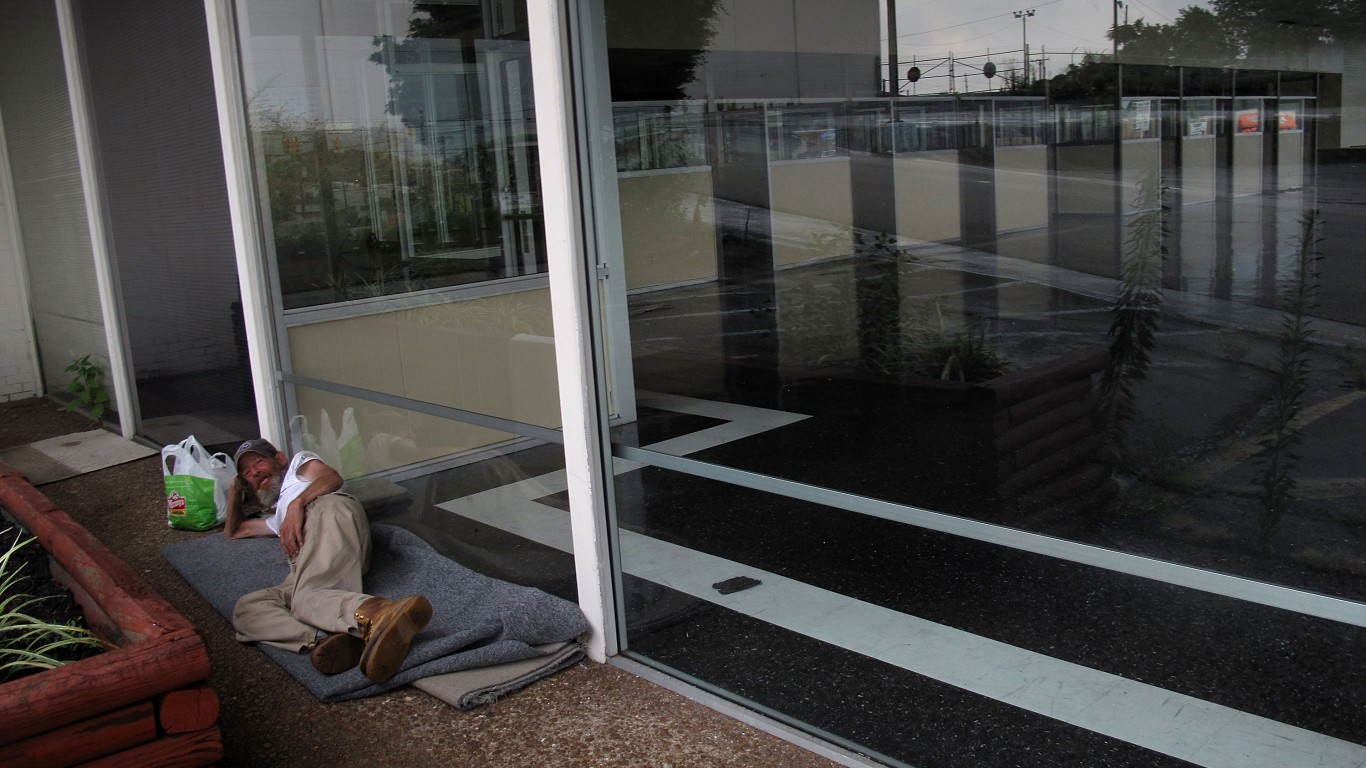
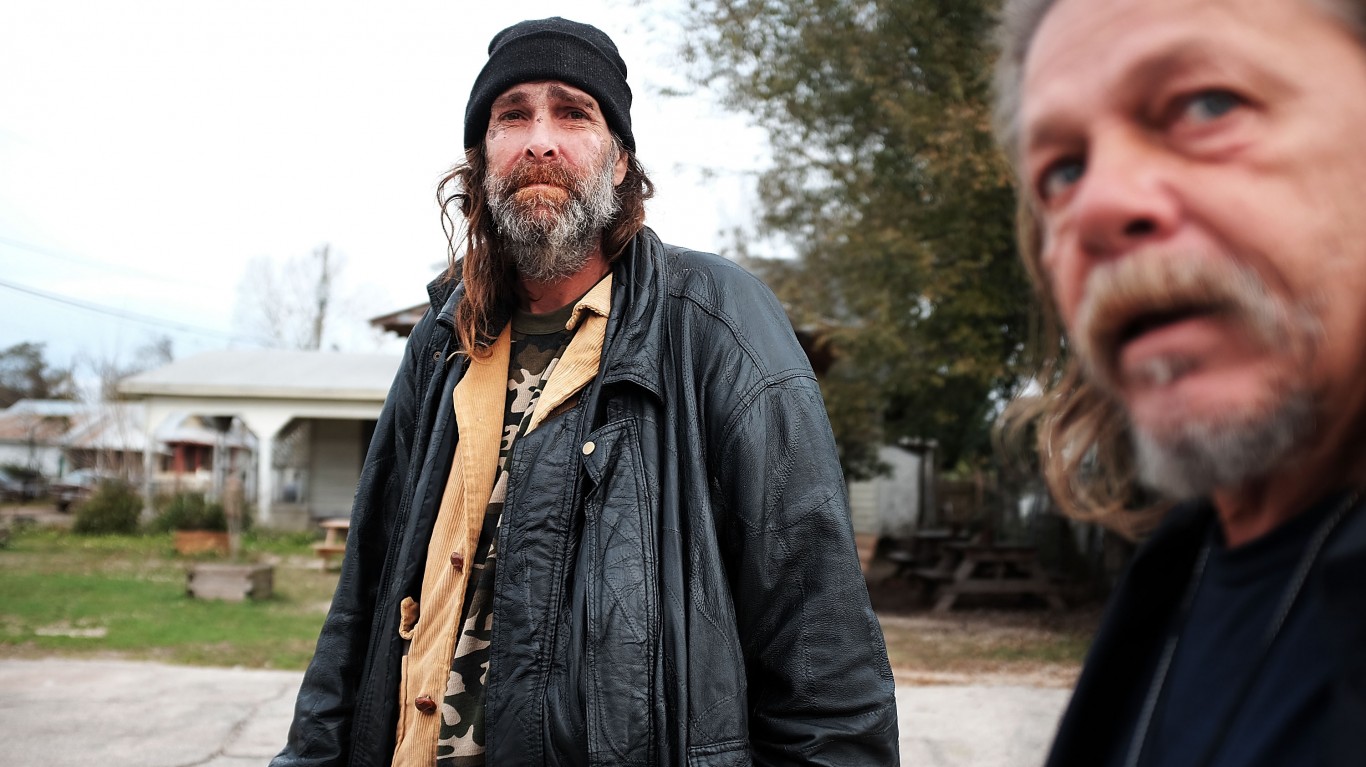
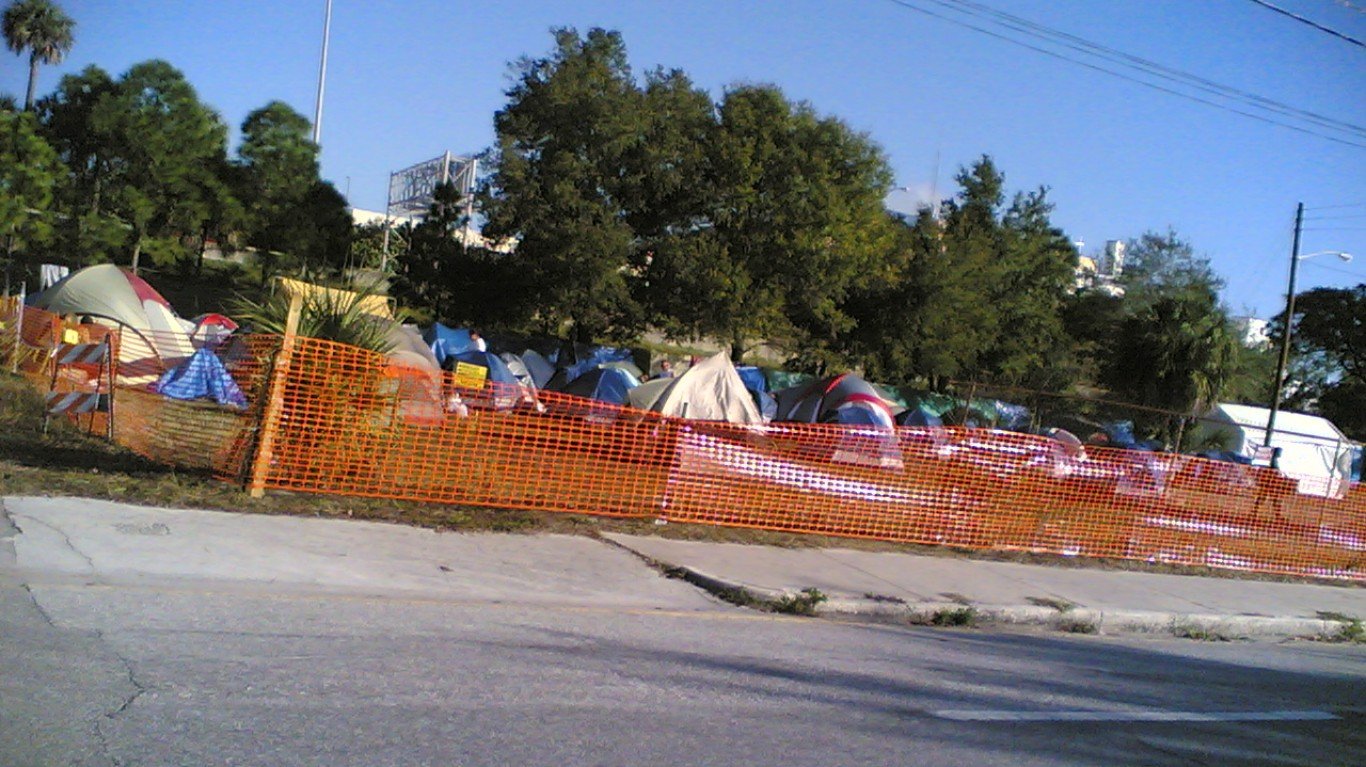
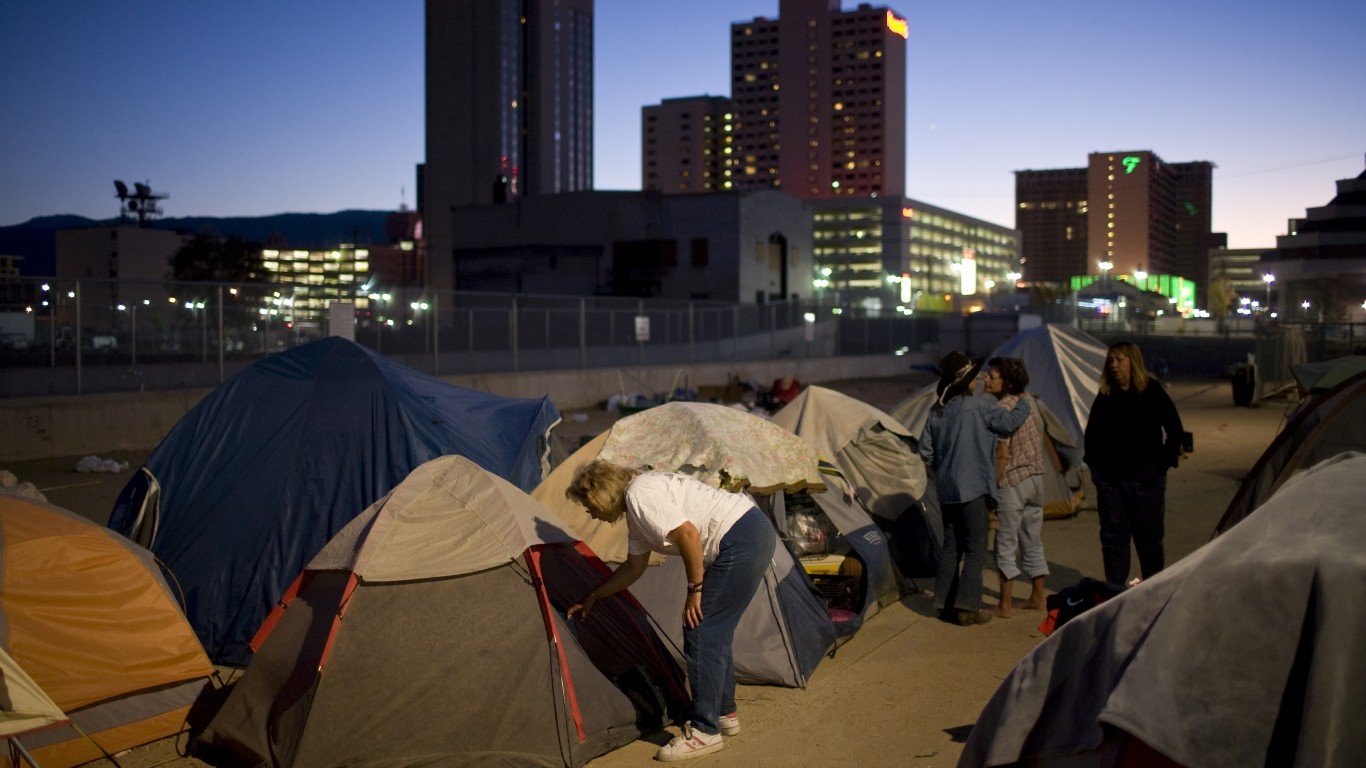
In the U.S., marginalized populations carry a disproportionately large burden of coronavirus infections and deaths. For a variety of reasons, including lack of access to health infrastructure, greater incidence of chronic disease and other preconditions, lower likelihood of remote work options, as well as often more crowded living conditions, poorer areas have consistently reported far greater COVID-19 infection and death rates than more affluent areas. And few marginalized groups are more vulnerable than those struggling with homelessness. The problem is likely only to worsen during the winter months.
The pandemic adds challenges to the work of ameliorating homelessness. Not only is the virus likely to spread more easily among clients, staff, and volunteers in shared spaces such as homeless shelters, but also many people experiencing homelessness are older or have underlying medical conditions that increase the risk of severe COVID-19.
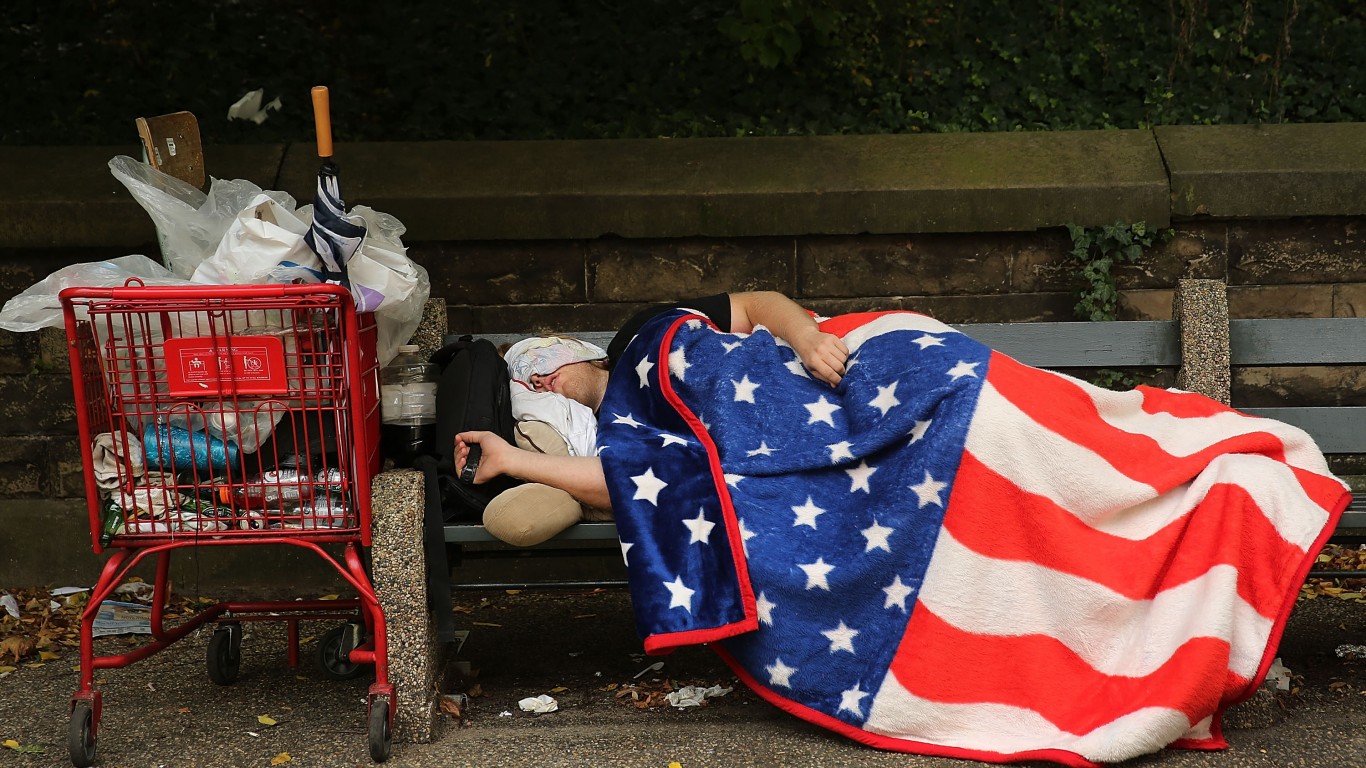
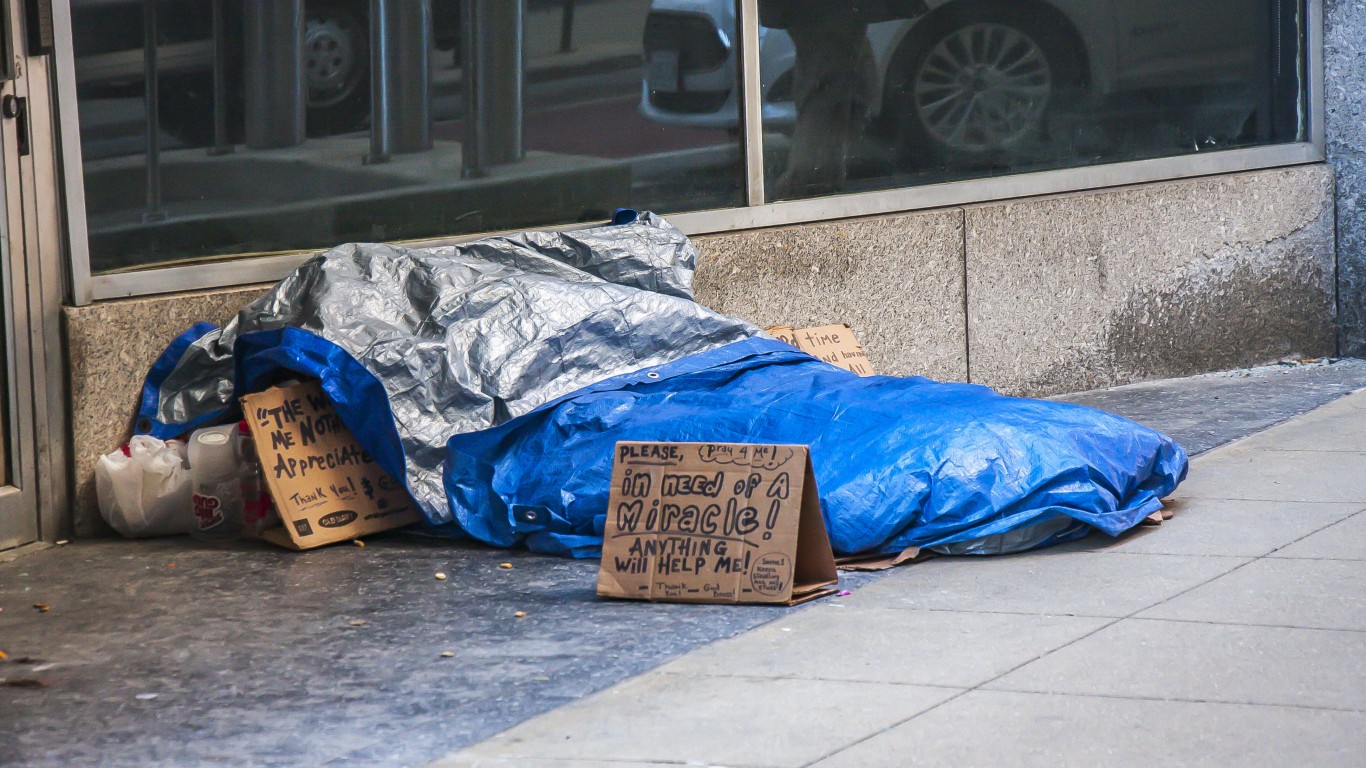
Based on the latest estimates from the Department of Housing and Urban Development, there were 567,715 people experiencing homelessness across the United States in a single day in late January 2019, compared to 552,830 people during the same day in 2018.
The HUD delivers to Congress annual estimates of homelessness across the nation. The estimates show a great deal of variation in homelessness across the country. Given the economic and health consequences from the pandemic for communities across the U.S., the assessment of the nation’s homelessness problem is not likely to improve for some time.
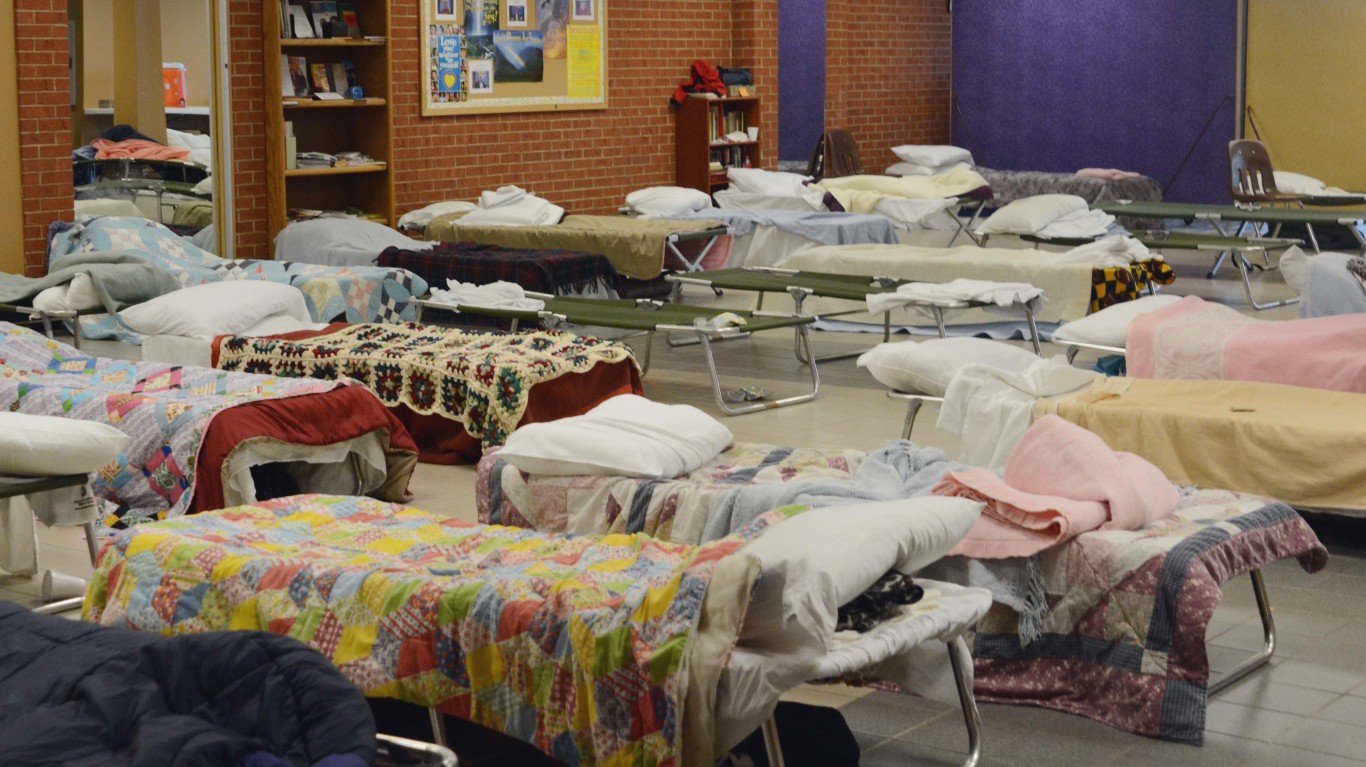
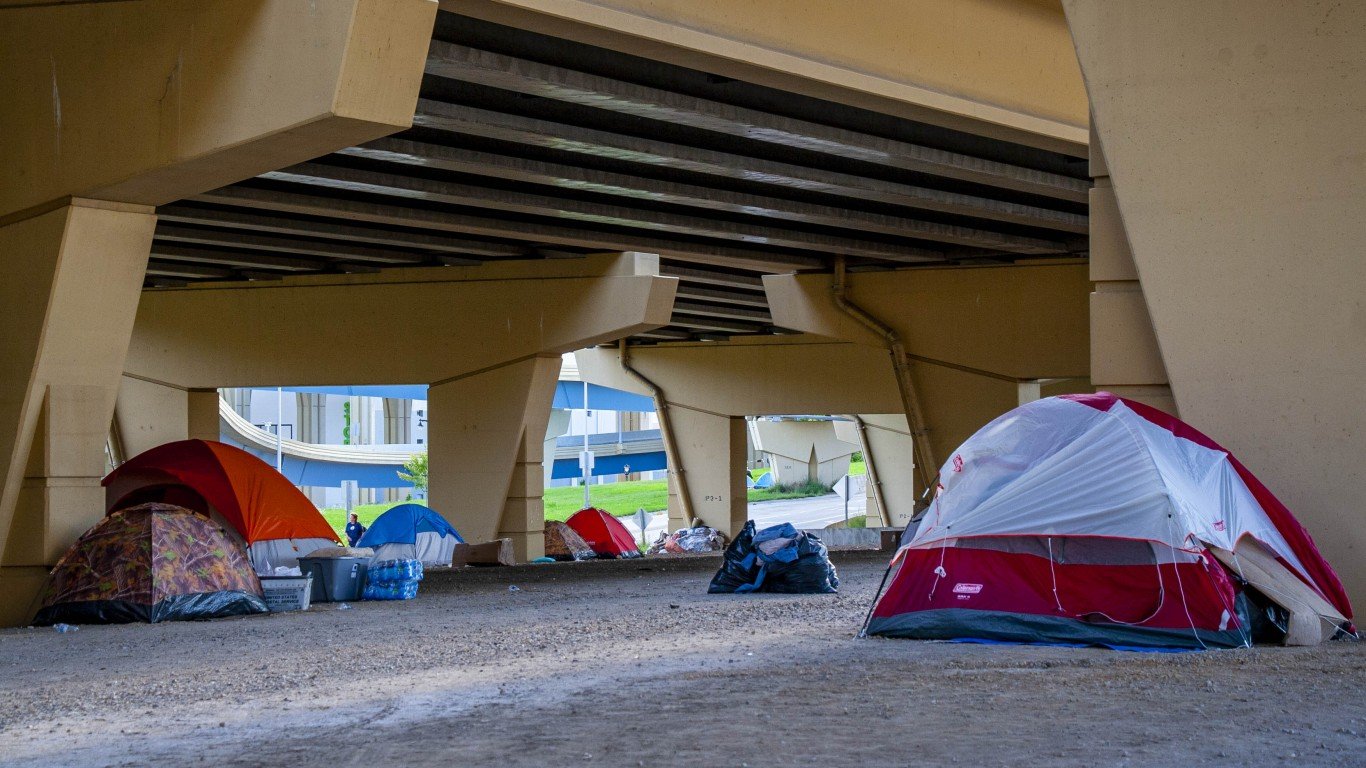
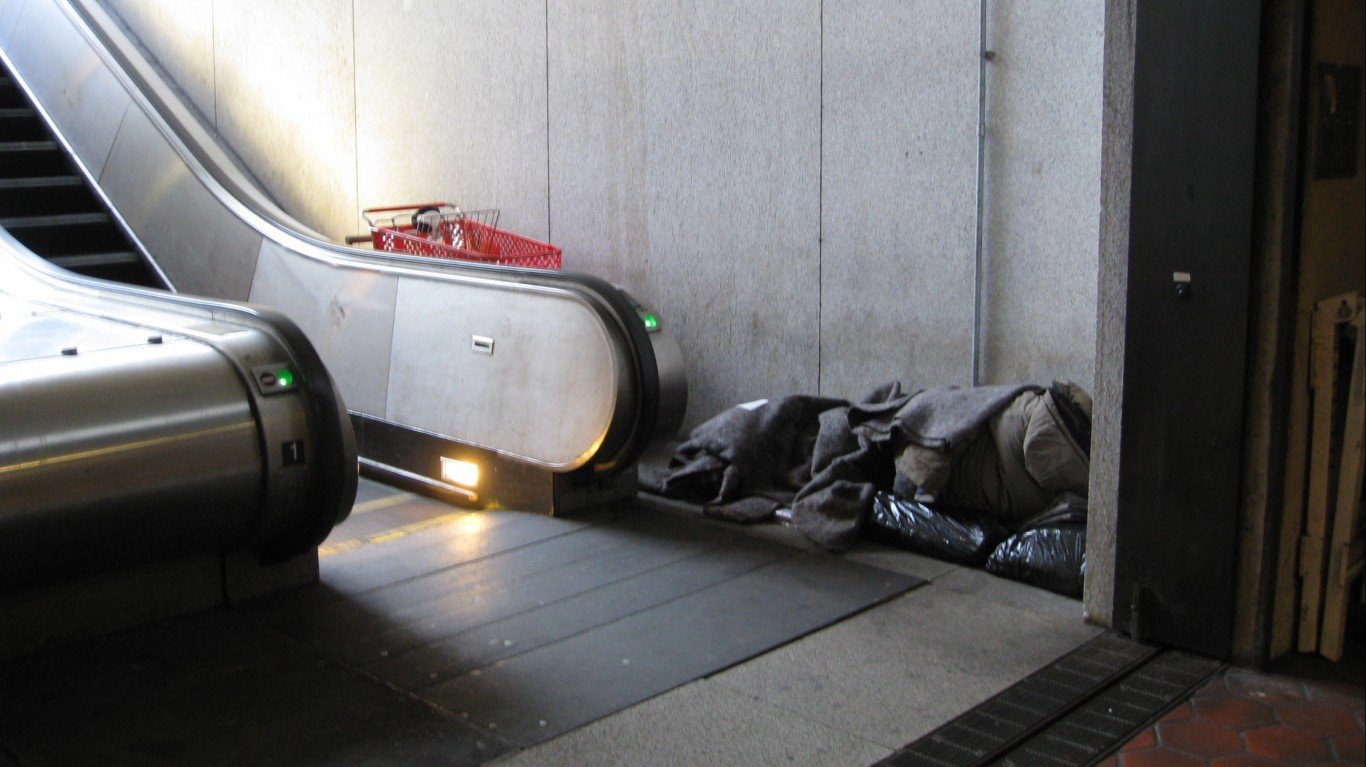
24/7 Wall St. reviewed the share of each state’s unsheltered homeless population out of the total homeless population. Nationwide, approximately two-thirds of homeless people were staying in sheltered locations, such as emergency shelters and different government housing programs. Meanwhile, one-third of homeless people lived on the street, in abandoned buildings, or other unsheltered places.
Click here to see the states with the most unsheltered homeless people.
Click here to see our methodology.
50. North Dakota
> Homeless individuals w/o shelter: 2.2% (12 of 557)
> Overall homelessness: 557 (7 in every 10,000 people — 5th fewest)
> Change in overall homelessness 2018-2019: +2.8% (13th largest increase)
> Change in overall homelessness 2007-2019: -12.4% (7th smallest decrease)
> Poverty rate: 10.6% (17th lowest)
> Households with annual income less than $10,000: 5.4% (25th highest)
[in-text-ad]
49. New York
> Homeless individuals w/o shelter: 4.4% (4,047 of 92,091)
> Overall homelessness: 92,091 (47 in every 10,000 people — the most)
> Change in overall homelessness 2018-2019: +0.2% (20th largest increase)
> Change in overall homelessness 2007-2019: +47.1% (2nd largest increase)
> Poverty rate: 13.0% (16th highest)
> Households with annual income less than $10,000: 6.7% (10th highest)
[recirclink id=824127]
48. Massachusetts
> Homeless individuals w/o shelter: 4.5% (829 of 18,471)
> Overall homelessness: 18,471 (27 in every 10,000 people — 6th most)
> Change in overall homelessness 2018-2019: -8.0% (12th largest decrease)
> Change in overall homelessness 2007-2019: +22.1% (4th largest increase)
> Poverty rate: 9.4% (8th lowest)
> Households with annual income less than $10,000: 5.1% (20th lowest)
47. Maine
> Homeless individuals w/o shelter: 4.5% (95 of 2,106)
> Overall homelessness: 2,106 (16 in every 10,000 people — 11th most)
> Change in overall homelessness 2018-2019: -16.3% (2nd largest decrease)
> Change in overall homelessness 2007-2019: -20.2% (14th smallest decrease)
> Poverty rate: 10.9% (19th lowest)
> Households with annual income less than $10,000: 5.1% (20th lowest)
[in-text-ad-2]
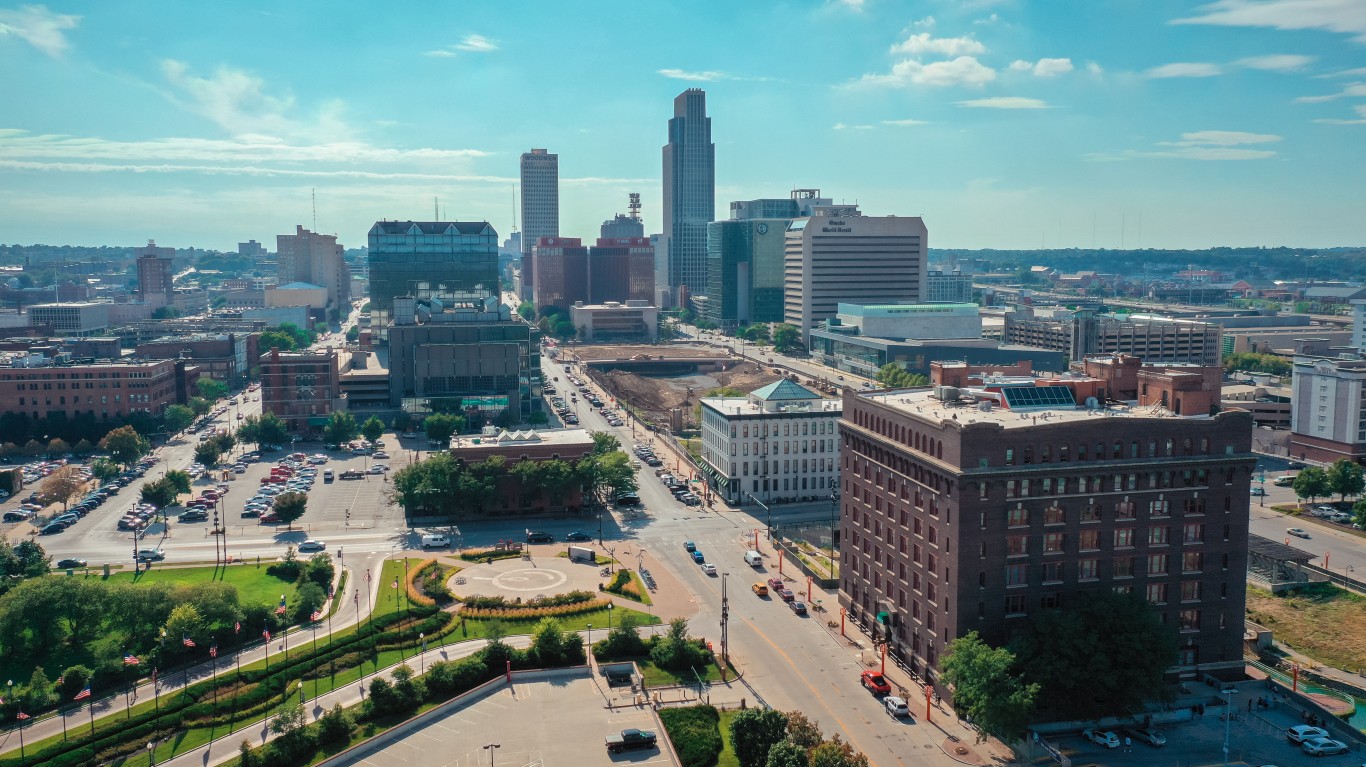
46. Nebraska
> Homeless individuals w/o shelter: 4.7% (110 of 2,365)
> Overall homelessness: 2,365 (12 in every 10,000 people — 18th most)
> Change in overall homelessness 2018-2019: -2.3% (28th largest decrease)
> Change in overall homelessness 2007-2019: -33.0% (14th largest decrease)
> Poverty rate: 9.9% (11th lowest)
> Households with annual income less than $10,000: 4.8% (14th lowest)
45. Wisconsin
> Homeless individuals w/o shelter: 6.5% (295 of 4,538)
> Overall homelessness: 4,538 (8 in every 10,000 people — 7th fewest)
> Change in overall homelessness 2018-2019: -7.5% (13th largest decrease)
> Change in overall homelessness 2007-2019: -19.7% (13th smallest decrease)
> Poverty rate: 10.4% (16th lowest)
> Households with annual income less than $10,000: 4.4% (7th lowest)
[in-text-ad]

44. Rhode Island
> Homeless individuals w/o shelter: 6.7% (71 of 1,055)
> Overall homelessness: 1,055 (10 in every 10,000 people — 24th fewest)
> Change in overall homelessness 2018-2019: -4.2% (19th largest decrease)
> Change in overall homelessness 2007-2019: -23.1% (16th smallest decrease)
> Poverty rate: 10.8% (18th lowest)
> Households with annual income less than $10,000: 5.6% (24th highest)
[recirclink id=824405]
43. Michigan
> Homeless individuals w/o shelter: 7.7% (662 of 8,575)
> Overall homelessness: 8,575 (9 in every 10,000 people — 14th fewest)
> Change in overall homelessness 2018-2019: +2.7% (14th largest increase)
> Change in overall homelessness 2007-2019: -69.7% (the largest decrease)
> Poverty rate: 13.0% (16th highest)
> Households with annual income less than $10,000: 6.2% (13th highest)
42. Iowa
> Homeless individuals w/o shelter: 8.1% (188 of 2,315)
> Overall homelessness: 2,315 (7 in every 10,000 people — 6th fewest)
> Change in overall homelessness 2018-2019: -15.8% (3rd largest decrease)
> Change in overall homelessness 2007-2019: -15.3% (10th smallest decrease)
> Poverty rate: 11.2% (21st lowest)
> Households with annual income less than $10,000: 5.1% (20th lowest)
[in-text-ad-2]
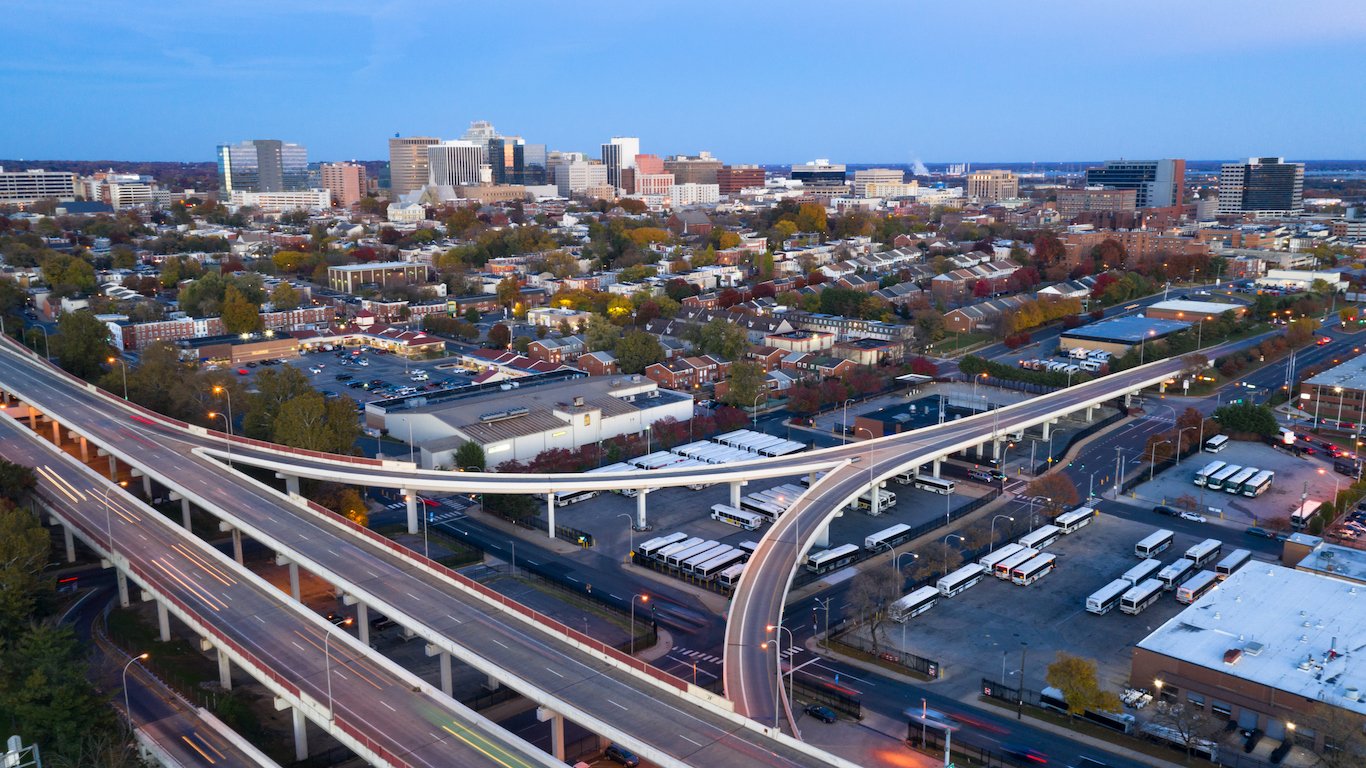
41. Delaware
> Homeless individuals w/o shelter: 10.3% (95 of 921)
> Overall homelessness: 921 (9 in every 10,000 people — 21st fewest)
> Change in overall homelessness 2018-2019: -14.9% (5th largest decrease)
> Change in overall homelessness 2007-2019: -13.2% (8th smallest decrease)
> Poverty rate: 11.3% (22nd lowest)
> Households with annual income less than $10,000: 5.4% (25th highest)
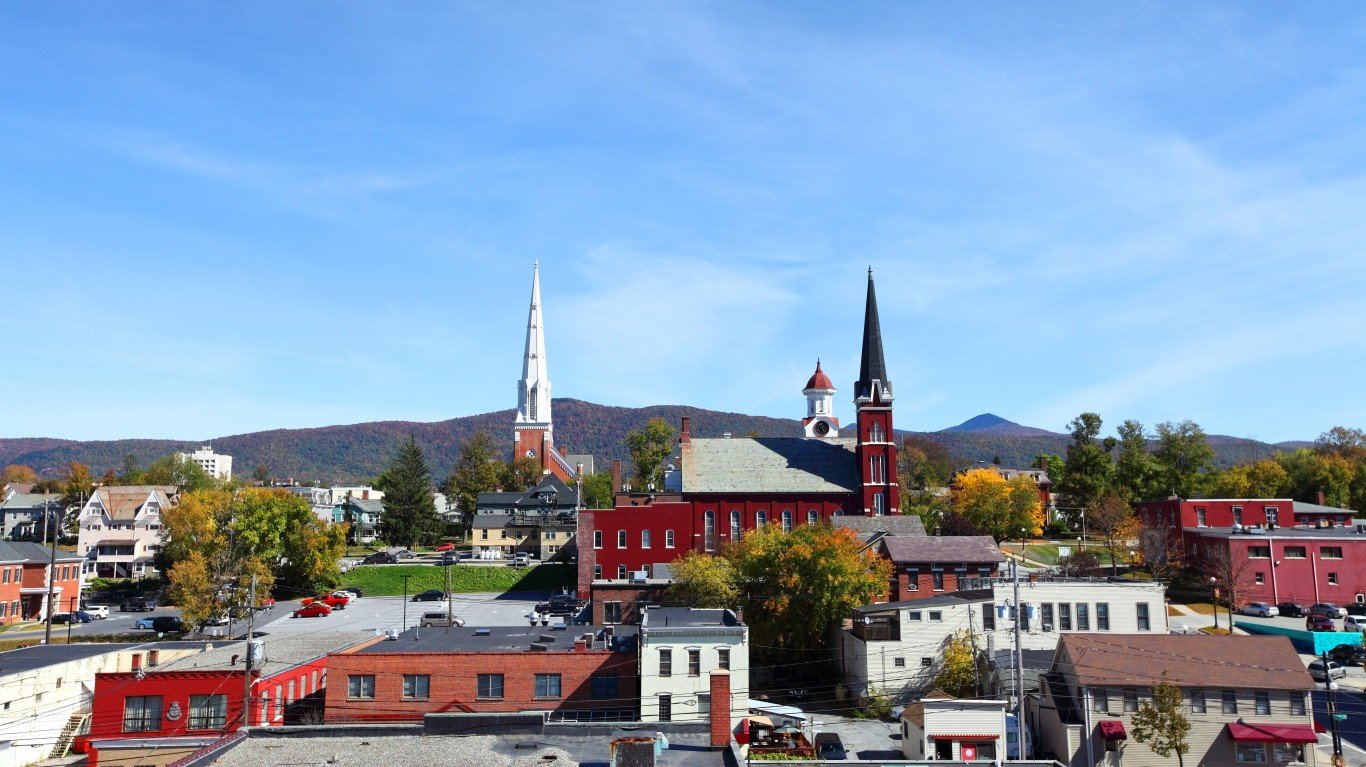
40. Vermont
> Homeless individuals w/o shelter: 10.5% (114 of 1,089)
> Overall homelessness: 1,089 (17 in every 10,000 people — 9th most)
> Change in overall homelessness 2018-2019: -15.6% (4th largest decrease)
> Change in overall homelessness 2007-2019: +5.2% (12th largest increase)
> Poverty rate: 10.2% (15th lowest)
> Households with annual income less than $10,000: 5.2% (21st lowest)
[in-text-ad]
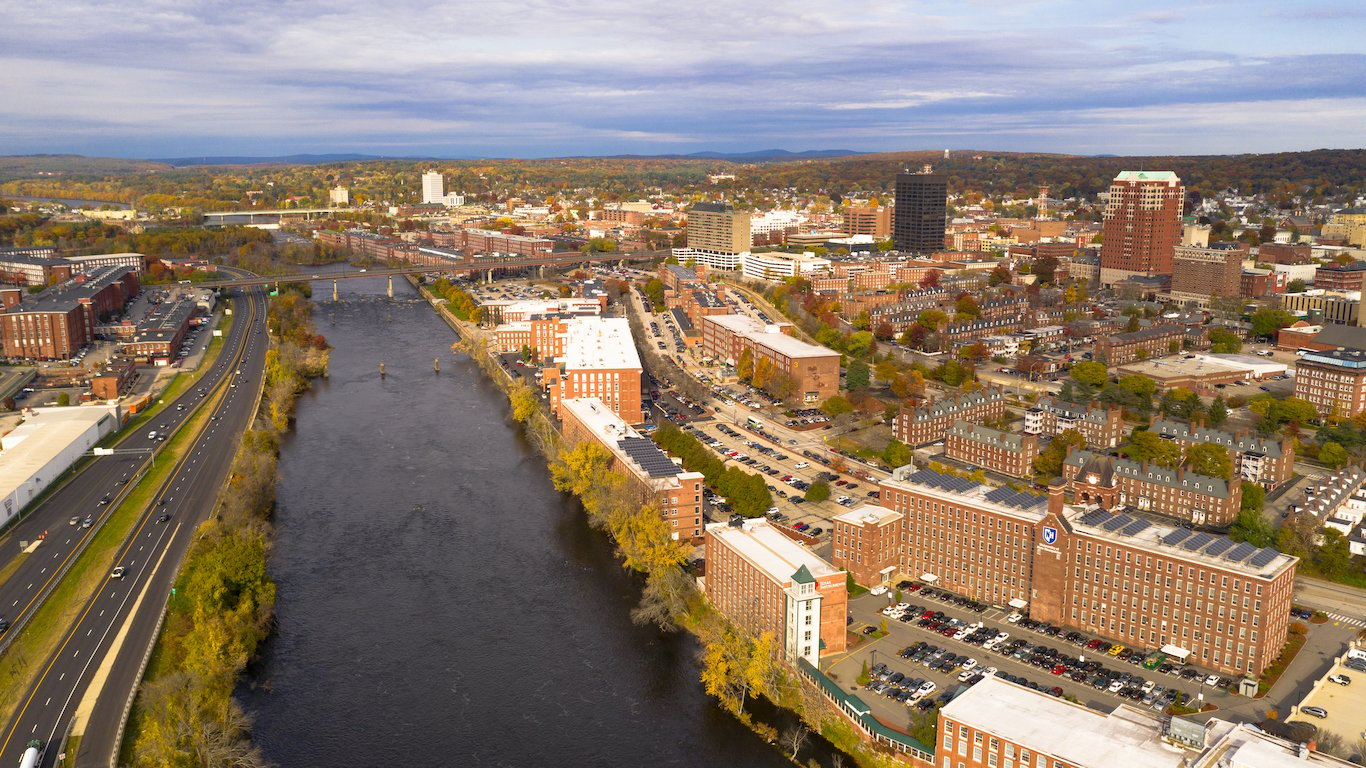
39. New Hampshire
> Homeless individuals w/o shelter: 10.7% (149 of 1,396)
> Overall homelessness: 1,396 (10 in every 10,000 people — 23rd most)
> Change in overall homelessness 2018-2019: -3.7% (22nd largest decrease)
> Change in overall homelessness 2007-2019: -37.9% (10th largest decrease)
> Poverty rate: 7.3% (the lowest)
> Households with annual income less than $10,000: 3.9% (2nd lowest)
[recirclink id=824684]
38. Indiana
> Homeless individuals w/o shelter: 11.7% (642 of 5,471)
> Overall homelessness: 5,471 (8 in every 10,000 people — 11th fewest)
> Change in overall homelessness 2018-2019: +4.1% (12th largest increase)
> Change in overall homelessness 2007-2019: -25.6% (17th smallest decrease)
> Poverty rate: 11.9% (23rd highest)
> Households with annual income less than $10,000: 5.9% (20th highest)
37. Pennsylvania
> Homeless individuals w/o shelter: 12.3% (1,630 of 13,199)
> Overall homelessness: 13,199 (10 in every 10,000 people — 22nd most)
> Change in overall homelessness 2018-2019: -2.3% (27th largest decrease)
> Change in overall homelessness 2007-2019: -18.6% (12th smallest decrease)
> Poverty rate: 12.0% (22nd highest)
> Households with annual income less than $10,000: 6.0% (17th highest)
[in-text-ad-2]
36. Alaska
> Homeless individuals w/o shelter: 14.3% (273 of 1,907)
> Overall homelessness: 1,907 (26 in every 10,000 people — 7th most)
> Change in overall homelessness 2018-2019: -5.4% (15th largest decrease)
> Change in overall homelessness 2007-2019: +16.1% (6th largest increase)
> Poverty rate: 10.1% (14th lowest)
> Households with annual income less than $10,000: 4.1% (4th lowest)
35. Ohio
> Homeless individuals w/o shelter: 14.6% (1,507 of 10,345)
> Overall homelessness: 10,345 (9 in every 10,000 people — 16th fewest)
> Change in overall homelessness 2018-2019: +0.9% (18th largest increase)
> Change in overall homelessness 2007-2019: -8.2% (5th smallest decrease)
> Poverty rate: 13.1% (15th highest)
> Households with annual income less than $10,000: 6.3% (11th highest)
[in-text-ad]
34. Utah
> Homeless individuals w/o shelter: 14.6% (408 of 2,798)
> Overall homelessness: 2,798 (9 in every 10,000 people — 15th fewest)
> Change in overall homelessness 2018-2019: -2.7% (26th largest decrease)
> Change in overall homelessness 2007-2019: -7.1% (3rd smallest decrease)
> Poverty rate: 8.9% (2nd lowest)
> Households with annual income less than $10,000: 3.6% (the lowest)
[recirclink id=824344]

33. Virginia
> Homeless individuals w/o shelter: 14.9% (859 of 5,783)
> Overall homelessness: 5,783 (7 in every 10,000 people — 4th fewest)
> Change in overall homelessness 2018-2019: -3.2% (25th largest decrease)
> Change in overall homelessness 2007-2019: -40.7% (8th largest decrease)
> Poverty rate: 9.9% (11th lowest)
> Households with annual income less than $10,000: 4.8% (14th lowest)
32. Connecticut
> Homeless individuals w/o shelter: 15.0% (456 of 3,033)
> Overall homelessness: 3,033 (9 in every 10,000 people — 13th fewest)
> Change in overall homelessness 2018-2019: -23.7% (the largest decrease)
> Change in overall homelessness 2007-2019: -32.3% (16th largest decrease)
> Poverty rate: 10.0% (12th lowest)
> Households with annual income less than $10,000: 5.3% (22nd lowest)
[in-text-ad-2]
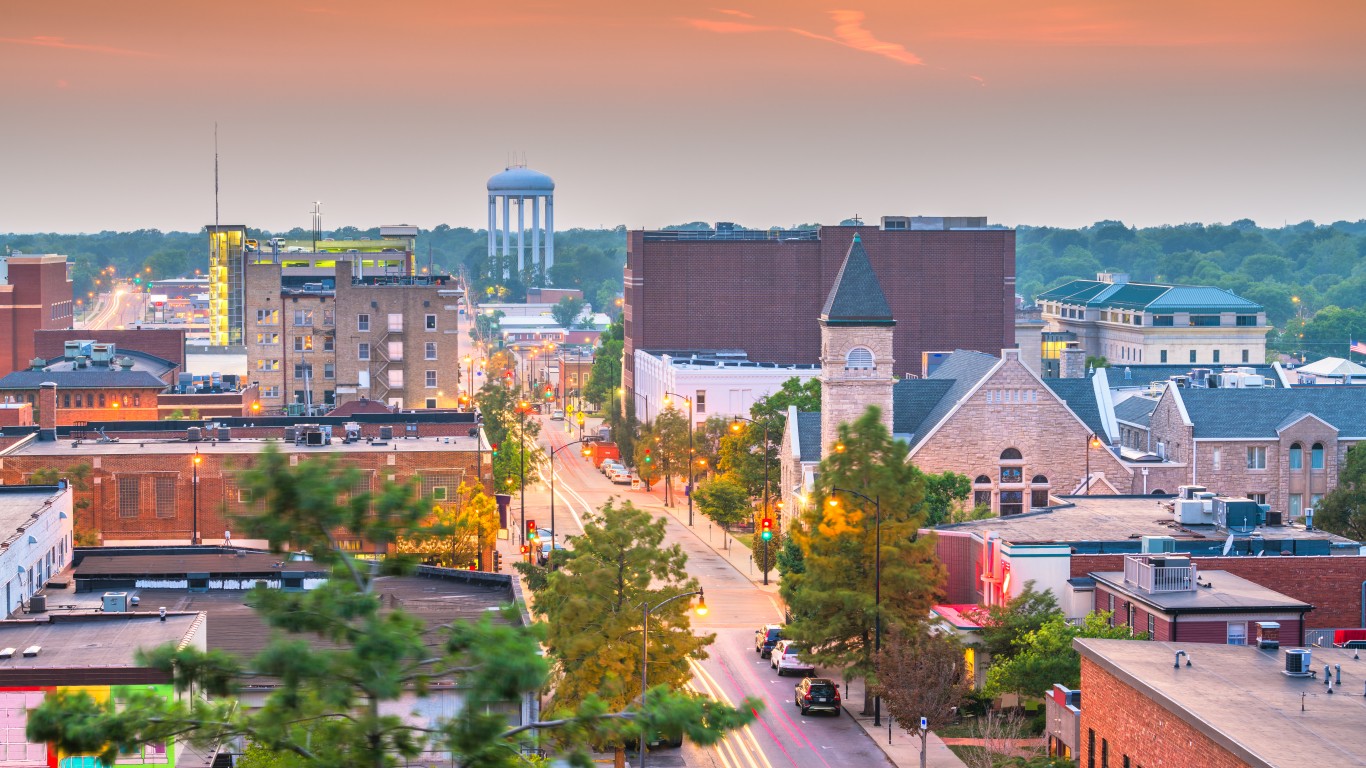
31. Missouri
> Homeless individuals w/o shelter: 15.8% (976 of 6,179)
> Overall homelessness: 6,179 (10 in every 10,000 people — 24th most)
> Change in overall homelessness 2018-2019: +5.0% (11th largest increase)
> Change in overall homelessness 2007-2019: -1.1% (the smallest decrease)
> Poverty rate: 12.9% (18th highest)
> Households with annual income less than $10,000: 6.3% (11th highest)
30. New Jersey
> Homeless individuals w/o shelter: 16.7% (1,482 of 8,862)
> Overall homelessness: 8,862 (10 in every 10,000 people — 25th most)
> Change in overall homelessness 2018-2019: -5.7% (14th largest decrease)
> Change in overall homelessness 2007-2019: -48.8% (3rd largest decrease)
> Poverty rate: 9.2% (5th lowest)
> Households with annual income less than $10,000: 4.7% (11th lowest)
[in-text-ad]
29. West Virginia
> Homeless individuals w/o shelter: 17.8% (248 of 1,397)
> Overall homelessness: 1,397 (8 in every 10,000 people — 8th fewest)
> Change in overall homelessness 2018-2019: +12.4% (4th largest increase)
> Change in overall homelessness 2007-2019: -42.0% (6th largest decrease)
> Poverty rate: 16.0% (6th highest)
> Households with annual income less than $10,000: 8.5% (3rd highest)
[recirclink id=824056]
28. Illinois
> Homeless individuals w/o shelter: 18.5% (1,889 of 10,199)
> Overall homelessness: 10,199 (8 in every 10,000 people — 9th fewest)
> Change in overall homelessness 2018-2019: -4.2% (20th largest decrease)
> Change in overall homelessness 2007-2019: -34.1% (12th largest decrease)
> Poverty rate: 11.5% (25th lowest)
> Households with annual income less than $10,000: 5.9% (20th highest)
27. Kentucky
> Homeless individuals w/o shelter: 19.1% (779 of 4,079)
> Overall homelessness: 4,079 (9 in every 10,000 people — 20th fewest)
> Change in overall homelessness 2018-2019: +10.6% (5th largest increase)
> Change in overall homelessness 2007-2019: -49.4% (2nd largest decrease)
> Poverty rate: 16.3% (4th highest)
> Households with annual income less than $10,000: 7.9% (6th highest)
[in-text-ad-2]
26. Kansas
> Homeless individuals w/o shelter: 19.9% (475 of 2,381)
> Overall homelessness: 2,381 (8 in every 10,000 people — 12th fewest)
> Change in overall homelessness 2018-2019: +7.4% (9th largest increase)
> Change in overall homelessness 2007-2019: +12.8% (7th largest increase)
> Poverty rate: 11.4% (24th lowest)
> Households with annual income less than $10,000: 5.1% (20th lowest)
25. Maryland
> Homeless individuals w/o shelter: 20.5% (1,348 of 6,561)
> Overall homelessness: 6,561 (11 in every 10,000 people — 21st most)
> Change in overall homelessness 2018-2019: -8.2% (11th largest decrease)
> Change in overall homelessness 2007-2019: -31.9% (17th largest decrease)
> Poverty rate: 9.0% (4th lowest)
> Households with annual income less than $10,000: 4.8% (14th lowest)
[in-text-ad]

24. Minnesota
> Homeless individuals w/o shelter: 20.7% (1,653 of 7,977)
> Overall homelessness: 7,977 (14 in every 10,000 people — 13th most)
> Change in overall homelessness 2018-2019: +10.1% (6th largest increase)
> Change in overall homelessness 2007-2019: +8.9% (8th largest increase)
> Poverty rate: 9.0% (4th lowest)
> Households with annual income less than $10,000: 4.1% (4th lowest)
[recirclink id=824127]
23. Colorado
> Homeless individuals w/o shelter: 22.7% (2,188 of 9,619)
> Overall homelessness: 9,619 (17 in every 10,000 people — 10th most)
> Change in overall homelessness 2018-2019: -11.4% (9th largest decrease)
> Change in overall homelessness 2007-2019: -32.4% (15th largest decrease)
> Poverty rate: 9.3% (7th lowest)
> Households with annual income less than $10,000: 4.6% (9th lowest)
22. Wyoming
> Homeless individuals w/o shelter: 22.8% (125 of 548)
> Overall homelessness: 548 (9 in every 10,000 people — 22nd fewest)
> Change in overall homelessness 2018-2019: -14.2% (6th largest decrease)
> Change in overall homelessness 2007-2019: +2.0% (13th largest increase)
> Poverty rate: 10.1% (14th lowest)
> Households with annual income less than $10,000: 5.0% (16th lowest)
[in-text-ad-2]
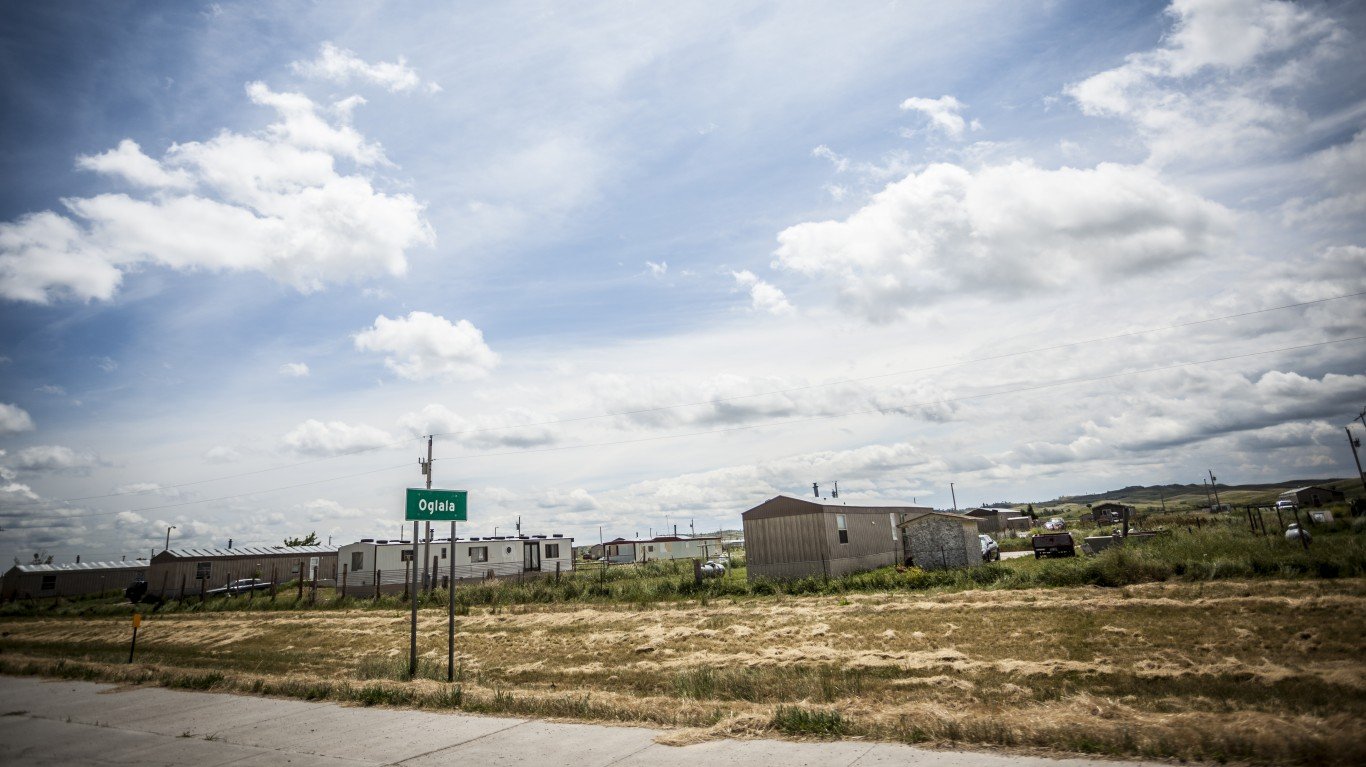
21. South Dakota
> Homeless individuals w/o shelter: 23.5% (234 of 995)
> Overall homelessness: 995 (11 in every 10,000 people — 19th most)
> Change in overall homelessness 2018-2019: -14.2% (7th largest decrease)
> Change in overall homelessness 2007-2019: +71.8% (the largest increase)
> Poverty rate: 11.9% (23rd highest)
> Households with annual income less than $10,000: 4.7% (11th lowest)
20. North Carolina
> Homeless individuals w/o shelter: 24.4% (2,268 of 9,314)
> Overall homelessness: 9,314 (9 in every 10,000 people — 17th fewest)
> Change in overall homelessness 2018-2019: +0.5% (19th largest increase)
> Change in overall homelessness 2007-2019: -21.1% (15th smallest decrease)
> Poverty rate: 13.6% (11th highest)
> Households with annual income less than $10,000: 6.2% (13th highest)
[in-text-ad]
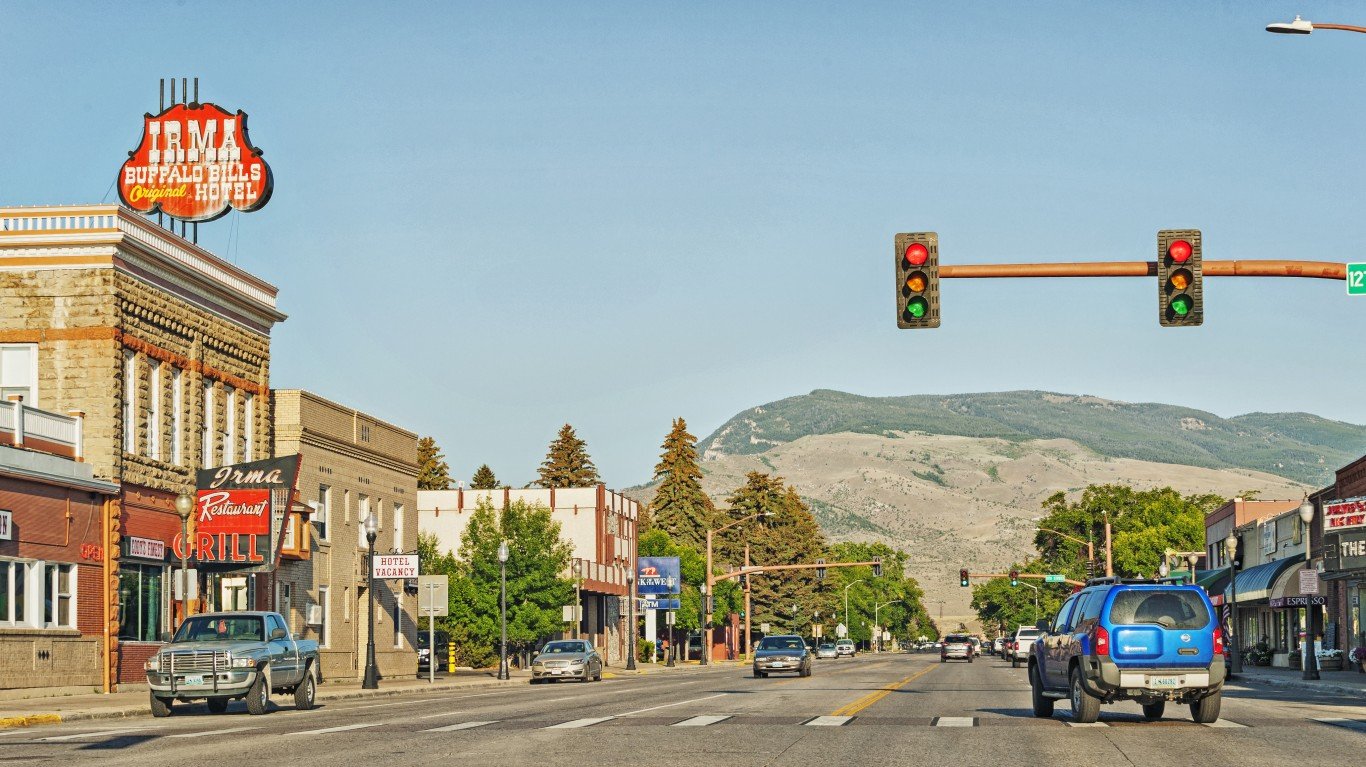
19. Montana
> Homeless individuals w/o shelter: 25.4% (345 of 1,357)
> Overall homelessness: 1,357 (13 in every 10,000 people — 17th most)
> Change in overall homelessness 2018-2019: -3.4% (23rd largest decrease)
> Change in overall homelessness 2007-2019: +18.0% (5th largest increase)
> Poverty rate: 12.6% (20th highest)
> Households with annual income less than $10,000: 5.4% (25th highest)
[recirclink id=824127]
18. Oklahoma
> Homeless individuals w/o shelter: 31.4% (1,237 of 3,944)
> Overall homelessness: 3,944 (10 in every 10,000 people — 25th fewest)
> Change in overall homelessness 2018-2019: +1.9% (16th largest increase)
> Change in overall homelessness 2007-2019: -6.6% (2nd smallest decrease)
> Poverty rate: 15.2% (8th highest)
> Households with annual income less than $10,000: 6.9% (9th highest)
17. Louisiana
> Homeless individuals w/o shelter: 33.1% (974 of 2,941)
> Overall homelessness: 2,941 (6 in every 10,000 people — 2nd fewest)
> Change in overall homelessness 2018-2019: -3.9% (21st largest decrease)
> Change in overall homelessness 2007-2019: -46.5% (5th largest decrease)
> Poverty rate: 19.0% (2nd highest)
> Households with annual income less than $10,000: 10.1% (the highest)
[in-text-ad-2]
16. Tennessee
> Homeless individuals w/o shelter: 34.8% (2,598 of 7,467)
> Overall homelessness: 7,467 (11 in every 10,000 people — 20th most)
> Change in overall homelessness 2018-2019: -5.3% (16th largest decrease)
> Change in overall homelessness 2007-2019: -33.4% (13th largest decrease)
> Poverty rate: 13.9% (9th highest)
> Households with annual income less than $10,000: 6.2% (13th highest)
15. Alabama
> Homeless individuals w/o shelter: 36.5% (1,191 of 3,261)
> Overall homelessness: 3,261 (7 in every 10,000 people — 3rd fewest)
> Change in overall homelessness 2018-2019: -5.0% (17th largest decrease)
> Change in overall homelessness 2007-2019: -40.2% (9th largest decrease)
> Poverty rate: 15.5% (7th highest)
> Households with annual income less than $10,000: 8.1% (5th highest)
[in-text-ad]
14. Georgia
> Homeless individuals w/o shelter: 37.2% (3,880 of 10,443)
> Overall homelessness: 10,443 (10 in every 10,000 people — 23rd fewest)
> Change in overall homelessness 2018-2019: +9.9% (7th largest increase)
> Change in overall homelessness 2007-2019: -46.8% (4th largest decrease)
> Poverty rate: 13.3% (14th highest)
> Households with annual income less than $10,000: 6.2% (13th highest)
[recirclink id=824684]
13. New Mexico
> Homeless individuals w/o shelter: 38.8% (1,259 of 3,241)
> Overall homelessness: 3,241 (15 in every 10,000 people — 12th most)
> Change in overall homelessness 2018-2019: +27.0% (the largest increase)
> Change in overall homelessness 2007-2019: +7.5% (10th largest increase)
> Poverty rate: 18.2% (3rd highest)
> Households with annual income less than $10,000: 8.3% (4th highest)
12. Mississippi
> Homeless individuals w/o shelter: 41.0% (486 of 1,184)
> Overall homelessness: 1,184 (4 in every 10,000 people — the fewest)
> Change in overall homelessness 2018-2019: -12.4% (8th largest decrease)
> Change in overall homelessness 2007-2019: -14.0% (9th smallest decrease)
> Poverty rate: 19.6% (the highest)
> Households with annual income less than $10,000: 9.3% (2nd highest)
[in-text-ad-2]
11. South Carolina
> Homeless individuals w/o shelter: 41.2% (1,717 of 4,172)
> Overall homelessness: 4,172 (8 in every 10,000 people — 10th fewest)
> Change in overall homelessness 2018-2019: +6.1% (10th largest increase)
> Change in overall homelessness 2007-2019: -26.3% (18th smallest decrease)
> Poverty rate: 13.8% (10th highest)
> Households with annual income less than $10,000: 7.2% (7th highest)
10. Idaho
> Homeless individuals w/o shelter: 42.5% (985 of 2,315)
> Overall homelessness: 2,315 (13 in every 10,000 people — 16th most)
> Change in overall homelessness 2018-2019: +15.1% (3rd largest increase)
> Change in overall homelessness 2007-2019: +32.4% (3rd largest increase)
> Poverty rate: 11.2% (21st lowest)
> Households with annual income less than $10,000: 4.2% (5th lowest)
[in-text-ad]
9. Texas
> Homeless individuals w/o shelter: 43.4% (11,222 of 25,848)
> Overall homelessness: 25,848 (9 in every 10,000 people — 18th fewest)
> Change in overall homelessness 2018-2019: +2.1% (15th largest increase)
> Change in overall homelessness 2007-2019: -35.0% (11th largest decrease)
> Poverty rate: 13.6% (11th highest)
> Households with annual income less than $10,000: 5.9% (20th highest)
[recirclink id=824344]
8. Florida
> Homeless individuals w/o shelter: 44.0% (12,476 of 28,328)
> Overall homelessness: 28,328 (13 in every 10,000 people — 15th most)
> Change in overall homelessness 2018-2019: -8.7% (10th largest decrease)
> Change in overall homelessness 2007-2019: -41.1% (7th largest decrease)
> Poverty rate: 12.7% (19th highest)
> Households with annual income less than $10,000: 6.0% (17th highest)
7. Washington
> Homeless individuals w/o shelter: 44.3% (9,557 of 21,577)
> Overall homelessness: 21,577 (28 in every 10,000 people — 5th most)
> Change in overall homelessness 2018-2019: -3.3% (24th largest decrease)
> Change in overall homelessness 2007-2019: -7.7% (4th smallest decrease)
> Poverty rate: 9.8% (9th lowest)
> Households with annual income less than $10,000: 4.4% (7th lowest)
[in-text-ad-2]
6. Arizona
> Homeless individuals w/o shelter: 45.3% (4,532 of 10,007)
> Overall homelessness: 10,007 (14 in every 10,000 people — 14th most)
> Change in overall homelessness 2018-2019: +1.4% (17th largest increase)
> Change in overall homelessness 2007-2019: -31.7% (18th largest decrease)
> Poverty rate: 13.5% (13th highest)
> Households with annual income less than $10,000: 5.9% (20th highest)
5. Arkansas
> Homeless individuals w/o shelter: 52.1% (1,415 of 2,717)
> Overall homelessness: 2,717 (9 in every 10,000 people — 19th fewest)
> Change in overall homelessness 2018-2019: +0.2% (21st largest increase)
> Change in overall homelessness 2007-2019: -29.2% (19th largest decrease)
> Poverty rate: 16.2% (5th highest)
> Households with annual income less than $10,000: 7.1% (8th highest)
[in-text-ad]
4. Nevada
> Homeless individuals w/o shelter: 53.1% (3,807 of 7,169)
> Overall homelessness: 7,169 (23 in every 10,000 people — 8th most)
> Change in overall homelessness 2018-2019: -5.0% (18th largest decrease)
> Change in overall homelessness 2007-2019: -17.0% (11th smallest decrease)
> Poverty rate: 12.5% (21st highest)
> Households with annual income less than $10,000: 6.0% (17th highest)
[recirclink id=824056]

3. Hawaii
> Homeless individuals w/o shelter: 56.8% (3,640 of 6,412)
> Overall homelessness: 6,412 (45 in every 10,000 people — 2nd most)
> Change in overall homelessness 2018-2019: -1.8% (29th largest decrease)
> Change in overall homelessness 2007-2019: +5.6% (11th largest increase)
> Poverty rate: 9.3% (7th lowest)
> Households with annual income less than $10,000: 5.0% (16th lowest)
2. Oregon
> Homeless individuals w/o shelter: 63.9% (10,142 of 15,876)
> Overall homelessness: 15,876 (38 in every 10,000 people — 4th most)
> Change in overall homelessness 2018-2019: +9.7% (8th largest increase)
> Change in overall homelessness 2007-2019: -9.7% (6th smallest decrease)
> Poverty rate: 11.4% (24th lowest)
> Households with annual income less than $10,000: 5.4% (25th highest)
[in-text-ad-2]
1. California
> Homeless individuals w/o shelter: 71.7% (108,432 of 151,278)
> Overall homelessness: 151,278 (38 in every 10,000 people — 3rd most)
> Change in overall homelessness 2018-2019: +16.4% (2nd largest increase)
> Change in overall homelessness 2007-2019: +8.8% (9th largest increase)
> Poverty rate: 11.8% (25th highest)
> Households with annual income less than $10,000: 4.6% (9th lowest)
Methodology
To identify the states with the most unsheltered homeless people, 24/7 Wall St. reviewed the percentage of each state’s homeless population that is unsheltered from The Department of Housing and Urban Development (HUD)’s report, “The 2019 Annual Homeless Assessment Report (AHAR) to Congress Part 1: Point-in-Time Estimates of Homelessness.” In part 1, HUD provides a snapshot of homelessness on a single night. The one-night counts are conducted in late January of each year. These are the most recent available data. Shelters include emergency shelters, transitional housing programs, safe havens, rapid re-housing programs. Percentage of homeless people in families with children, and the level of chronic homelessness — those who have been homeless for one year or more — also came from the HUD.
We also reviewed for each state the median annual household income, poverty rates, median home values, and the share of households receiving SNAP benefits (food stamps) from the U.S. Census Bureau’s 2019 American Community Survey. Cost of living in each state was obtained from the U.S. Bureau of Economic Analysis.