
As more and more Americans reach retirement age, an increasing number of people use their pension as their main source of income. Pensions are retirement plans that guarantee incomes to retired employees. While pensions have become more rare in the private sector, governments still usually offer them. Employers are either fully or partially responsible for funding and investing the plan that is then paid back as income in retirement.
However, nearly every state is facing a pension shortfall. States have a combined $4.2 trillion in pension liabilities, but less than $3 trillion in assets set aside to pay for those pensions. The typical state has enough money to pay just over 70% of the pensions it owes. With such a large funding shortfall — and an estimated 10,000 people hitting the retirement age of 65 each day — states are headed for a pension crisis
To rank the severity of each state’s pension crisis, 24/7 Wall St. reviewed the average pension funding ratio — the market value of a pension fund as a share of the total benefits owed to current or retired public employees — for all 50 states as of 2018 with data from nongovernmental organization The Pew Charitable Trusts.
Only one state has fully funded pensions, based on 2018 data, the most recent year of available data. Six other states have over 90% of all pensions funded, yet four states do not have the money to meet even half of their pensions obligations. The funding gap is anywhere from $1.1 billion to $184 billion.
Pension funding shortfalls have long been an issue, and they have only gotten more severe in 2020. Several states asked for federal help to fund their pensions but were rebuffed as Congress declined to provide aid for issues other than COVID-19-related relief. Congress has yet to pass a second COVID-19 stimulus bill after passing one earlier this year.
This pension funding shortfall could potentially affect millions of Americans — 13.1% of all workers in the country are employed by state and local governments. Like those in nearly every other line of work, government employees have been hit hard by the pandemic. The number of government workers declined by 3.7% nationwide from Sept. 2019 to Sept. 2020. These are the cities with the worst COVID-29 unemployment crisis right now.
Click here to see every state’s pension crisis ranked.
Click here to read our detailed methodology.

50. South Dakota
> Funded ratio: 100.0%
> Total pension shortfall: $2.3 million surplus (the only surplus)
> Gov’t workers as share of total workforce: 15.6% (12th highest)
> Avg. annual payout per public retiree: $20,994 (16th lowest)
[in-text-ad]

49. New York
> Funded ratio: 98.0%
> Total pension shortfall: $4.2 billion shortfall (12th smallest)
> Gov’t workers as share of total workforce: 14.0% (23rd highest)
> Avg. annual payout per public retiree: $33,040 (7th highest)
[recirclink id=488456]

48. Tennessee
> Funded ratio: 97.7%
> Total pension shortfall: $1.1 billion shortfall (2nd smallest)
> Gov’t workers as share of total workforce: 12.4% (9th lowest)
> Avg. annual payout per public retiree: $17,270 (3rd lowest)
47. Wisconsin
> Funded ratio: 96.5%
> Total pension shortfall: $3.6 billion shortfall (10th smallest)
> Gov’t workers as share of total workforce: 12.6% (11th lowest)
> Avg. annual payout per public retiree: $26,703 (15th highest)
[in-text-ad-2]

46. Washington
> Funded ratio: 93.9%
> Total pension shortfall: $6.0 billion shortfall (17th smallest)
> Gov’t workers as share of total workforce: 14.8% (19th highest)
> Avg. annual payout per public retiree: $19,977 (10th lowest)

45. Idaho
> Funded ratio: 92.4%
> Total pension shortfall: $1.4 billion shortfall (3rd smallest)
> Gov’t workers as share of total workforce: 15.0% (17th highest)
> Avg. annual payout per public retiree: $22,386 (19th lowest)
[in-text-ad]

44. Nebraska
> Funded ratio: 90.3%
> Total pension shortfall: $1.5 billion shortfall (4th smallest)
> Gov’t workers as share of total workforce: 15.2% (15th highest)
> Avg. annual payout per public retiree: $24,812 (19th highest)
[recirclink id=488594]

43. North Carolina
> Funded ratio: 88.6%
> Total pension shortfall: $12.5 billion shortfall (23rd smallest)
> Gov’t workers as share of total workforce: 14.4% (21st highest)
> Avg. annual payout per public retiree: $19,913 (8th lowest)
42. Utah
> Funded ratio: 85.2%
> Total pension shortfall: $5.4 billion shortfall (15th smallest)
> Gov’t workers as share of total workforce: 13.9% (25th lowest)
> Avg. annual payout per public retiree: $24,809 (20th highest)
[in-text-ad-2]

41. Delaware
> Funded ratio: 85.1%
> Total pension shortfall: $1.8 billion shortfall (5th smallest)
> Gov’t workers as share of total workforce: 13.1% (18th lowest)
> Avg. annual payout per public retiree: $23,433 (24th lowest)

40. Maine
> Funded ratio: 84.5%
> Total pension shortfall: $2.7 billion shortfall (7th smallest)
> Gov’t workers as share of total workforce: 13.4% (21st lowest)
> Avg. annual payout per public retiree: $21,524 (18th lowest)
[in-text-ad]

39. Iowa
> Funded ratio: 83.6%
> Total pension shortfall: $6.5 billion shortfall (18th smallest)
> Gov’t workers as share of total workforce: 15.3% (14th highest)
> Avg. annual payout per public retiree: $17,855 (5th lowest)
[recirclink id=488561]

38. West Virginia
> Funded ratio: 82.3%
> Total pension shortfall: $3.4 billion shortfall (9th smallest)
> Gov’t workers as share of total workforce: 17.8% (6th highest)
> Avg. annual payout per public retiree: $17,290 (4th lowest)

37. Oregon
> Funded ratio: 82.1%
> Total pension shortfall: $15.1 billion shortfall (24th largest)
> Gov’t workers as share of total workforce: 13.9% (25th highest)
> Avg. annual payout per public retiree: $33,397 (6th highest)
[in-text-ad-2]

36. Minnesota
> Funded ratio: 81.8%
> Total pension shortfall: $15.2 billion shortfall (23rd largest)
> Gov’t workers as share of total workforce: 13.2% (19th lowest)
> Avg. annual payout per public retiree: $18,256 (6th lowest)
35. Oklahoma
> Funded ratio: 81.3%
> Total pension shortfall: $7.4 billion shortfall (21st smallest)
> Gov’t workers as share of total workforce: 17.8% (5th highest)
> Avg. annual payout per public retiree: $20,442 (14th lowest)
[in-text-ad]

34. Arkansas
> Funded ratio: 81.2%
> Total pension shortfall: $6.5 billion shortfall (19th smallest)
> Gov’t workers as share of total workforce: 15.0% (18th highest)
> Avg. annual payout per public retiree: $20,302 (13th lowest)
[recirclink id=488514]
33. Georgia
> Funded ratio: 80.1%
> Total pension shortfall: $22.9 billion shortfall (15th largest)
> Gov’t workers as share of total workforce: 12.7% (14th lowest)
> Avg. annual payout per public retiree: $27,122 (14th highest)

32. Florida
> Funded ratio: 79.9%
> Total pension shortfall: $40.7 billion shortfall (7th largest)
> Gov’t workers as share of total workforce: 10.9% (4th lowest)
> Avg. annual payout per public retiree: $24,013 (23rd highest)
[in-text-ad-2]

31. Virginia
> Funded ratio: 79.0%
> Total pension shortfall: $20.3 billion shortfall (17th largest)
> Gov’t workers as share of total workforce: 13.5% (22nd lowest)
> Avg. annual payout per public retiree: $22,461 (20th lowest)

30. Missouri
> Funded ratio: 77.8%
> Total pension shortfall: $16.6 billion shortfall (21st largest)
> Gov’t workers as share of total workforce: 13.1% (17th lowest)
> Avg. annual payout per public retiree: $23,582 (25th highest)
[in-text-ad]
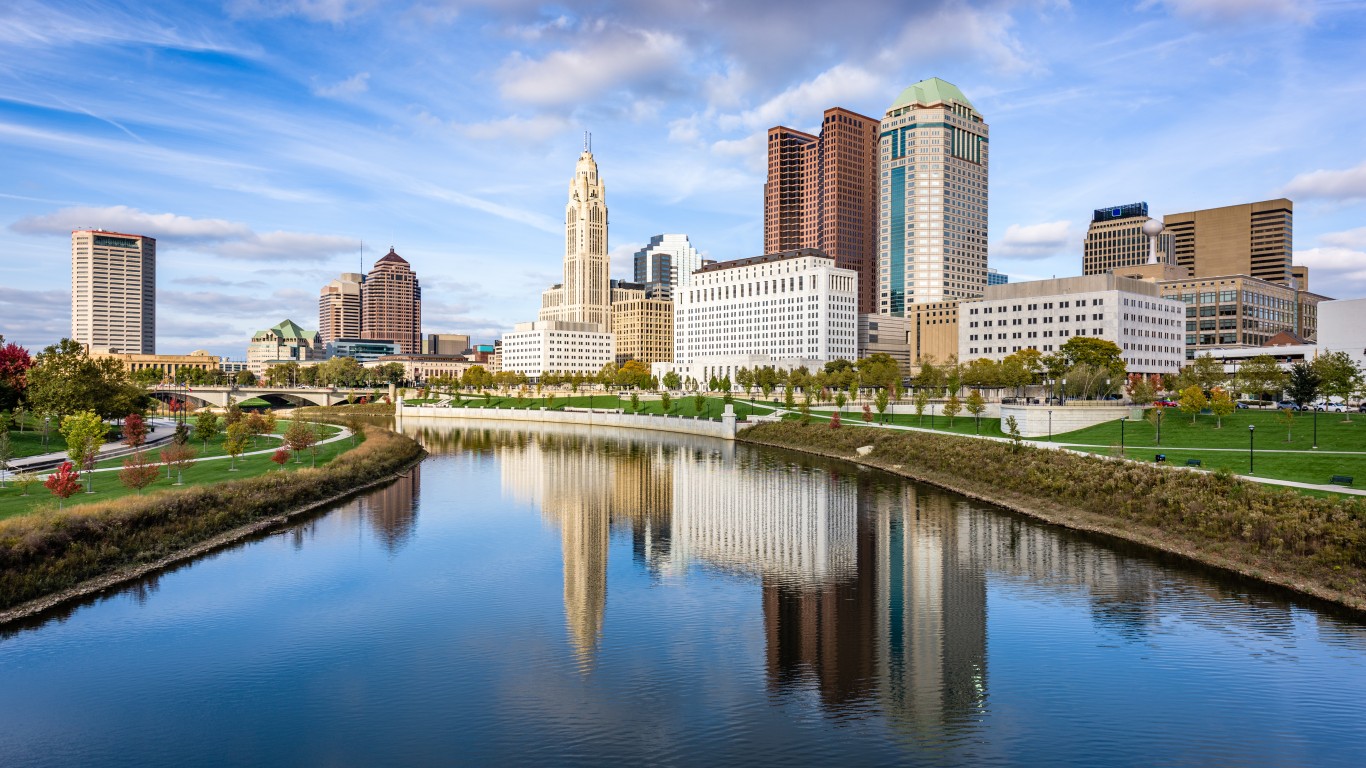
29. Ohio
> Funded ratio: 75.8%
> Total pension shortfall: $50.0 billion shortfall (6th largest)
> Gov’t workers as share of total workforce: 12.6% (12th lowest)
> Avg. annual payout per public retiree: $31,861 (10th highest)
[recirclink id=488498]
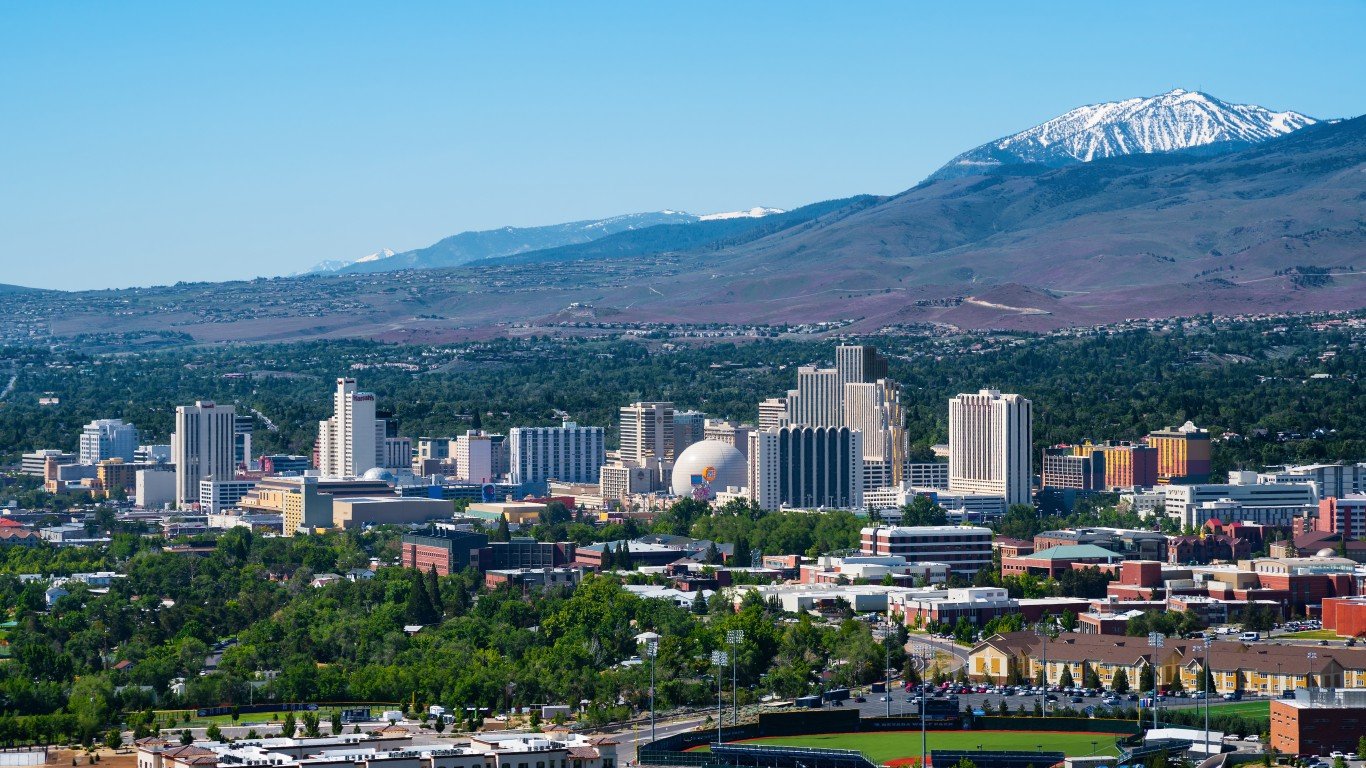
28. Nevada
> Funded ratio: 75.3%
> Total pension shortfall: $13.7 billion shortfall (25th smallest)
> Gov’t workers as share of total workforce: 10.3% (2nd lowest)
> Avg. annual payout per public retiree: $34,926 (4th highest)

27. Montana
> Funded ratio: 72.6%
> Total pension shortfall: $4.4 billion shortfall (13th smallest)
> Gov’t workers as share of total workforce: 16.0% (10th highest)
> Avg. annual payout per public retiree: $20,225 (11th lowest)
[in-text-ad-2]

26. Alabama
> Funded ratio: 71.9%
> Total pension shortfall: $15.2 billion shortfall (22nd largest)
> Gov’t workers as share of total workforce: 16.3% (9th highest)
> Avg. annual payout per public retiree: $23,091 (22nd lowest)

25. California
> Funded ratio: 71.1%
> Total pension shortfall: $184.9 billion shortfall (the largest)
> Gov’t workers as share of total workforce: 13.5% (23rd lowest)
> Avg. annual payout per public retiree: $36,351 (3rd highest)
[in-text-ad]

24. Texas
> Funded ratio: 70.6%
> Total pension shortfall: $76.5 billion shortfall (4th largest)
> Gov’t workers as share of total workforce: 13.8% (24th lowest)
> Avg. annual payout per public retiree: $23,476 (25th lowest)
[recirclink id=488094]

23. Maryland
> Funded ratio: 70.4%
> Total pension shortfall: $22.0 billion shortfall (16th largest)
> Gov’t workers as share of total workforce: 13.0% (16th lowest)
> Avg. annual payout per public retiree: $26,043 (18th highest)

22. Kansas
> Funded ratio: 68.9%
> Total pension shortfall: $8.9 billion shortfall (22nd smallest)
> Gov’t workers as share of total workforce: 16.5% (8th highest)
> Avg. annual payout per public retiree: $16,802 (the lowest)
[in-text-ad-2]
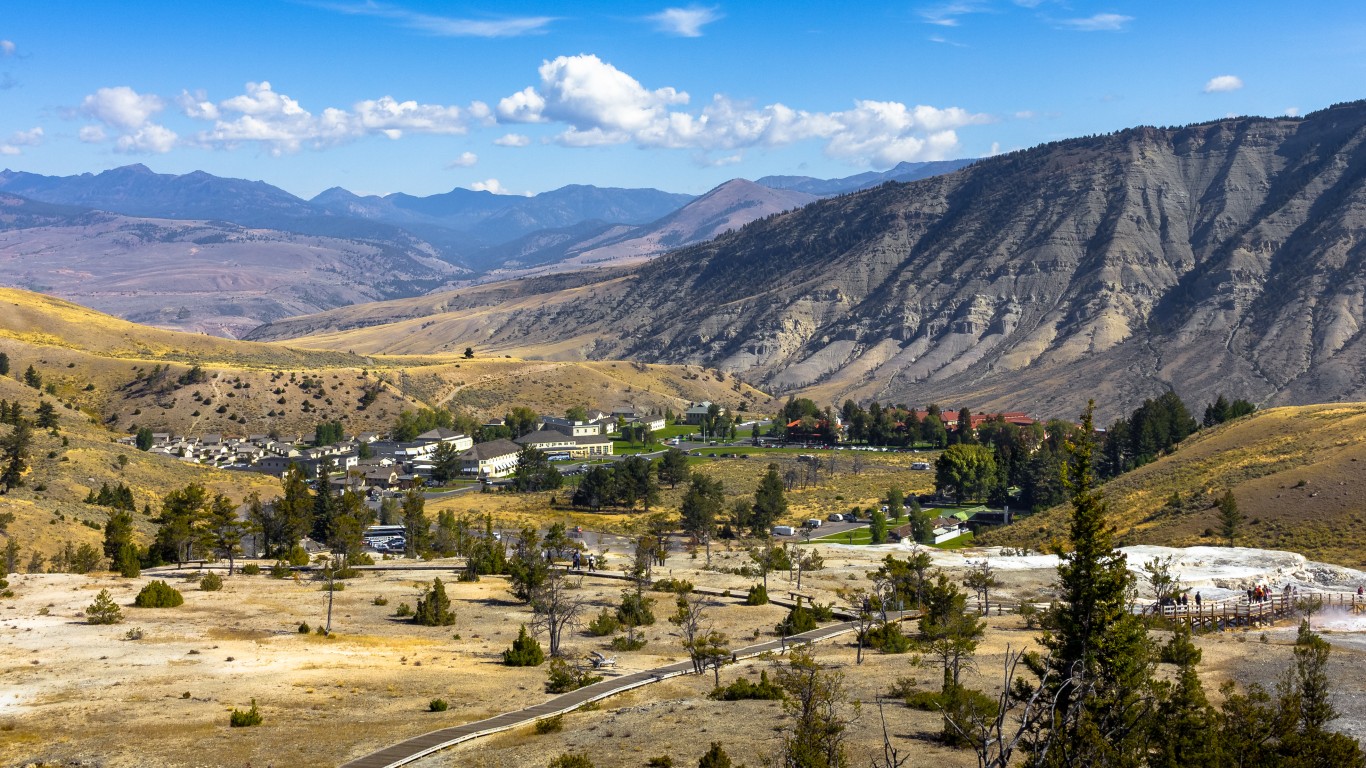
21. Wyoming
> Funded ratio: 68.5%
> Total pension shortfall: $3.6 billion shortfall (11th smallest)
> Gov’t workers as share of total workforce: 21.2% (the highest)
> Avg. annual payout per public retiree: $19,921 (9th lowest)
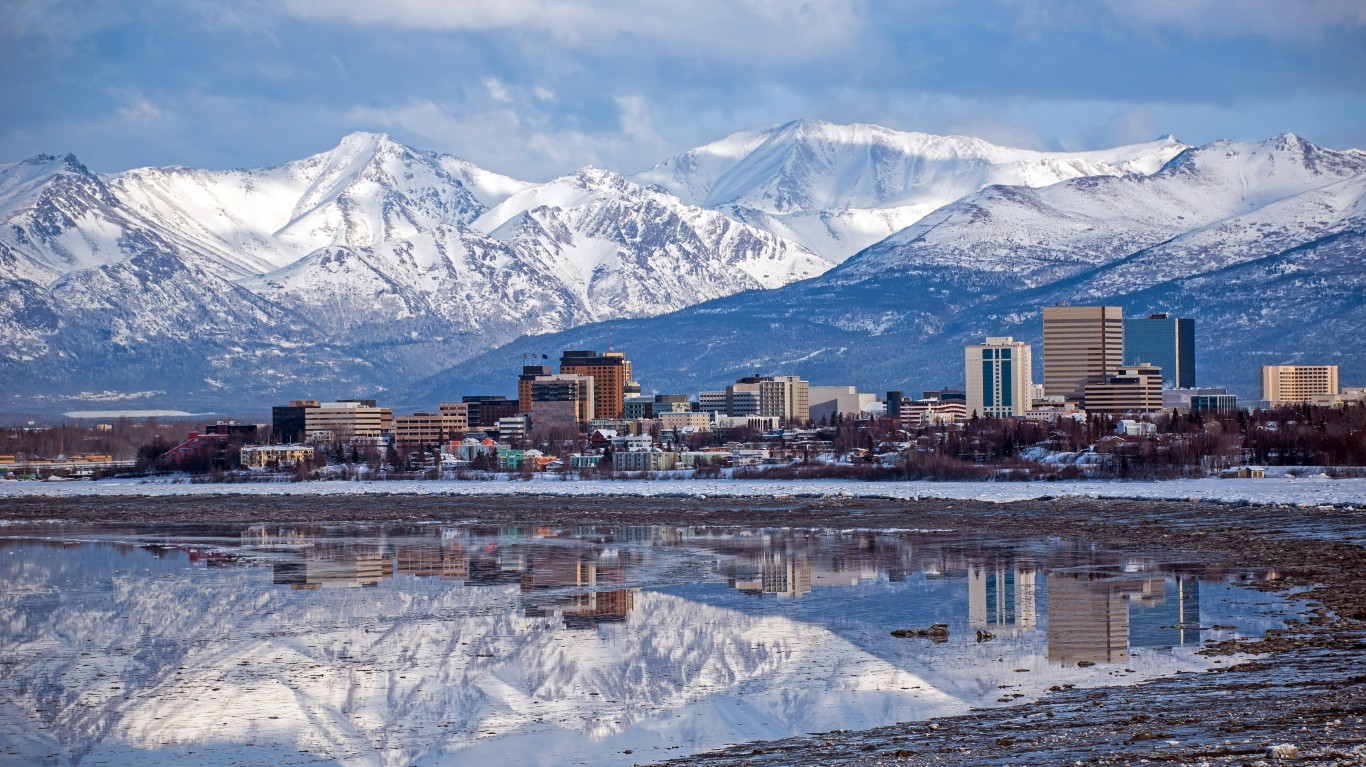
20. Alaska
> Funded ratio: 68.4%
> Total pension shortfall: $6.9 billion shortfall (20th smallest)
> Gov’t workers as share of total workforce: 19.7% (2nd highest)
> Avg. annual payout per public retiree: $26,362 (16th highest)
[in-text-ad]

19. Louisiana
> Funded ratio: 67.3%
> Total pension shortfall: $17.6 billion shortfall (19th largest)
> Gov’t workers as share of total workforce: 15.1% (16th highest)
> Avg. annual payout per public retiree: $24,658 (21st highest)
[recirclink id=488247]
18. Indiana
> Funded ratio: 66.5%
> Total pension shortfall: $14.6 billion shortfall (25th largest)
> Gov’t workers as share of total workforce: 12.3% (8th lowest)
> Avg. annual payout per public retiree: $16,974 (2nd lowest)

17. Arizona
> Funded ratio: 65.5%
> Total pension shortfall: $25.2 billion shortfall (14th largest)
> Gov’t workers as share of total workforce: 12.5% (10th lowest)
> Avg. annual payout per public retiree: $23,907 (24th highest)
[in-text-ad-2]

16. North Dakota
> Funded ratio: 65.2%
> Total pension shortfall: $3.0 billion shortfall (8th smallest)
> Gov’t workers as share of total workforce: 16.8% (7th highest)
> Avg. annual payout per public retiree: $19,265 (7th lowest)

15. New Hampshire
> Funded ratio: 64.7%
> Total pension shortfall: $4.9 billion shortfall (14th smallest)
> Gov’t workers as share of total workforce: 12.0% (6th lowest)
> Avg. annual payout per public retiree: $22,989 (21st lowest)
[in-text-ad]

14. Vermont
> Funded ratio: 64.2%
> Total pension shortfall: $2.4 billion shortfall (6th smallest)
> Gov’t workers as share of total workforce: 15.7% (11th highest)
> Avg. annual payout per public retiree: $20,301 (12th lowest)
[recirclink id=488174]

13. Michigan
> Funded ratio: 63.2%
> Total pension shortfall: $37.6 billion shortfall (8th largest)
> Gov’t workers as share of total workforce: 12.7% (13th lowest)
> Avg. annual payout per public retiree: $23,257 (23rd lowest)

12. Mississippi
> Funded ratio: 62.6%
> Total pension shortfall: $16.8 billion shortfall (20th largest)
> Gov’t workers as share of total workforce: 18.7% (3rd highest)
> Avg. annual payout per public retiree: $24,362 (22nd highest)
[in-text-ad-2]

11. New Mexico
> Funded ratio: 61.0%
> Total pension shortfall: $18.2 billion shortfall (18th largest)
> Gov’t workers as share of total workforce: 18.6% (4th highest)
> Avg. annual payout per public retiree: $20,907 (15th lowest)

10. Massachusetts
> Funded ratio: 60.6%
> Total pension shortfall: $36.9 billion shortfall (9th largest)
> Gov’t workers as share of total workforce: 11.2% (5th lowest)
> Avg. annual payout per public retiree: $31,510 (11th highest)
[in-text-ad]

9. Colorado
> Funded ratio: 58.8%
> Total pension shortfall: $31.5 billion shortfall (11th largest)
> Gov’t workers as share of total workforce: 14.4% (20th highest)
> Avg. annual payout per public retiree: $34,817 (5th highest)
[recirclink id=487977]

8. Hawaii
> Funded ratio: 55.5%
> Total pension shortfall: $13.3 billion shortfall (24th smallest)
> Gov’t workers as share of total workforce: 14.0% (24th highest)
> Avg. annual payout per public retiree: $28,627 (12th highest)

7. South Carolina
> Funded ratio: 55.1%
> Total pension shortfall: $25.5 billion shortfall (13th largest)
> Gov’t workers as share of total workforce: 15.4% (13th highest)
> Avg. annual payout per public retiree: $21,247 (17th lowest)
[in-text-ad-2]

6. Pennsylvania
> Funded ratio: 54.8%
> Total pension shortfall: $68.8 billion shortfall (5th largest)
> Gov’t workers as share of total workforce: 10.0% (the lowest)
> Avg. annual payout per public retiree: $26,358 (17th highest)

5. Rhode Island
> Funded ratio: 54.2%
> Total pension shortfall: $5.5 billion shortfall (16th smallest)
> Gov’t workers as share of total workforce: 10.7% (3rd lowest)
> Avg. annual payout per public retiree: $32,658 (8th highest)
[in-text-ad]

4. Connecticut
> Funded ratio: 46.7%
> Total pension shortfall: $35.1 billion shortfall (10th largest)
> Gov’t workers as share of total workforce: 12.9% (15th lowest)
> Avg. annual payout per public retiree: $39,856 (the highest)
[recirclink id=487572]

3. Kentucky
> Funded ratio: 44.9%
> Total pension shortfall: $28.6 billion shortfall (12th largest)
> Gov’t workers as share of total workforce: 14.3% (22nd highest)
> Avg. annual payout per public retiree: $27,143 (13th highest)

2. Illinois
> Funded ratio: 39.0%
> Total pension shortfall: $140.6 billion shortfall (2nd largest)
> Gov’t workers as share of total workforce: 12.2% (7th lowest)
> Avg. annual payout per public retiree: $36,490 (2nd highest)
[in-text-ad-2]

1. New Jersey
> Funded ratio: 38.4%
> Total pension shortfall: $130.7 billion shortfall (3rd largest)
> Gov’t workers as share of total workforce: 13.3% (20th lowest)
> Avg. annual payout per public retiree: $32,148 (9th highest)
Methodology
To rank the severity of each state’s pension crisis, 24/7 Wall St. reviewed the average pension funding ratio — the market value of a pension fund as a share of the total benefits owed to current or retired public employees — for all 50 states as of 2017 with data from nongovernmental organization The Pew Charitable Trusts. Data on the total pension shortfall also came from Pew and is for 2018. Data on the average annual benefits payout per public retiree came from the research nonprofit National Institute on Retirement Security and figures are for 2016. Data on the share of the workforce employed in state and local government is from the Bureau of Labor Statistics for 2019.
Contact [email protected] for any questions or corrections.