
There were 16,425 murders in the United States in 2019, according to the FBI’s most recent statistics.
While violent crime decreased 0.5% overall from the year prior across the country — thanks largely to a decrease in cases of both rape (-0.5%) and robbery (-4.7%) — murders increased by 0.3% from 2018, as did aggravated assaults, by 1.3%.
Statistically, 16,425 murders translates to five for every 100,000 people living in the United States. The FBI figure is drawn from police department numbers across the country, and doesn’t include attempted murders, deaths due to negligence, suicides, or accidents. Nor does it count “justified” homicides — those “determined through law enforcement investigation to be justifiable.” These include, as the FBI phrases it, “the killing of a felon by a peace officer in the line of duty” and “the killing of a felon, during the commission of a felony, by a private citizen.”
The FBI report shows that some parts of the United States are more deadly than others. Some 48.7% of murders reported in 2019 occurred in the South, compared to the Midwest (19.3%), the West (19.3%), and the Northeast (11.2%). (These are America’s 50 most dangerous cities.)
While the cities listed here may have seen their murder rates increase in 2019, please keep in mind that many of them have shown a decrease in violent crime as a whole. On the other hand, these are 25 cities where crime is soaring.
Click here to see 25 cities where murders are on the rise.
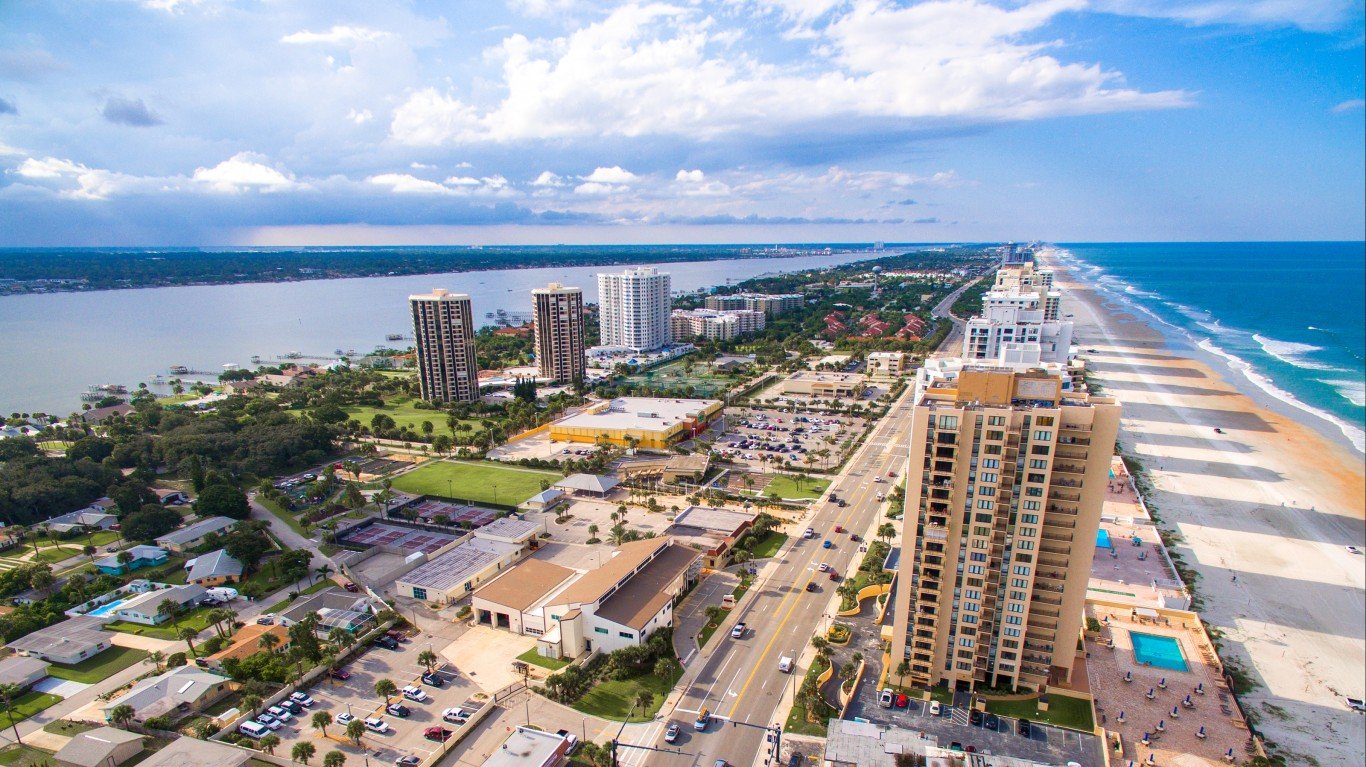
25. Deltona-Daytona Beach-Ormond Beach, FL
> 5-Year Change in Murder: 110.0%
> Murders in 2014: 2.0 per 100,000 (12)
> Murders in 2019: 4.2 per 100,000 (28)
> 5-Year Change in Violent Crime: -30.8%
[in-text-ad]

24. Davenport-Moline-Rock Island, IA-IL
> 5-Year Change in Murder: 110.0%
> Murders in 2014: 1.0 per 100,000 (4)
> Murders in 2019: 2.1 per 100,000 (8)
> 5-Year Change in Violent Crime: 3.1%
[recirclink id=806643]

23. Albuquerque, New Mexico
> 5-Year Change in Murder: 110.4%
> Murders in 2014: 4.8 per 100,000 (43)
> Murders in 2019: 10.1 per 100,000 (93)
> 5-Year Change in Violent Crime: 40.9%

22. The Villages, Florida
> 5-Year Change in Murder: 111.1%
> Murders in 2014: 1.8 per 100,000 (2)
> Murders in 2019: 3.8 per 100,000 (5)
> 5-Year Change in Violent Crime: -1.1%
[in-text-ad-2]

21. Greensboro-High Point, North Carolina
> 5-Year Change in Murder: 120.5%
> Murders in 2014: 4.4 per 100,000 (33)
> Murders in 2019: 9.7 per 100,000 (75)
> 5-Year Change in Violent Crime: 65.2%

20. Worcester, MA-CT
> 5-Year Change in Murder: 122.2%
> Murders in 2014: 0.9 per 100,000 (8)
> Murders in 2019: 2.0 per 100,000 (17)
> 5-Year Change in Violent Crime: -26.3%
[in-text-ad]

19. Houma-Thibodaux, Louisiana
> 5-Year Change in Murder: 123.3%
> Murders in 2014: 4.3 per 100,000 (9)
> Murders in 2019: 9.6 per 100,000 (20)
> 5-Year Change in Violent Crime: 54.6%
[recirclink id=839643]
18. El Centro, California
> 5-Year Change in Murder: 129.4%
> Murders in 2014: 1.7 per 100,000 (3)
> Murders in 2019: 3.9 per 100,000 (7)
> 5-Year Change in Violent Crime: 0.0%
17. Niles, Michigan
> 5-Year Change in Murder: 153.8%
> Murders in 2014: 1.3 per 100,000 (2)
> Murders in 2019: 3.3 per 100,000 (5)
> 5-Year Change in Violent Crime: 28.9%
[in-text-ad-2]

16. Roanoke, Virginia
> 5-Year Change in Murder: 159.1%
> Murders in 2014: 2.2 per 100,000 (7)
> Murders in 2019: 5.7 per 100,000 (18)
> 5-Year Change in Violent Crime: 17.9%
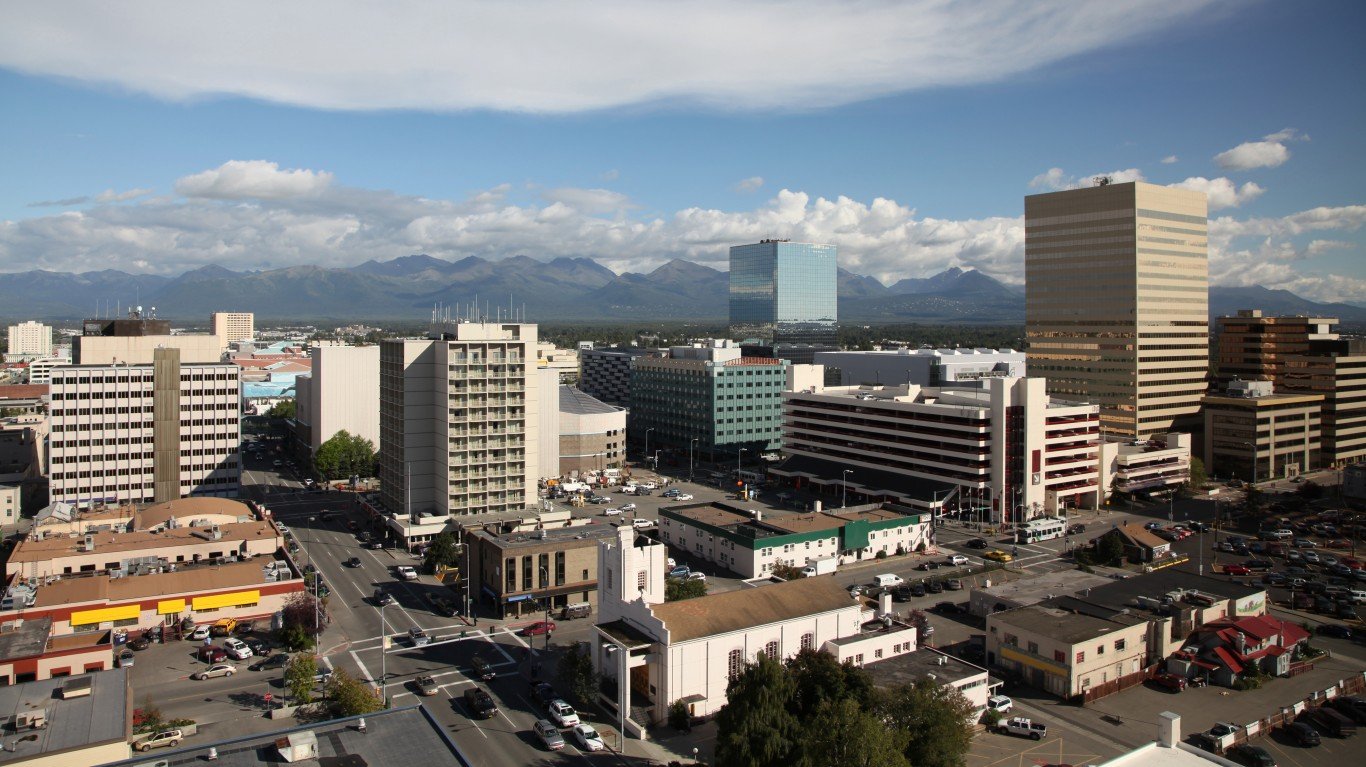
15. Anchorage, Alaska
> 5-Year Change in Murder: 170.7%
> Murders in 2014: 4.1 per 100,000 (13)
> Murders in 2019: 11.1 per 100,000 (34)
> 5-Year Change in Violent Crime: 41.6%
[in-text-ad]

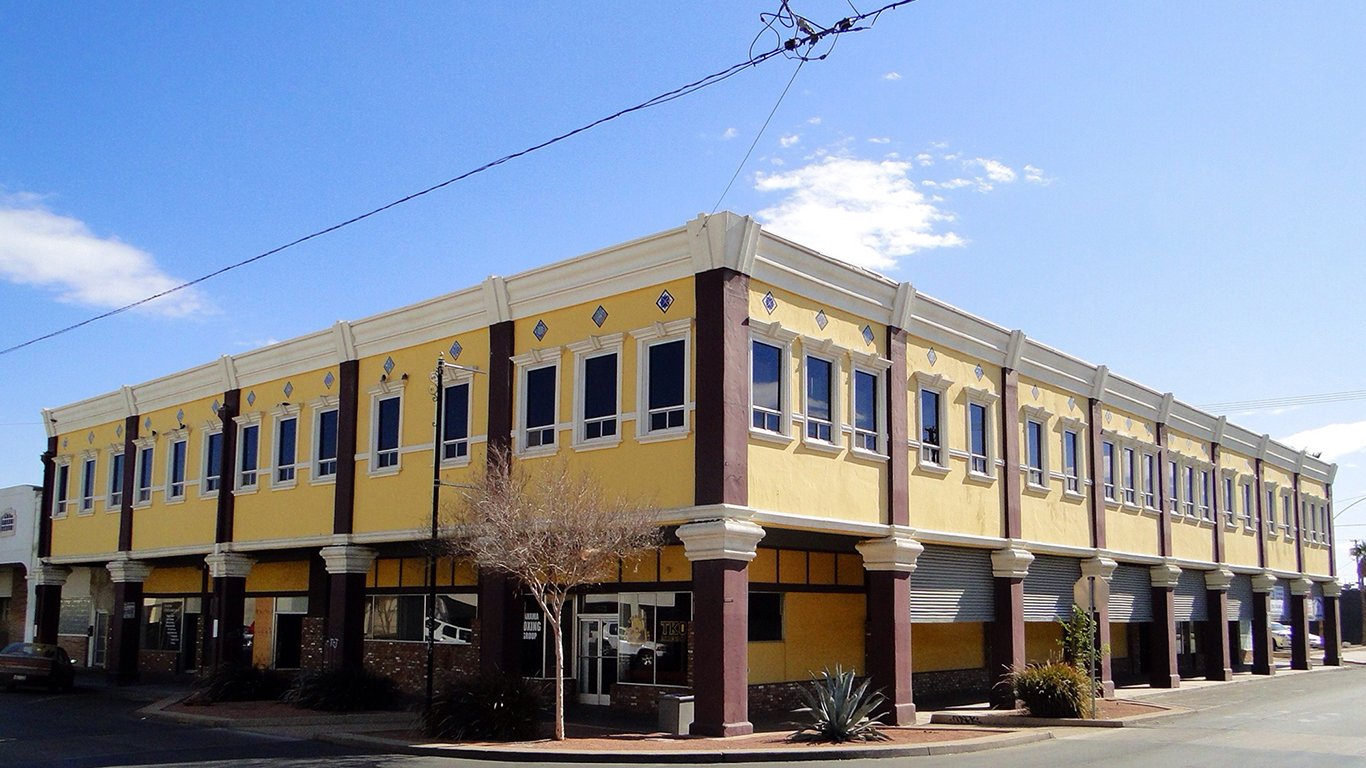
14. Yakima, Washington
> 5-Year Change in Murder: 171.4%
> Murders in 2014: 2.8 per 100,000 (7)
> Murders in 2019: 7.6 per 100,000 (19)
> 5-Year Change in Violent Crime: 15.0%
[recirclink id=837996]

13. Yuma, Arizona
> 5-Year Change in Murder: 187.2%
> Murders in 2014: 3.9 per 100,000 (8)
> Murders in 2019: 11.2 per 100,000 (24)
> 5-Year Change in Violent Crime: -25.4%

12. Grand Junction, Colorado
> 5-Year Change in Murder: 195.0%
> Murders in 2014: 2.0 per 100,000 (3)
> Murders in 2019: 5.9 per 100,000 (9)
> 5-Year Change in Violent Crime: -18.8%
[in-text-ad-2]

11. Crestview-Fort Walton Beach-Destin, FL
> 5-Year Change in Murder: 206.7%
> Murders in 2014: 1.5 per 100,000 (4)
> Murders in 2019: 4.6 per 100,000 (13)
> 5-Year Change in Violent Crime: -37.2%
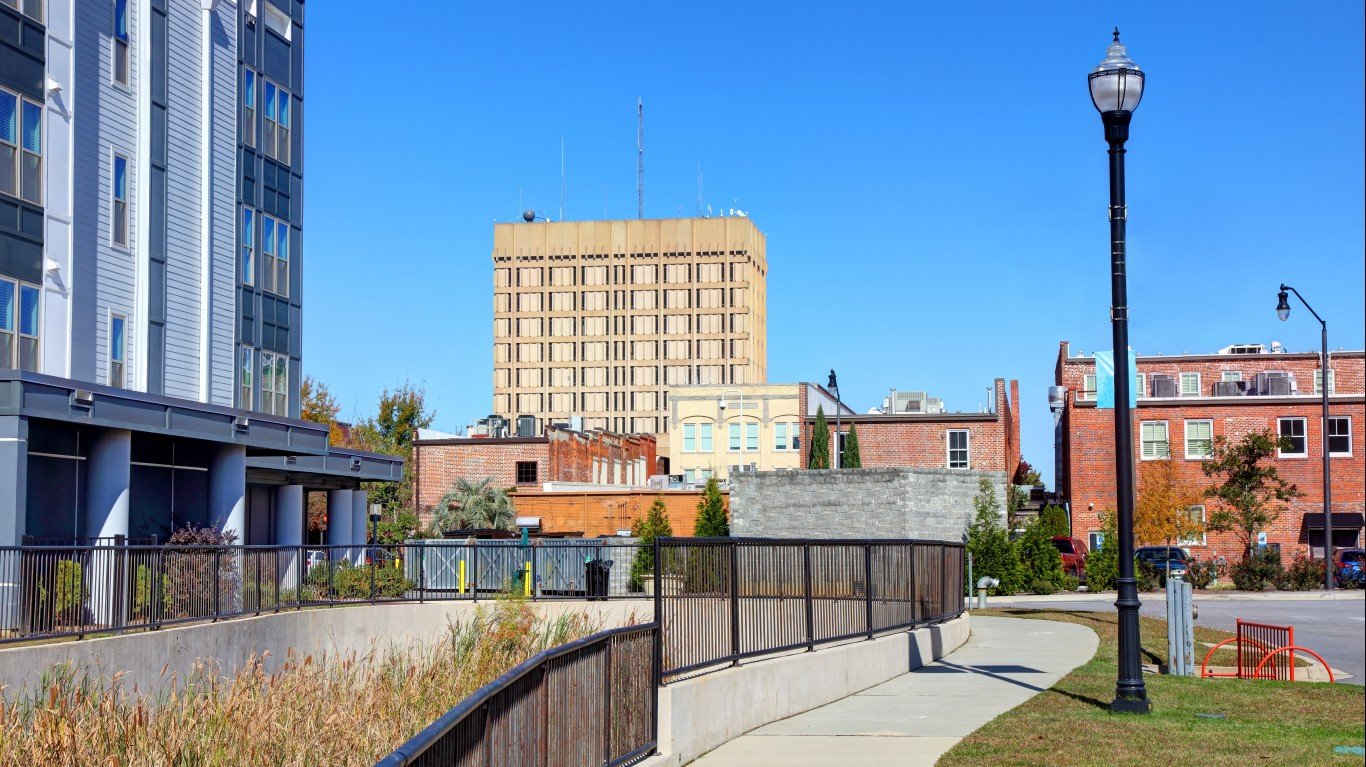
10. Florence, South Carolina
> 5-Year Change in Murder: 213.2%
> Murders in 2014: 5.3 per 100,000 (11)
> Murders in 2019: 16.6 per 100,000 (34)
> 5-Year Change in Violent Crime: 57.8%
[in-text-ad]
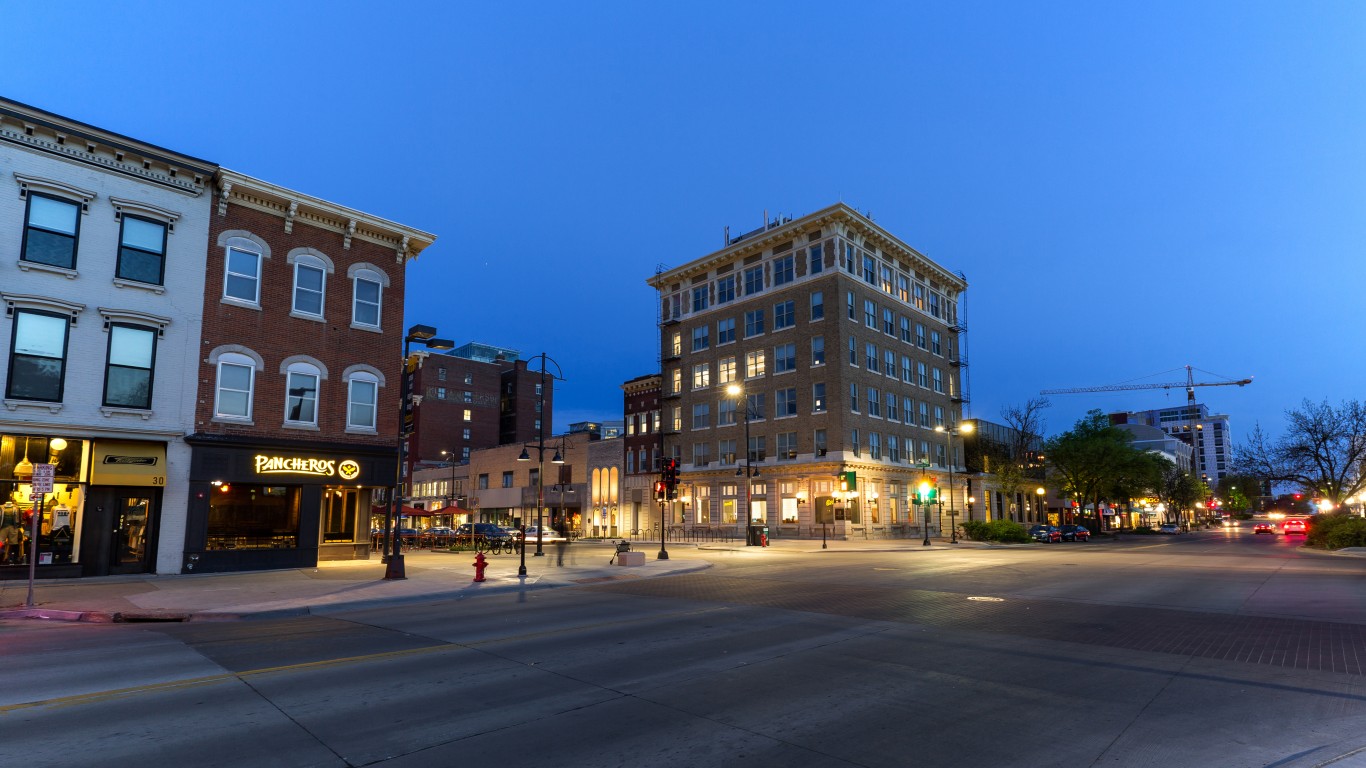
9. Iowa City, Iowa
> 5-Year Change in Murder: 283.3%
> Murders in 2014: 0.6 per 100,000 (1)
> Murders in 2019: 2.3 per 100,000 (4)
> 5-Year Change in Violent Crime: 6.5%
[recirclink id=647311]

8. Bellingham, Washington
> 5-Year Change in Murder: 290.0%
> Murders in 2014: 1.0 per 100,000 (2)
> Murders in 2019: 3.9 per 100,000 (9)
> 5-Year Change in Violent Crime: 8.5%

7. Burlington, North Carolina
> 5-Year Change in Murder: 336.8%
> Murders in 2014: 1.9 per 100,000 (3)
> Murders in 2019: 8.3 per 100,000 (14)
> 5-Year Change in Violent Crime: 9.6%
[in-text-ad-2]
6. Eau Claire, Wisconsin
> 5-Year Change in Murder: 400.0%
> Murders in 2014: 0.6 per 100,000 (1)
> Murders in 2019: 3.0 per 100,000 (5)
> 5-Year Change in Violent Crime: 63.3%

5. Yuba City, California
> 5-Year Change in Murder: 425.0%
> Murders in 2014: 1.2 per 100,000 (2)
> Murders in 2019: 6.3 per 100,000 (11)
> 5-Year Change in Violent Crime: 2.6%
[in-text-ad]

4. Bowling Green, Kentucky
> 5-Year Change in Murder: 450.0%
> Murders in 2014: 0.6 per 100,000 (1)
> Murders in 2019: 3.3 per 100,000 (6)
> 5-Year Change in Violent Crime: -2.3%
[recirclink id=806643]

3. Elizabethtown-Fort Knox, Kentucy
> 5-Year Change in Murder: 457.1%
> Murders in 2014: 0.7 per 100,000 (1)
> Murders in 2019: 3.9 per 100,000 (6)
> 5-Year Change in Violent Crime: 8.4%
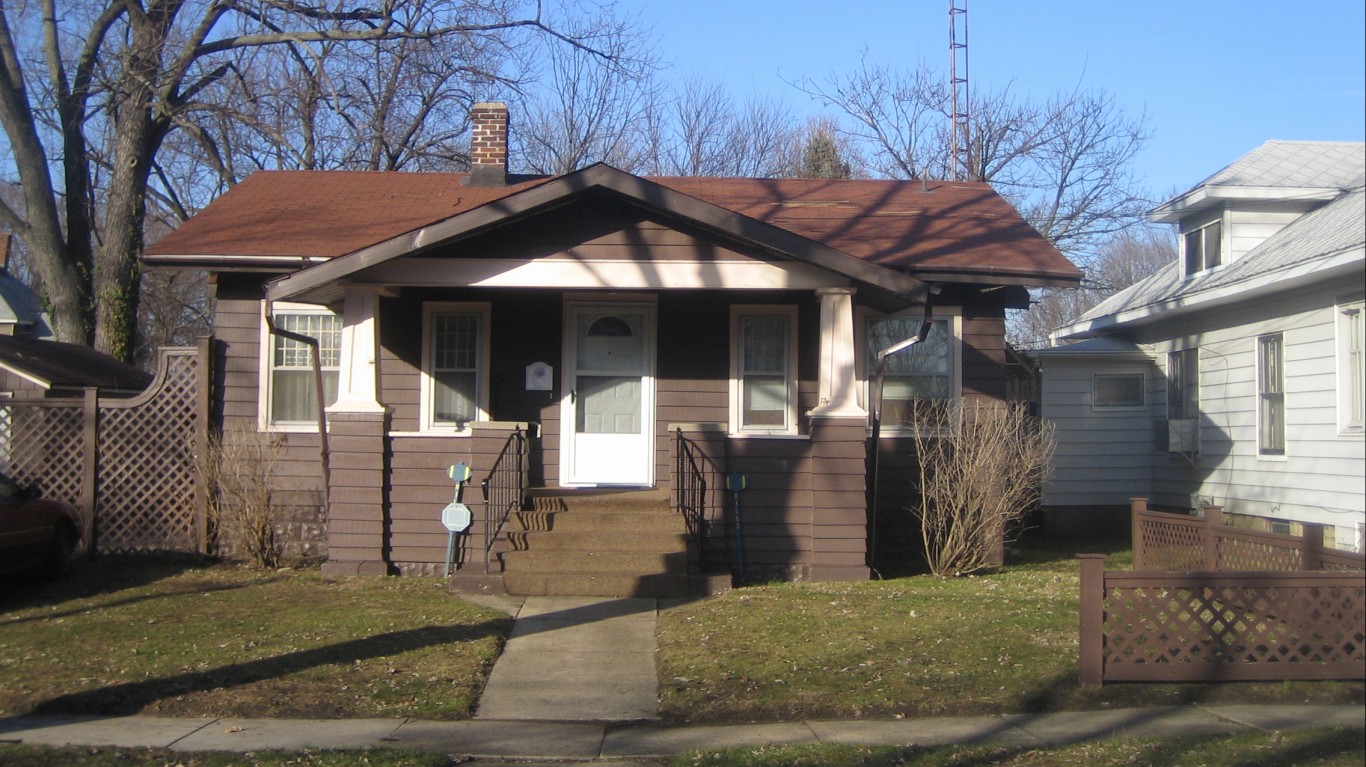
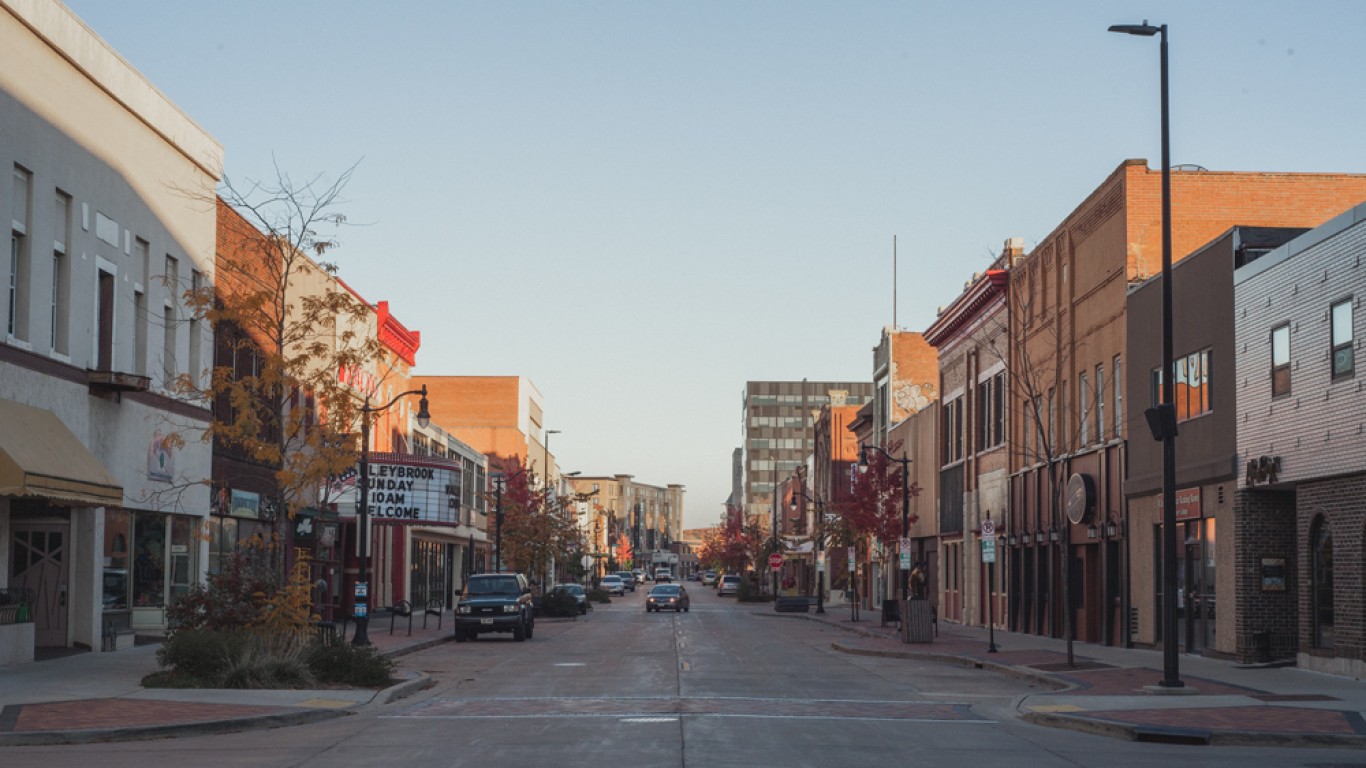
2. Decatur, Illinois
> 5-Year Change in Murder: 488.9%
> Murders in 2014: 1.8 per 100,000 (2)
> Murders in 2019: 10.6 per 100,000 (11)
> 5-Year Change in Violent Crime: 14.9%
[in-text-ad-2]
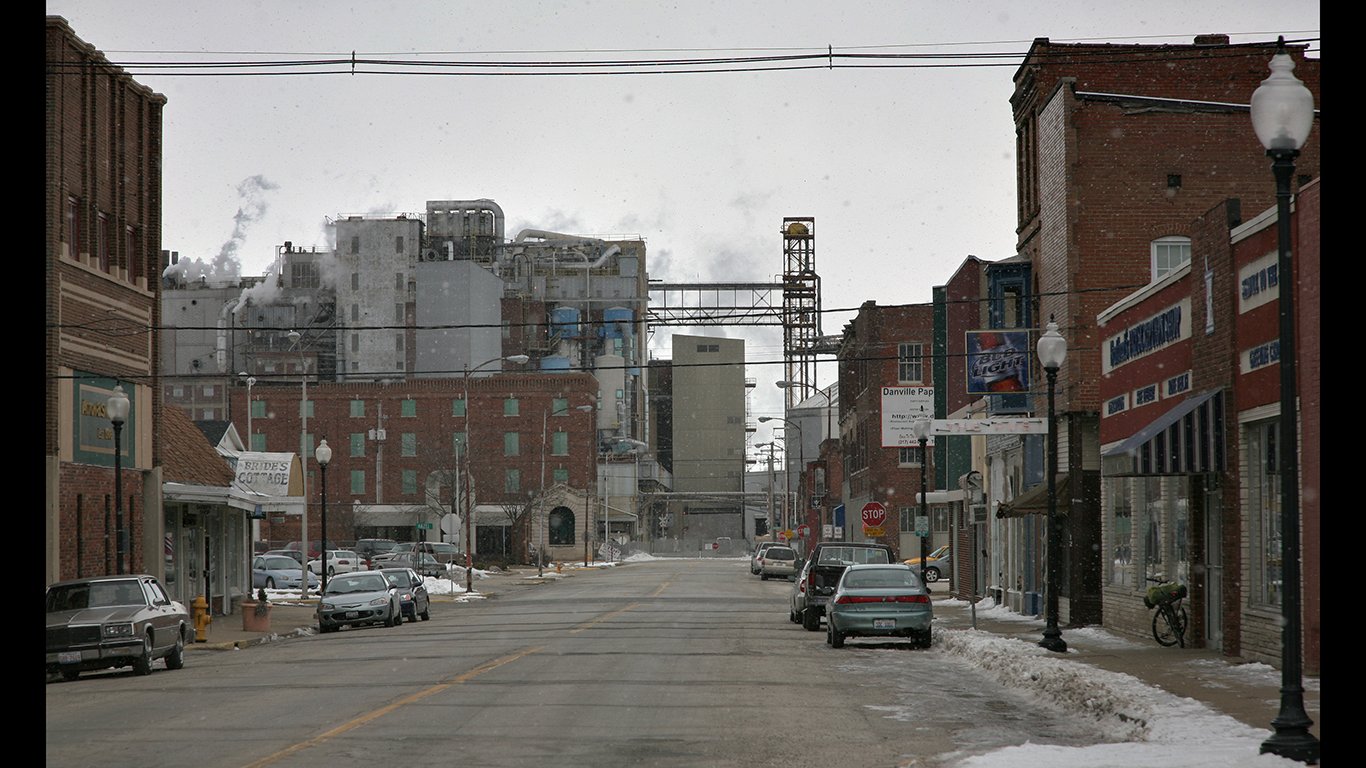
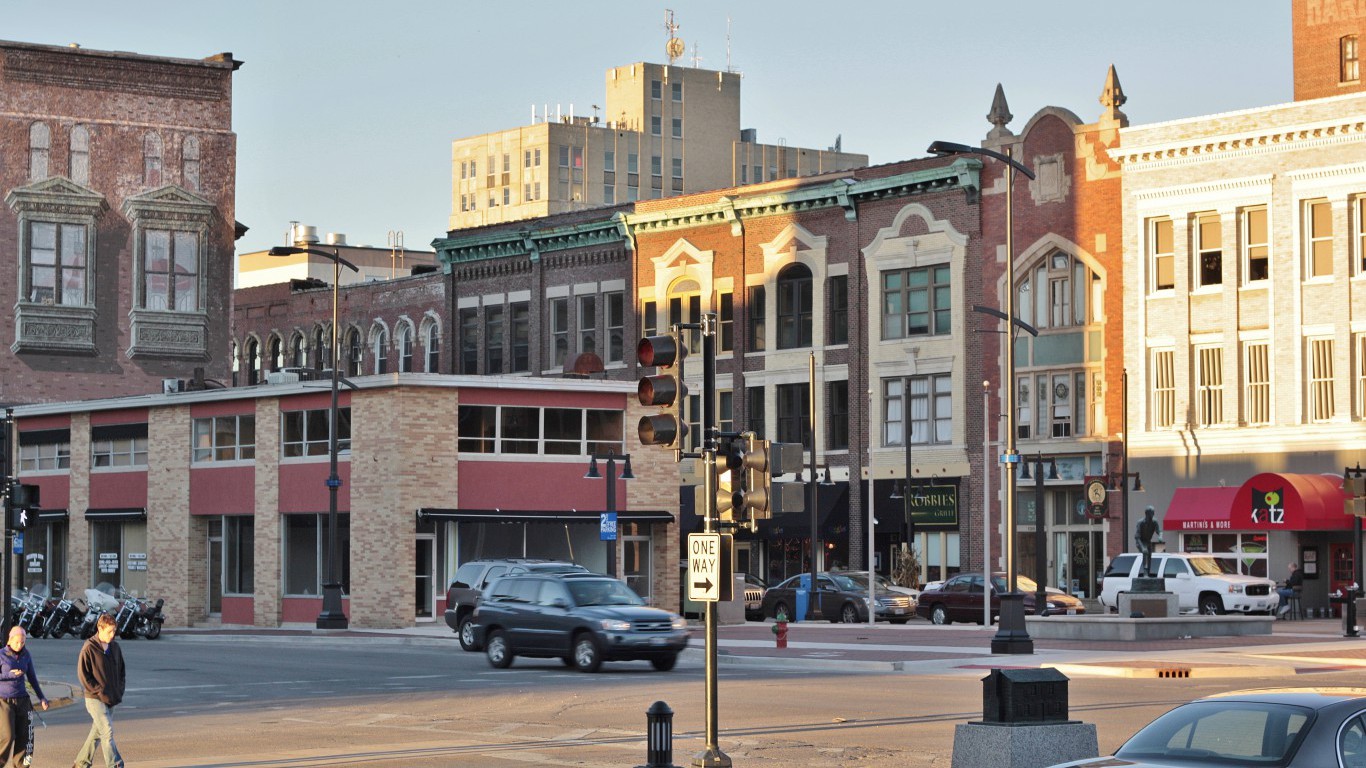
1. Danville, Illinois
> 5-Year Change in Murder: 607.7%
> Murders in 2014: 1.3 per 100,000 (1)
> Murders in 2019: 9.2 per 100,000 (7)
> 5-Year Change in Violent Crime: 58.1%
Contact [email protected] for any questions or corrections.