
Cities across the United States are reporting a spike in gun violence and homicide during the COVID-19 pandemic. In the first six months of 2020, there was a nearly 15% increase in murders nationwide, and across a sample of 59 cities tracked by the FBI, the number of murders was up 28% from January through July compared to the same period in 2019.
The increase reflects a sudden reversal of a long-term trend, as violent crime has fallen in the U.S. for four consecutive years. In 2019, there were 367 violent crimes reported for every 100,000 people in the United States, a low not seen since 2014 and a far cry from the highs of the early 1990s that topped 750 violent crimes per 100,000 people annually.
While a complete picture of the incidence of violence in the United States in 2020 remains to be seen, there are dozens of cities across the country that were already plagued by violence before this turbulent year.
24/7 Wall St. reviewed violent crime rates in nearly 300 U.S. cities tracked by the FBI that are home to at least 100,000 people to determine the 50 most dangerous cities in America. Violent crime rates are population-adjusted figures calculated using the number of rapes, robberies, aggravated assaults, and homicides committed in 2019 per 100,000 people.
Violent crime is a difficult social phenomenon to explain. Certain factors, however, may affect the incidence of violence, especially employment. Higher employment rates among at-risk groups have been shown to reduce the likelihood of violent crime — and some experts are pointing to the ongoing unemployment crisis to help explain the current surge in violence nationwide. Indeed, many of the cities on this list were struggling with widespread joblessness even before the COVID-19 recession. Here is a look at the cities with the worst COVID-19 unemployment crisis right now.
The relationship between income and crime is complicated, but cities with high poverty also often have higher crime rates. In the vast majority of cities on this list, the poverty rate exceeds the comparable 14.1% national rate. Here is a list of America’s poorest cities.
Click here to see the 50 most dangerous cities in America.
Click here to read our detailed methodology.
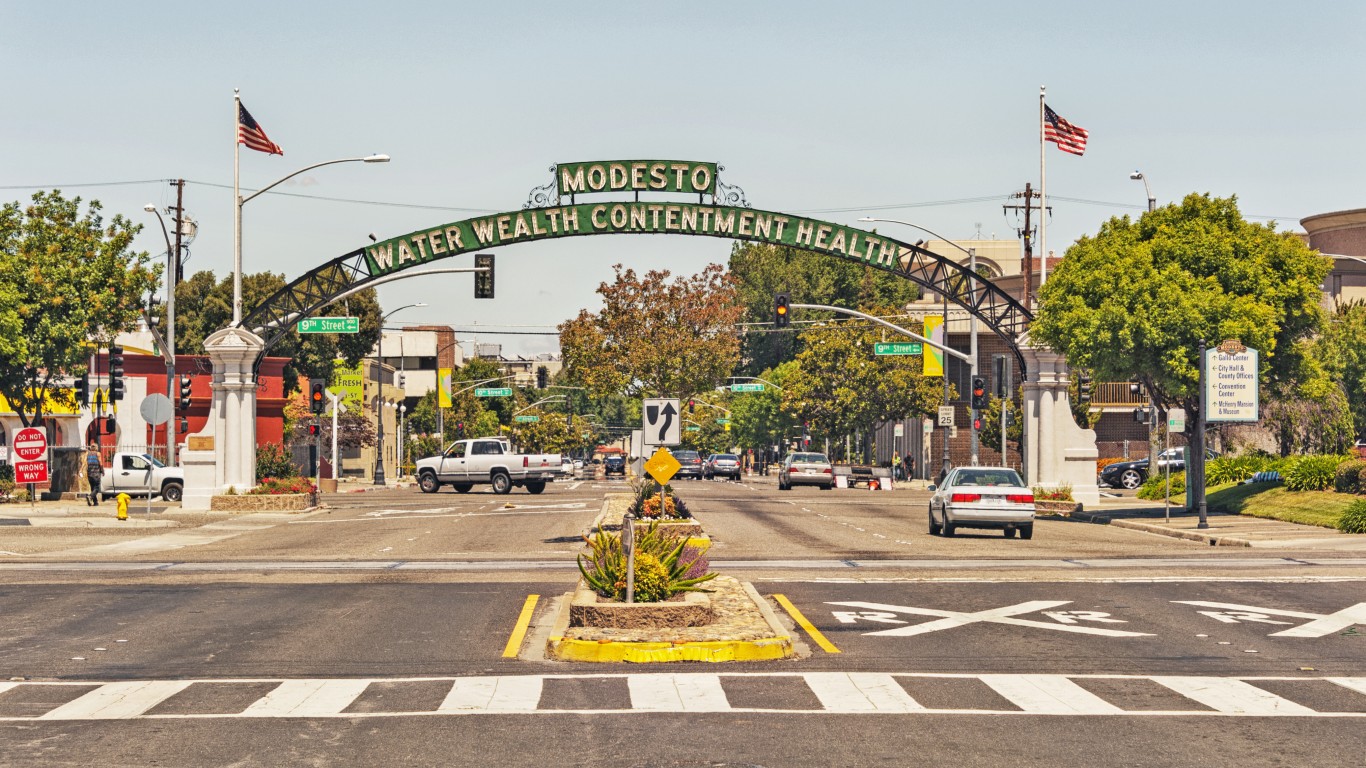
50. Modesto, California
> Violent crime rate in 2019: 812 per 100,000 people (1,758 total)
> Total homicides reported in 2019: 13
> 2019 poverty rate: 15.9%
> 2019 annual unemployment rate: 5.5%
> 2019 population: 216,542
There were 812 violent crimes reported per 100,000 Modesto residents in 2019, far more than the national rate of 367 violent crimes per 100,000 Americans and the 50th highest violent crime rate of any large city.
Though the relationship between economic conditions and crime is complicated, crime rates are often higher in areas with limited employment opportunities. In Modesto, a relatively dangerous city, the annual unemployment rate stands at 5.5%, well above the comparable national jobless rate of 3.7%.
Click here to see the full crime report for Modesto, California.
[in-text-ad]

49. Greensboro, North Carolina
> Violent crime rate in 2019: 819 per 100,000 people (2,440 total)
> Total homicides reported in 2019: 43
> 2019 poverty rate: 18.5%
> 2019 annual unemployment rate: 4.2%
> 2019 population: 298,025
Of the four categories of violent crime — rape, robbery, aggravated assault, and homicide — aggravated assault is the most common. That pattern holds in Greensboro, North Carolina, where there were 1,663 aggravated assaults in 2019. Due primarily to instances of aggravated assault, the violent crime rate in the city stands at 819 incidents for every 100,000 people.
Property crime — which includes burglary, larceny, and motor vehicle theft — is also relatively common in Greensboro. There were 3,689 property crimes reported per 100,000 Greensboro residents in 2019, far more than the national property crime rate of 2,110 incidents per 100,000 Americans.
Click here to see the full crime report for Greensboro, North Carolina.

48. Paterson, New Jersey
> Violent crime rate in 2019: 841 per 100,000 people (1,219 total)
> Total homicides reported in 2019: 19
> 2019 poverty rate: 28.1%
> 2019 annual unemployment rate: 6.6%
> 2019 population: 144,866
As is the case nationwide, in Paterson, New Jersey, aggravated assault drives the overall violent crime rate more than any other offense. Of the 1,219 violent crimes committed in the city in 2019, 682 were aggravated assaults. Overall, there were 841 violent crimes reported in Paterson for every 100,000 people in 2019.
Poverty tends to be more prevalent in areas where crime is more common. In Paterson, some 28.1% of residents live below the poverty line, far more than the national poverty rate of 14.1%.
Click here to see the full crime report for Paterson, New Jersey.

47. Cincinnati, Ohio
> Violent crime rate in 2019: 845 per 100,000 people (2,562 total)
> Total homicides reported in 2019: 64
> 2019 poverty rate: 27.2%
> 2019 annual unemployment rate: 4.2%
> 2019 population: 303,335
Of the four categories of violent crime — rape, robbery, aggravated assault, and homicide — aggravated assault is the most common nationwide. That pattern holds in Cincinnati, Ohio, where there were 1,346 aggravated assaults in 2019. Due primarily to instances of aggravated assault, the violent crime rate in the city stands at 845 incidents for every 100,000 people.
Murder is particularly common in Cincinnati. In 2019 there were 21.1 homicides reported for every 100,000 residents — more than four times the national murder rate of 5 per 100,000 people.
Click here to see the full crime report for Cincinnati, Ohio.
[in-text-ad-2]

46. Tacoma, Washington
> Violent crime rate in 2019: 845 per 100,000 people (1,848 total)
> Total homicides reported in 2019: 16
> 2019 poverty rate: 15.9%
> 2019 annual unemployment rate: 5.4%
> 2019 population: 218,650
There were 845 violent crimes reported in Tacoma, Washington for every 100,000 people in 2019. For context, there were 367 violent crimes for every 100,000 people nationwide in 2019. As is the case across the United States, aggravated assault is the most common violent crime in Tacoma. Of the 1,848 violent crimes committed in the city in 2019, 1,250 were aggravated assaults.
Specifically, homicide is considerably more common in Tacoma than it is nationwide. There were 16 homicides committed in Tacoma in 2019, or 7.3 for every 100,000 people. Meanwhile, the national murder rate was just 5 per 100,000 the same year.
Click here to see the full crime report for Tacoma, Washington.

45. Vallejo, California
> Violent crime rate in 2019: 845 per 100,000 people (1,037 total)
> Total homicides reported in 2019: 12
> 2019 poverty rate: 14.1%
> 2019 annual unemployment rate: 4.2%
> 2019 population: 122,657
The violent crime rate in Vallejo, California, is among the highest of any U.S. city. There were 1,037 cases of rape, robbery, aggravated assault, and murder reported in Vallejo in 2019, or 845 for every 100,000 people — more than double the violent crime rate nationwide of 367 incidents for every 100,000 people.
Other, nonviolent forms of crime, such as burglary, larceny, and motor vehicle theft are also more common in Vallejo than they are nationwide. There were 4,941 property crimes reported in Vallejo in 2019, or 4,028 for every 100,000 residents. Meanwhile, the national property crime rate stood at 2,110 per 100,000 the same year.
Click here to see the full crime report for Vallejo, California.
[in-text-ad]

44. Lancaster, California
> Violent crime rate in 2019: 853 per 100,000 people (1,359 total)
> Total homicides reported in 2019: 7
> 2019 poverty rate: 23.8%
> 2019 annual unemployment rate: 6.4%
> 2019 population: 159,335
There were 853 violent crimes reported per 100,000 Lancaster residents in 2019, far more than the national rate of 367 violent crimes per 100,000 Americans and the 44th highest violent crime rate of any large city.
While the relationship between unemployment and violent crime is complicated, many of the cities with the highest violent crime rates have high unemployment. Some 6.4% of the Lancaster labor force was unemployed in 2019, a higher unemployment rate than the national rate of 3.7%.
Click here to see the full crime report for Lancaster, California.

43. Hartford, Connecticut
> Violent crime rate in 2019: 858 per 100,000 people (1,049 total)
> Total homicides reported in 2019: 21
> 2019 poverty rate: 30.1%
> 2019 annual unemployment rate: 6.6%
> 2019 population: 122,245
Of the four categories of violent crime — rape, robbery, aggravated assault, and homicide — aggravated assault is the most common. That pattern holds in Hartford, Connecticut, where there were 726 aggravated assaults in 2019. Due primarily to instances of aggravated assault, the violent crime rate in the city stands at 858 incidents for every 100,000 people.
Violent crime is far more common in Hartford than it is in Connecticut. There were 184 violent crimes reported per 100,000 residents in Connecticut in 2019, far below the corresponding city figure.
Click here to see the full crime report for Hartford, Connecticut.

42. Dallas, Texas
> Violent crime rate in 2019: 863 per 100,000 people (11,764 total)
> Total homicides reported in 2019: 198
> 2019 poverty rate: 20.5%
> 2019 annual unemployment rate: 3.4%
> 2019 population: 1,363,295
As is the case nationwide, in Dallas, Texas, aggravated assault drives the overall violent crime rate more than any other offense. Of the 11,764 violent crimes committed in the city in 2019, 6,369 were aggravated assaults. Overall, there were 863 violent crimes reported in Dallas for every 100,000 people in 2019.
Crime tends to be more concentrated in areas with limited economic opportunity and widespread financial hardship — and this pattern holds in Dallas. Across the city, 20.5% of the population lives below the poverty line, well above the 14.1% national poverty rate.
[in-text-ad-2]

41. North Las Vegas, Nevada
> Violent crime rate in 2019: 864 per 100,000 people (2,158 total)
> Total homicides reported in 2019: 18
> 2019 poverty rate: 14.5%
> 2019 annual unemployment rate: 4.4%
> 2019 population: 249,854
There were 864 violent crimes reported in North Las Vegas, Nevada for every 100,000 people in 2019. For context, there were 367 violent crimes for every 100,000 people nationwide in 2019. As is the case across the United States, aggravated assault is the most common violent crime in North Las Vegas. Of the 2,158 violent crimes committed in the city in 2019, 1,565 were aggravated assaults.
Though violence is more concentrated in North Las Vegas than the U.S. as a whole, rates of other, nonviolent forms of crime, such as burglary, larceny, and motor vehicle theft, are more closely in line with comparable national averages. There were 5,086 property crimes reported in North Las Vegas in 2019, or 2,036 for every 100,000 residents. Meanwhile, the national property crime rate was 2,110 per 100,000 the same year.
Click here to see the full crime report for North Las Vegas, Nevada.
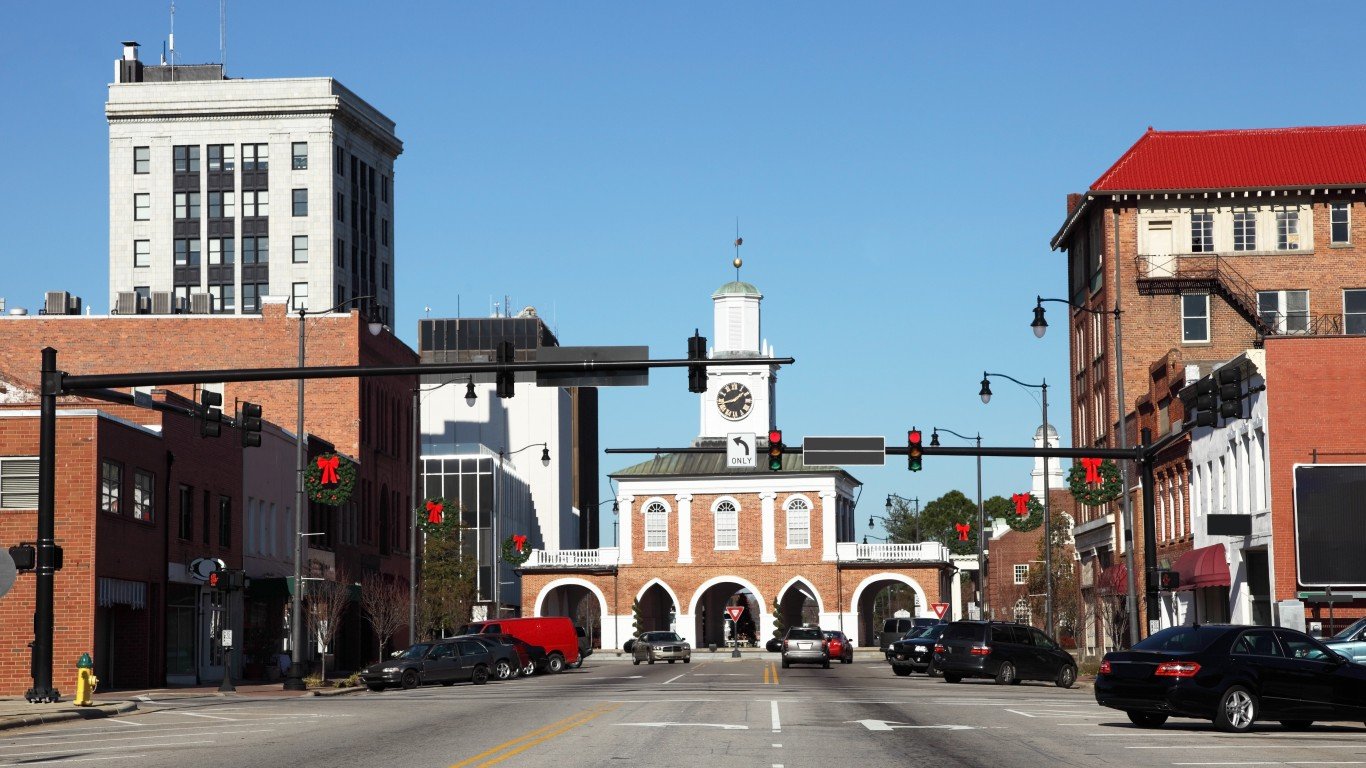
40. Fayetteville, North Carolina
> Violent crime rate in 2019: 875 per 100,000 people (1,835 total)
> Total homicides reported in 2019: 24
> 2019 poverty rate: 19.2%
> 2019 annual unemployment rate: 5.4%
> 2019 population: 209,614
The violent crime rate in Fayetteville, North Carolina, is among the highest of any U.S. city. There were 1,835 cases of rape, robbery, aggravated assault, and murder reported in Fayetteville in 2019, or 875 for every 100,000 people — more than double the violent crime rate nationwide of 367 incidents for every 100,000 people.
Though the relationship between economic conditions and crime is complicated, crime rates are often higher in areas with limited employment opportunities. In Fayetteville, a relatively dangerous city, the annual unemployment rate stands at 5.4%, well above the comparable national jobless rate of 3.7%.
Click here to see the full crime report for Fayetteville, North Carolina.
[in-text-ad]

39. New Haven, Connecticut
> Violent crime rate in 2019: 895 per 100,000 people (1,168 total)
> Total homicides reported in 2019: 13
> 2019 poverty rate: 25.9%
> 2019 annual unemployment rate: 4.4%
> 2019 population: 130,494
There were 895 violent crimes reported per 100,000 New Haven residents in 2019, far more than the national rate of 367 violent crimes per 100,000 Americans and the 39th highest violent crime rate of any large city.
Poverty tends to be more prevalent in areas where crime is more common. In New Haven, some 25.9% of residents live below the poverty line, far more than the national poverty rate of 14.1%.
Click here to see the full crime report for New Haven, Connecticut.

38. Akron, Ohio
> Violent crime rate in 2019: 901 per 100,000 people (1,782 total)
> Total homicides reported in 2019: 27
> 2019 poverty rate: 23.3%
> 2019 annual unemployment rate: 4.9%
> 2019 population: 197,882
Of the four categories of violent crime — rape, robbery, aggravated assault, and homicide — aggravated assault is the most common. That pattern holds in Akron, Ohio, where there were 1,246 aggravated assaults in 2019. Due primarily to instances of aggravated assault, the violent crime rate in the city stands at 901 incidents for every 100,000 people.
Property crime — which includes burglary, larceny, and motor vehicle theft — is also relatively common in Akron. There were 3,319 property crimes reported per 100,000 Akron residents in 2019, far more than the national property crime rate of 2,110 incidents per 100,000 Americans.

37. Springfield, Massachusetts
> Violent crime rate in 2019: 905 per 100,000 people (1,397 total)
> Total homicides reported in 2019: 20
> 2019 poverty rate: 28.6%
> 2019 annual unemployment rate: 5.5%
> 2019 population: 154,306
As is the case nationwide, in Springfield, Massachusetts, aggravated assault drives the overall violent crime rate more than any other offense. Of the 1,397 violent crimes committed in the city in 2019, 938 were aggravated assaults. Overall, there were 905 violent crimes reported in Springfield for every 100,000 people in 2019.
While the relationship between unemployment and violent crime is complicated, many of the cities with the highest violent crime rates have high unemployment. Some 5.5% of the Springfield labor force was unemployed in 2019, a higher unemployment rate than the national rate of 3.7%.
Click here to see the full crime report for Springfield, Massachusetts.
[in-text-ad-2]

36. Minneapolis, Minnesota
> Violent crime rate in 2019: 926 per 100,000 people (3,990 total)
> Total homicides reported in 2019: 46
> 2019 poverty rate: 19.9%
> 2019 annual unemployment rate: 2.8%
> 2019 population: 431,016
There were 926 violent crimes reported in Minneapolis, Minnesota for every 100,000 people in 2019. For context, there were 367 violent crimes for every 100,000 people nationwide in 2019. As is the case across the United States, aggravated assault is the most common violent crime in Minneapolis. Of the 3,990 violent crimes committed in the city in 2019, 2,196 were aggravated assaults.
Violent crime is far more common in Minneapolis than it is in Minnesota. There were 236 violent crimes reported per 100,000 residents in Minnesota in 2019, far below the corresponding city figure.
Click here to see the full crime report for Minneapolis, Minnesota.
![]()
35. Richmond, California
> Violent crime rate in 2019: 932 per 100,000 people (1,034 total)
> Total homicides reported in 2019: 16
> 2019 poverty rate: 15.4%
> 2019 annual unemployment rate: 3.5%
> 2019 population: 110,988
The violent crime rate in Richmond, California, is among the highest of any U.S. city. There were 1,034 cases of rape, robbery, aggravated assault, and murder reported in Richmond in 2019, or 932 for every 100,000 people — more than double the violent crime rate nationwide of 367 incidents for every 100,000 people.
Other, nonviolent forms of crime, such as burglary, larceny, and motor vehicle theft are also more common in Richmond than they are nationwide. There were 4,188 property crimes reported in Richmond in 2019, or 3,773 for every 100,000 residents. Meanwhile, the national property crime rate stood at 2,110 per 100,000 the same year.
Click here to see the full crime report for Richmond, California.
[in-text-ad]

34. Baton Rouge, Louisiana
> Violent crime rate in 2019: 936 per 100,000 people (2,066 total)
> Total homicides reported in 2019: 70
> 2019 poverty rate: 25.2%
> 2019 annual unemployment rate: 4.8%
> 2019 population: 220,648
There were 936 violent crimes reported per 100,000 Baton Rouge residents in 2019, far more than the national rate of 367 violent crimes per 100,000 Americans and the 34th highest violent crime rate of any large city.
Specifically, homicide is considerably more common in Baton Rouge than it is nationwide. There were 70 homicides committed in Baton Rouge in 2019, or 31.7 for every 100,000 people. Meanwhile, the national murder rate was just 5 per 100,000 the same year.
Click here to see the full crime report for Baton Rouge, Louisiana.

33. Chicago, Illinois
> Violent crime rate in 2019: 943 per 100,000 people (25,532 total)
> Total homicides reported in 2019: 492
> 2019 poverty rate: 19.5%
> 2019 annual unemployment rate: 4.0%
> 2019 population: 2,707,064
Of the four categories of violent crime — rape, robbery, aggravated assault, and homicide — aggravated assault is the most common. That pattern holds in Chicago, Illinois, where there were 15,296 aggravated assaults in 2019. Due primarily to instances of aggravated assault, the violent crime rate in the city stands at 943 incidents for every 100,000 people.
Crime tends to be more concentrated in areas with limited economic opportunity and widespread financial hardship — and this pattern holds in Chicago. Across the city, 19.5% of the population lives below the poverty line, well above the 14.1% national poverty rate.
Click here to see the full crime report for Chicago, Illinois.

32. Toledo, Ohio
> Violent crime rate in 2019: 952 per 100,000 people (2,604 total)
> Total homicides reported in 2019: 34
> 2019 poverty rate: 25.6%
> 2019 annual unemployment rate: 5.2%
> 2019 population: 273,505
As is the case nationwide, in Toledo, Ohio, aggravated assault drives the overall violent crime rate more than any other offense. Of the 2,604 violent crimes committed in the city in 2019, 1,710 were aggravated assaults. Overall, there were 952 violent crimes reported in Toledo for every 100,000 people in 2019.
Though the relationship between economic conditions and crime is complicated, crime rates are often higher in areas with limited employment opportunities. In Toledo, a relatively dangerous city, the annual unemployment rate stands at 5.2%, well above the comparable national jobless rate of 3.7%.
[in-text-ad-2]

31. Dayton, Ohio
> Violent crime rate in 2019: 962 per 100,000 people (1,351 total)
> Total homicides reported in 2019: 48
> 2019 poverty rate: 32.1%
> 2019 annual unemployment rate: 5.1%
> 2019 population: 140,427
There were 962 violent crimes reported in Dayton, Ohio for every 100,000 people in 2019. For context, there were 367 violent crimes for every 100,000 people nationwide in 2019. As is the case across the United States, aggravated assault is the most common violent crime in Dayton. Of the 1,351 violent crimes committed in the city in 2019, 756 were aggravated assaults.
Property crime — which includes burglary, larceny, and motor vehicle theft — is also relatively common in Dayton. There were 4,040 property crimes reported per 100,000 Dayton residents in 2019, far more than the national property crime rate of 2,110 incidents per 100,000 Americans.

30. North Charleston, South Carolina
> Violent crime rate in 2019: 966 per 100,000 people (1,114 total)
> Total homicides reported in 2019: 26
> 2019 poverty rate: 22.8%
> 2019 annual unemployment rate: 2.6%
> 2019 population: 115,312
The violent crime rate in North Charleston, South Carolina, is among the highest of any U.S. city. There were 1,114 cases of rape, robbery, aggravated assault, and murder reported in North Charleston in 2019, or 966 for every 100,000 people — more than double the violent crime rate nationwide of 367 incidents for every 100,000 people.
Poverty tends to be more prevalent in areas where crime is more common. In North Charleston, some 22.8% of residents live below the poverty line, far more than the national poverty rate of 14.1%.
Click here to see the full crime report for North Charleston, South Carolina.
[in-text-ad]

29. Washington, District Of Columbia
> Violent crime rate in 2019: 977 per 100,000 people (6,896 total)
> Total homicides reported in 2019: 166
> 2019 poverty rate: 16.8%
> 2019 annual unemployment rate: 5.5%
> 2019 population: 705,749
There were 977 violent crimes reported per 100,000 Washington residents in 2019, far more than the national rate of 367 violent crimes per 100,000 Americans and the 29th highest violent crime rate of any large city.
While the relationship between unemployment and violent crime is complicated, many of the cities with the highest violent crime rates have high unemployment. Some 5.5% of the Washington labor force was unemployed in 2019, a higher unemployment rate than the national rate of 3.7%.
Click here to see the full crime report for Washington, District Of Columbia.

28. Tulsa, Oklahoma
> Violent crime rate in 2019: 987 per 100,000 people (3,964 total)
> Total homicides reported in 2019: 55
> 2019 poverty rate: 19.7%
> 2019 annual unemployment rate: 3.4%
> 2019 population: 401,700
Of the four categories of violent crime — rape, robbery, aggravated assault, and homicide — aggravated assault is the most common. That pattern holds in Tulsa, Oklahoma, where there were 2,850 aggravated assaults in 2019. Due primarily to instances of aggravated assault, the violent crime rate in the city stands at 987 incidents for every 100,000 people.
Other, nonviolent forms of crime, such as burglary, larceny, and motor vehicle theft are also more common in Tulsa than they are nationwide. There were 21,336 property crimes reported in Tulsa in 2019, or 5,311 for every 100,000 residents. Meanwhile, the national property crime rate stood at 2,110 per 100,000 the same year.
Click here to see the full crime report for Tulsa, Oklahoma.

27. Buffalo, New York
> Violent crime rate in 2019: 991 per 100,000 people (2,533 total)
> Total homicides reported in 2019: 47
> 2019 poverty rate: 30.3%
> 2019 annual unemployment rate: 5.5%
> 2019 population: 255,686
As is the case nationwide, in Buffalo, New York, aggravated assault drives the overall violent crime rate more than any other offense. Of the 2,533 violent crimes committed in the city in 2019, 1,563 were aggravated assaults. Overall, there were 991 violent crimes reported in Buffalo for every 100,000 people in 2019.
Specifically, homicide is considerably more common in Buffalo than it is nationwide. There were 47 homicides committed in Buffalo in 2019, or 18.4 for every 100,000 people. Meanwhile, the national murder rate was just 5 per 100,000 the same year.
Click here to see the full crime report for Buffalo, New York.
[in-text-ad-2]
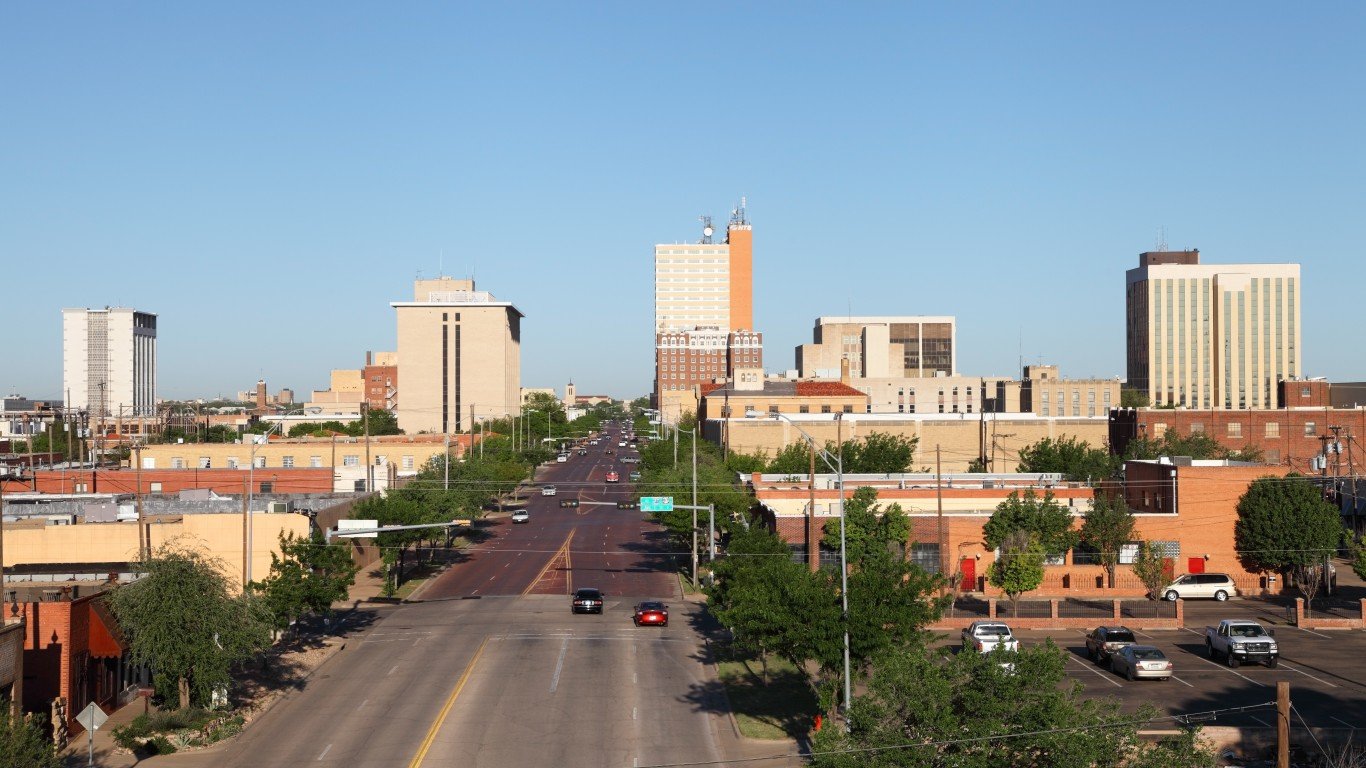
26. Lubbock, Texas
> Violent crime rate in 2019: 1,008 per 100,000 people (2,613 total)
> Total homicides reported in 2019: 10
> 2019 poverty rate: 20.2%
> 2019 annual unemployment rate: 2.8%
> 2019 population: 259,208
There were 1,008 violent crimes reported in Lubbock, Texas for every 100,000 people in 2019. For context, there were 367 violent crimes for every 100,000 people nationwide in 2019. As is the case across the United States, aggravated assault is the most common violent crime in Lubbock. Of the 2,613 violent crimes committed in the city in 2019, 1,867 were aggravated assaults.
Violent crime is far more common in Lubbock than it is in Texas. There were 419 violent crimes reported per 100,000 residents in Texas in 2019, far below the corresponding city figure.
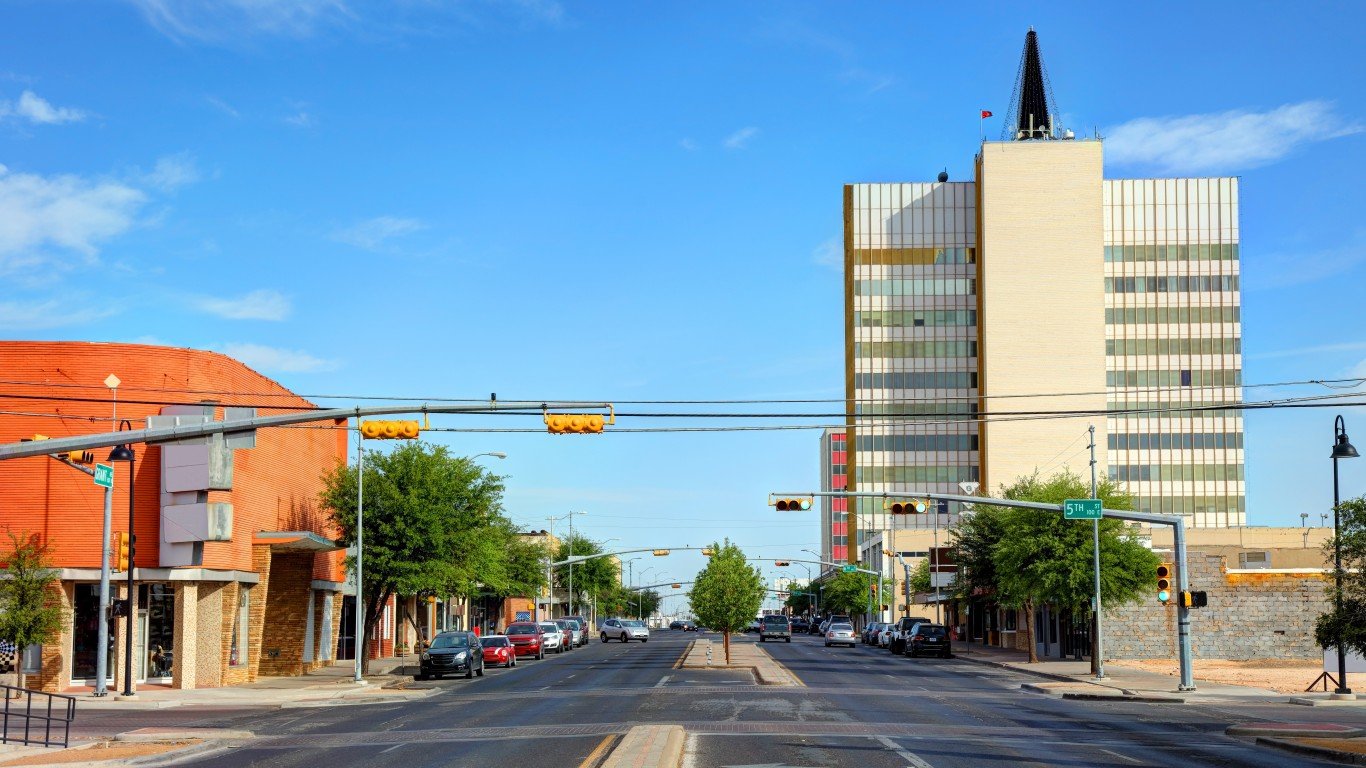
25. Odessa, Texas
> Violent crime rate in 2019: 1,038 per 100,000 people (1,282 total)
> Total homicides reported in 2019: 13
> 2019 poverty rate: 10.7%
> 2019 annual unemployment rate: 2.5%
> 2019 population: 123,468
The violent crime rate in Odessa, Texas, is among the highest of any U.S. city. There were 1,282 cases of rape, robbery, aggravated assault, and murder reported in Odessa in 2019, or 1,038 for every 100,000 people — more than double the violent crime rate nationwide of 367 incidents for every 100,000 people.
While poverty tends to be more common in areas with higher crime rates, Odessa is an exception. Some 10.7% of Odessa residents live below the poverty line, a lower poverty rate than the 14.1% national rate.
[in-text-ad]

24. Peoria, Illinois
> Violent crime rate in 2019: 1,044 per 100,000 people (1,158 total)
> Total homicides reported in 2019: 25
> 2019 poverty rate: 20.7%
> 2019 annual unemployment rate: 5.3%
> 2019 population: 110,955
There were 1,044 violent crimes reported per 100,000 Peoria residents in 2019, far more than the national rate of 367 violent crimes per 100,000 Americans and the 24th highest violent crime rate of any large city.
Murder is particularly common in Peoria. In 2019 there were 22.5 homicides reported for every 100,000 residents — more than four times the national murder rate of 5 per 100,000 people.
Click here to see the full crime report for Peoria, Illinois.

23. Beaumont, Texas
> Violent crime rate in 2019: 1,047 per 100,000 people (1,241 total)
> Total homicides reported in 2019: 19
> 2019 poverty rate: 19.9%
> 2019 annual unemployment rate: 5.2%
> 2019 population: 118,562
Of the four categories of violent crime — rape, robbery, aggravated assault, and homicide — aggravated assault is the most common. That pattern holds in Beaumont, Texas, where there were 802 aggravated assaults in 2019. Due primarily to instances of aggravated assault, the violent crime rate in the city stands at 1,047 incidents for every 100,000 people.
Though the relationship between economic conditions and crime is complicated, crime rates are often higher in areas with limited employment opportunities. In Beaumont, a relatively dangerous city, the annual unemployment rate stands at 5.2%, well above the comparable national jobless rate of 3.7%.
Click here to see the full crime report for Beaumont, Texas.

22. Chattanooga, Tennessee
> Violent crime rate in 2019: 1,070 per 100,000 people (1,946 total)
> Total homicides reported in 2019: 33
> 2019 poverty rate: 18.8%
> 2019 annual unemployment rate: 3.6%
> 2019 population: 181,848
As is the case nationwide, in Chattanooga, Tennessee, aggravated assault drives the overall violent crime rate more than any other offense. Of the 1,946 violent crimes committed in the city in 2019, 1,556 were aggravated assaults. Overall, there were 1,070 violent crimes reported in Chattanooga for every 100,000 people in 2019.
Crime tends to be more concentrated in areas with limited economic opportunity and widespread financial hardship — and this pattern holds in Chattanooga. Across the city, 18.8% of the population lives below the poverty line, well above the 14.1% national poverty rate.
Click here to see the full crime report for Chattanooga, Tennessee.
[in-text-ad-2]

21. Houston, Texas
> Violent crime rate in 2019: 1,072 per 100,000 people (25,257 total)
> Total homicides reported in 2019: 275
> 2019 poverty rate: 20.6%
> 2019 annual unemployment rate: 3.7%
> 2019 population: 2,355,606
There were 1,072 violent crimes reported in Houston, Texas for every 100,000 people in 2019. For context, there were 367 violent crimes for every 100,000 people nationwide in 2019. As is the case across the United States, aggravated assault is the most common violent crime in Houston. Of the 25,257 violent crimes committed in the city in 2019, 14,586 were aggravated assaults.
Other, nonviolent forms of crime, such as burglary, larceny, and motor vehicle theft are also more common in Houston than they are nationwide. There were 101,750 property crimes reported in Houston in 2019, or 4,319 for every 100,000 residents. Meanwhile, the national property crime rate stood at 2,110 per 100,000 the same year.

20. Nashville, Tennessee
> Violent crime rate in 2019: 1,073 per 100,000 people (7,376 total)
> Total homicides reported in 2019: 83
> 2019 poverty rate: 16.5%
> 2019 annual unemployment rate: 3.9%
> 2019 population: 687,361
The violent crime rate in Nashville, Tennessee, is among the highest of any U.S. city. There were 7,376 cases of rape, robbery, aggravated assault, and murder reported in Nashville in 2019, or 1,073 for every 100,000 people — more than double the violent crime rate nationwide of 367 incidents for every 100,000 people.
Specifically, homicide is considerably more common in Nashville than it is nationwide. There were 83 homicides committed in Nashville in 2019, or 12.1 for every 100,000 people. Meanwhile, the national murder rate was just 5 per 100,000 the same year.
Click here to see the full crime report for Nashville, Tennessee.
[in-text-ad]
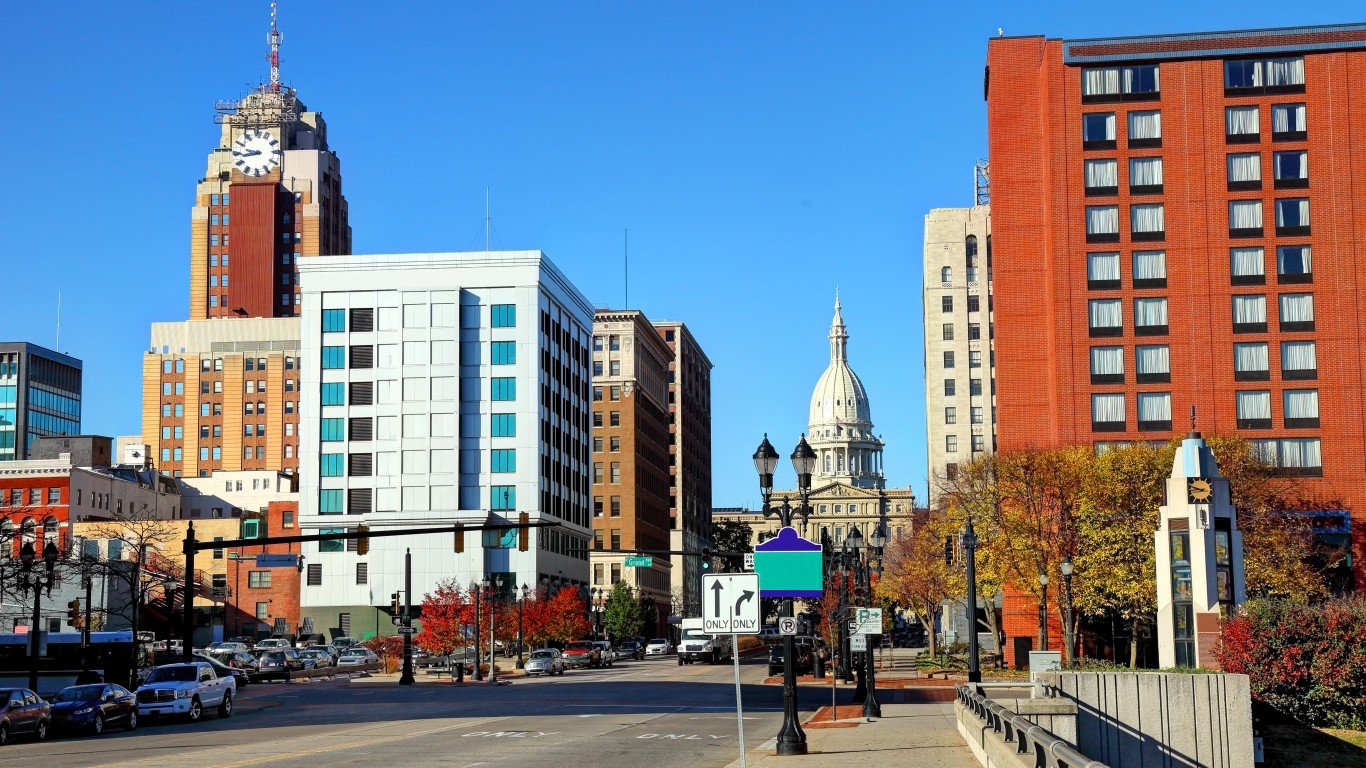
19. Lansing, Michigan
> Violent crime rate in 2019: 1,104 per 100,000 people (1,313 total)
> Total homicides reported in 2019: 12
> 2019 poverty rate: 26.1%
> 2019 annual unemployment rate: 5.0%
> 2019 population: 118,953
There were 1,104 violent crimes reported per 100,000 Lansing residents in 2019, far more than the national rate of 367 violent crimes per 100,000 Americans and the 19th highest violent crime rate of any large city.
Poverty tends to be more prevalent in areas where crime is more common. In Lansing, some 26.1% of residents live below the poverty line, far more than the national poverty rate of 14.1%.
Click here to see the full crime report for Lansing, Michigan.

18. Wichita, Kansas
> Violent crime rate in 2019: 1,141 per 100,000 people (4,451 total)
> Total homicides reported in 2019: 35
> 2019 poverty rate: 16.2%
> 2019 annual unemployment rate: 3.6%
> 2019 population: 390,080
Of the four categories of violent crime — rape, robbery, aggravated assault, and homicide — aggravated assault is the most common. That pattern holds in Wichita, Kansas, where there were 3,588 aggravated assaults in 2019. Due primarily to instances of aggravated assault, the violent crime rate in the city stands at 1,141 incidents for every 100,000 people.
Property crime — which includes burglary, larceny, and motor vehicle theft — is also relatively common in Wichita. There were 5,322 property crimes reported per 100,000 Wichita residents in 2019, far more than the national property crime rate of 2,110 incidents per 100,000 Americans.
Click here to see the full crime report for Wichita, Kansas.

17. New Orleans, Louisiana
> Violent crime rate in 2019: 1,145 per 100,000 people (4,516 total)
> Total homicides reported in 2019: 121
> 2019 poverty rate: 24.6%
> 2019 annual unemployment rate: 4.9%
> 2019 population: 394,498
New Orleans, Louisiana, has the 17th highest violent crime rate of any major American city, with 1,145 incidents per 100,000 people. Yet it has comparatively even more outsized rates of both homicide and rape.
The murder rate in New Orleans is the seventh highest of any U.S. city, at 31 homicides per 100,000 residents, over six times the U.S. murder rate. The city also reported the second highest rate of rape in the nation, with 196 rapes per 100,000 residents â nearly five times the national rate of 43 per 100,000.
Click here to see the full crime report for New Orleans, Louisiana.
[in-text-ad-2]

16. Rockford, Illinois
> Violent crime rate in 2019: 1,174 per 100,000 people (1,711 total)
> Total homicides reported in 2019: 14
> 2019 poverty rate: 22.6%
> 2019 annual unemployment rate: 6.8%
> 2019 population: 145,719
As is the case nationwide, in Rockford, Illinois, aggravated assault drives the overall violent crime rate more than any other offense. Of the 1,711 violent crimes committed in the city in 2019, 1,290 were aggravated assaults. Overall, there were 1,174 violent crimes reported in Rockford for every 100,000 people in 2019.
Violent crime is far more common in Rockford than it is in Illinois. There were 407 violent crimes reported per 100,000 residents in Illinois in 2019, far below the corresponding city figure.
Click here to see the full crime report for Rockford, Illinois.

15. Anchorage, Alaska
> Violent crime rate in 2019: 1,245 per 100,000 people (3,581 total)
> Total homicides reported in 2019: 32
> 2019 poverty rate: 9.2%
> 2019 annual unemployment rate: 5.1%
> 2019 population: 287,731
There were 1,245 violent crimes reported in Anchorage, Alaska for every 100,000 people in 2019. For context, there were 367 violent crimes for every 100,000 people nationwide in 2019. As is the case across the United States, aggravated assault is the most common violent crime in Anchorage. Of the 3,581 violent crimes committed in the city in 2019, 2,388 were aggravated assaults.
While the relationship between unemployment and violent crime is complicated, many of the cities with the highest violent crime rates have high unemployment. Some 5.1% of the Anchorage labor force was unemployed in 2019, a higher unemployment rate than the national rate of 3.7%.
Click here to see the full crime report for Anchorage, Alaska.
[in-text-ad]

14. Oakland, California
> Violent crime rate in 2019: 1,272 per 100,000 people (5,520 total)
> Total homicides reported in 2019: 78
> 2019 poverty rate: 17.6%
> 2019 annual unemployment rate: 3.4%
> 2019 population: 434,036
The violent crime rate in Oakland, California, is among the highest of any U.S. city. There were 5,520 cases of rape, robbery, aggravated assault, and murder reported in Oakland in 2019, or 1,272 for every 100,000 people — more than triple the violent crime rate nationwide of 367 incidents for every 100,000 people.
Crime tends to be more concentrated in areas with limited economic opportunity and widespread financial hardship — and this pattern holds in Oakland. Across the city, 17.6% of the population lives below the poverty line, well above the 14.1% national poverty rate.
Click here to see the full crime report for Oakland, California.
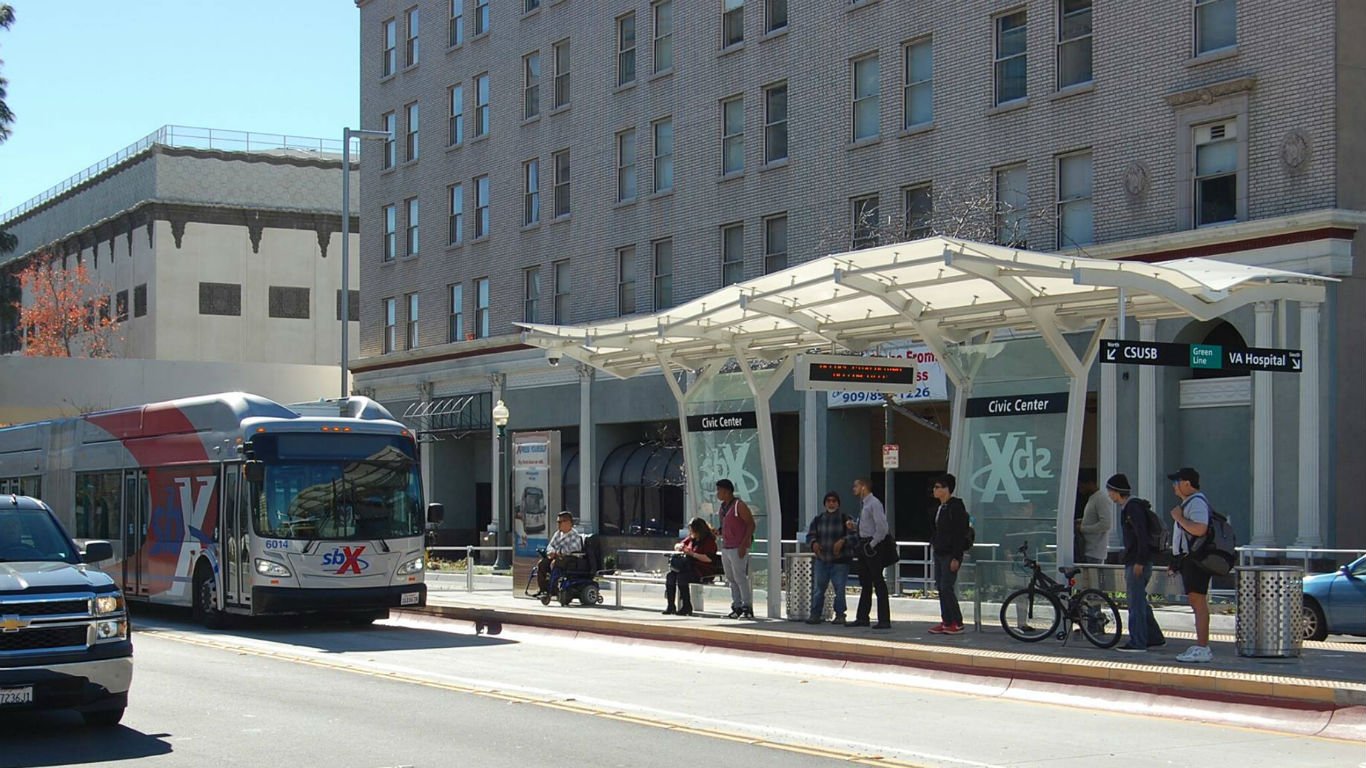
13. San Bernardino, California
> Violent crime rate in 2019: 1,319 per 100,000 people (2,858 total)
> Total homicides reported in 2019: 46
> 2019 poverty rate: 28.4%
> 2019 annual unemployment rate: 4.8%
> 2019 population: 216,715
There were 1,319 violent crimes reported per 100,000 San Bernardino residents in 2019, far more than the national rate of 367 violent crimes per 100,000 Americans and the 13th highest violent crime rate of any large city.
Other, nonviolent forms of crime, such as burglary, larceny, and motor vehicle theft are also more common in San Bernardino than they are nationwide. There were 9,081 property crimes reported in San Bernardino in 2019, or 4,190 for every 100,000 residents. Meanwhile, the national property crime rate stood at 2,110 per 100,000 the same year.
Click here to see the full crime report for San Bernardino, California.

12. South Bend, Indiana
> Violent crime rate in 2019: 1,331 per 100,000 people (1,357 total)
> Total homicides reported in 2019: 14
> 2019 poverty rate: 23.8%
> 2019 annual unemployment rate: 4.0%
> 2019 population: 101,944
Of the four categories of violent crime — rape, robbery, aggravated assault, and homicide — aggravated assault is the most common. That pattern holds in South Bend, Indiana, where there were 1,020 aggravated assaults in 2019. Due primarily to instances of aggravated assault, the violent crime rate in the city stands at 1,331 incidents for every 100,000 people.
Specifically, homicide is considerably more common in South Bend than it is nationwide. There were 14 homicides committed in South Bend in 2019, or 13.7 for every 100,000 people. Meanwhile, the national murder rate was just 5 per 100,000 the same year.
Click here to see the full crime report for South Bend, Indiana.
[in-text-ad-2]

11. Milwaukee, Wisconsin
> Violent crime rate in 2019: 1,332 per 100,000 people (7,874 total)
> Total homicides reported in 2019: 97
> 2019 poverty rate: 26.6%
> 2019 annual unemployment rate: 4.5%
> 2019 population: 590,923
As is the case nationwide, in Milwaukee, Wisconsin, aggravated assault drives the overall violent crime rate more than any other offense. Of the 7,874 violent crimes committed in the city in 2019, 5,439 were aggravated assaults. Overall, there were 1,332 violent crimes reported in Milwaukee for every 100,000 people in 2019.
Poverty tends to be more prevalent in areas where crime is more common. In Milwaukee, some 26.6% of residents live below the poverty line, far more than the national poverty rate of 14.1%.
Click here to see the full crime report for Milwaukee, Wisconsin.

10. Albuquerque, New Mexico
> Violent crime rate in 2019: 1,352 per 100,000 people (7,596 total)
> Total homicides reported in 2019: 84
> 2019 poverty rate: 17.6%
> 2019 annual unemployment rate: 4.4%
> 2019 population: 561,920
Albuquerque’s violent crime rate of 1,352 incidents per 100,000 people is the 10th highest of all large cities tracked by the FBI. Other crimes that are not included in the violent crime rate are also far more common in Albuquerque than they are in much of the rest of the country. For example, there were 965 motor vehicle thefts in the city for every 100,000 people in 2019, the seventh highest car theft rate among large U.S. cities and more than four times higher than the national motor vehicle theft rate of 220 per 100,000.
Click here to see the full crime report for Albuquerque, New Mexico.
[in-text-ad]

9. Stockton, California
> Violent crime rate in 2019: 1,397 per 100,000 people (4,380 total)
> Total homicides reported in 2019: 34
> 2019 poverty rate: 20.5%
> 2019 annual unemployment rate: 6.8%
> 2019 population: 313,604
There were 1,397 violent crimes reported in Stockton, California for every 100,000 people in 2019. For context, there were 367 violent crimes for every 100,000 people nationwide in 2019. As is the case across the United States, aggravated assault is the most common violent crime in Stockton. Of the 4,380 violent crimes committed in the city in 2019, 3,007 were aggravated assaults.
Though the relationship between economic conditions and crime is complicated, crime rates are often higher in areas with limited employment opportunities. In Stockton, a relatively dangerous city, the annual unemployment rate stands at 6.8%, well above the comparable national jobless rate of 3.7%.
Click here to see the full crime report for Stockton, California.

8. Kansas City, Missouri
> Violent crime rate in 2019: 1,431 per 100,000 people (7,099 total)
> Total homicides reported in 2019: 150
> 2019 poverty rate: 16.5%
> 2019 annual unemployment rate: 3.6%
> 2019 population: 495,964
The violent crime rate in Kansas City, Missouri, is among the highest of any U.S. city. There were 7,099 cases of rape, robbery, aggravated assault, and murder reported in Kansas City in 2019, or 1,431 for every 100,000 people — more than triple the violent crime rate nationwide of 367 incidents for every 100,000 people.
Property crime — which includes burglary, larceny, and motor vehicle theft — is also relatively common in Kansas City. There were 3,856 property crimes reported per 100,000 Kansas City residents in 2019, far more than the national property crime rate of 2,110 incidents per 100,000 Americans.
Click here to see the full crime report for Kansas City, Missouri.

7. Cleveland, Ohio
> Violent crime rate in 2019: 1,517 per 100,000 people (5,791 total)
> Total homicides reported in 2019: 92
> 2019 poverty rate: 34.6%
> 2019 annual unemployment rate: 5.2%
> 2019 population: 381,829
There were 1,517 violent crimes reported per 100,000 Cleveland residents in 2019, far more than the national rate of 367 violent crimes per 100,000 Americans and the seventh highest violent crime rate of any large city.
Murder is particularly common in Cleveland. In 2019 there were 24.1 homicides reported for every 100,000 residents — more than four times the national murder rate of 5 per 100,000 people.
Click here to see the full crime report for Cleveland, Ohio.
[in-text-ad-2]

6. Little Rock, Arkansas
> Violent crime rate in 2019: 1,517 per 100,000 people (3,009 total)
> Total homicides reported in 2019: 38
> 2019 poverty rate: 17.4%
> 2019 annual unemployment rate: 3.3%
> 2019 population: 198,382
Of the four categories of violent crime — rape, robbery, aggravated assault, and homicide — aggravated assault is the most common. That pattern holds in Little Rock, Arkansas, where there were 2,371 aggravated assaults in 2019. Due primarily to instances of aggravated assault, the violent crime rate in the city stands at 1,517 incidents for every 100,000 people.
Crime tends to be more concentrated in areas with limited economic opportunity and widespread financial hardship — and this pattern holds in Little Rock. Across the city, 17.4% of the population lives below the poverty line, well above the 14.1% national poverty rate.
Click here to see the full crime report for Little Rock, Arkansas.
5. Springfield, Missouri
> Violent crime rate in 2019: 1,519 per 100,000 people (2,571 total)
> Total homicides reported in 2019: 11
> 2019 poverty rate: 24.8%
> 2019 annual unemployment rate: 2.8%
> 2019 population: 169,235
As is the case nationwide, in Springfield, Missouri, aggravated assault drives the overall violent crime rate more than any other offense. Of the 2,571 violent crimes committed in the city in 2019, 1,885 were aggravated assaults. Overall, there were 1,519 violent crimes reported in Springfield for every 100,000 people in 2019.
Other, nonviolent forms of crime, such as burglary, larceny, and motor vehicle theft are also more common in Springfield than they are nationwide. There were 13,188 property crimes reported in Springfield in 2019, or 7,793 for every 100,000 residents. Meanwhile, the national property crime rate stood at 2,110 per 100,000 the same year.
Click here to see the full crime report for Springfield, Missouri.
[in-text-ad]

4. Baltimore, Maryland
> Violent crime rate in 2019: 1,859 per 100,000 people (11,101 total)
> Total homicides reported in 2019: 348
> 2019 poverty rate: 21.8%
> 2019 annual unemployment rate: 5.1%
> 2019 population: 597,239
There were 1,859 violent crimes reported in Baltimore, Maryland for every 100,000 people in 2019. For context, there were 367 violent crimes for every 100,000 people nationwide in 2019. As is the case across the United States, aggravated assault is the most common violent crime in Baltimore. Of the 11,101 violent crimes committed in the city in 2019, 5,573 were aggravated assaults.
Violent crime is far more common in Baltimore than it is in Maryland. There were 454 violent crimes reported per 100,000 residents in Maryland in 2019, far below the corresponding city figure.
Click here to see the full crime report for Baltimore, Maryland.

3. Memphis, Tennessee
> Violent crime rate in 2019: 1,901 per 100,000 people (12,367 total)
> Total homicides reported in 2019: 190
> 2019 poverty rate: 26.8%
> 2019 annual unemployment rate: 4.4%
> 2019 population: 650,410
The violent crime rate in Memphis, Tennessee, is among the highest of any U.S. city. There were 12,367 cases of rape, robbery, aggravated assault, and murder reported in Memphis in 2019, or 1,901 for every 100,000 people — more than five times the violent crime rate nationwide of 367 incidents for every 100,000 people.
Specifically, homicide is considerably more common in Memphis than it is nationwide. There were 190 homicides committed in Memphis in 2019, or 29.2 for every 100,000 people. Meanwhile, the national murder rate was just 5 per 100,000 the same year.
Click here to see the full crime report for Memphis, Tennessee.

2. St. Louis, Missouri
> Violent crime rate in 2019: 1,927 per 100,000 people (5,792 total)
> Total homicides reported in 2019: 194
> 2019 poverty rate: 24.2%
> 2019 annual unemployment rate: 3.9%
> 2019 population: 300,521
There were 1,927 violent crimes reported per 100,000 St. Louis residents in 2019, far more than the national rate of 367 violent crimes per 100,000 Americans and the second highest violent crime rate of any large city.
Poverty tends to be more prevalent in areas where crime is more common. In St. Louis, some 24.2% of residents live below the poverty line, far more than the national poverty rate of 14.1%.
Click here to see the full crime report for St. Louis, Missouri.
[in-text-ad-2]

1. Detroit, Michigan
> Violent crime rate in 2019: 1,965 per 100,000 people (13,040 total)
> Total homicides reported in 2019: 275
> 2019 poverty rate: 36.4%
> 2019 annual unemployment rate: 8.8%
> 2019 population: 663,502
Detroit, Michigan, ranks as the most dangerous city in the United States. There were 13,040 reported in Detroit in 2019 — or 1,965 for every 100,000 people. For context, there were only 367 violent crimes for every 100,000 people nationwide in 2019.
Though the relationship between economic conditions and crime is complicated, crime rates are often higher in areas with limited employment opportunities. In Detroit, a relatively dangerous city, the annual unemployment rate stands at 8.8%, well above the comparable national jobless rate of 3.7%.
Click here to see the full crime report for Detroit, Michigan.
Read More:
24/7 Wall St. has published visualizations of the most recent crime data for over 4,000 cities and all 50 states.
Click here to see the full list of cities with visualized data.
Click here to find this data for any state.
Methodology
To determine the 50 most dangerous cities in America, 24/7 Wall St. reviewed violent crime figures in cities with at least 100,000 people from the FBI’s 2019 Uniform Crime Report. Violent crime includes murder, non-negligent manslaughter, rape, robbery, and aggravated assault, and property crime includes burglaries, larceny, and motor vehicle theft. Violent crime figures were adjusted for population using data from the FBI.
Annual unemployment rates for 2019 came from the Bureau of Labor Statistics (BLS). Median household income, poverty rates, and the percentage of households earning less than $10,000 a year came from the U.S. Census Bureau’s American Community Survey (ACS) and are five-year averages for the period 2014 to 2018.
Read More:
24/7 Wall St. has published visualizations of the most recent crime data for over 4,000 cities and all 50 states.
Click here to see the full list of cities with visualized data.
Click here to find this data for any state.
Contact [email protected] for any questions or corrections.