
Nearly half of all Americans with health insurance receive coverage through their employer. When the COVID-19 pandemic hit, however, millions of Americans lost their jobs, and nearly 30% of U.S. residents lost their health insurance coverage. While many have returned to employment, the health insurance situation likely remains far from the pre-pandemic normal.
It remains to be seen how much of an impact the pandemic has truly had on health coverage in the United States, but there are a number of American cities where even a substantial loss of insurance coverage would not have driven numbers up beyond the national figure. As many as 10.3% of Americans did not have health insurance coverage in 2019, the most recent year for which data was available. In 50 American cities, 2.6% or less of the population under 65 did not have health insurance.
To determine the cities with the best health insurance coverage in the nation, 24/7 Wall St. reviewed five-year estimates of the percentage of the noninstitutionalized civilian population under 65 without health insurance from the U.S. Census Bureau’s 2019 American Community Survey.
The 50 cities on this list can be found in 17 states, and 24 of the cities are in either California or Massachusetts. Massachusetts has the lowest uninsured rate in the country, at just 3.2% of the population under 65.
Click here to see cities with the best health insurance coverage.
Click here to see our detailed methodology.

50. Oakley, California
> Adults under 65, no health insurance: 2.6%
> Adults under 65, Medicare coverage (or multiple types): 2.3% — 797th lowest of 1,669 cities
> Adults under 65, Medicaid coverage (or multiple types): 20.7% — 779th highest of 1,669 cities
> Adults under 65, VA coverage (or multiple types): 0.9% — 751st lowest of 1,669 cities
> Adults under 65, employer-based insurance (or multiple types): 72.4% — 325th highest of 1,669 cities
> Adults under 65, direct-purchase insurance (or multiple types): 11.1% — 562nd highest of 1,669 cities
> Adults under 65, Tricare/military insurance (or many types): 0.5% — 340th lowest of 1,669 cities
[in-text-ad]

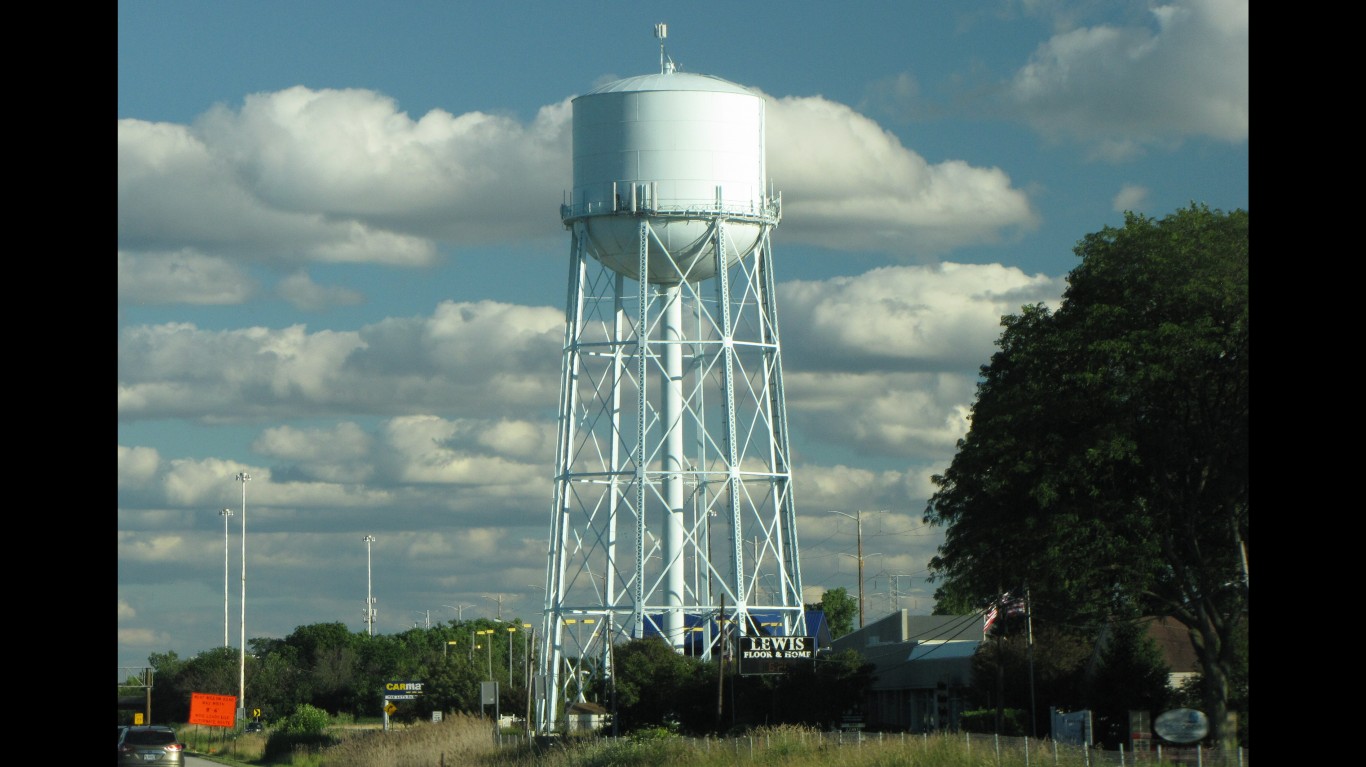
49. Plainfield, Illinois
> Adults under 65, no health insurance: 2.6%
> Adults under 65, Medicare coverage (or multiple types): 0.5% — 9th lowest of 1,669 cities
> Adults under 65, Medicaid coverage (or multiple types): 5.8% — 64th lowest of 1,669 cities
> Adults under 65, VA coverage (or multiple types): 0.7% — 455th lowest of 1,669 cities
> Adults under 65, employer-based insurance (or multiple types): 84.0% — 15th highest of 1,669 cities
> Adults under 65, direct-purchase insurance (or multiple types): 9.7% — 829th lowest of 1,669 cities
> Adults under 65, Tricare/military insurance (or many types): 1.8% — 475th highest of 1,669 cities
[recirclink id=882508]

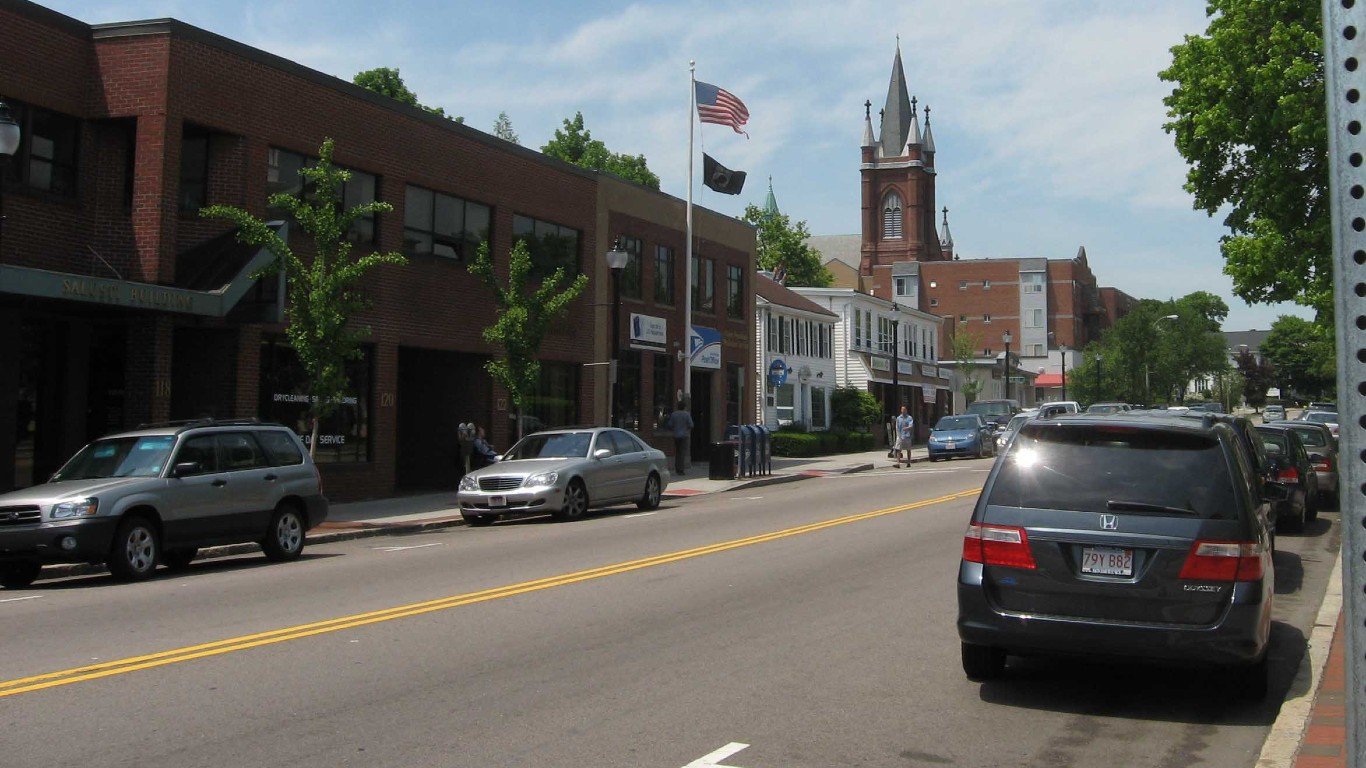
48. Taunton, Massachusetts
> Adults under 65, no health insurance: 2.6%
> Adults under 65, Medicare coverage (or multiple types): 4.1% — 251st highest of 1,669 cities
> Adults under 65, Medicaid coverage (or multiple types): 37.5% — 166th highest of 1,669 cities
> Adults under 65, VA coverage (or multiple types): 0.8% — 672nd lowest of 1,669 cities
> Adults under 65, employer-based insurance (or multiple types): 59.8% — 819th lowest of 1,669 cities
> Adults under 65, direct-purchase insurance (or multiple types): 8.1% — 492nd lowest of 1,669 cities
> Adults under 65, Tricare/military insurance (or many types): 1.1% — 822nd highest of 1,669 cities

47. Newark, California
> Adults under 65, no health insurance: 2.6%
> Adults under 65, Medicare coverage (or multiple types): 1.1% — 157th lowest of 1,669 cities
> Adults under 65, Medicaid coverage (or multiple types): 25.3% — 537th highest of 1,669 cities
> Adults under 65, VA coverage (or multiple types): 0.3% — 75th lowest of 1,669 cities
> Adults under 65, employer-based insurance (or multiple types): 68.4% — 490th highest of 1,669 cities
> Adults under 65, direct-purchase insurance (or multiple types): 7.9% — 434th lowest of 1,669 cities
> Adults under 65, Tricare/military insurance (or many types): 0.3% — 177th lowest of 1,669 cities
[in-text-ad-2]

46. Milpitas, California
> Adults under 65, no health insurance: 2.5%
> Adults under 65, Medicare coverage (or multiple types): 1.0% — 110th lowest of 1,669 cities
> Adults under 65, Medicaid coverage (or multiple types): 13.9% — 497th lowest of 1,669 cities
> Adults under 65, VA coverage (or multiple types): 0.3% — 116th lowest of 1,669 cities
> Adults under 65, employer-based insurance (or multiple types): 77.0% — 157th highest of 1,669 cities
> Adults under 65, direct-purchase insurance (or multiple types): 10.5% — 681st highest of 1,669 cities
> Adults under 65, Tricare/military insurance (or many types): 0.4% — 240th lowest of 1,669 cities

45. Trumbull, Connecticut
> Adults under 65, no health insurance: 2.5%
> Adults under 65, Medicare coverage (or multiple types): 1.4% — 297th lowest of 1,669 cities
> Adults under 65, Medicaid coverage (or multiple types): 12.2% — 395th lowest of 1,669 cities
> Adults under 65, VA coverage (or multiple types): 0.2% — 57th lowest of 1,669 cities
> Adults under 65, employer-based insurance (or multiple types): 77.8% — 135th highest of 1,669 cities
> Adults under 65, direct-purchase insurance (or multiple types): 9.7% — 832nd lowest of 1,669 cities
> Adults under 65, Tricare/military insurance (or many types): 0.2% — 85th lowest of 1,669 cities
[in-text-ad]

44. Dublin, California
> Adults under 65, no health insurance: 2.5%
> Adults under 65, Medicare coverage (or multiple types): 1.1% — 149th lowest of 1,669 cities
> Adults under 65, Medicaid coverage (or multiple types): 5.4% — 56th lowest of 1,669 cities
> Adults under 65, VA coverage (or multiple types): 0.2% — 45th lowest of 1,669 cities
> Adults under 65, employer-based insurance (or multiple types): 83.4% — 25th highest of 1,669 cities
> Adults under 65, direct-purchase insurance (or multiple types): 12.0% — 428th highest of 1,669 cities
> Adults under 65, Tricare/military insurance (or many types): 0.2% — 76th lowest of 1,669 cities
[recirclink id=905592]

43. Bethany, Oregon
> Adults under 65, no health insurance: 2.5%
> Adults under 65, Medicare coverage (or multiple types): 0.6% — 21st lowest of 1,669 cities
> Adults under 65, Medicaid coverage (or multiple types): 6.1% — 78th lowest of 1,669 cities
> Adults under 65, VA coverage (or multiple types): 0.4% — 204th lowest of 1,669 cities
> Adults under 65, employer-based insurance (or multiple types): 85.5% — 5th highest of 1,669 cities
> Adults under 65, direct-purchase insurance (or multiple types): 10.4% — 708th highest of 1,669 cities
> Adults under 65, Tricare/military insurance (or many types): 0.9% — 707th lowest of 1,669 cities

42. Palo Alto, California
> Adults under 65, no health insurance: 2.5%
> Adults under 65, Medicare coverage (or multiple types): 0.7% — 36th lowest of 1,669 cities
> Adults under 65, Medicaid coverage (or multiple types): 5.0% — 47th lowest of 1,669 cities
> Adults under 65, VA coverage (or multiple types): 0.2% — 28th lowest of 1,669 cities
> Adults under 65, employer-based insurance (or multiple types): 81.3% — 62nd highest of 1,669 cities
> Adults under 65, direct-purchase insurance (or multiple types): 14.1% — 237th highest of 1,669 cities
> Adults under 65, Tricare/military insurance (or many types): 0.1% — 30th lowest of 1,669 cities
[in-text-ad-2]

41. Plum, Pennsylvania
> Adults under 65, no health insurance: 2.5%
> Adults under 65, Medicare coverage (or multiple types): 1.4% — 301st lowest of 1,669 cities
> Adults under 65, Medicaid coverage (or multiple types): 8.6% — 185th lowest of 1,669 cities
> Adults under 65, VA coverage (or multiple types): 0.7% — 545th lowest of 1,669 cities
> Adults under 65, employer-based insurance (or multiple types): 80.2% — 80th highest of 1,669 cities
> Adults under 65, direct-purchase insurance (or multiple types): 12.8% — 335th highest of 1,669 cities
> Adults under 65, Tricare/military insurance (or many types): 0.8% — 614th lowest of 1,669 cities

40. Union City, California
> Adults under 65, no health insurance: 2.4%
> Adults under 65, Medicare coverage (or multiple types): 1.5% — 338th lowest of 1,669 cities
> Adults under 65, Medicaid coverage (or multiple types): 20.0% — 819th highest of 1,669 cities
> Adults under 65, VA coverage (or multiple types): 0.5% — 254th lowest of 1,669 cities
> Adults under 65, employer-based insurance (or multiple types): 72.5% — 322nd highest of 1,669 cities
> Adults under 65, direct-purchase insurance (or multiple types): 7.2% — 304th lowest of 1,669 cities
> Adults under 65, Tricare/military insurance (or many types): 0.5% — 343rd lowest of 1,669 cities
[in-text-ad]

39. Brookline, Massachusetts
> Adults under 65, no health insurance: 2.4%
> Adults under 65, Medicare coverage (or multiple types): 1.8% — 542nd lowest of 1,669 cities
> Adults under 65, Medicaid coverage (or multiple types): 7.2% — 127th lowest of 1,669 cities
> Adults under 65, VA coverage (or multiple types): 0.2% — 31st lowest of 1,669 cities
> Adults under 65, employer-based insurance (or multiple types): 78.9% — 111th highest of 1,669 cities
> Adults under 65, direct-purchase insurance (or multiple types): 19.4% — 56th highest of 1,669 cities
> Adults under 65, Tricare/military insurance (or many types): 0.2% — 80th lowest of 1,669 cities
[recirclink id=890210]

38. Benicia, California
> Adults under 65, no health insurance: 2.4%
> Adults under 65, Medicare coverage (or multiple types): 1.4% — 302nd lowest of 1,669 cities
> Adults under 65, Medicaid coverage (or multiple types): 14.6% — 540th lowest of 1,669 cities
> Adults under 65, VA coverage (or multiple types): 0.6% — 397th lowest of 1,669 cities
> Adults under 65, employer-based insurance (or multiple types): 78.4% — 122nd highest of 1,669 cities
> Adults under 65, direct-purchase insurance (or multiple types): 9.2% — 729th lowest of 1,669 cities
> Adults under 65, Tricare/military insurance (or many types): 1.6% — 548th highest of 1,669 cities

37. Andover, Minnesota
> Adults under 65, no health insurance: 2.4%
> Adults under 65, Medicare coverage (or multiple types): 0.9% — 97th lowest of 1,669 cities
> Adults under 65, Medicaid coverage (or multiple types): 9.7% — 244th lowest of 1,669 cities
> Adults under 65, VA coverage (or multiple types): 0.8% — 606th lowest of 1,669 cities
> Adults under 65, employer-based insurance (or multiple types): 82.0% — 47th highest of 1,669 cities
> Adults under 65, direct-purchase insurance (or multiple types): 8.3% — 521st lowest of 1,669 cities
> Adults under 65, Tricare/military insurance (or many types): 1.2% — 740th highest of 1,669 cities
[in-text-ad-2]

36. Cottage Grove, Minnesota
> Adults under 65, no health insurance: 2.4%
> Adults under 65, Medicare coverage (or multiple types): 1.6% — 386th lowest of 1,669 cities
> Adults under 65, Medicaid coverage (or multiple types): 10.1% — 270th lowest of 1,669 cities
> Adults under 65, VA coverage (or multiple types): 1.2% — 648th highest of 1,669 cities
> Adults under 65, employer-based insurance (or multiple types): 81.8% — 52nd highest of 1,669 cities
> Adults under 65, direct-purchase insurance (or multiple types): 9.0% — 688th lowest of 1,669 cities
> Adults under 65, Tricare/military insurance (or many types): 2.0% — 440th highest of 1,669 cities

35. Pleasanton, California
> Adults under 65, no health insurance: 2.4%
> Adults under 65, Medicare coverage (or multiple types): 1.0% — 121st lowest of 1,669 cities
> Adults under 65, Medicaid coverage (or multiple types): 5.3% — 52nd lowest of 1,669 cities
> Adults under 65, VA coverage (or multiple types): 0.2% — 47th lowest of 1,669 cities
> Adults under 65, employer-based insurance (or multiple types): 81.7% — 56th highest of 1,669 cities
> Adults under 65, direct-purchase insurance (or multiple types): 13.3% — 293rd highest of 1,669 cities
> Adults under 65, Tricare/military insurance (or many types): 0.3% — 156th lowest of 1,669 cities
[in-text-ad]

34. Northampton, Massachusetts
> Adults under 65, no health insurance: 2.4%
> Adults under 65, Medicare coverage (or multiple types): 2.4% — 819th highest of 1,669 cities
> Adults under 65, Medicaid coverage (or multiple types): 23.3% — 630th highest of 1,669 cities
> Adults under 65, VA coverage (or multiple types): 0.8% — 622nd lowest of 1,669 cities
> Adults under 65, employer-based insurance (or multiple types): 65.9% — 604th highest of 1,669 cities
> Adults under 65, direct-purchase insurance (or multiple types): 13.3% — 288th highest of 1,669 cities
> Adults under 65, Tricare/military insurance (or many types): 0.3% — 145th lowest of 1,669 cities
[recirclink id=882508]

33. Westfield, New Jersey
> Adults under 65, no health insurance: 2.3%
> Adults under 65, Medicare coverage (or multiple types): 1.2% — 218th lowest of 1,669 cities
> Adults under 65, Medicaid coverage (or multiple types): 3.8% — 15th lowest of 1,669 cities
> Adults under 65, VA coverage (or multiple types): 0.2% — 33rd lowest of 1,669 cities
> Adults under 65, employer-based insurance (or multiple types): 86.7% — 3rd highest of 1,669 cities
> Adults under 65, direct-purchase insurance (or multiple types): 8.2% — 502nd lowest of 1,669 cities
> Adults under 65, Tricare/military insurance (or many types): 0.6% — 445th lowest of 1,669 cities

32. San Ramon, California
> Adults under 65, no health insurance: 2.3%
> Adults under 65, Medicare coverage (or multiple types): 0.9% — 73rd lowest of 1,669 cities
> Adults under 65, Medicaid coverage (or multiple types): 5.0% — 45th lowest of 1,669 cities
> Adults under 65, VA coverage (or multiple types): 0.3% — 92nd lowest of 1,669 cities
> Adults under 65, employer-based insurance (or multiple types): 83.4% — 22nd highest of 1,669 cities
> Adults under 65, direct-purchase insurance (or multiple types): 12.6% — 357th highest of 1,669 cities
> Adults under 65, Tricare/military insurance (or many types): 0.6% — 426th lowest of 1,669 cities
[in-text-ad-2]

31. Hoboken, New Jersey
> Adults under 65, no health insurance: 2.3%
> Adults under 65, Medicare coverage (or multiple types): 0.9% — 92nd lowest of 1,669 cities
> Adults under 65, Medicaid coverage (or multiple types): 6.5% — 97th lowest of 1,669 cities
> Adults under 65, VA coverage (or multiple types): 0.3% — 114th lowest of 1,669 cities
> Adults under 65, employer-based insurance (or multiple types): 85.1% — 8th highest of 1,669 cities
> Adults under 65, direct-purchase insurance (or multiple types): 7.6% — 374th lowest of 1,669 cities
> Adults under 65, Tricare/military insurance (or many types): 0.2% — 62nd lowest of 1,669 cities

30. Madison, Mississippi
> Adults under 65, no health insurance: 2.3%
> Adults under 65, Medicare coverage (or multiple types): 0.9% — 77th lowest of 1,669 cities
> Adults under 65, Medicaid coverage (or multiple types): 4.3% — 29th lowest of 1,669 cities
> Adults under 65, VA coverage (or multiple types): 1.3% — 583rd highest of 1,669 cities
> Adults under 65, employer-based insurance (or multiple types): 79.1% — 102nd highest of 1,669 cities
> Adults under 65, direct-purchase insurance (or multiple types): 16.6% — 118th highest of 1,669 cities
> Adults under 65, Tricare/military insurance (or many types): 2.5% — 318th highest of 1,669 cities
[in-text-ad]

29. Cambridge, Massachusetts
> Adults under 65, no health insurance: 2.2%
> Adults under 65, Medicare coverage (or multiple types): 1.2% — 196th lowest of 1,669 cities
> Adults under 65, Medicaid coverage (or multiple types): 11.6% — 359th lowest of 1,669 cities
> Adults under 65, VA coverage (or multiple types): 0.3% — 68th lowest of 1,669 cities
> Adults under 65, employer-based insurance (or multiple types): 74.5% — 245th highest of 1,669 cities
> Adults under 65, direct-purchase insurance (or multiple types): 16.0% — 139th highest of 1,669 cities
> Adults under 65, Tricare/military insurance (or many types): 0.5% — 285th lowest of 1,669 cities
[recirclink id=905592]

28. Bethesda, Maryland
> Adults under 65, no health insurance: 2.2%
> Adults under 65, Medicare coverage (or multiple types): 0.7% — 49th lowest of 1,669 cities
> Adults under 65, Medicaid coverage (or multiple types): 3.2% — 5th lowest of 1,669 cities
> Adults under 65, VA coverage (or multiple types): 0.3% — 122nd lowest of 1,669 cities
> Adults under 65, employer-based insurance (or multiple types): 83.0% — 29th highest of 1,669 cities
> Adults under 65, direct-purchase insurance (or multiple types): 12.5% — 373rd highest of 1,669 cities
> Adults under 65, Tricare/military insurance (or many types): 3.5% — 213th highest of 1,669 cities

27. Westport, Connecticut
> Adults under 65, no health insurance: 2.2%
> Adults under 65, Medicare coverage (or multiple types): 0.3% — 3rd lowest of 1,669 cities
> Adults under 65, Medicaid coverage (or multiple types): 5.9% — 70th lowest of 1,669 cities
> Adults under 65, VA coverage (or multiple types): 0.1% — 12th lowest of 1,669 cities
> Adults under 65, employer-based insurance (or multiple types): 79.1% — 103rd highest of 1,669 cities
> Adults under 65, direct-purchase insurance (or multiple types): 15.9% — 146th highest of 1,669 cities
> Adults under 65, Tricare/military insurance (or many types): 0.2% — 93rd lowest of 1,669 cities
[in-text-ad-2]

26. Commack, New York
> Adults under 65, no health insurance: 2.2%
> Adults under 65, Medicare coverage (or multiple types): 1.7% — 472nd lowest of 1,669 cities
> Adults under 65, Medicaid coverage (or multiple types): 6.6% — 101st lowest of 1,669 cities
> Adults under 65, VA coverage (or multiple types): 0.5% — 231st lowest of 1,669 cities
> Adults under 65, employer-based insurance (or multiple types): 84.4% — 12th highest of 1,669 cities
> Adults under 65, direct-purchase insurance (or multiple types): 10.6% — 659th highest of 1,669 cities
> Adults under 65, Tricare/military insurance (or many types): 0.1% — 40th lowest of 1,669 cities

25. Beverly, Massachusetts
> Adults under 65, no health insurance: 2.2%
> Adults under 65, Medicare coverage (or multiple types): 2.9% — 605th highest of 1,669 cities
> Adults under 65, Medicaid coverage (or multiple types): 18.5% — 765th lowest of 1,669 cities
> Adults under 65, VA coverage (or multiple types): 0.7% — 525th lowest of 1,669 cities
> Adults under 65, employer-based insurance (or multiple types): 72.5% — 323rd highest of 1,669 cities
> Adults under 65, direct-purchase insurance (or multiple types): 12.5% — 362nd highest of 1,669 cities
> Adults under 65, Tricare/military insurance (or many types): 0.5% — 364th lowest of 1,669 cities
[in-text-ad]

24. Cupertino, California
> Adults under 65, no health insurance: 2.2%
> Adults under 65, Medicare coverage (or multiple types): 0.7% — 25th lowest of 1,669 cities
> Adults under 65, Medicaid coverage (or multiple types): 4.5% — 36th lowest of 1,669 cities
> Adults under 65, VA coverage (or multiple types): 0.1% — 15th lowest of 1,669 cities
> Adults under 65, employer-based insurance (or multiple types): 84.6% — 10th highest of 1,669 cities
> Adults under 65, direct-purchase insurance (or multiple types): 11.6% — 476th highest of 1,669 cities
> Adults under 65, Tricare/military insurance (or many types): 0.2% — 58th lowest of 1,669 cities
[recirclink id=890210]

23. Highlands Ranch, Colorado
> Adults under 65, no health insurance: 2.0%
> Adults under 65, Medicare coverage (or multiple types): 0.8% — 60th lowest of 1,669 cities
> Adults under 65, Medicaid coverage (or multiple types): 6.1% — 82nd lowest of 1,669 cities
> Adults under 65, VA coverage (or multiple types): 0.7% — 504th lowest of 1,669 cities
> Adults under 65, employer-based insurance (or multiple types): 83.5% — 21st highest of 1,669 cities
> Adults under 65, direct-purchase insurance (or multiple types): 11.0% — 583rd highest of 1,669 cities
> Adults under 65, Tricare/military insurance (or many types): 1.4% — 667th highest of 1,669 cities
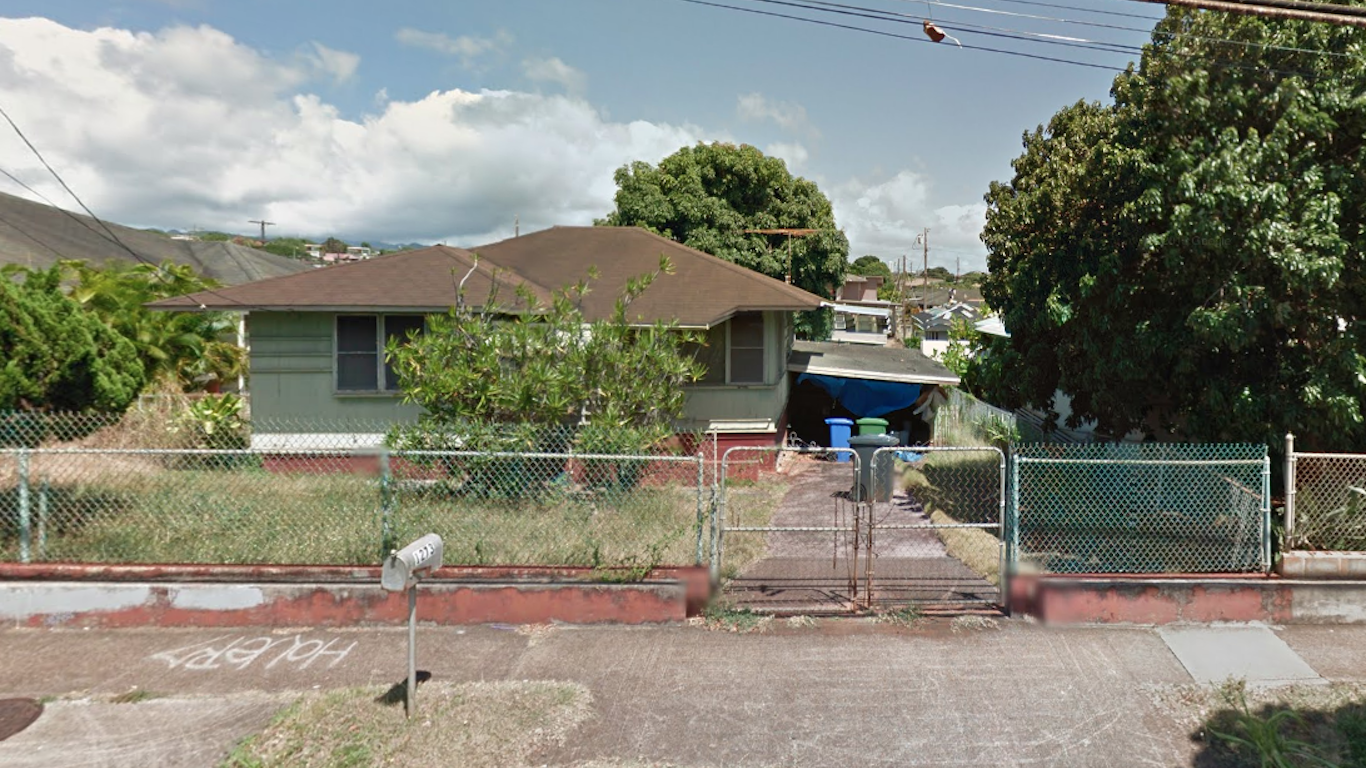
22. Pearl City, Hawaii
> Adults under 65, no health insurance: 2.0%
> Adults under 65, Medicare coverage (or multiple types): 1.4% — 310th lowest of 1,669 cities
> Adults under 65, Medicaid coverage (or multiple types): 10.7% — 305th lowest of 1,669 cities
> Adults under 65, VA coverage (or multiple types): 1.8% — 282nd highest of 1,669 cities
> Adults under 65, employer-based insurance (or multiple types): 74.6% — 238th highest of 1,669 cities
> Adults under 65, direct-purchase insurance (or multiple types): 9.1% — 716th lowest of 1,669 cities
> Adults under 65, Tricare/military insurance (or many types): 12.9% — 51st highest of 1,669 cities
[in-text-ad-2]

21. Woburn, Massachusetts
> Adults under 65, no health insurance: 2.0%
> Adults under 65, Medicare coverage (or multiple types): 1.9% — 549th lowest of 1,669 cities
> Adults under 65, Medicaid coverage (or multiple types): 20.0% — 818th highest of 1,669 cities
> Adults under 65, VA coverage (or multiple types): 0.4% — 181st lowest of 1,669 cities
> Adults under 65, employer-based insurance (or multiple types): 73.3% — 288th highest of 1,669 cities
> Adults under 65, direct-purchase insurance (or multiple types): 10.1% — 775th highest of 1,669 cities
> Adults under 65, Tricare/military insurance (or many types): 0.5% — 304th lowest of 1,669 cities

20. Brentwood, Tennessee
> Adults under 65, no health insurance: 1.9%
> Adults under 65, Medicare coverage (or multiple types): 0.4% — 6th lowest of 1,669 cities
> Adults under 65, Medicaid coverage (or multiple types): 2.3% — 2nd lowest of 1,669 cities
> Adults under 65, VA coverage (or multiple types): 0.2% — 58th lowest of 1,669 cities
> Adults under 65, employer-based insurance (or multiple types): 82.1% — 45th highest of 1,669 cities
> Adults under 65, direct-purchase insurance (or multiple types): 16.7% — 116th highest of 1,669 cities
> Adults under 65, Tricare/military insurance (or many types): 1.0% — 759th lowest of 1,669 cities
[in-text-ad]

19. Belmont, California
> Adults under 65, no health insurance: 1.9%
> Adults under 65, Medicare coverage (or multiple types): 2.1% — 709th lowest of 1,669 cities
> Adults under 65, Medicaid coverage (or multiple types): 8.3% — 168th lowest of 1,669 cities
> Adults under 65, VA coverage (or multiple types): 0.4% — 132nd lowest of 1,669 cities
> Adults under 65, employer-based insurance (or multiple types): 81.9% — 49th highest of 1,669 cities
> Adults under 65, direct-purchase insurance (or multiple types): 11.4% — 514th highest of 1,669 cities
> Adults under 65, Tricare/military insurance (or many types): 0.1% — 23rd lowest of 1,669 cities
[recirclink id=882508]

18. El Dorado Hills, California
> Adults under 65, no health insurance: 1.9%
> Adults under 65, Medicare coverage (or multiple types): 0.8% — 52nd lowest of 1,669 cities
> Adults under 65, Medicaid coverage (or multiple types): 8.3% — 174th lowest of 1,669 cities
> Adults under 65, VA coverage (or multiple types): 0.7% — 542nd lowest of 1,669 cities
> Adults under 65, employer-based insurance (or multiple types): 81.5% — 58th highest of 1,669 cities
> Adults under 65, direct-purchase insurance (or multiple types): 11.7% — 474th highest of 1,669 cities
> Adults under 65, Tricare/military insurance (or many types): 0.9% — 720th lowest of 1,669 cities

17. Fremont, California
> Adults under 65, no health insurance: 1.9%
> Adults under 65, Medicare coverage (or multiple types): 1.0% — 135th lowest of 1,669 cities
> Adults under 65, Medicaid coverage (or multiple types): 13.9% — 494th lowest of 1,669 cities
> Adults under 65, VA coverage (or multiple types): 0.4% — 136th lowest of 1,669 cities
> Adults under 65, employer-based insurance (or multiple types): 79.0% — 105th highest of 1,669 cities
> Adults under 65, direct-purchase insurance (or multiple types): 8.4% — 543rd lowest of 1,669 cities
> Adults under 65, Tricare/military insurance (or many types): 0.3% — 188th lowest of 1,669 cities
[in-text-ad-2]

16. Severna Park, Maryland
> Adults under 65, no health insurance: 1.9%
> Adults under 65, Medicare coverage (or multiple types): 0.9% — 95th lowest of 1,669 cities
> Adults under 65, Medicaid coverage (or multiple types): 5.8% — 65th lowest of 1,669 cities
> Adults under 65, VA coverage (or multiple types): 2.1% — 198th highest of 1,669 cities
> Adults under 65, employer-based insurance (or multiple types): 82.4% — 35th highest of 1,669 cities
> Adults under 65, direct-purchase insurance (or multiple types): 11.0% — 570th highest of 1,669 cities
> Adults under 65, Tricare/military insurance (or many types): 6.0% — 122nd highest of 1,669 cities

15. Shoreview, Minnesota
> Adults under 65, no health insurance: 1.9%
> Adults under 65, Medicare coverage (or multiple types): 3.1% — 523rd highest of 1,669 cities
> Adults under 65, Medicaid coverage (or multiple types): 11.5% — 354th lowest of 1,669 cities
> Adults under 65, VA coverage (or multiple types): 0.4% — 164th lowest of 1,669 cities
> Adults under 65, employer-based insurance (or multiple types): 79.7% — 91st highest of 1,669 cities
> Adults under 65, direct-purchase insurance (or multiple types): 9.1% — 710th lowest of 1,669 cities
> Adults under 65, Tricare/military insurance (or many types): 0.5% — 292nd lowest of 1,669 cities
[in-text-ad]

14. Los Gatos, California
> Adults under 65, no health insurance: 1.9%
> Adults under 65, Medicare coverage (or multiple types): 0.7% — 35th lowest of 1,669 cities
> Adults under 65, Medicaid coverage (or multiple types): 6.1% — 79th lowest of 1,669 cities
> Adults under 65, VA coverage (or multiple types): 0.6% — 413th lowest of 1,669 cities
> Adults under 65, employer-based insurance (or multiple types): 79.3% — 97th highest of 1,669 cities
> Adults under 65, direct-purchase insurance (or multiple types): 14.9% — 190th highest of 1,669 cities
> Adults under 65, Tricare/military insurance (or many types): 0.4% — 196th lowest of 1,669 cities
[recirclink id=905592]

13. Plainview, New York
> Adults under 65, no health insurance: 1.8%
> Adults under 65, Medicare coverage (or multiple types): 2.0% — 627th lowest of 1,669 cities
> Adults under 65, Medicaid coverage (or multiple types): 6.5% — 95th lowest of 1,669 cities
> Adults under 65, VA coverage (or multiple types): 0.3% — 87th lowest of 1,669 cities
> Adults under 65, employer-based insurance (or multiple types): 82.6% — 34th highest of 1,669 cities
> Adults under 65, direct-purchase insurance (or multiple types): 13.8% — 253rd highest of 1,669 cities
> Adults under 65, Tricare/military insurance (or many types): 0.2% — 50th lowest of 1,669 cities

12. East Honolulu, Hawaii
> Adults under 65, no health insurance: 1.8%
> Adults under 65, Medicare coverage (or multiple types): 1.2% — 211th lowest of 1,669 cities
> Adults under 65, Medicaid coverage (or multiple types): 6.8% — 108th lowest of 1,669 cities
> Adults under 65, VA coverage (or multiple types): 1.2% — 694th highest of 1,669 cities
> Adults under 65, employer-based insurance (or multiple types): 79.3% — 98th highest of 1,669 cities
> Adults under 65, direct-purchase insurance (or multiple types): 14.4% — 217th highest of 1,669 cities
> Adults under 65, Tricare/military insurance (or many types): 3.3% — 230th highest of 1,669 cities
[in-text-ad-2]

11. Bel Air North, Maryland
> Adults under 65, no health insurance: 1.8%
> Adults under 65, Medicare coverage (or multiple types): 1.1% — 140th lowest of 1,669 cities
> Adults under 65, Medicaid coverage (or multiple types): 7.9% — 155th lowest of 1,669 cities
> Adults under 65, VA coverage (or multiple types): 0.9% — 723rd lowest of 1,669 cities
> Adults under 65, employer-based insurance (or multiple types): 83.7% — 18th highest of 1,669 cities
> Adults under 65, direct-purchase insurance (or multiple types): 8.3% — 535th lowest of 1,669 cities
> Adults under 65, Tricare/military insurance (or many types): 2.0% — 420th highest of 1,669 cities

10. Lakeville, Minnesota
> Adults under 65, no health insurance: 1.8%
> Adults under 65, Medicare coverage (or multiple types): 1.3% — 229th lowest of 1,669 cities
> Adults under 65, Medicaid coverage (or multiple types): 9.6% — 237th lowest of 1,669 cities
> Adults under 65, VA coverage (or multiple types): 0.7% — 468th lowest of 1,669 cities
> Adults under 65, employer-based insurance (or multiple types): 82.6% — 33rd highest of 1,669 cities
> Adults under 65, direct-purchase insurance (or multiple types): 8.7% — 621st lowest of 1,669 cities
> Adults under 65, Tricare/military insurance (or many types): 1.0% — 779th lowest of 1,669 cities
[in-text-ad]

9. San Carlos, California
> Adults under 65, no health insurance: 1.7%
> Adults under 65, Medicare coverage (or multiple types): 0.9% — 75th lowest of 1,669 cities
> Adults under 65, Medicaid coverage (or multiple types): 4.9% — 43rd lowest of 1,669 cities
> Adults under 65, VA coverage (or multiple types): 0.3% — 77th lowest of 1,669 cities
> Adults under 65, employer-based insurance (or multiple types): 84.1% — 13th highest of 1,669 cities
> Adults under 65, direct-purchase insurance (or multiple types): 12.1% — 401st highest of 1,669 cities
> Adults under 65, Tricare/military insurance (or many types): 0.0% reported — 8th lowest of 1,669 cities
[recirclink id=890210]
8. Watertown Town, Massachusetts
> Adults under 65, no health insurance: 1.7%
> Adults under 65, Medicare coverage (or multiple types): 1.6% — 383rd lowest of 1,669 cities
> Adults under 65, Medicaid coverage (or multiple types): 14.3% — 523rd lowest of 1,669 cities
> Adults under 65, VA coverage (or multiple types): 0.2% — 54th lowest of 1,669 cities
> Adults under 65, employer-based insurance (or multiple types): 78.9% — 110th highest of 1,669 cities
> Adults under 65, direct-purchase insurance (or multiple types): 8.7% — 616th lowest of 1,669 cities
> Adults under 65, Tricare/military insurance (or many types): 0.2% — 79th lowest of 1,669 cities

7. Eldersburg, Maryland
> Adults under 65, no health insurance: 1.7%
> Adults under 65, Medicare coverage (or multiple types): 1.6% — 387th lowest of 1,669 cities
> Adults under 65, Medicaid coverage (or multiple types): 8.1% — 167th lowest of 1,669 cities
> Adults under 65, VA coverage (or multiple types): 1.0% — 798th lowest of 1,669 cities
> Adults under 65, employer-based insurance (or multiple types): 83.4% — 23rd highest of 1,669 cities
> Adults under 65, direct-purchase insurance (or multiple types): 8.3% — 522nd lowest of 1,669 cities
> Adults under 65, Tricare/military insurance (or many types): 4.2% — 181st highest of 1,669 cities
[in-text-ad-2]
6. Northbrook, Illinois
> Adults under 65, no health insurance: 1.6%
> Adults under 65, Medicare coverage (or multiple types): 0.7% — 41st lowest of 1,669 cities
> Adults under 65, Medicaid coverage (or multiple types): 2.7% — 4th lowest of 1,669 cities
> Adults under 65, VA coverage (or multiple types): 0.0% reported — 4th lowest of 1,669 cities
> Adults under 65, employer-based insurance (or multiple types): 82.9% — 31st highest of 1,669 cities
> Adults under 65, direct-purchase insurance (or multiple types): 14.4% — 220th highest of 1,669 cities
> Adults under 65, Tricare/military insurance (or many types): 0.2% — 69th lowest of 1,669 cities

5. Brookfield, Wisconsin
> Adults under 65, no health insurance: 1.4%
> Adults under 65, Medicare coverage (or multiple types): 1.2% — 180th lowest of 1,669 cities
> Adults under 65, Medicaid coverage (or multiple types): 5.2% — 51st lowest of 1,669 cities
> Adults under 65, VA coverage (or multiple types): 0.7% — 478th lowest of 1,669 cities
> Adults under 65, employer-based insurance (or multiple types): 85.4% — 6th highest of 1,669 cities
> Adults under 65, direct-purchase insurance (or multiple types): 10.4% — 707th highest of 1,669 cities
> Adults under 65, Tricare/military insurance (or many types): 0.7% — 498th lowest of 1,669 cities
[in-text-ad]

4. Newton, Massachusetts
> Adults under 65, no health insurance: 1.4%
> Adults under 65, Medicare coverage (or multiple types): 1.2% — 200th lowest of 1,669 cities
> Adults under 65, Medicaid coverage (or multiple types): 8.5% — 182nd lowest of 1,669 cities
> Adults under 65, VA coverage (or multiple types): 0.3% — 72nd lowest of 1,669 cities
> Adults under 65, employer-based insurance (or multiple types): 80.5% — 75th highest of 1,669 cities
> Adults under 65, direct-purchase insurance (or multiple types): 13.7% — 256th highest of 1,669 cities
> Adults under 65, Tricare/military insurance (or many types): 0.5% — 327th lowest of 1,669 cities
[recirclink id=882508]

3. Dublin, Ohio
> Adults under 65, no health insurance: 1.3%
> Adults under 65, Medicare coverage (or multiple types): 0.4% — 7th lowest of 1,669 cities
> Adults under 65, Medicaid coverage (or multiple types): 3.6% — 10th lowest of 1,669 cities
> Adults under 65, VA coverage (or multiple types): 0.5% — 237th lowest of 1,669 cities
> Adults under 65, employer-based insurance (or multiple types): 89.0% — 1st highest of 1,669 cities
> Adults under 65, direct-purchase insurance (or multiple types): 7.9% — 421st lowest of 1,669 cities
> Adults under 65, Tricare/military insurance (or many types): 0.3% — 166th lowest of 1,669 cities

2. Sammamish, Washington
> Adults under 65, no health insurance: 1.3%
> Adults under 65, Medicare coverage (or multiple types): 0.6% — 24th lowest of 1,669 cities
> Adults under 65, Medicaid coverage (or multiple types): 3.5% — 8th lowest of 1,669 cities
> Adults under 65, VA coverage (or multiple types): 0.3% — 67th lowest of 1,669 cities
> Adults under 65, employer-based insurance (or multiple types): 86.8% — 2nd highest of 1,669 cities
> Adults under 65, direct-purchase insurance (or multiple types): 10.4% — 702nd highest of 1,669 cities
> Adults under 65, Tricare/military insurance (or many types): 0.7% — 542nd lowest of 1,669 cities
[in-text-ad-2]

1. Wellesley, Massachusetts
> Adults under 65, no health insurance: 1.2%
> Adults under 65, Medicare coverage (or multiple types): 0.7% — 37th lowest of 1,669 cities
> Adults under 65, Medicaid coverage (or multiple types): 4.3% — 28th lowest of 1,669 cities
> Adults under 65, VA coverage (or multiple types): 0.2% — 46th lowest of 1,669 cities
> Adults under 65, employer-based insurance (or multiple types): 81.1% — 65th highest of 1,669 cities
> Adults under 65, direct-purchase insurance (or multiple types): 16.8% — 107th highest of 1,669 cities
> Adults under 65, Tricare/military insurance (or many types): 0.2% — 88th lowest of 1,669 cities
Methodology
To determine the cities with the best health insurance coverage in the nation, 24/7 Wall St. reviewed five-year estimates of the percentage of the noninstitutionalized civilian population under 65 without health insurance from the U.S. Census Bureau’s 2019 American Community Survey.
We used census “place” geographies — a category that includes 29,573 incorporated legal entities and Census-designated statistical entities. Of those, 29,320 had boundaries that fell within one of the 50 states or the District of Columbia.
We defined cities based on a population threshold — having more than 25,000 people — and 1,775 of the places fell within this threshold.
Cities were excluded if the sampling error associated with a city’s data was deemed too high.
The sampling error was defined as too high if the coefficient of variation — a statistical assessment of how reliable an estimate is — for a city’s uninsured rate for the under 65 population was above 15% and greater than two standard deviations above the mean CV for all cities’ under 65 uninsured rates. We similarly excluded cities that had a sampling error too high for their under 65 noninstitutionalized civilian population total, using the same definition.
We selected the under 65 age group because Americans become eligible for Medicare at age 65, and the uninsured rate for the population above this age is less than 1% nationwide. However, because the census does not publish insurance coverage estimates specifically for the under 65 age group, we aggregated the data from more granular age breakdowns.
To ensure each aggregate estimate’s sampling error could be assessed using the definition above, we derived a margin of error for each aggregate estimate using the successive differences replication variance estimation methodology recommended and used by the U.S. Census Bureau.
The remaining 1,669 places were ranked based on their under 65 uninsured rates. To break ties, we used the number of insured people in the same population group.
The share of the population covered by each type of insurance — Medicare, Medicaid, VA, employer, direct-purchase, and Tricare/military — are for the same cohort and are also aggregated from five-year ACS estimates. The estimates reflect people who are covered by that type of insurance alone or in combination with other types on the list. So, when persons are covered by more than one type of insurance, they are included in each group.
Contact [email protected] for any questions or corrections.