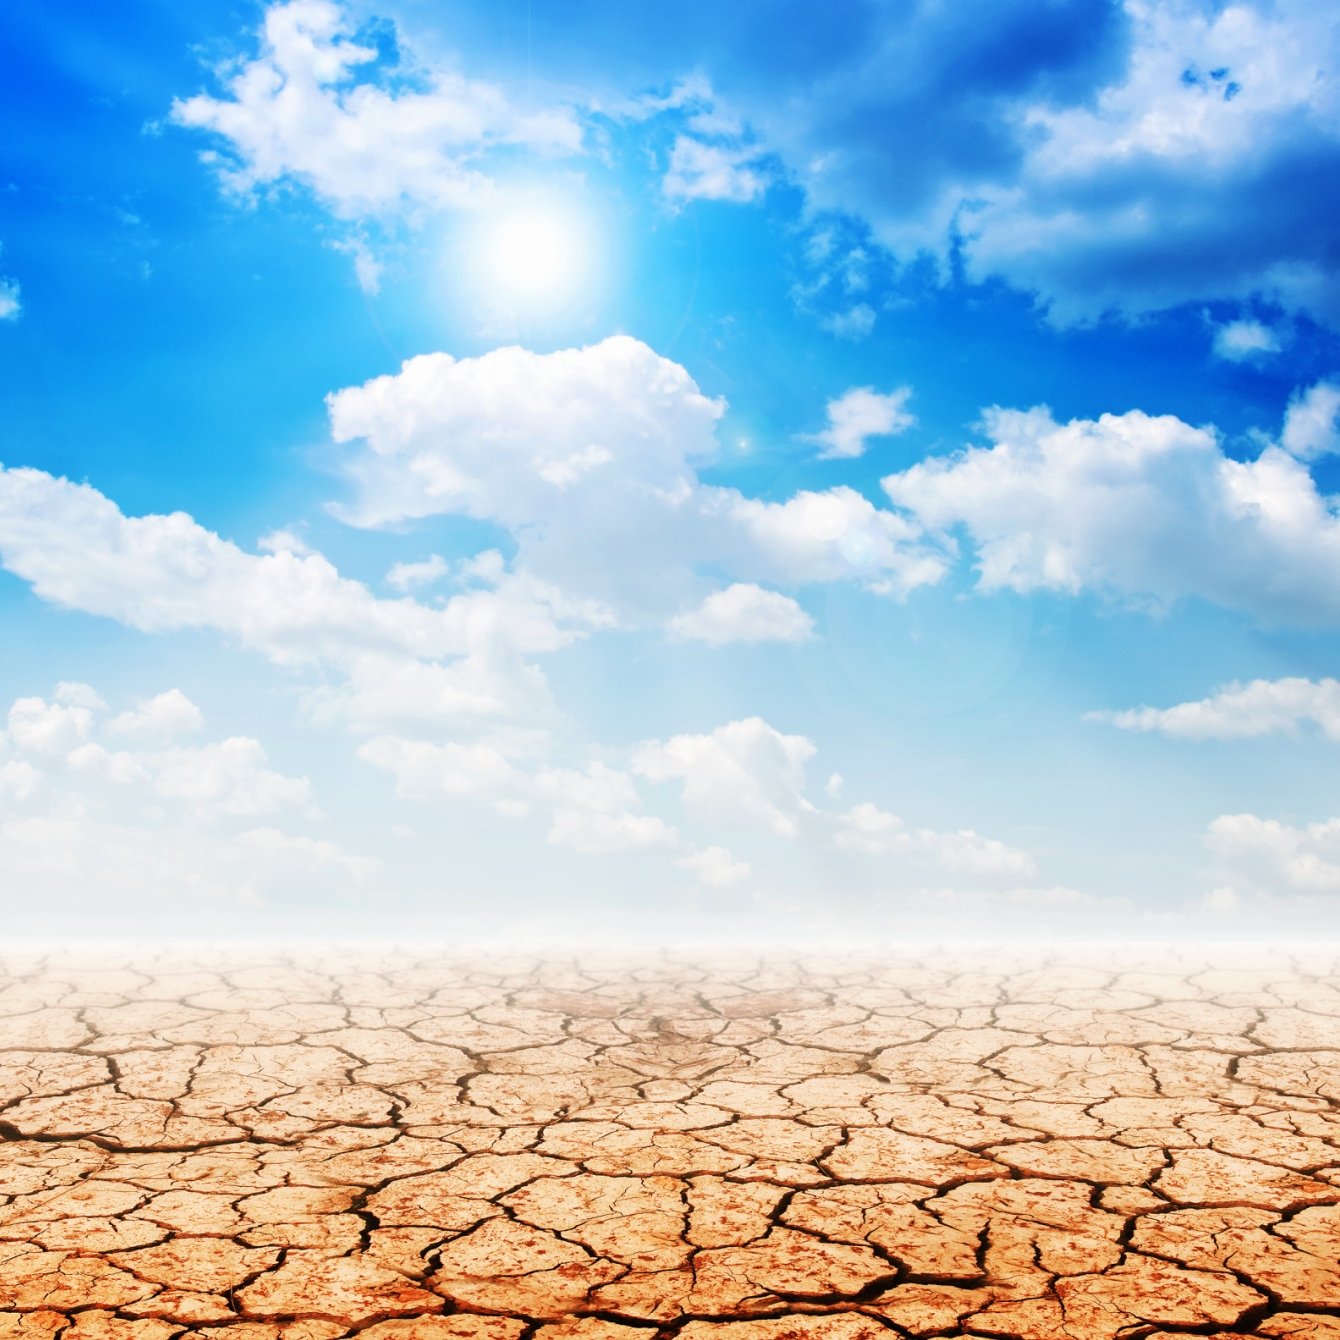
This State Has the Worst Drought in America
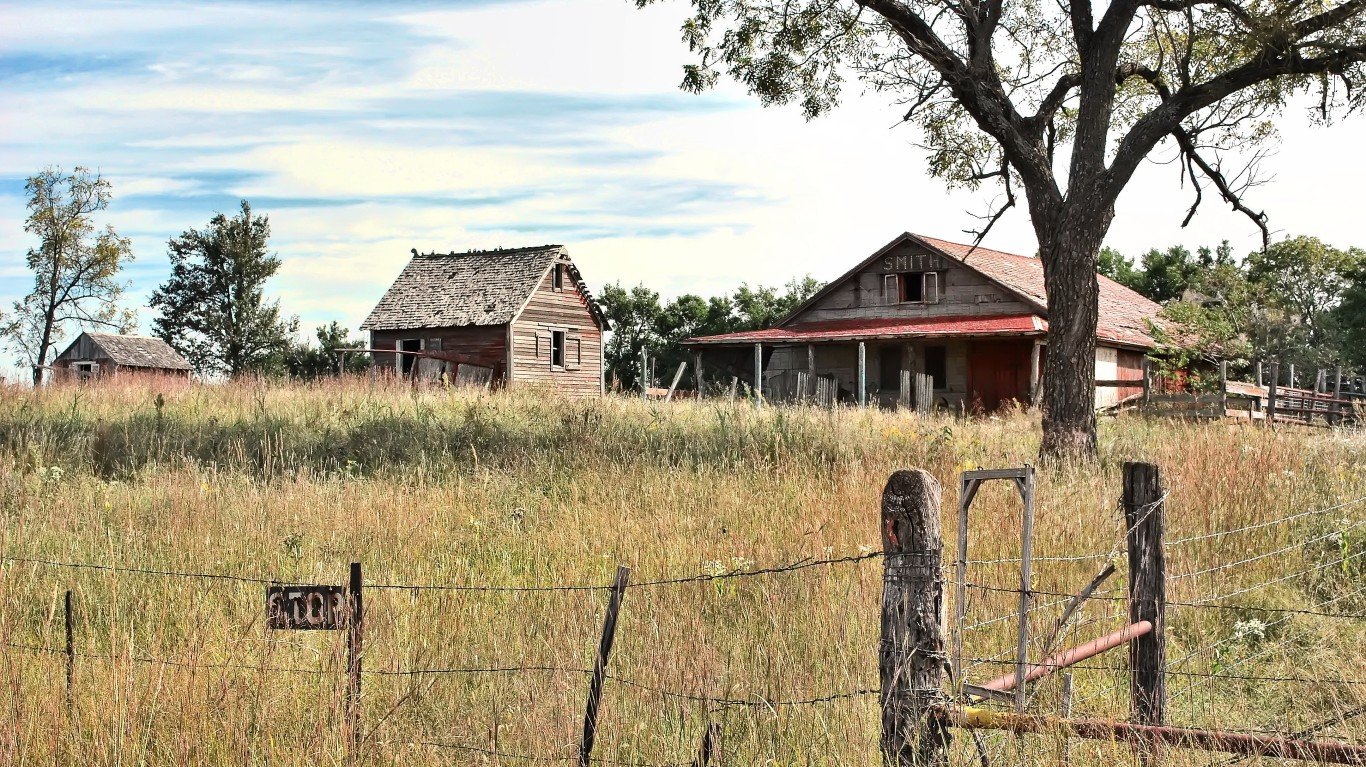
snowpeak / Flickr 51. San Juan County, New Mexico > % of county in extreme or exceptional drought July 12: 93.6% > Weeks of 100% exceptional drought over past 12 months: 2 > Weeks of at least 50% exceptional drought…

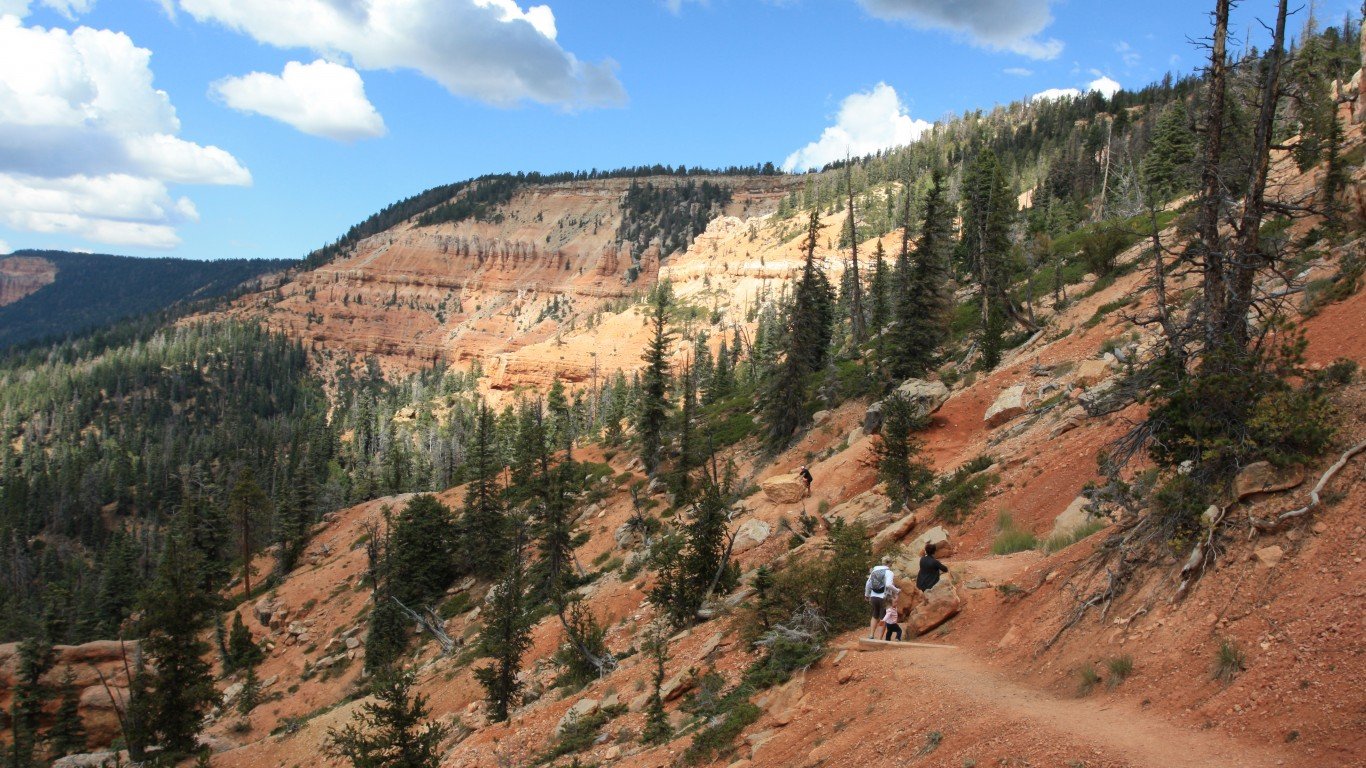
While heavy rains helped alleviate severe drought conditions across some regions in the United States in recent weeks, abnormally hot weather worsened conditions across others. The state enduring the worst drought is Utah, according to Drought Monitor data for the week ending July 12. As much as 65.2% of land area in the state is in exceptional drought (D4) — the maximum level of drought.
Large sections of the United States remain in the grip of historic drought levels — some the worst seen in centuries.
For example, in Oregon, soil moisture, streamflow, and precipitation measurements indicate that drought conditions are among the worst since 1895. In Washington, rangeland and pasture conditions are reported to be far worse this year than in any year this century.
In Idaho, where some areas saw a relatively drastic uptick in drought categories, from D1 to D3, the drought monitor reported storage levels and water use priorities associated with the Big Lost River have been limited to early 1884 priorities. Montana recorded precipitation less than 25% of normal in June, historically the wettest month of the year in the state.
Drought conditions are inherently difficult to measure and change frequently, even within states. To provide context, 24/7 Wall St. reviewed drought statistics for the last 12 months for every county in the nation from the Drought Severity and Coverage Index, a product of the U.S. Drought Monitor.
The 51 counties on this list are in just eight states: Texas (11), Arizona (8), New Mexico (8), Utah (8), California (7), Colorado (5), North Dakota (2), and Nevada (2).
These areas have had the most consecutive days with 100% of land area in extreme (D3) or exceptional (D4) drought over the 12 months through this Monday. Drought severity is measured from D0 (no drought) to D4 (exceptional drought) for each week of the year.
To be included in our ranking, a county must have had at least one week of exceptional drought. The percentage of land area currently in exceptional drought, the number of weeks each county had 50% or more of land area in exceptional drought, and the number of weeks each county had any amount of extreme or exceptional drought over the past 12 months were computed by 24/7 Wall St. using data from the Drought Monitor. Total population for 2019 is from the American Community Survey 2019 5-Year Estimates.
Click here to see which state has the worst drought in America.
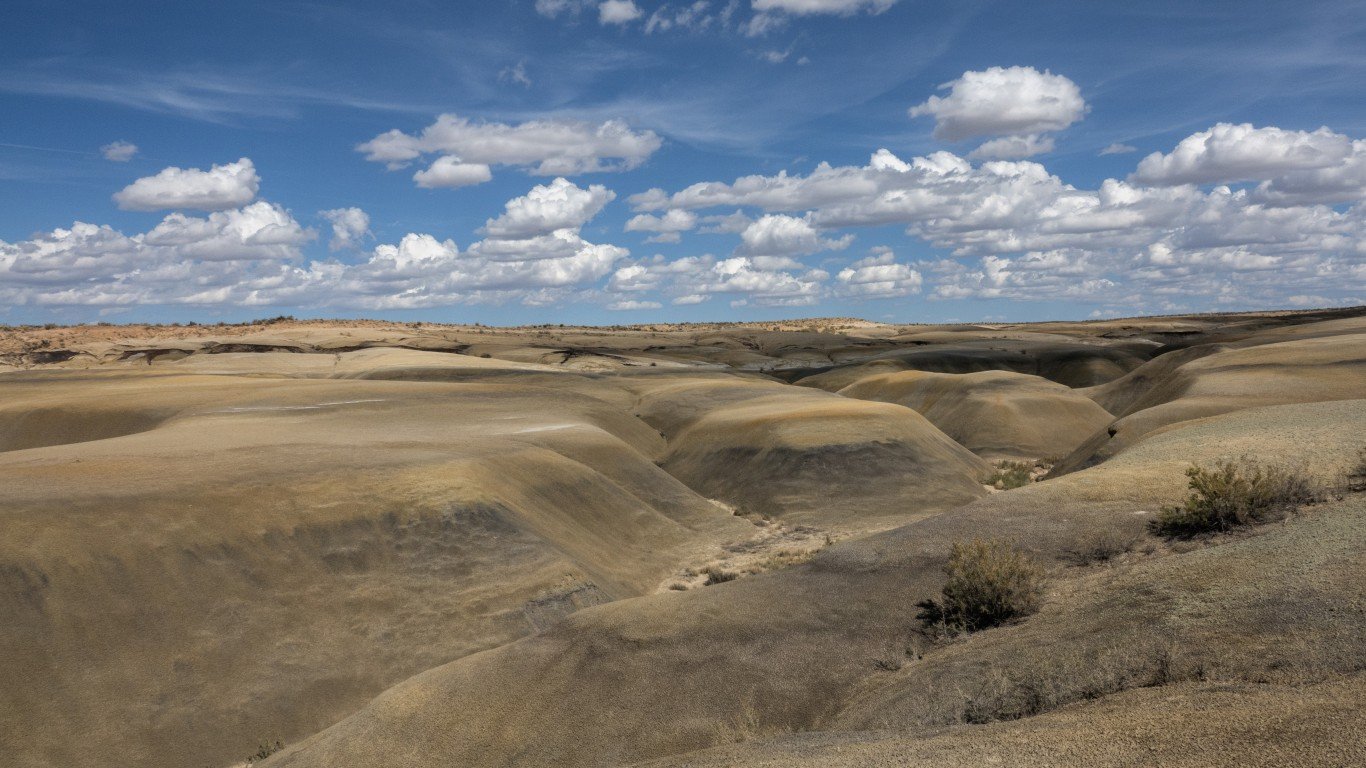
51. San Juan County, New Mexico
> % of county in extreme or exceptional drought July 12: 93.6%
> Weeks of 100% exceptional drought over past 12 months: 2
> Weeks of at least 50% exceptional drought over past 12 months: 34
> Number of consecutive weeks of any amount of extreme or exceptional drought: 53 (July 7,2020 – July 12,2021)
> Population: 126,515
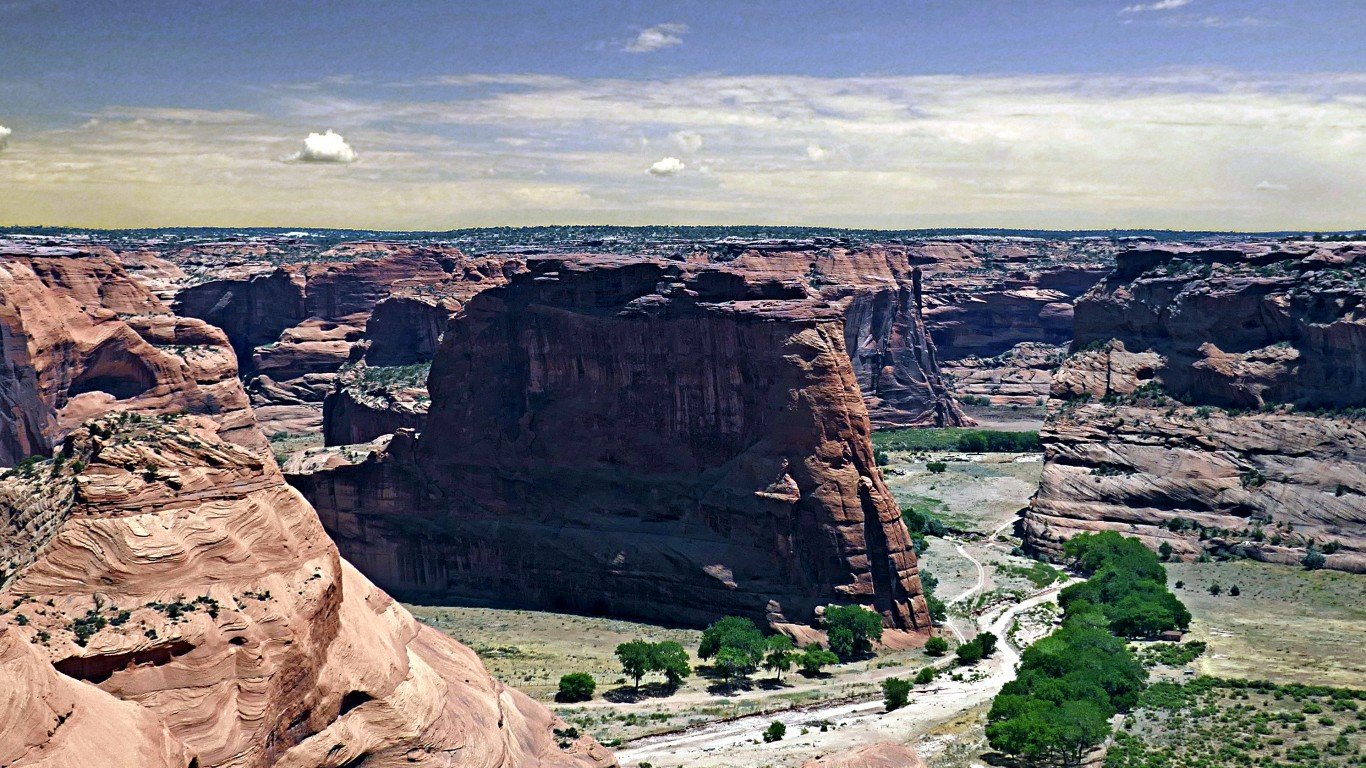
50. Apache County, Arizona
> % of county in extreme or exceptional drought July 12: 97.0%
> Weeks of 100% exceptional drought over past 12 months: 2
> Weeks of at least 50% exceptional drought over past 12 months: 10
> Number of consecutive weeks of any amount of extreme or exceptional drought: 46 (August 25,2020 – July 12,2021)
> Population: 71,511
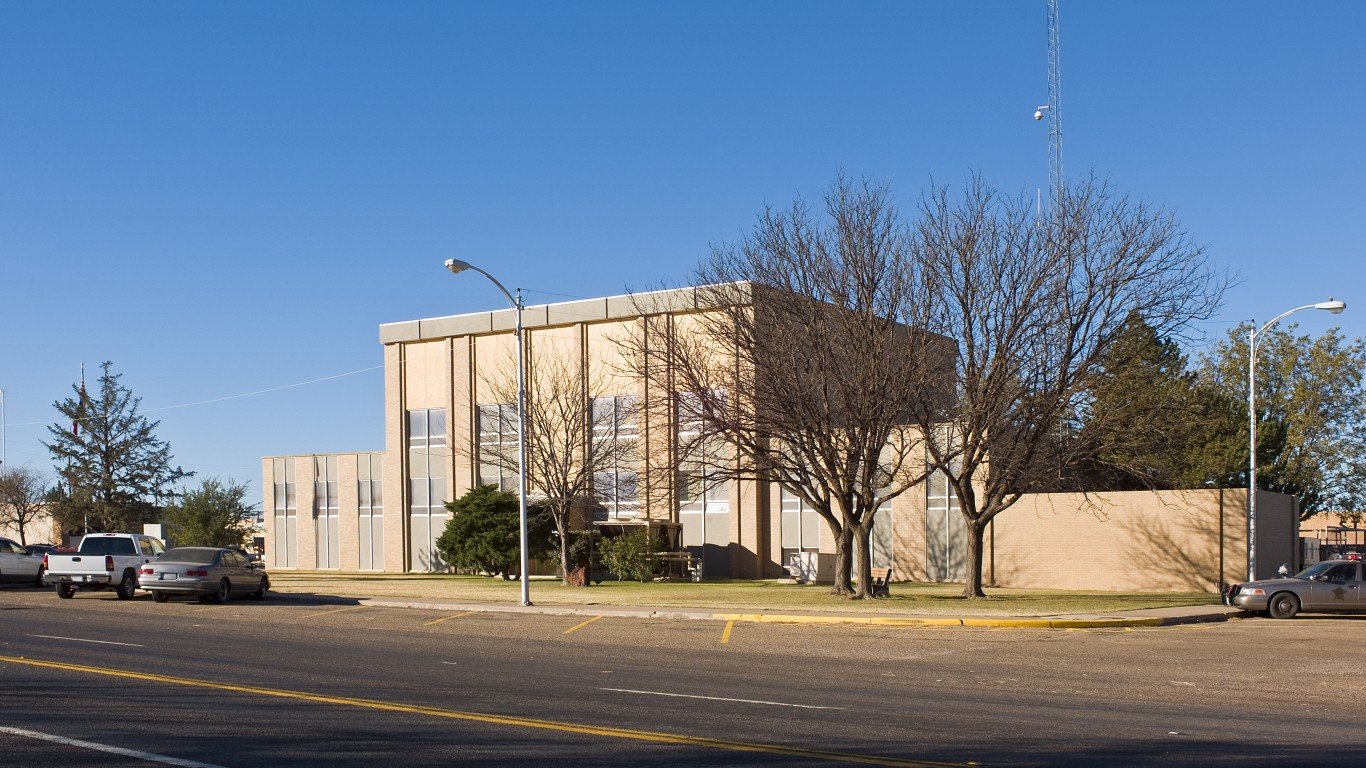
49. Cochran County, Texas
> % of county in extreme or exceptional drought July 12: 0.0%
> Weeks of 100% exceptional drought over past 12 months: 4
> Weeks of at least 50% exceptional drought over past 12 months: 21
> Number of consecutive weeks of any amount of extreme or exceptional drought: 40 (September 1,2020 – June 7,2021)
> Population: 12,188
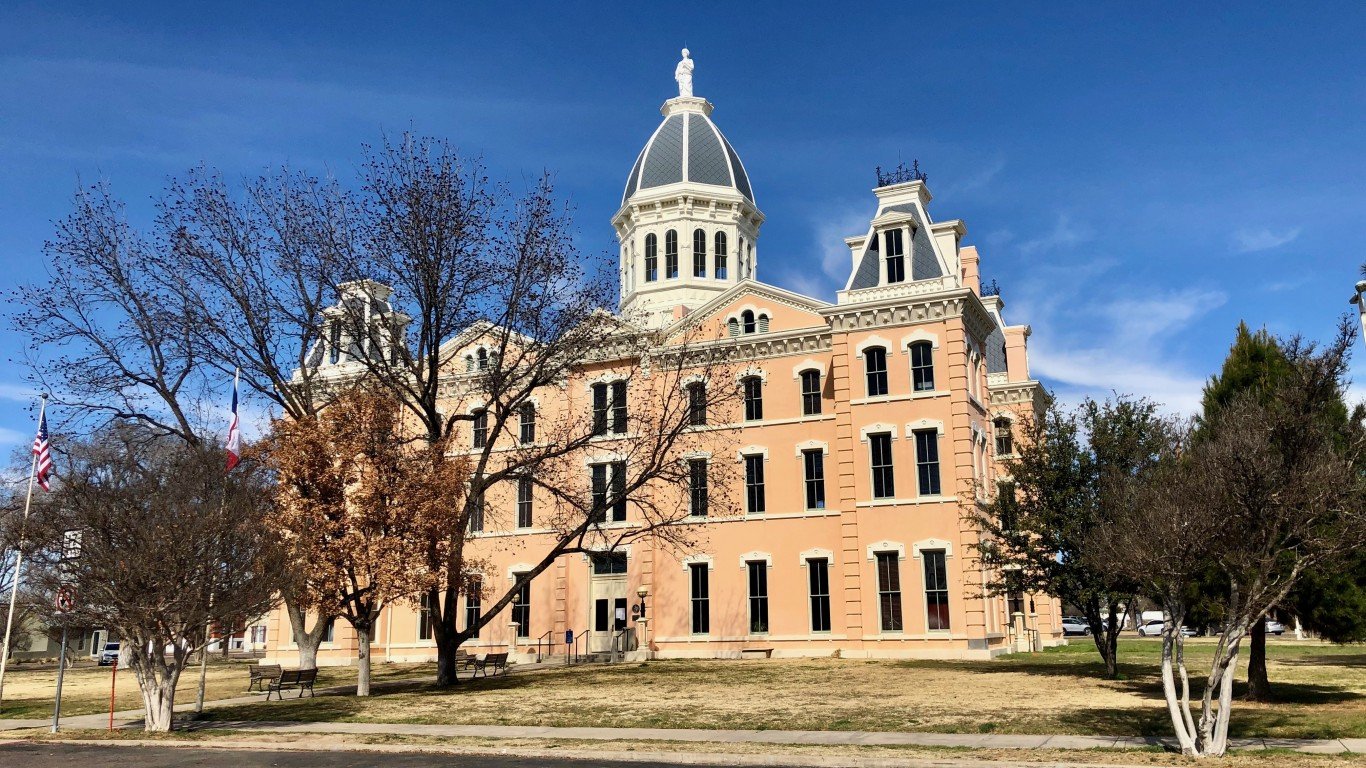
48. Presidio County, Texas
> % of county in extreme or exceptional drought July 12: 0.0%
> Weeks of 100% exceptional drought over past 12 months: 5
> Weeks of at least 50% exceptional drought over past 12 months: 27
> Number of consecutive weeks of any amount of extreme or exceptional drought: 48 (August 4,2020 – July 5,2021)
> Population: 6,975
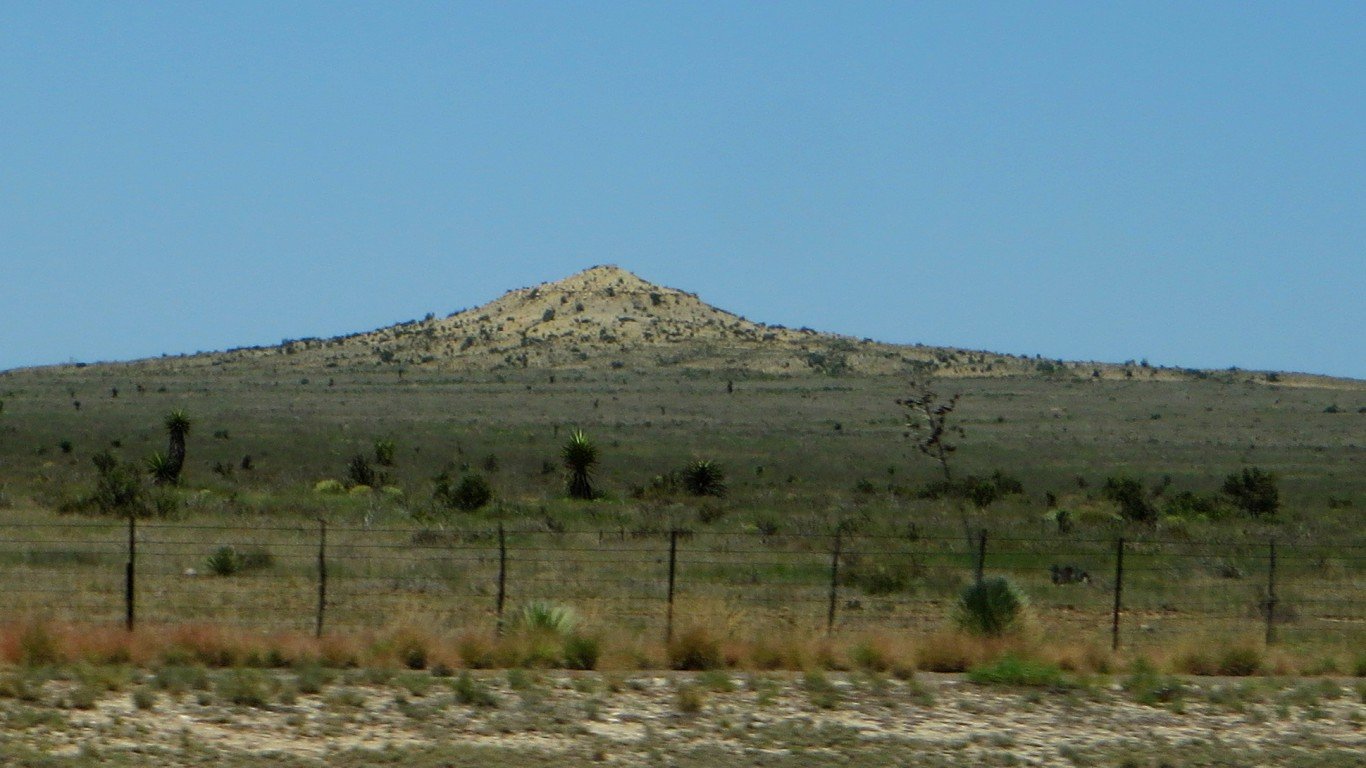
47. Culberson County, Texas
> % of county in extreme or exceptional drought July 12: 0.0%
> Weeks of 100% exceptional drought over past 12 months: 5
> Weeks of at least 50% exceptional drought over past 12 months: 27
> Number of consecutive weeks of any amount of extreme or exceptional drought: 49 (July 28,2020 – July 5,2021)
> Population: 5,506
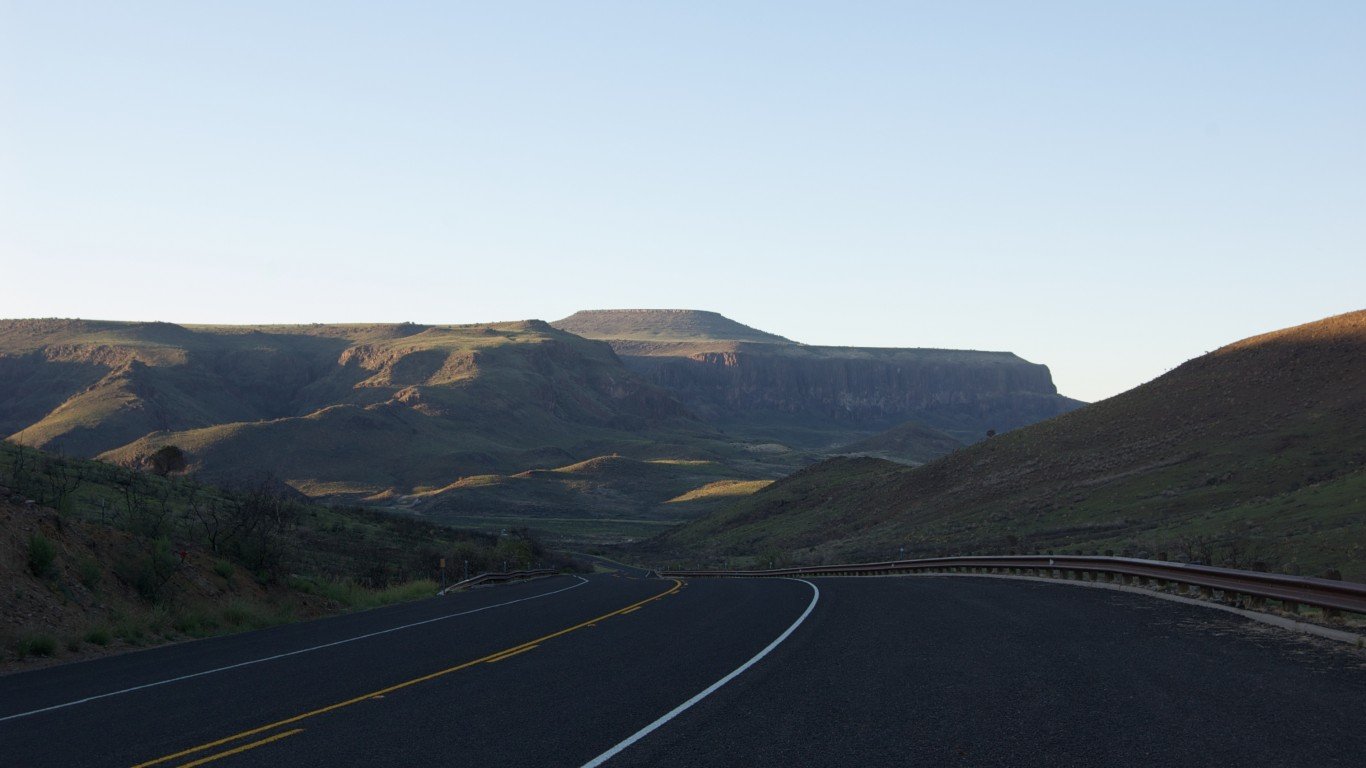
46. Jeff Davis County, Texas
> % of county in extreme or exceptional drought July 12: 0.0%
> Weeks of 100% exceptional drought over past 12 months: 5
> Weeks of at least 50% exceptional drought over past 12 months: 16
> Number of consecutive weeks of any amount of extreme or exceptional drought: 48 (August 4,2020 – July 5,2021)
> Population: 2,241
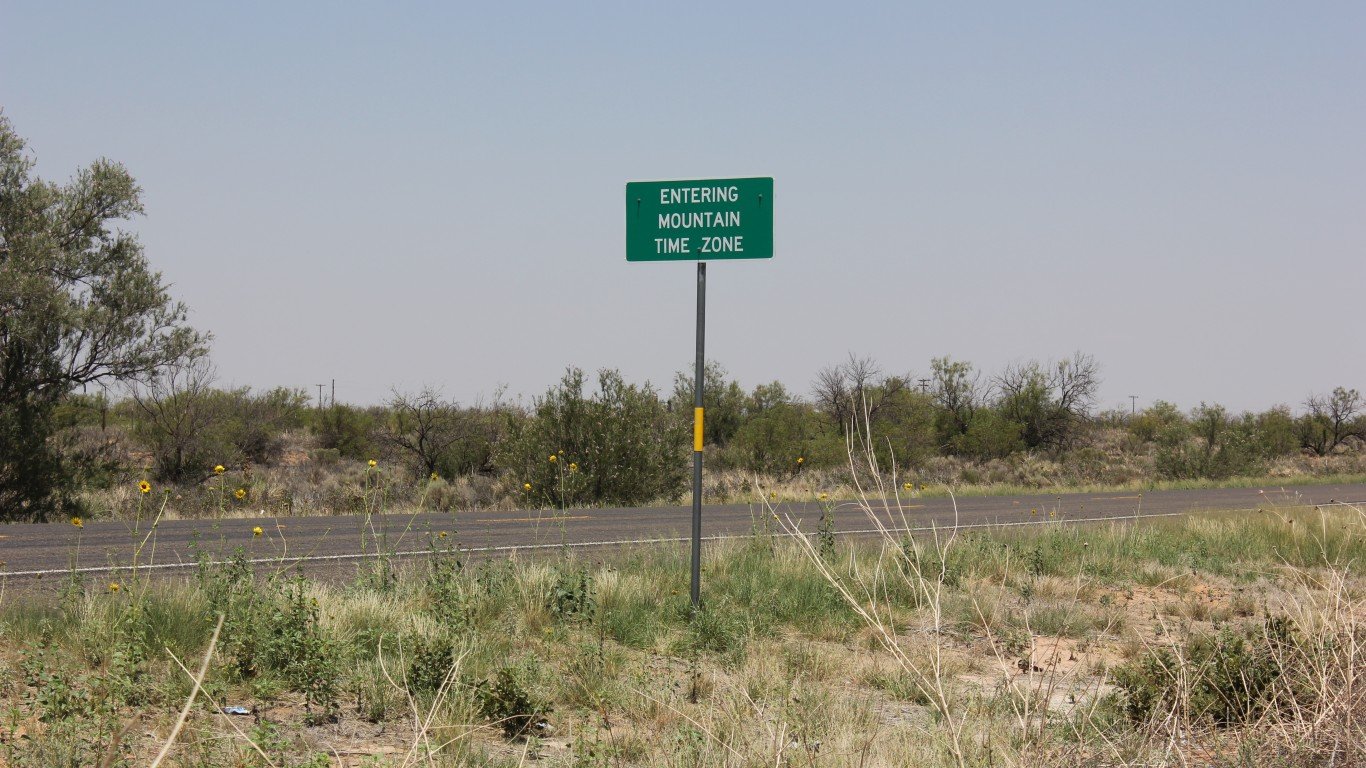
45. Winkler County, Texas
> % of county in extreme or exceptional drought July 12: 0.0%
> Weeks of 100% exceptional drought over past 12 months: 5
> Weeks of at least 50% exceptional drought over past 12 months: 9
> Number of consecutive weeks of any amount of extreme or exceptional drought: 42 (August 18,2020 – June 7,2021)
> Population: 7,867
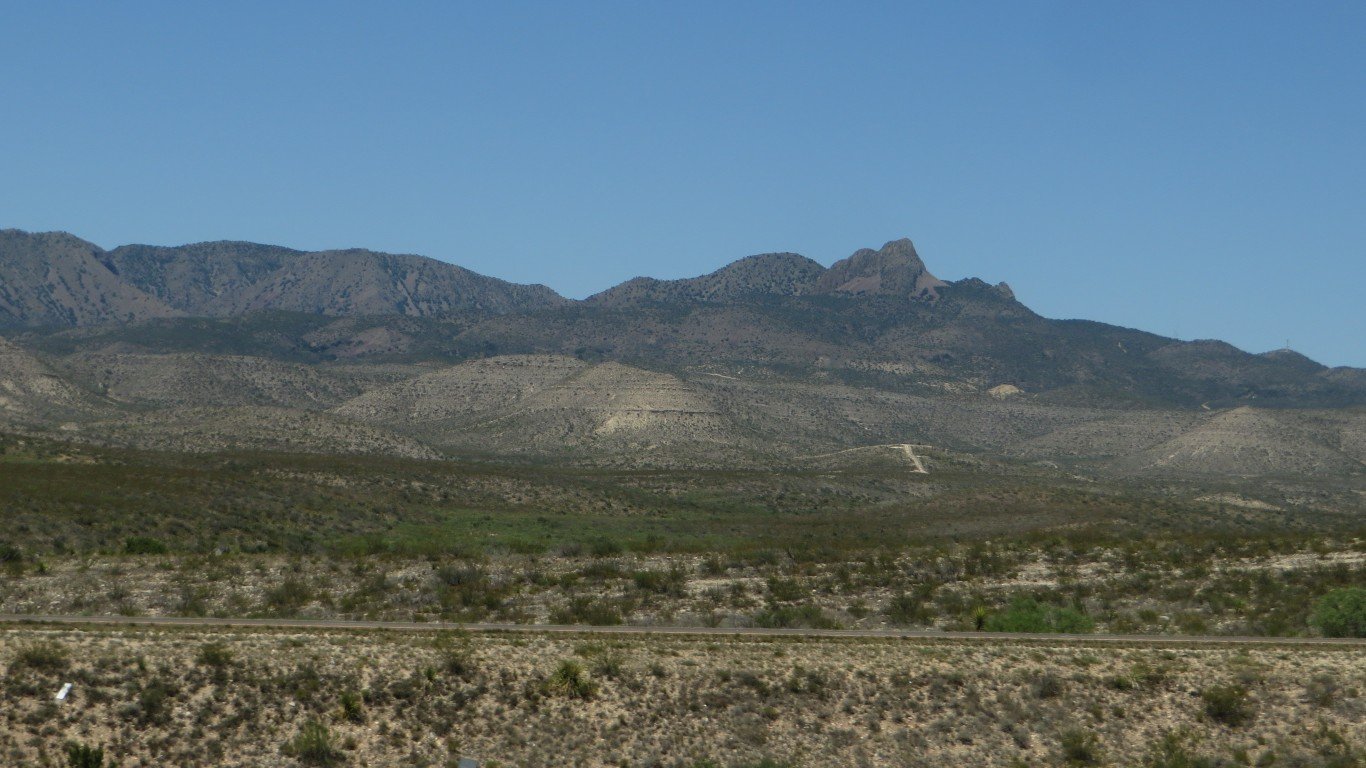
44. Reeves County, Texas
> % of county in extreme or exceptional drought July 12: 0.0%
> Weeks of 100% exceptional drought over past 12 months: 5
> Weeks of at least 50% exceptional drought over past 12 months: 8
> Number of consecutive weeks of any amount of extreme or exceptional drought: 48 (July 28,2020 – June 28,2021)
> Population: 15,492
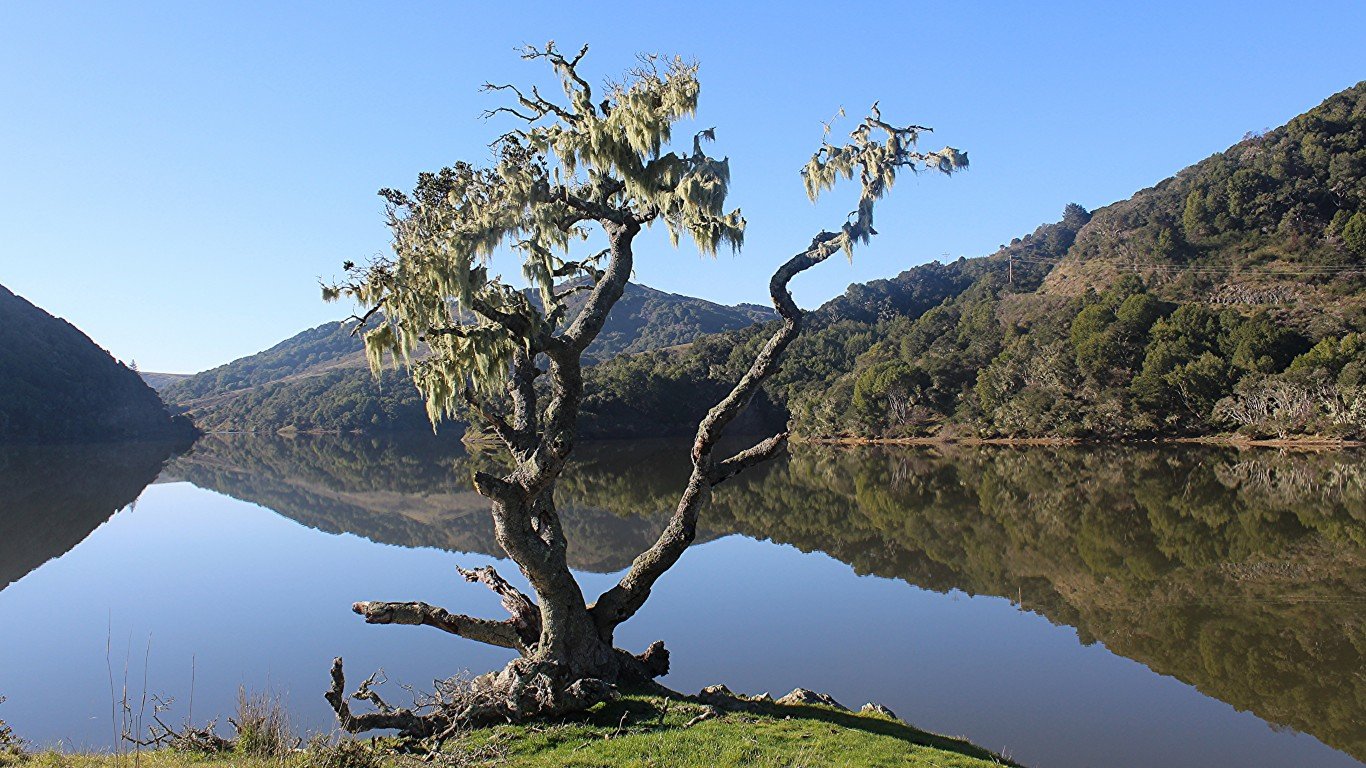
43. Marin County, California
> % of county in extreme or exceptional drought July 12: 100.0%
> Weeks of 100% exceptional drought over past 12 months: 5
> Weeks of at least 50% exceptional drought over past 12 months: 5
> Number of consecutive weeks of any amount of extreme or exceptional drought: 12 (April 20,2021 – July 12,2021)
> Population: 259,943
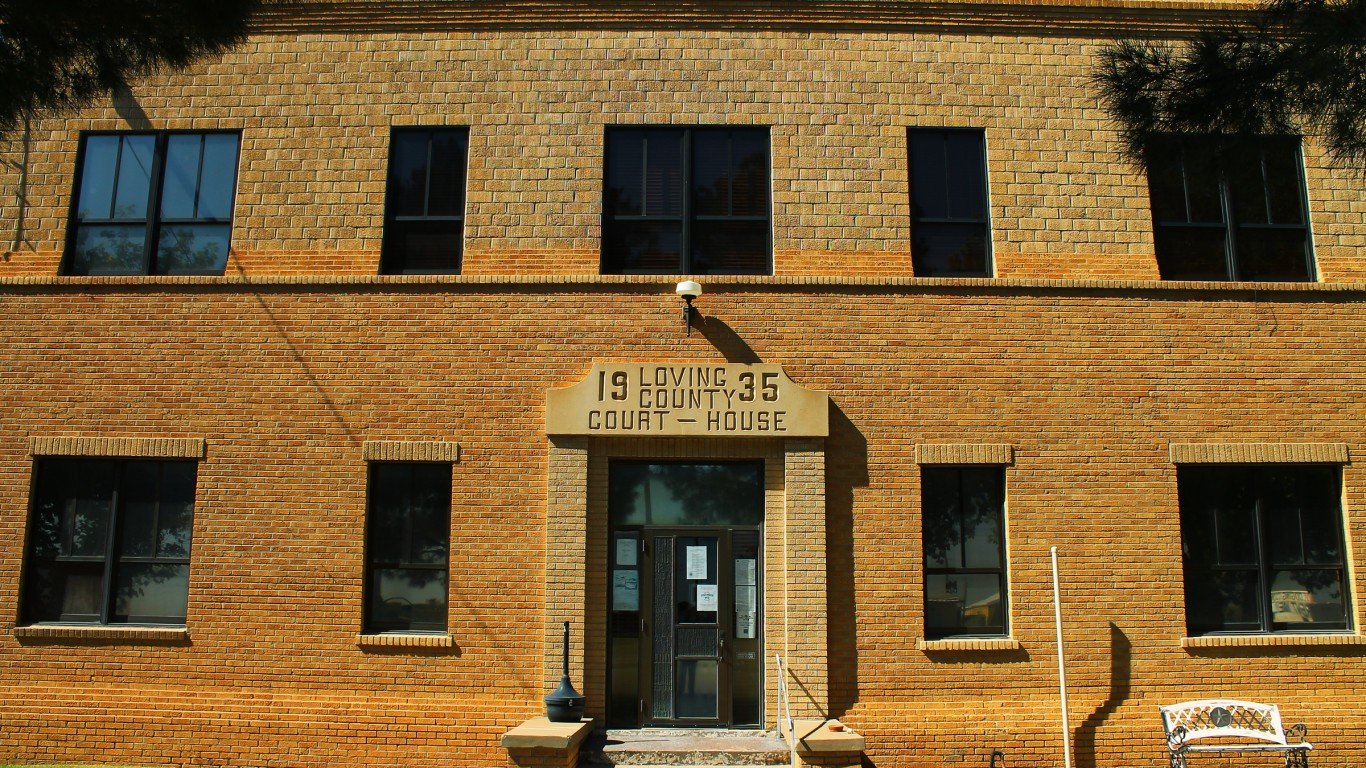
42. Loving County, Texas
> % of county in extreme or exceptional drought July 12: 0.0%
> Weeks of 100% exceptional drought over past 12 months: 7
> Weeks of at least 50% exceptional drought over past 12 months: 9
> Number of consecutive weeks of any amount of extreme or exceptional drought: 45 (July 28,2020 – June 7,2021)
> Population: 14,796
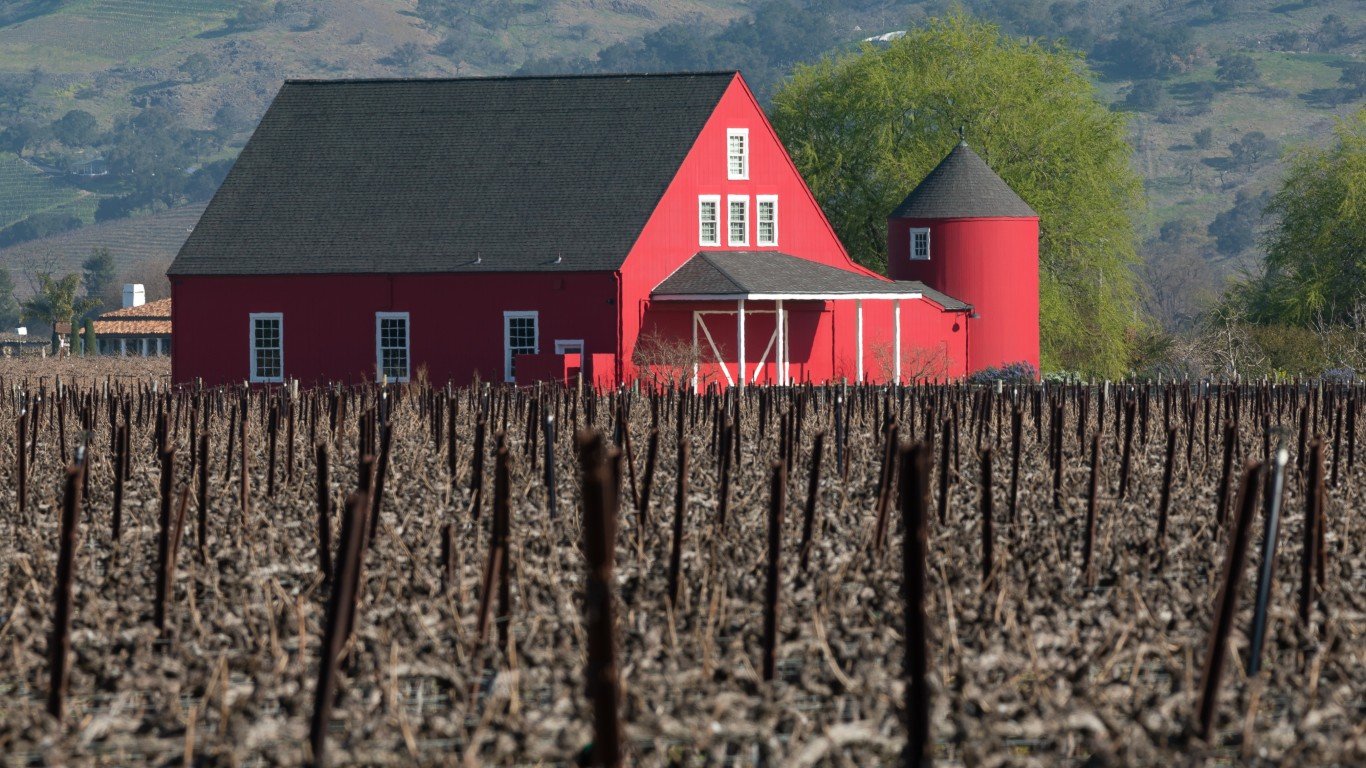
41. Napa County, California
> % of county in extreme or exceptional drought July 12: 100.0%
> Weeks of 100% exceptional drought over past 12 months: 7
> Weeks of at least 50% exceptional drought over past 12 months: 8
> Number of consecutive weeks of any amount of extreme or exceptional drought: 41 (September 29,2020 – July 12,2021)
> Population: 139,623
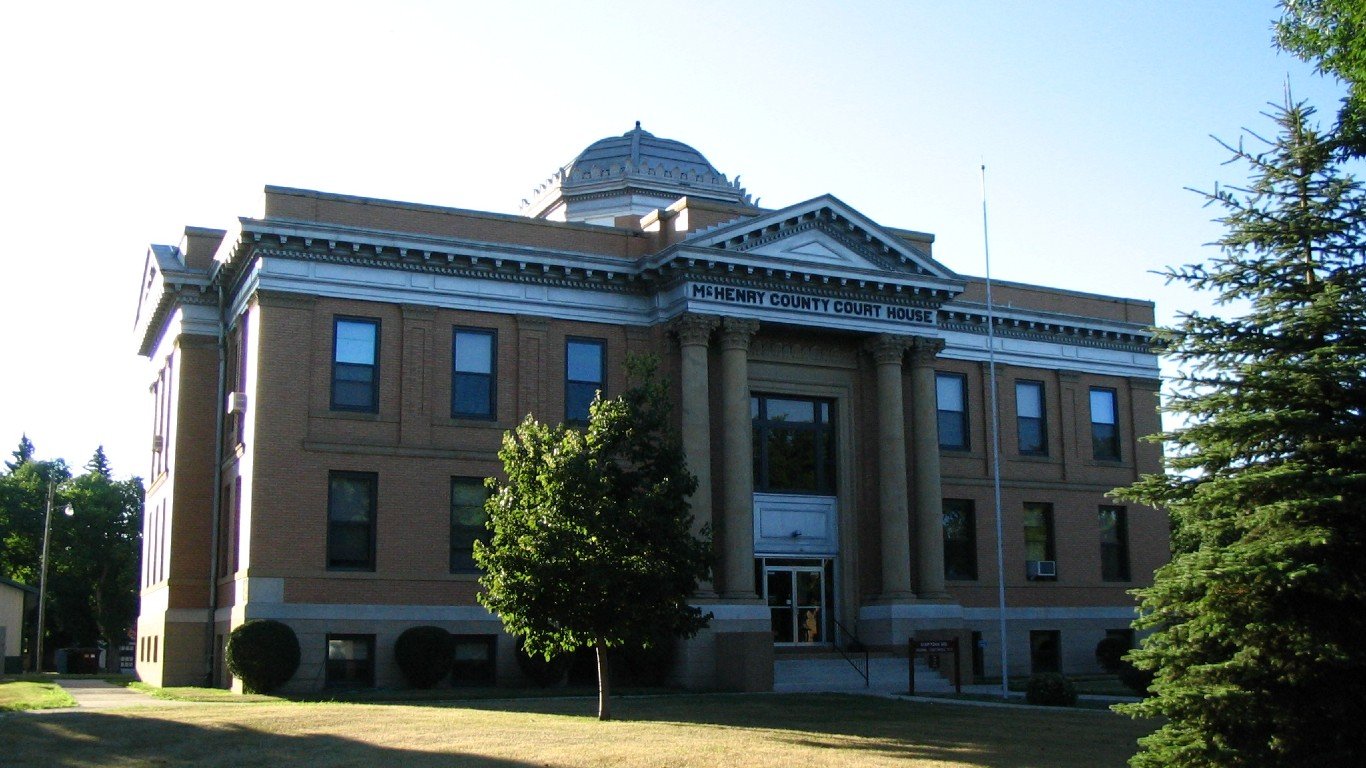
40. McHenry County, North Dakota
> % of county in extreme or exceptional drought July 12: 100.0%
> Weeks of 100% exceptional drought over past 12 months: 7
> Weeks of at least 50% exceptional drought over past 12 months: 8
> Number of consecutive weeks of any amount of extreme or exceptional drought: 17 (March 16,2021 – July 12,2021)
> Population: 4,181

39. McLean County, North Dakota
> % of county in extreme or exceptional drought July 12: 100.0%
> Weeks of 100% exceptional drought over past 12 months: 7
> Weeks of at least 50% exceptional drought over past 12 months: 8
> Number of consecutive weeks of any amount of extreme or exceptional drought: 17 (March 16,2021 – July 12,2021)
> Population: 9,584
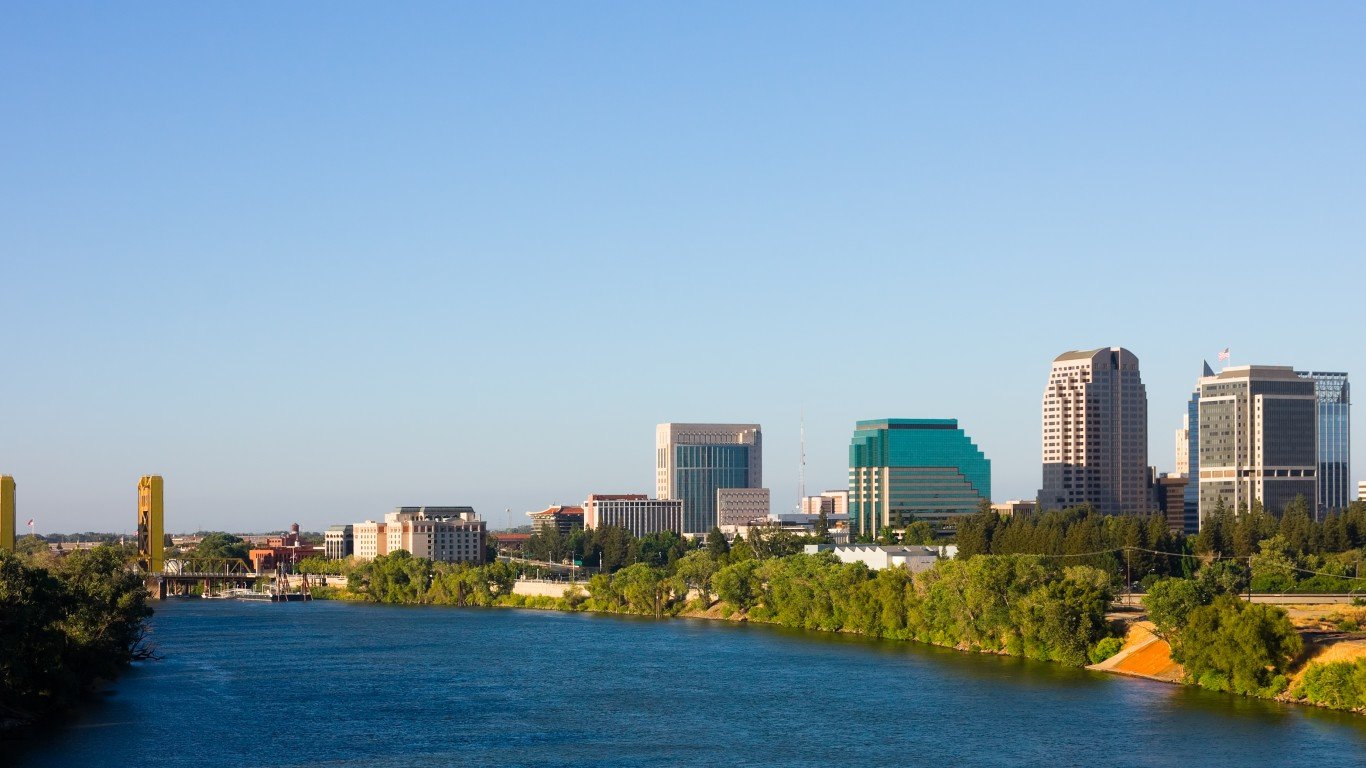
38. Sacramento County, California
> % of county in extreme or exceptional drought July 12: 100.0%
> Weeks of 100% exceptional drought over past 12 months: 7
> Weeks of at least 50% exceptional drought over past 12 months: 7
> Number of consecutive weeks of any amount of extreme or exceptional drought: 41 (September 29,2020 – July 12,2021)
> Population: 1,524,553
37. Solano County, California
> % of county in extreme or exceptional drought July 12: 100.0%
> Weeks of 100% exceptional drought over past 12 months: 7
> Weeks of at least 50% exceptional drought over past 12 months: 7
> Number of consecutive weeks of any amount of extreme or exceptional drought: 41 (September 29,2020 – July 12,2021)
> Population: 441,829
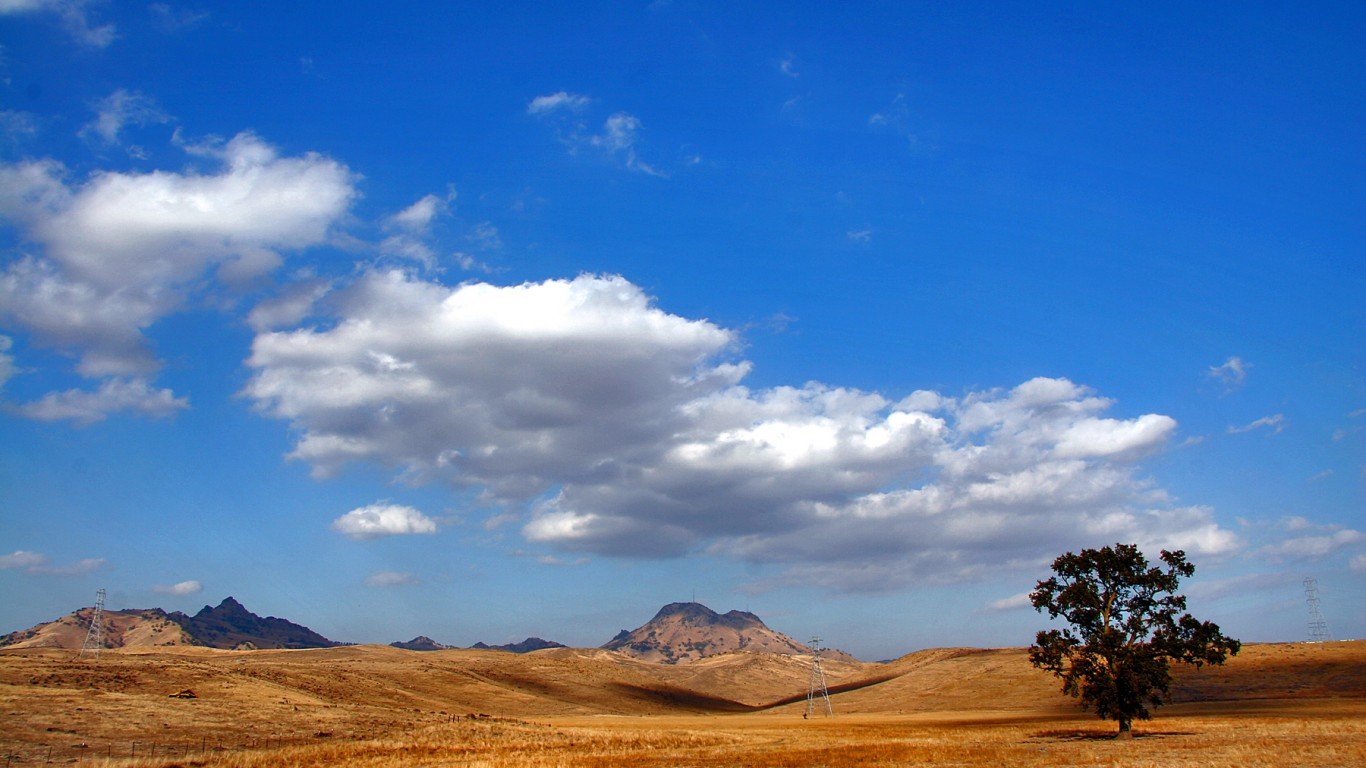
36. Sutter County, California
> % of county in extreme or exceptional drought July 12: 100.0%
> Weeks of 100% exceptional drought over past 12 months: 7
> Weeks of at least 50% exceptional drought over past 12 months: 7
> Number of consecutive weeks of any amount of extreme or exceptional drought: 41 (September 29,2020 – July 12,2021)
> Population: 96,109

35. Yolo County, California
> % of county in extreme or exceptional drought July 12: 100.0%
> Weeks of 100% exceptional drought over past 12 months: 7
> Weeks of at least 50% exceptional drought over past 12 months: 7
> Number of consecutive weeks of any amount of extreme or exceptional drought: 41 (September 29,2020 – July 12,2021)
> Population: 217,352
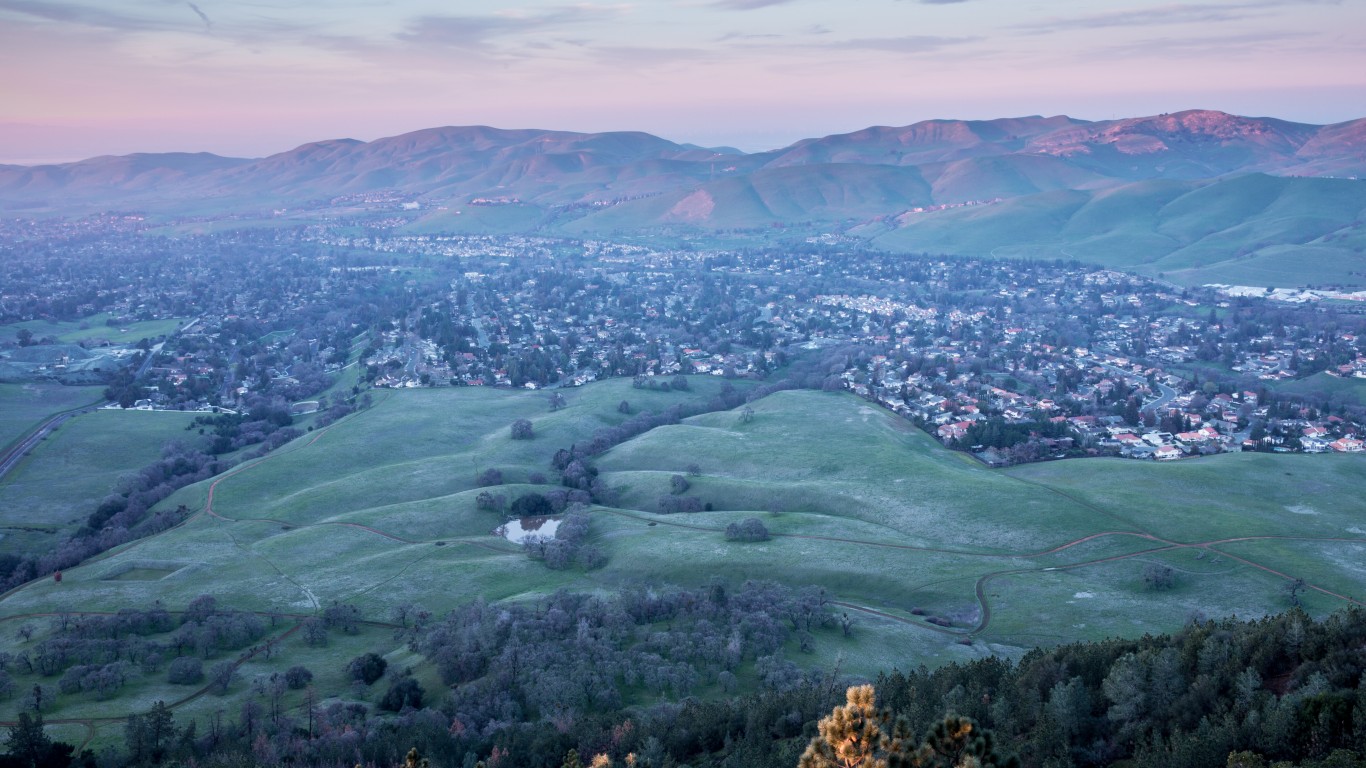
34. Contra Costa County, California
> % of county in extreme or exceptional drought July 12: 100.0%
> Weeks of 100% exceptional drought over past 12 months: 7
> Weeks of at least 50% exceptional drought over past 12 months: 7
> Number of consecutive weeks of any amount of extreme or exceptional drought: 12 (April 20,2021 – July 12,2021)
> Population: 1,142,251
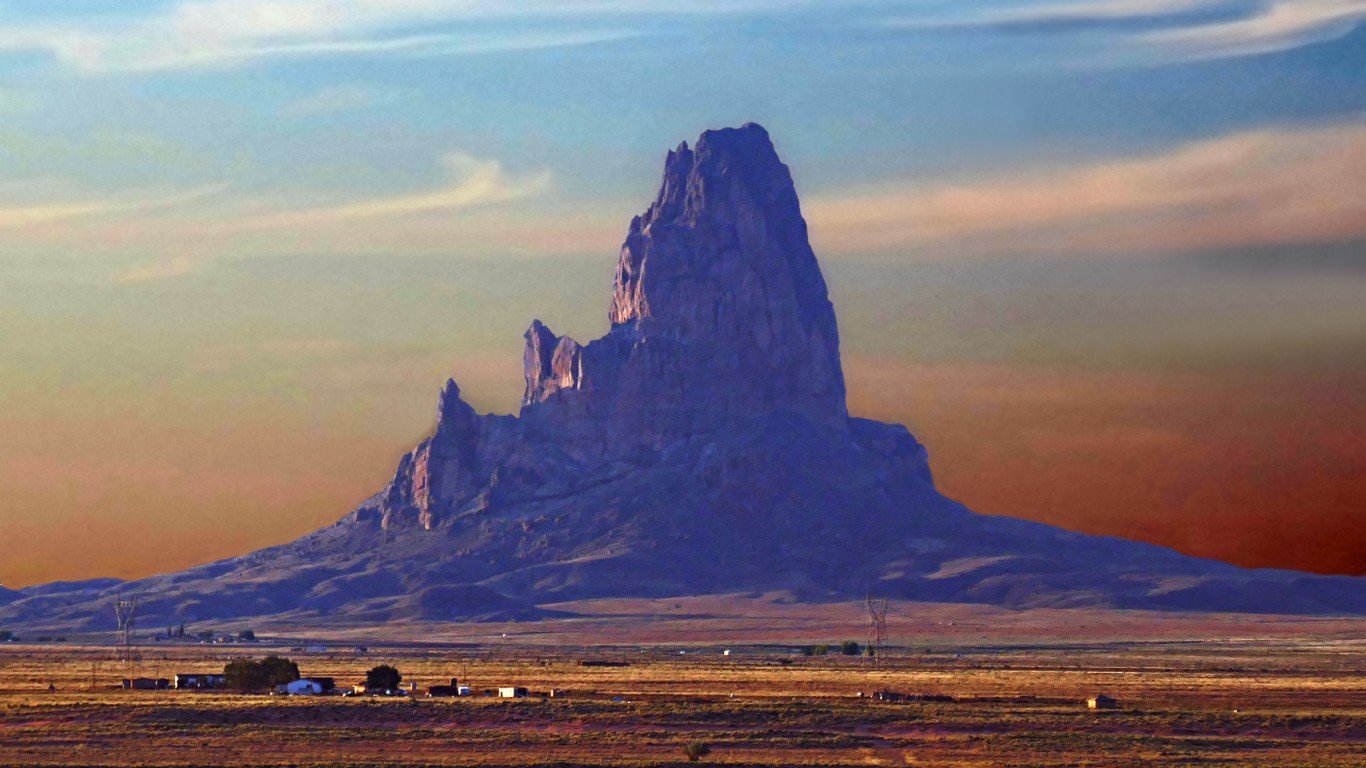
33. Navajo County, Arizona
> % of county in extreme or exceptional drought July 12: 100.0%
> Weeks of 100% exceptional drought over past 12 months: 8
> Weeks of at least 50% exceptional drought over past 12 months: 34
> Number of consecutive weeks of any amount of extreme or exceptional drought: 46 (August 25,2020 – July 12,2021)
> Population: 109,270

32. Zapata County, Texas
> % of county in extreme or exceptional drought July 12: 0.0%
> Weeks of 100% exceptional drought over past 12 months: 8
> Weeks of at least 50% exceptional drought over past 12 months: 9
> Number of consecutive weeks of any amount of extreme or exceptional drought: 24 (December 15,2020 – May 31,2021)
> Population: 14,304
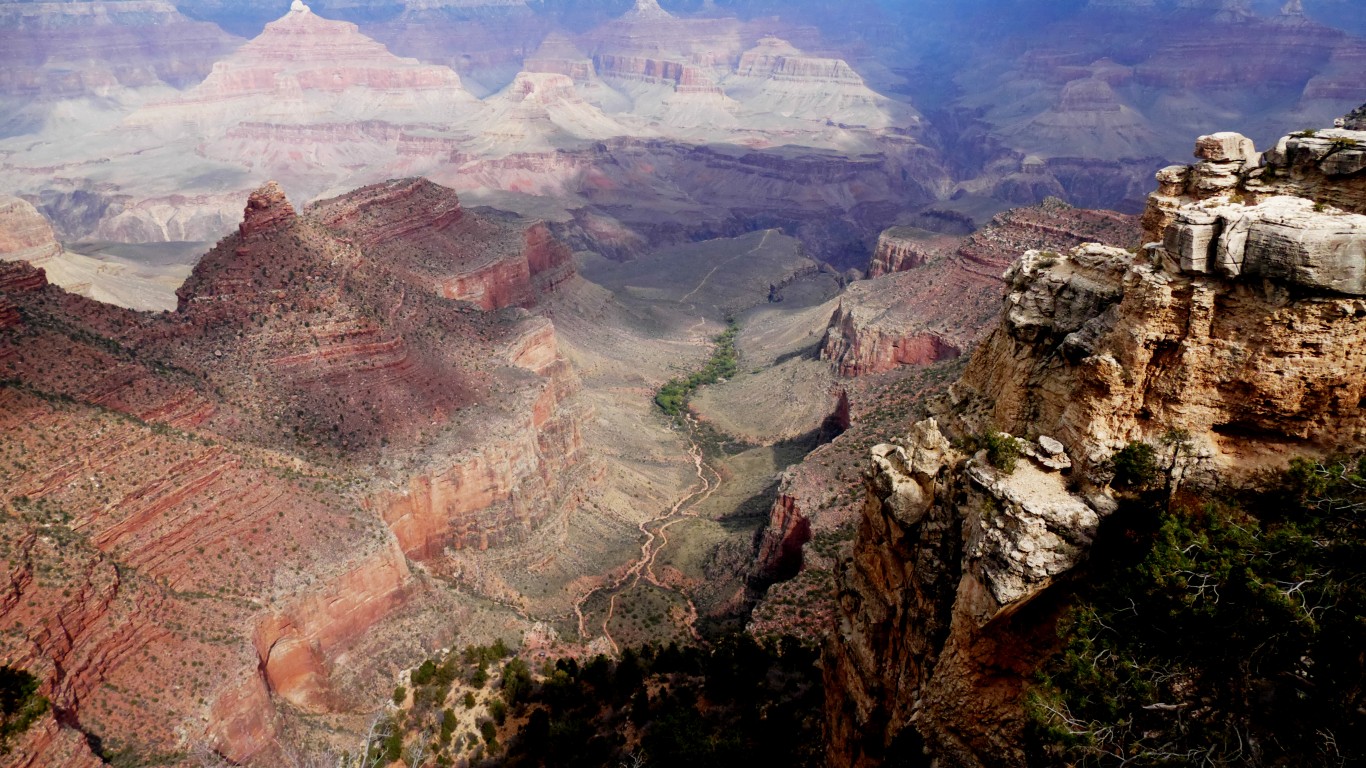
31. Coconino County, Arizona
> % of county in extreme or exceptional drought July 12: 100.0%
> Weeks of 100% exceptional drought over past 12 months: 9
> Weeks of at least 50% exceptional drought over past 12 months: 33
> Number of consecutive weeks of any amount of extreme or exceptional drought: 47 (August 18,2020 – July 12,2021)
> Population: 141,274
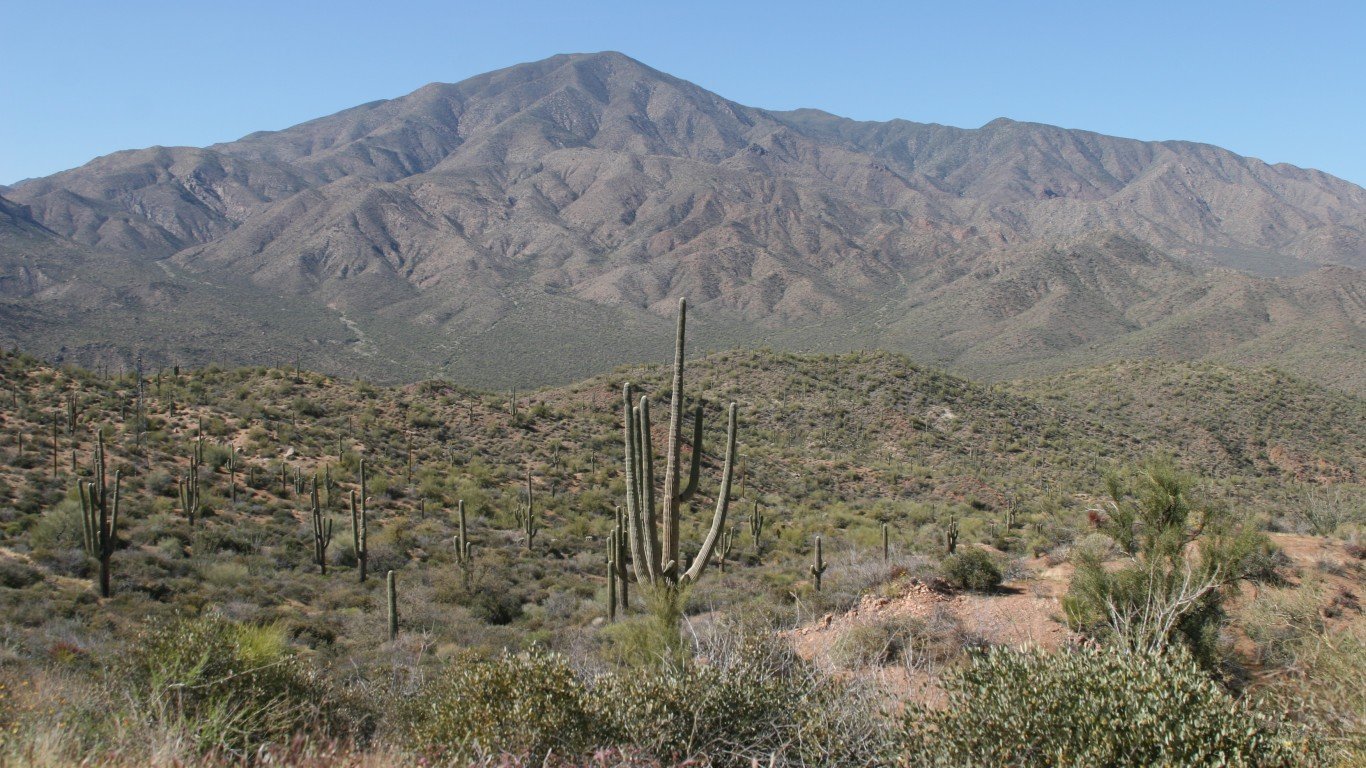
30. Gila County, Arizona
> % of county in extreme or exceptional drought July 12: 100.0%
> Weeks of 100% exceptional drought over past 12 months: 9
> Weeks of at least 50% exceptional drought over past 12 months: 9
> Number of consecutive weeks of any amount of extreme or exceptional drought: 46 (August 25,2020 – July 12,2021)
> Population: 53,546
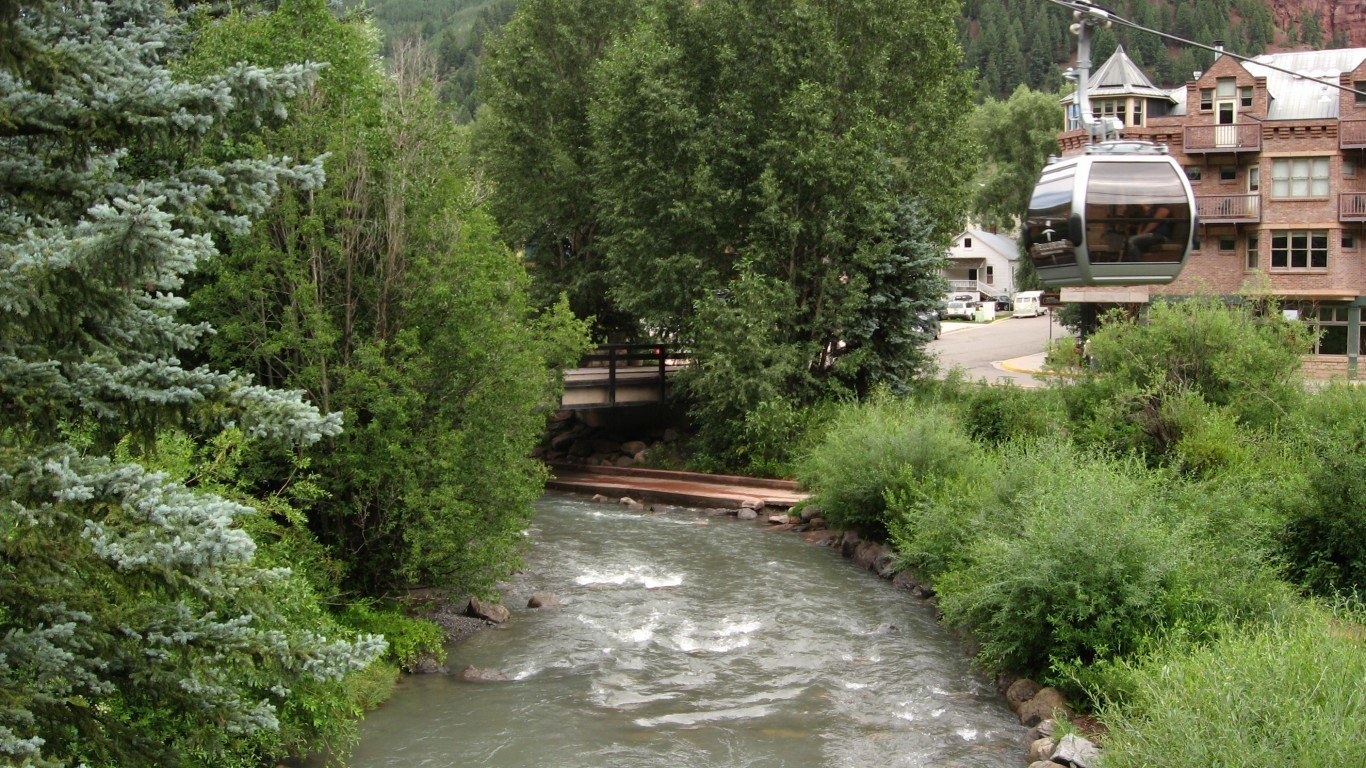
29. San Miguel County, Colorado
> % of county in extreme or exceptional drought July 12: 99.8%
> Weeks of 100% exceptional drought over past 12 months: 10
> Weeks of at least 50% exceptional drought over past 12 months: 40
> Number of consecutive weeks of any amount of extreme or exceptional drought: 53 (July 7,2020 – July 12,2021)
> Population: 8,049
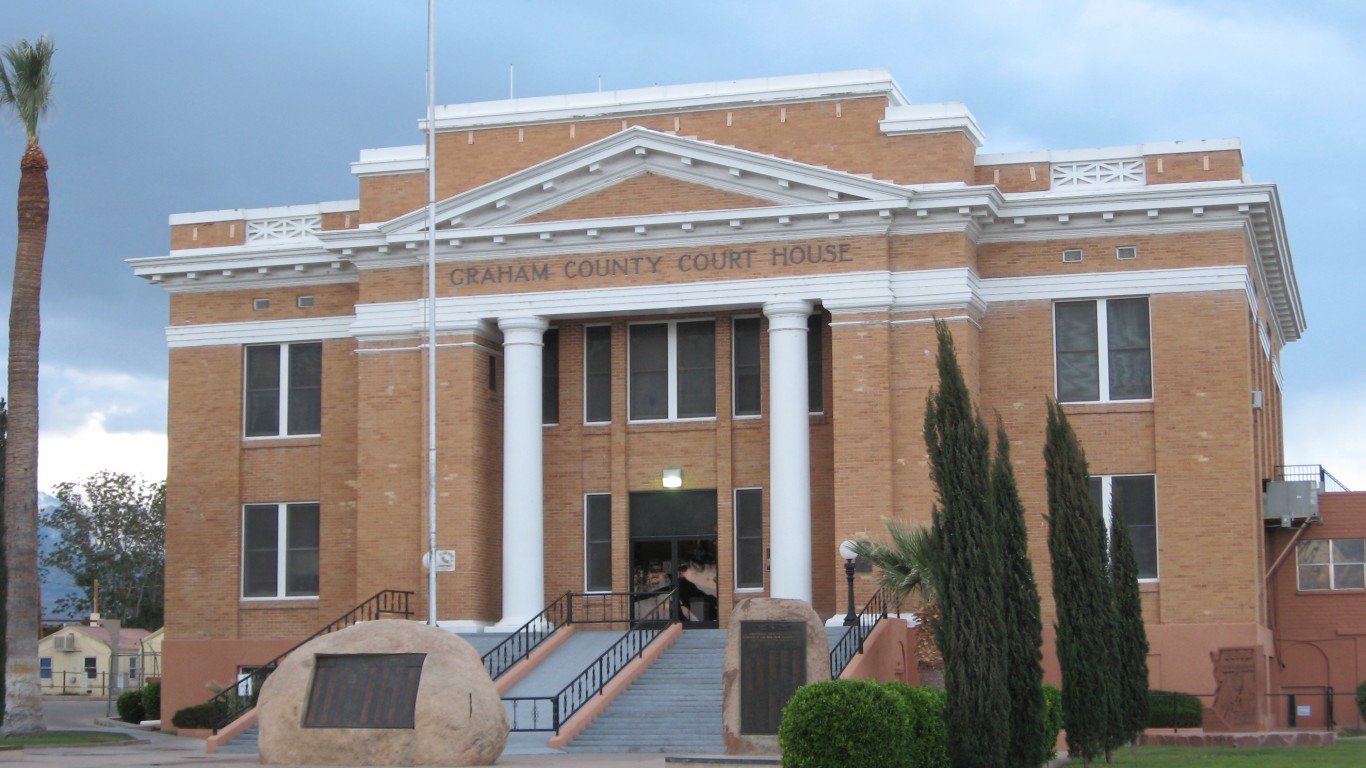
28. Graham County, Arizona
> % of county in extreme or exceptional drought July 12: 100.0%
> Weeks of 100% exceptional drought over past 12 months: 10
> Weeks of at least 50% exceptional drought over past 12 months: 34
> Number of consecutive weeks of any amount of extreme or exceptional drought: 46 (August 25,2020 – July 12,2021)
> Population: 37,996
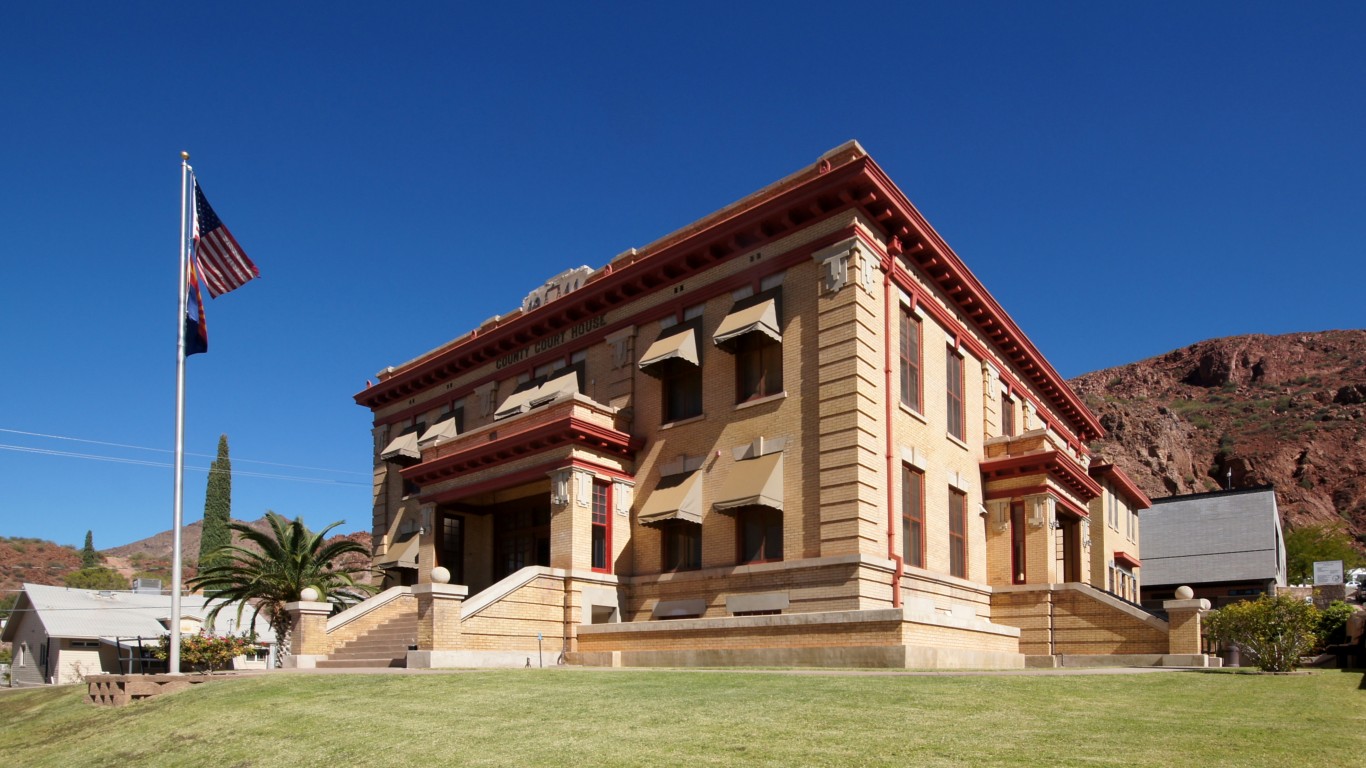
27. Greenlee County, Arizona
> % of county in extreme or exceptional drought July 12: 100.0%
> Weeks of 100% exceptional drought over past 12 months: 10
> Weeks of at least 50% exceptional drought over past 12 months: 34
> Number of consecutive weeks of any amount of extreme or exceptional drought: 46 (August 25,2020 – July 12,2021)
> Population: 20,517
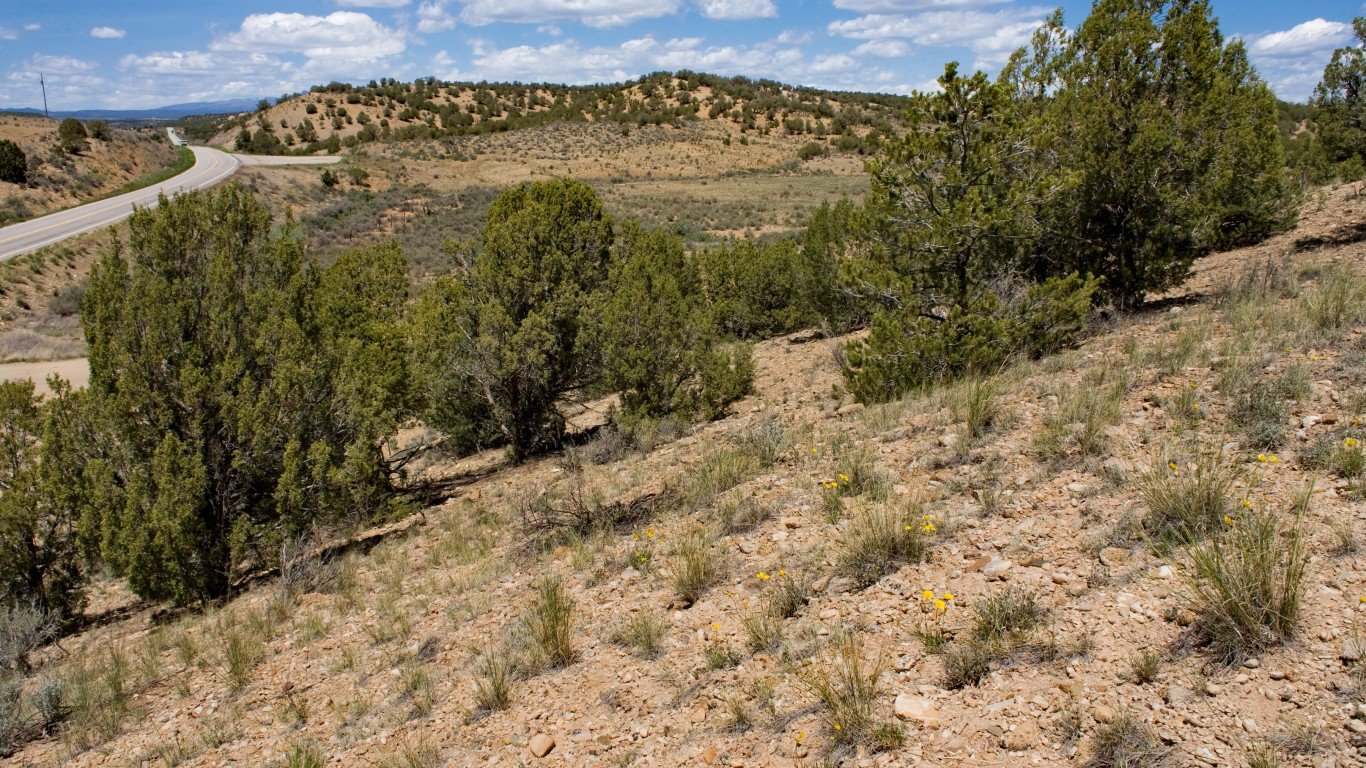
26. La Plata County, Colorado
> % of county in extreme or exceptional drought July 12: 98.7%
> Weeks of 100% exceptional drought over past 12 months: 10
> Weeks of at least 50% exceptional drought over past 12 months: 23
> Number of consecutive weeks of any amount of extreme or exceptional drought: 53 (July 7,2020 – July 12,2021)
> Population: 55,617
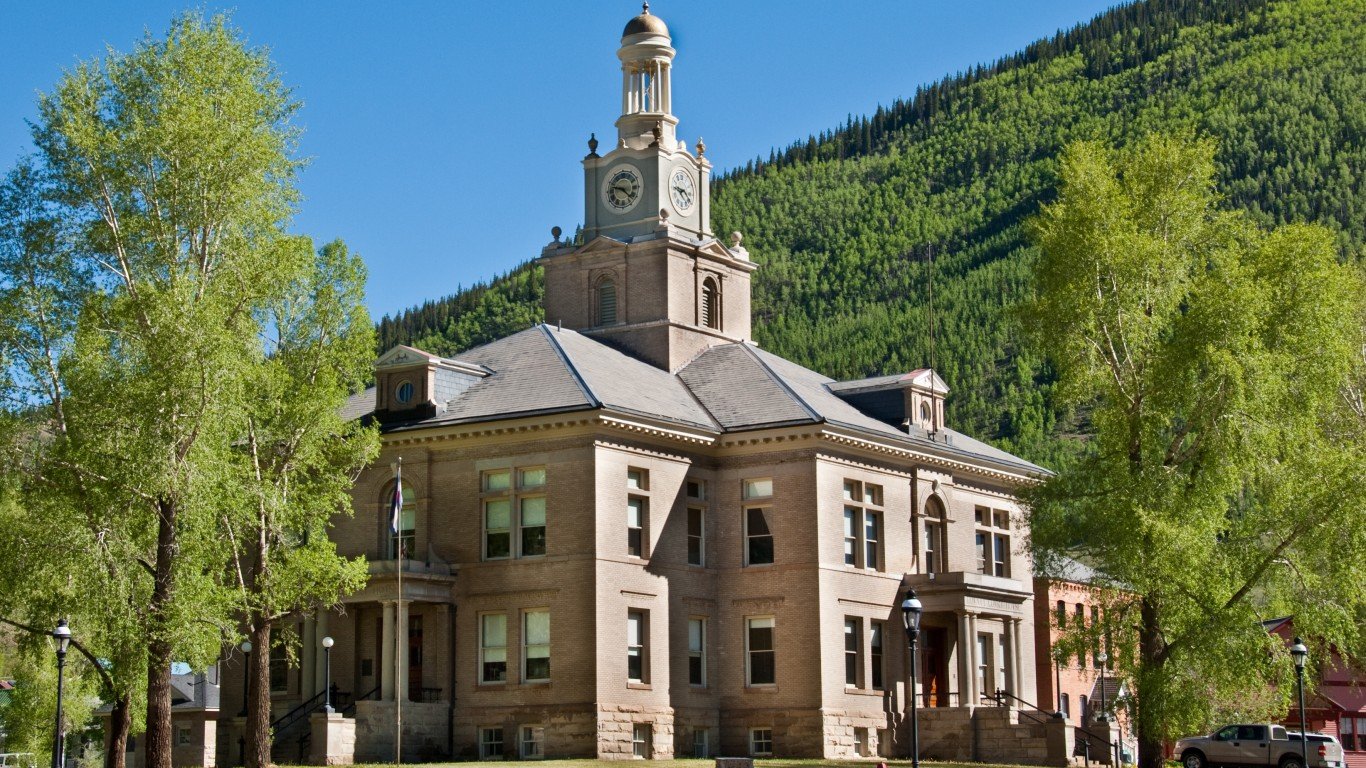
25. San Juan County, Colorado
> % of county in extreme or exceptional drought July 12: 72.4%
> Weeks of 100% exceptional drought over past 12 months: 10
> Weeks of at least 50% exceptional drought over past 12 months: 16
> Number of consecutive weeks of any amount of extreme or exceptional drought: 53 (July 7,2020 – July 12,2021)
> Population: 589
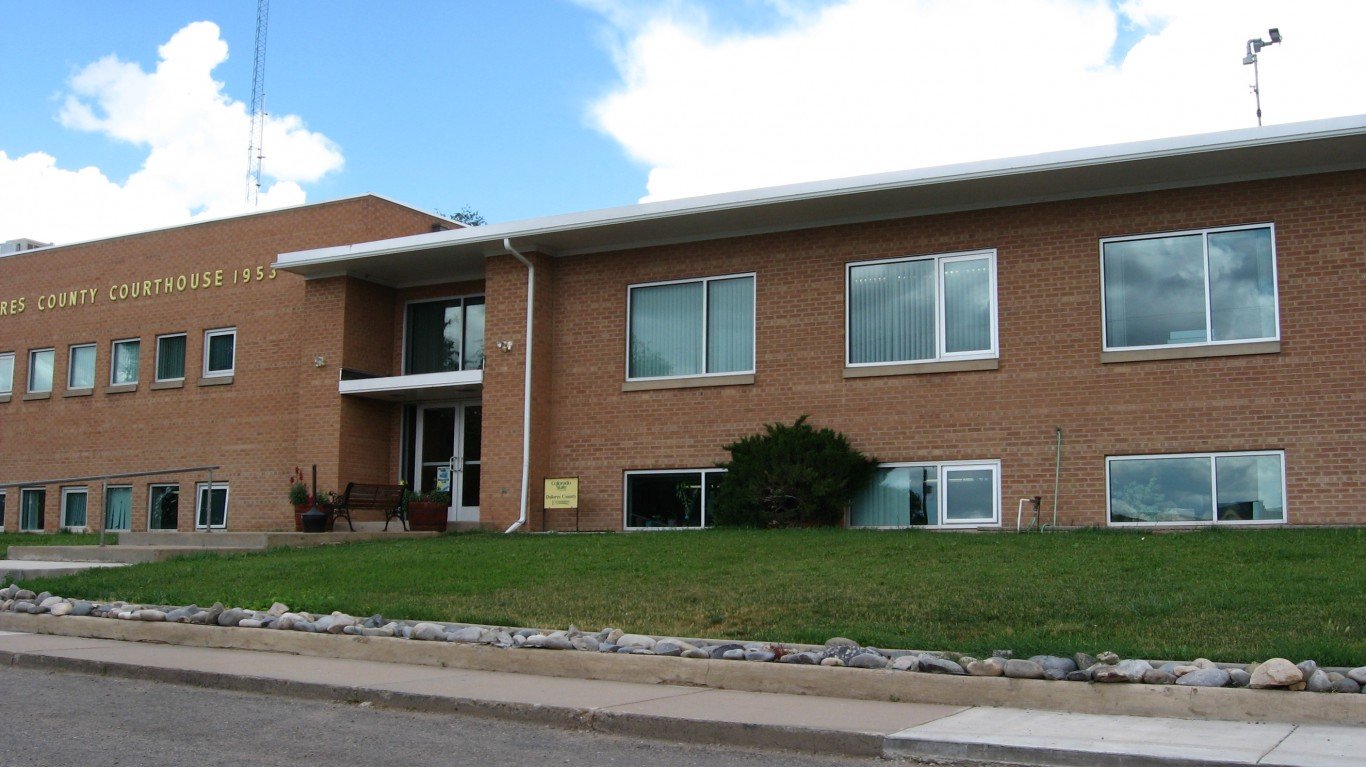
24. Dolores County, Colorado
> % of county in extreme or exceptional drought July 12: 100.0%
> Weeks of 100% exceptional drought over past 12 months: 10
> Weeks of at least 50% exceptional drought over past 12 months: 13
> Number of consecutive weeks of any amount of extreme or exceptional drought: 53 (July 7,2020 – July 12,2021)
> Population: 15,902
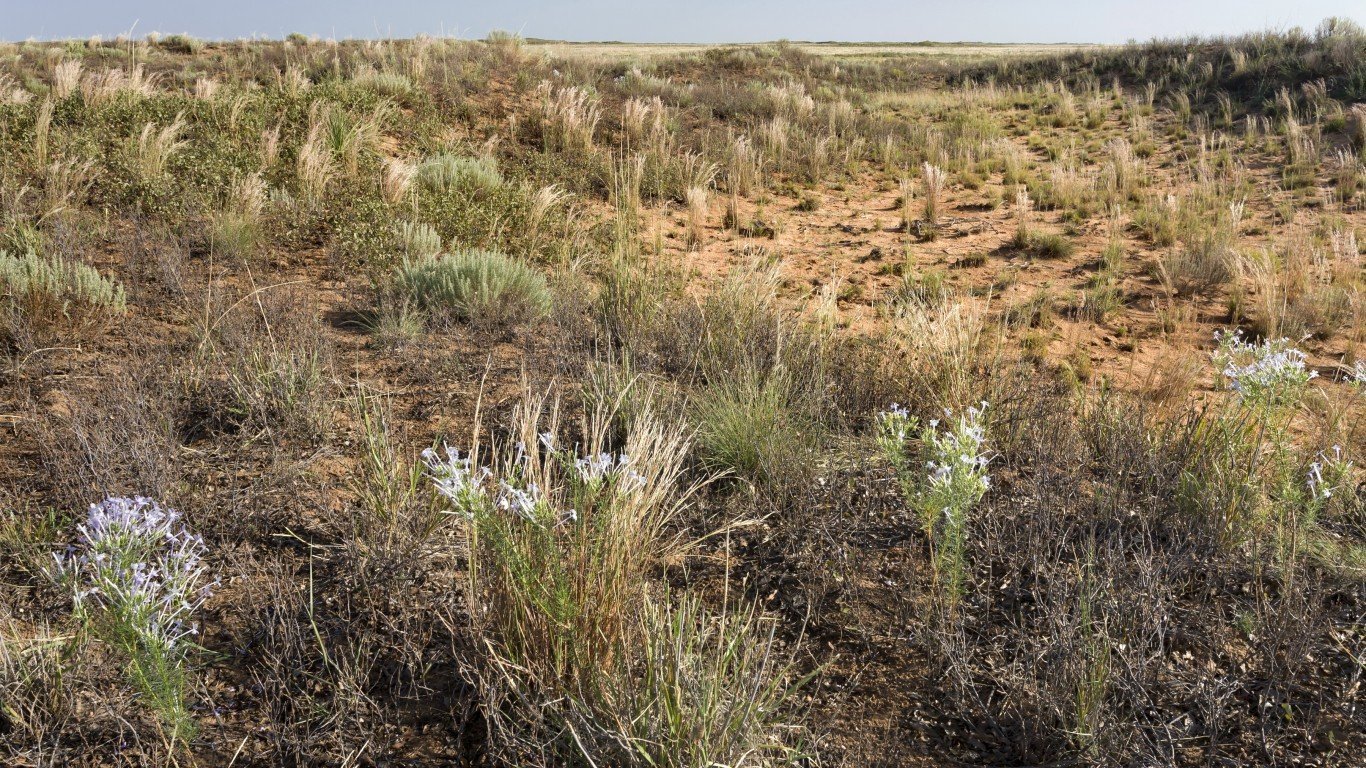
23. Roosevelt County, New Mexico
> % of county in extreme or exceptional drought July 12: 13.2%
> Weeks of 100% exceptional drought over past 12 months: 11
> Weeks of at least 50% exceptional drought over past 12 months: 29
> Number of consecutive weeks of any amount of extreme or exceptional drought: 45 (September 1,2020 – July 12,2021)
> Population: 18,888

22. Yoakum County, Texas
> % of county in extreme or exceptional drought July 12: 0.0%
> Weeks of 100% exceptional drought over past 12 months: 11
> Weeks of at least 50% exceptional drought over past 12 months: 26
> Number of consecutive weeks of any amount of extreme or exceptional drought: 48 (July 7,2020 – June 7,2021)
> Population: 8,631

21. Montezuma County, Colorado
> % of county in extreme or exceptional drought July 12: 100.0%
> Weeks of 100% exceptional drought over past 12 months: 11
> Weeks of at least 50% exceptional drought over past 12 months: 13
> Number of consecutive weeks of any amount of extreme or exceptional drought: 53 (July 7,2020 – July 12,2021)
> Population: 26,031

20. Lea County, New Mexico
> % of county in extreme or exceptional drought July 12: 6.5%
> Weeks of 100% exceptional drought over past 12 months: 12
> Weeks of at least 50% exceptional drought over past 12 months: 29
> Number of consecutive weeks of any amount of extreme or exceptional drought: 52 (July 14,2020 – July 12,2021)
> Population: 70,277

19. Bailey County, Texas
> % of county in extreme or exceptional drought July 12: 0.0%
> Weeks of 100% exceptional drought over past 12 months: 12
> Weeks of at least 50% exceptional drought over past 12 months: 12
> Number of consecutive weeks of any amount of extreme or exceptional drought: 44 (August 18,2020 – June 7,2021)
> Population: 11,910
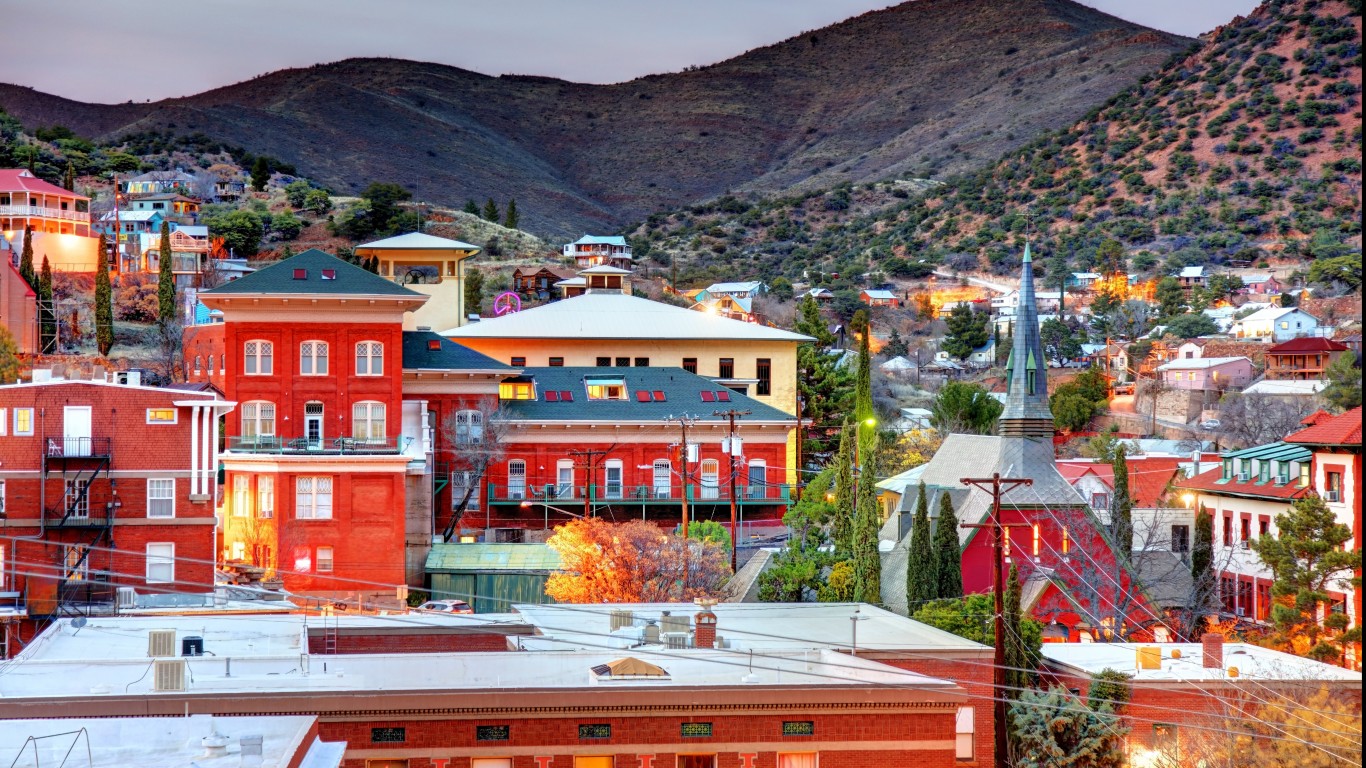
18. Cochise County, Arizona
> % of county in extreme or exceptional drought July 12: 100.0%
> Weeks of 100% exceptional drought over past 12 months: 13
> Weeks of at least 50% exceptional drought over past 12 months: 33
> Number of consecutive weeks of any amount of extreme or exceptional drought: 46 (August 25,2020 – July 12,2021)
> Population: 125,867

17. Hidalgo County, New Mexico
> % of county in extreme or exceptional drought July 12: 100.0%
> Weeks of 100% exceptional drought over past 12 months: 13
> Weeks of at least 50% exceptional drought over past 12 months: 33
> Number of consecutive weeks of any amount of extreme or exceptional drought: 46 (August 25,2020 – July 12,2021)
> Population: 4,297

16. Santa Cruz County, Arizona
> % of county in extreme or exceptional drought July 12: 100.0%
> Weeks of 100% exceptional drought over past 12 months: 13
> Weeks of at least 50% exceptional drought over past 12 months: 13
> Number of consecutive weeks of any amount of extreme or exceptional drought: 44 (September 8,2020 – July 12,2021)
> Population: 46,480
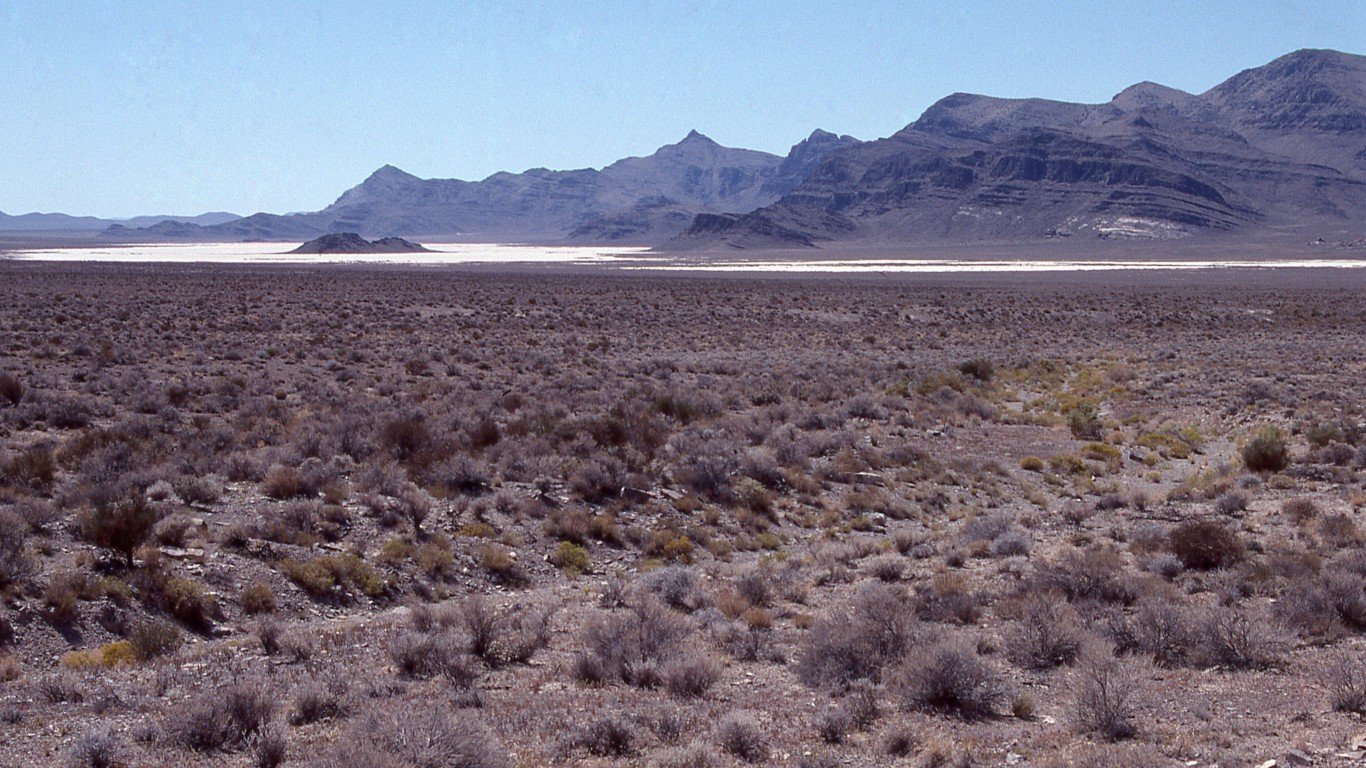
15. Millard County, Utah
> % of county in extreme or exceptional drought July 12: 100.0%
> Weeks of 100% exceptional drought over past 12 months: 16
> Weeks of at least 50% exceptional drought over past 12 months: 42
> Number of consecutive weeks of any amount of extreme or exceptional drought: 53 (July 7,2020 – July 12,2021)
> Population: 12,854
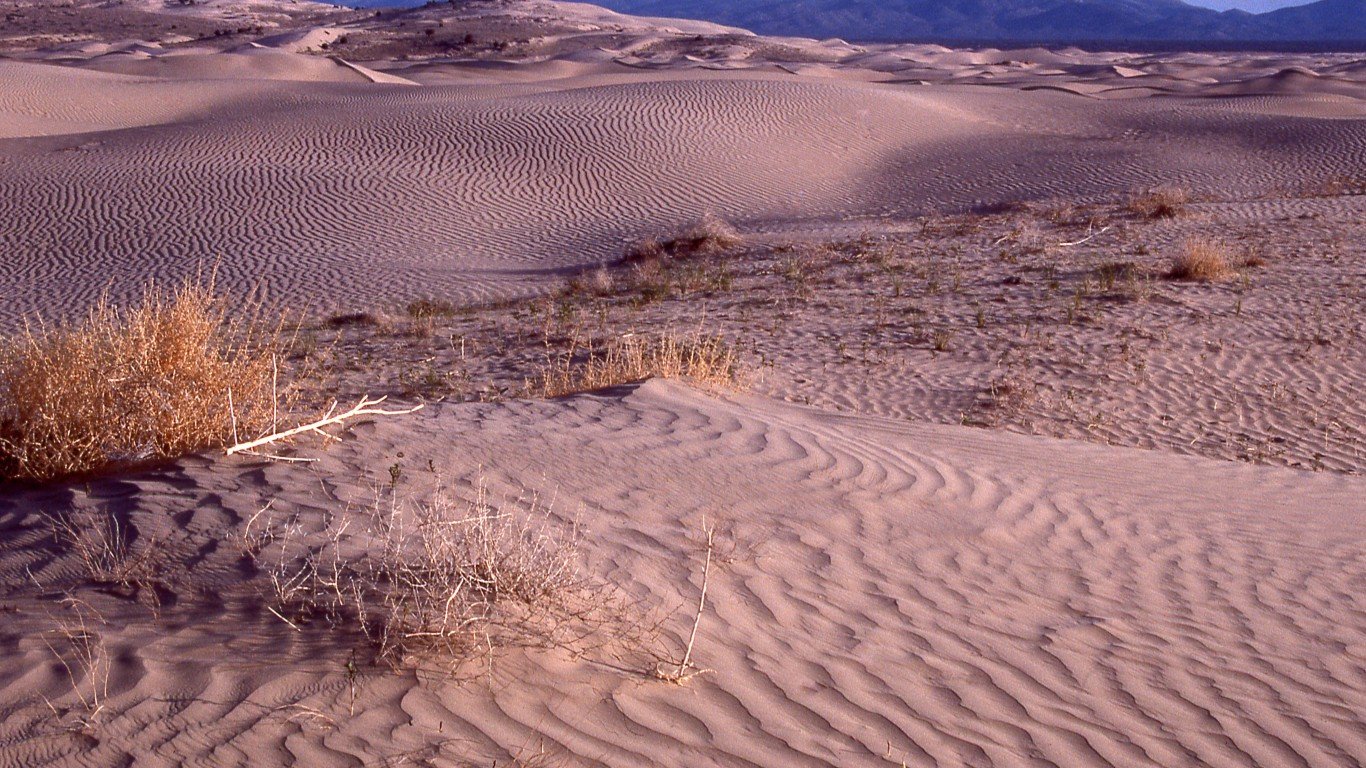
14. Juab County, Utah
> % of county in extreme or exceptional drought July 12: 100.0%
> Weeks of 100% exceptional drought over past 12 months: 16
> Weeks of at least 50% exceptional drought over past 12 months: 41
> Number of consecutive weeks of any amount of extreme or exceptional drought: 53 (July 7,2020 – July 12,2021)
> Population: 11,301
13. Sevier County, Utah
> % of county in extreme or exceptional drought July 12: 100.0%
> Weeks of 100% exceptional drought over past 12 months: 16
> Weeks of at least 50% exceptional drought over past 12 months: 24
> Number of consecutive weeks of any amount of extreme or exceptional drought: 48 (August 11,2020 – July 12,2021)
> Population: 21,280

12. Lincoln County, Nevada
> % of county in extreme or exceptional drought July 12: 100.0%
> Weeks of 100% exceptional drought over past 12 months: 20
> Weeks of at least 50% exceptional drought over past 12 months: 33
> Number of consecutive weeks of any amount of extreme or exceptional drought: 49 (August 4,2020 – July 12,2021)
> Population: 5,180
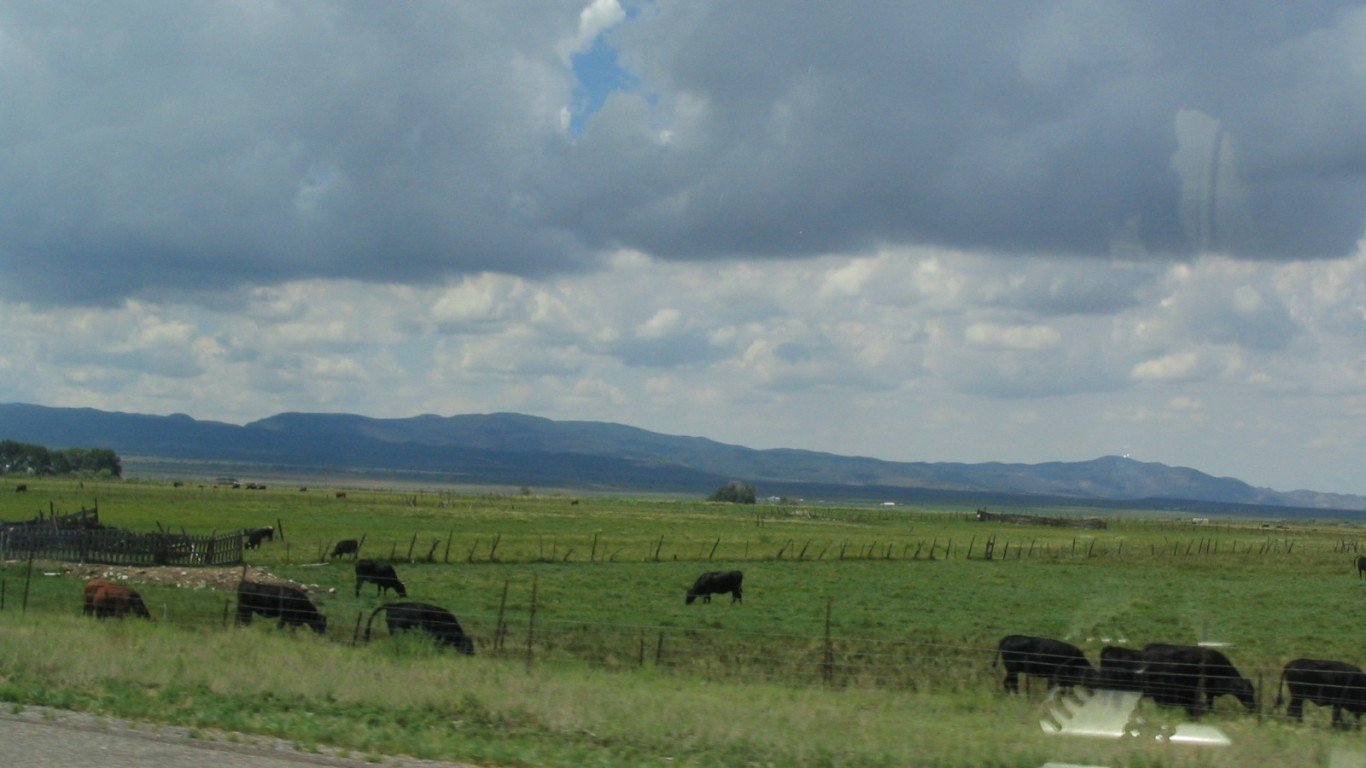
11. Beaver County, Utah
> % of county in extreme or exceptional drought July 12: 100.0%
> Weeks of 100% exceptional drought over past 12 months: 21
> Weeks of at least 50% exceptional drought over past 12 months: 38
> Number of consecutive weeks of any amount of extreme or exceptional drought: 48 (August 11,2020 – July 12,2021)
> Population: 6,517

10. Chaves County, New Mexico
> % of county in extreme or exceptional drought July 12: 42.8%
> Weeks of 100% exceptional drought over past 12 months: 22
> Weeks of at least 50% exceptional drought over past 12 months: 32
> Number of consecutive weeks of any amount of extreme or exceptional drought: 52 (July 14,2020 – July 12,2021)
> Population: 65,144
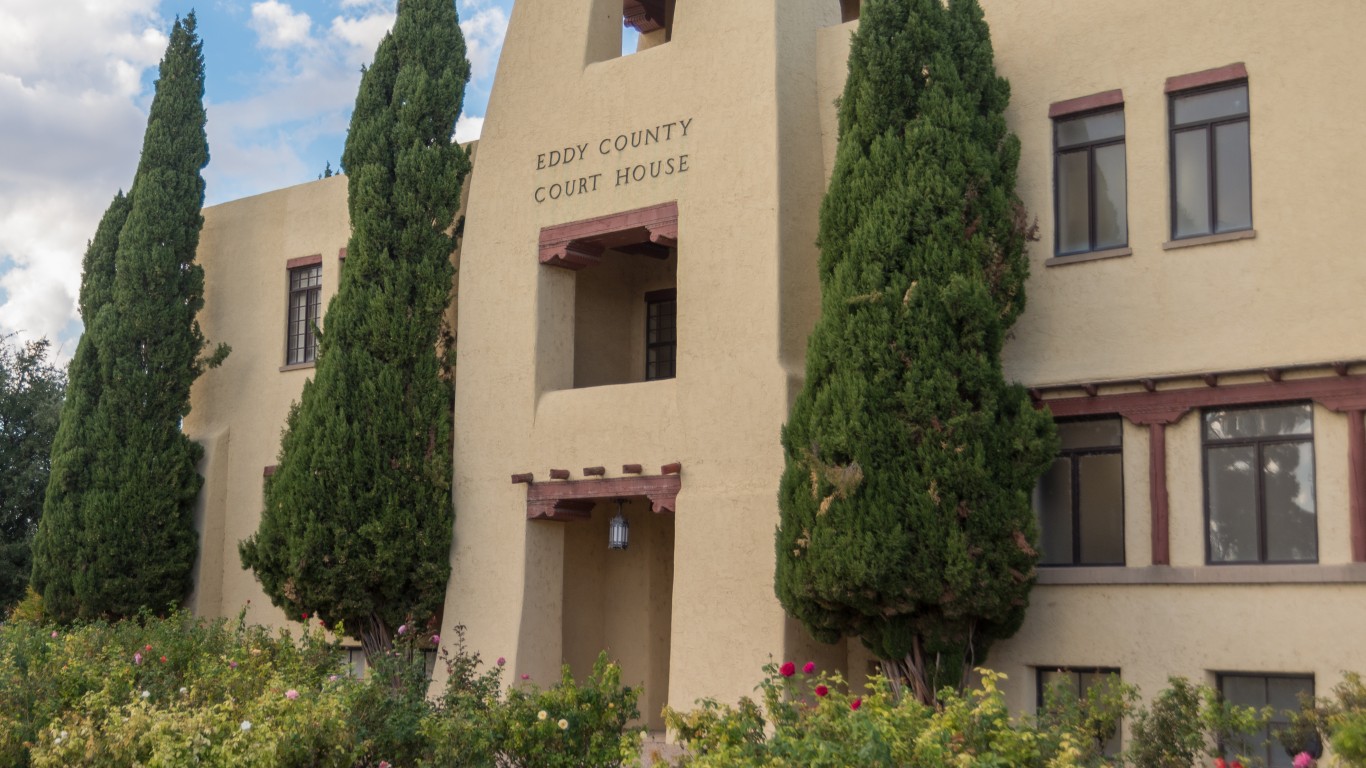
9. Eddy County, New Mexico
> % of county in extreme or exceptional drought July 12: 29.4%
> Weeks of 100% exceptional drought over past 12 months: 22
> Weeks of at least 50% exceptional drought over past 12 months: 30
> Number of consecutive weeks of any amount of extreme or exceptional drought: 52 (July 14,2020 – July 12,2021)
> Population: 57,732
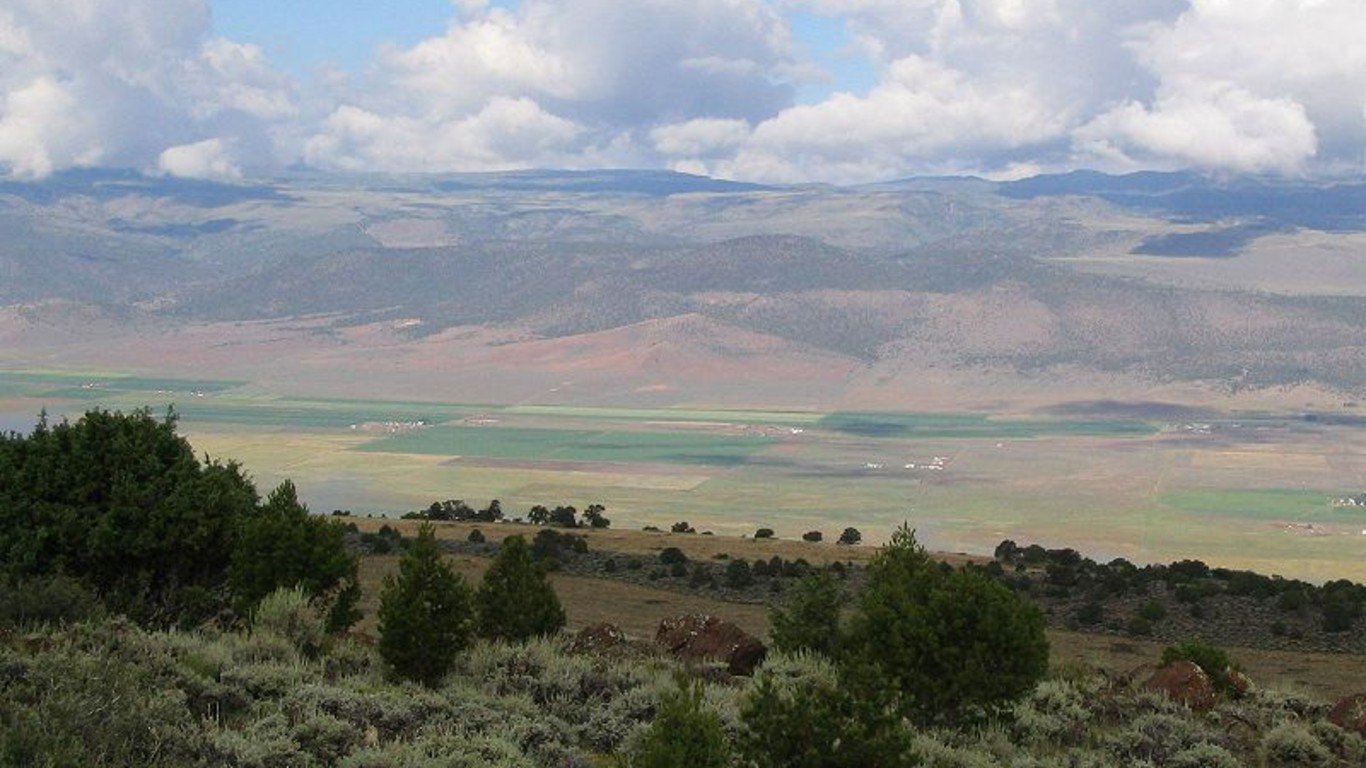
8. Piute County, Utah
> % of county in extreme or exceptional drought July 12: 100.0%
> Weeks of 100% exceptional drought over past 12 months: 24
> Weeks of at least 50% exceptional drought over past 12 months: 24
> Number of consecutive weeks of any amount of extreme or exceptional drought: 48 (August 11,2020 – July 12,2021)
> Population: 7,646
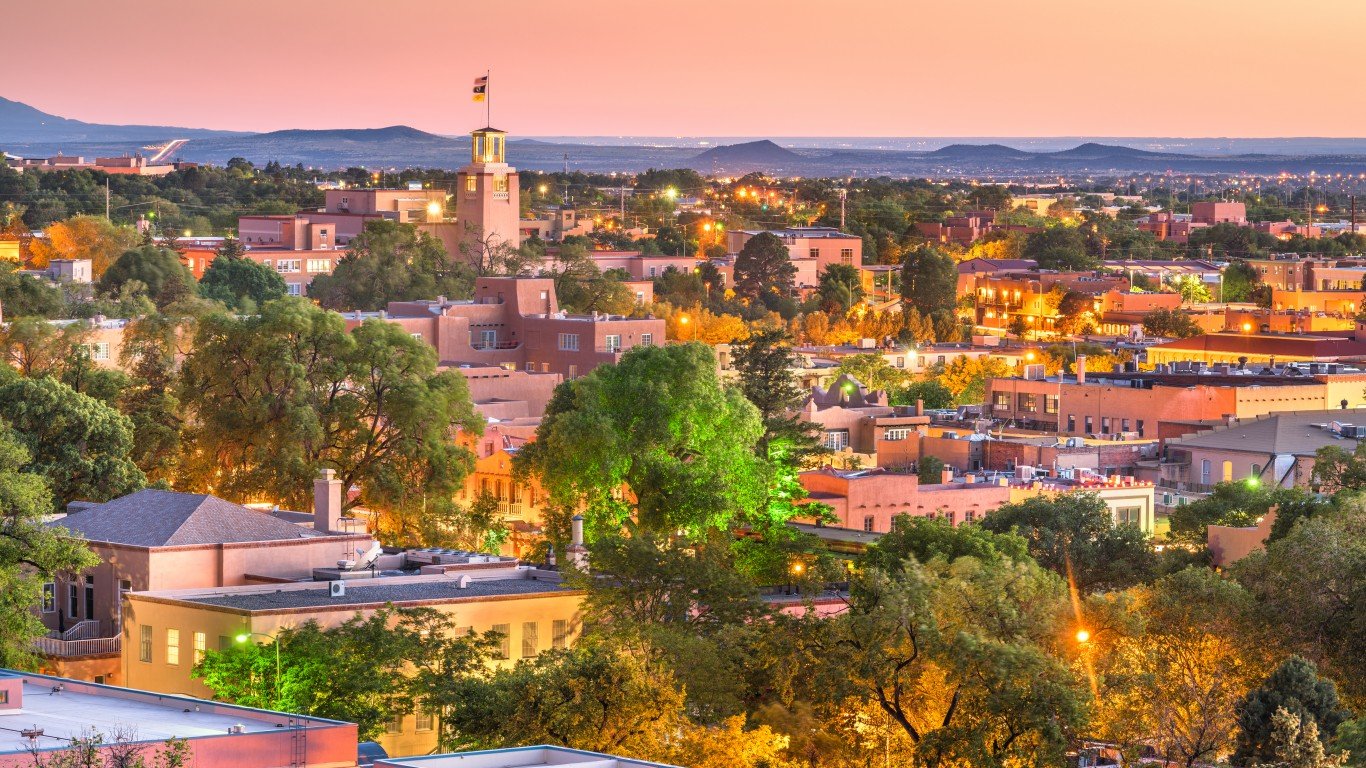
7. Santa Fe County, New Mexico
> % of county in extreme or exceptional drought July 12: 100.0%
> Weeks of 100% exceptional drought over past 12 months: 26
> Weeks of at least 50% exceptional drought over past 12 months: 40
> Number of consecutive weeks of any amount of extreme or exceptional drought: 45 (September 1,2020 – July 12,2021)
> Population: 3,856

6. Parmer County, Texas
> % of county in extreme or exceptional drought July 12: 0.0%
> Weeks of 100% exceptional drought over past 12 months: 28
> Weeks of at least 50% exceptional drought over past 12 months: 35
> Number of consecutive weeks of any amount of extreme or exceptional drought: 45 (August 18,2020 – June 7,2021)
> Population: 9,718
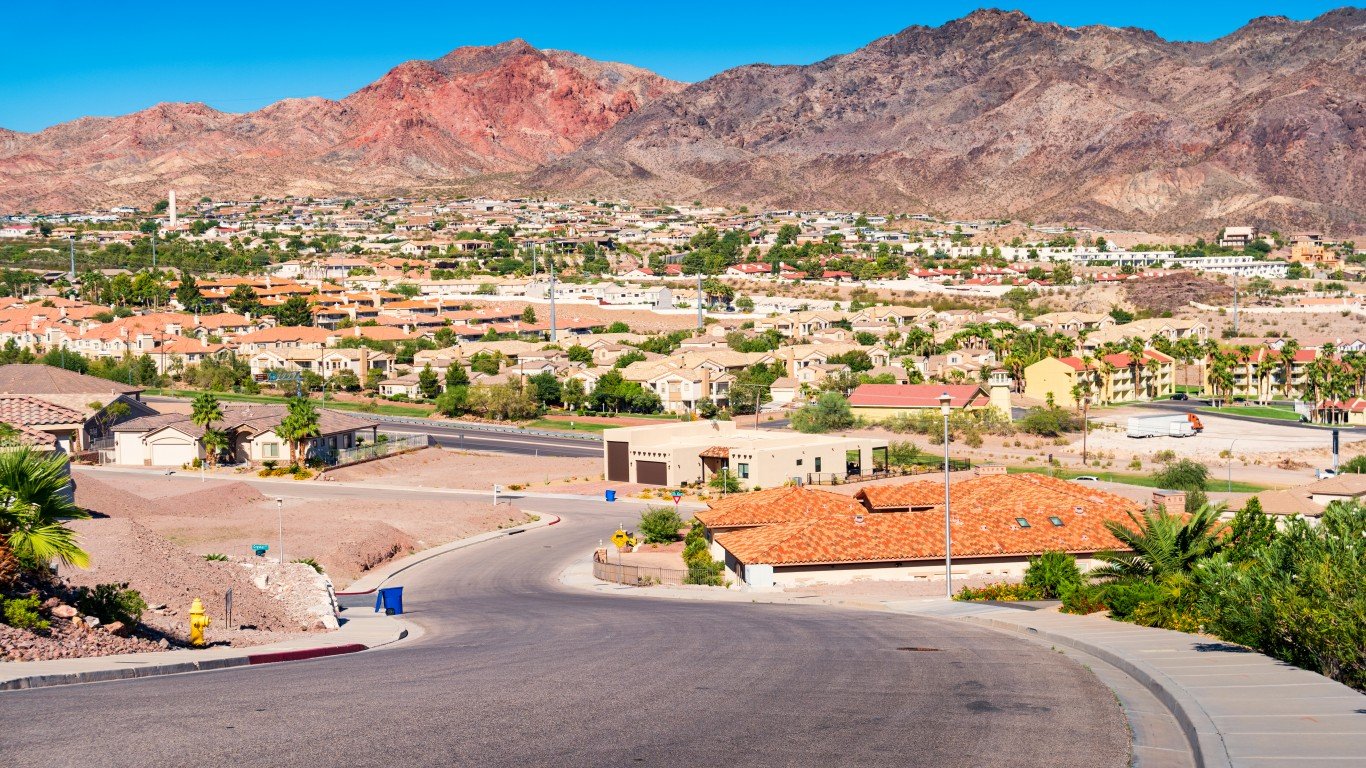
5. Clark County, Nevada
> % of county in extreme or exceptional drought July 12: 100.0%
> Weeks of 100% exceptional drought over past 12 months: 30
> Weeks of at least 50% exceptional drought over past 12 months: 33
> Number of consecutive weeks of any amount of extreme or exceptional drought: 46 (August 25,2020 – July 12,2021)
> Population: 2,182,004
4. Kane County, Utah
> % of county in extreme or exceptional drought July 12: 100.0%
> Weeks of 100% exceptional drought over past 12 months: 32
> Weeks of at least 50% exceptional drought over past 12 months: 35
> Number of consecutive weeks of any amount of extreme or exceptional drought: 50 (July 28,2020 – July 12,2021)
> Population: 7,484
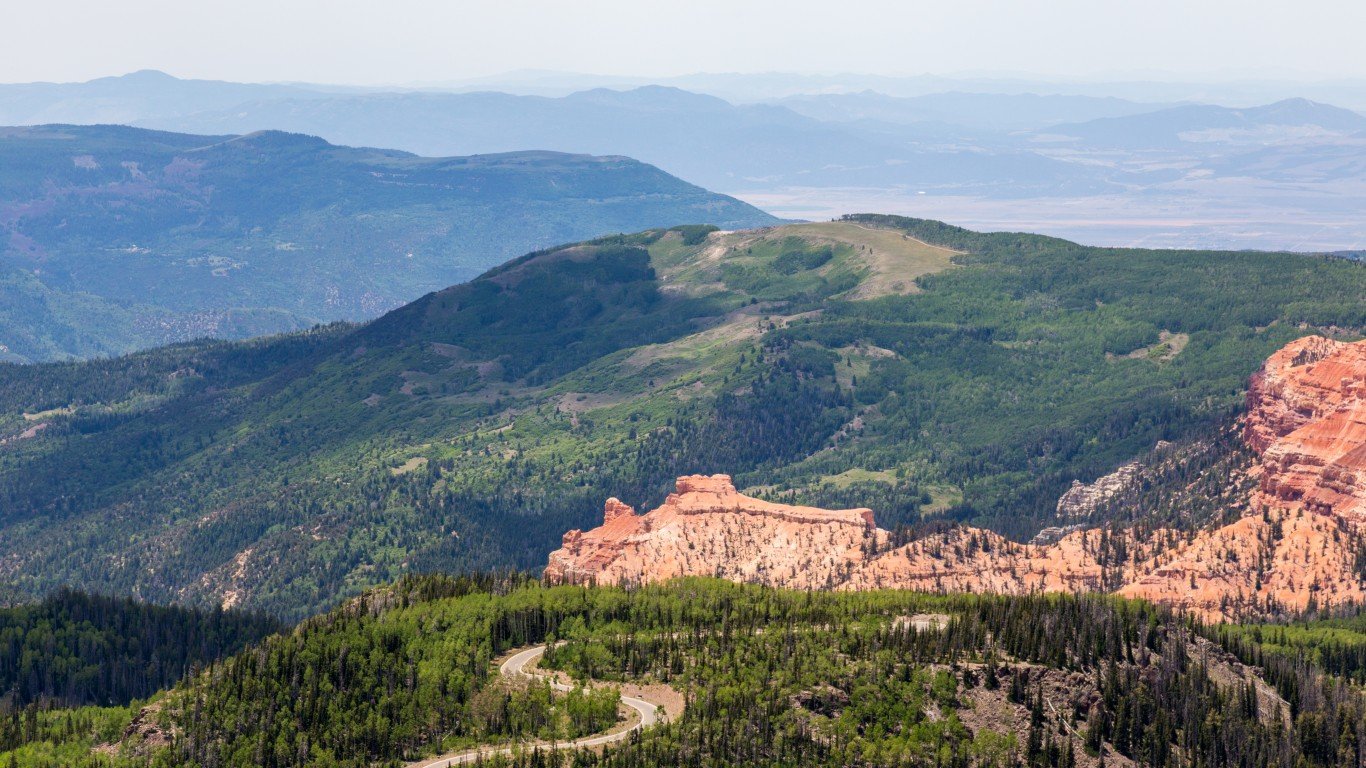
3. Iron County, Utah
> % of county in extreme or exceptional drought July 12: 100.0%
> Weeks of 100% exceptional drought over past 12 months: 33
> Weeks of at least 50% exceptional drought over past 12 months: 35
> Number of consecutive weeks of any amount of extreme or exceptional drought: 50 (July 28,2020 – July 12,2021)
> Population: 51,213
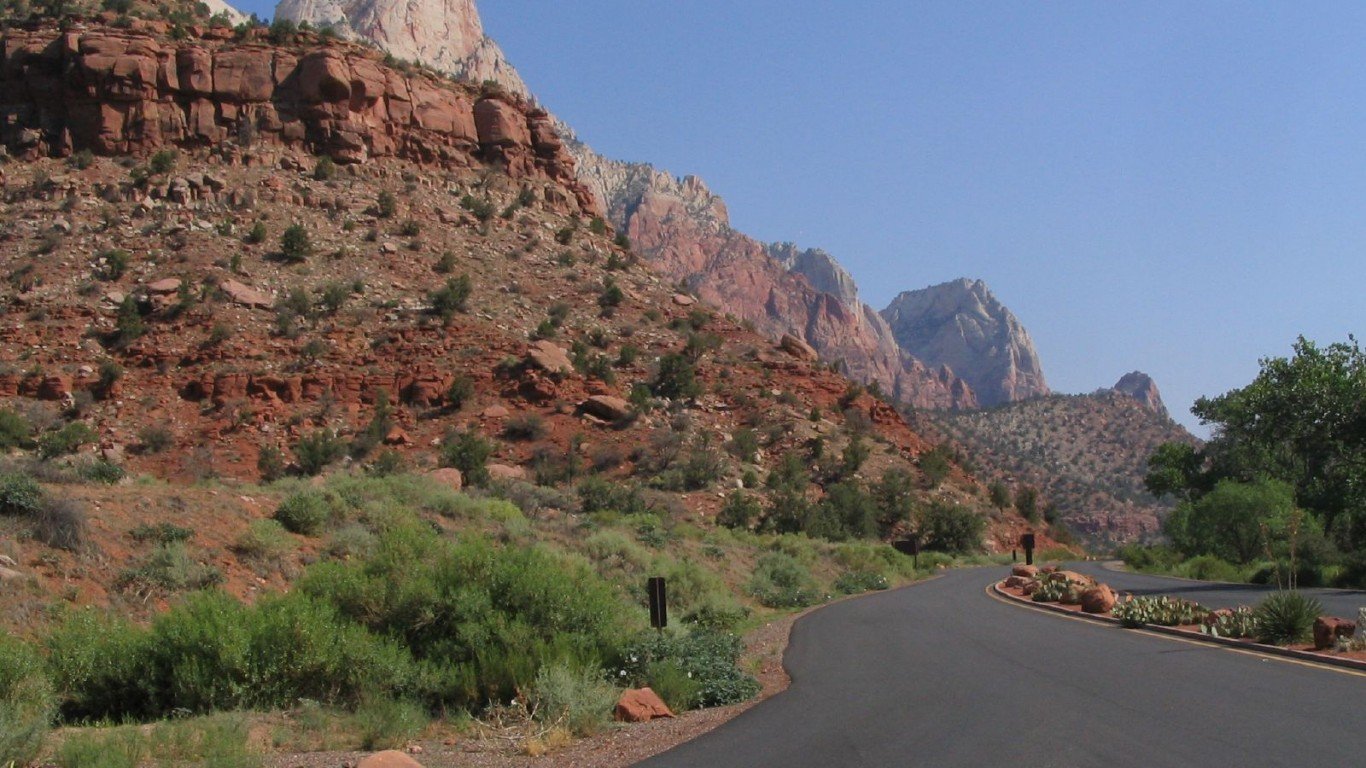
2. Washington County, Utah
> % of county in extreme or exceptional drought July 12: 100.0%
> Weeks of 100% exceptional drought over past 12 months: 33
> Weeks of at least 50% exceptional drought over past 12 months: 33
> Number of consecutive weeks of any amount of extreme or exceptional drought: 50 (July 28,2020 – July 12,2021)
> Population: 165,811
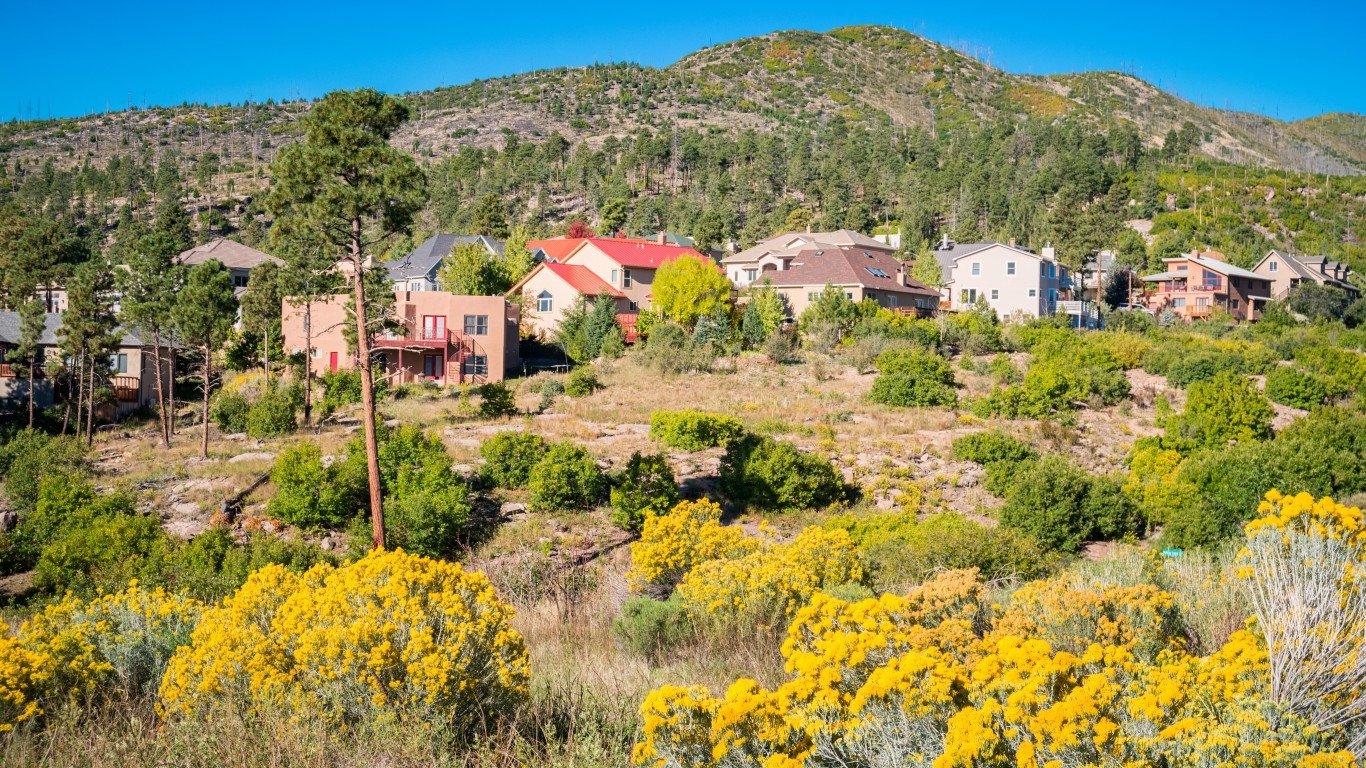
1. Los Alamos County, New Mexico
> % of county in extreme or exceptional drought July 12: 100.0%
> Weeks of 100% exceptional drought over past 12 months: 40
> Weeks of at least 50% exceptional drought over past 12 months: 40
> Number of consecutive weeks of any amount of extreme or exceptional drought: 45 (September 1,2020 – July 12,2021)
> Population: 18,625
Contact [email protected] for any questions or corrections.