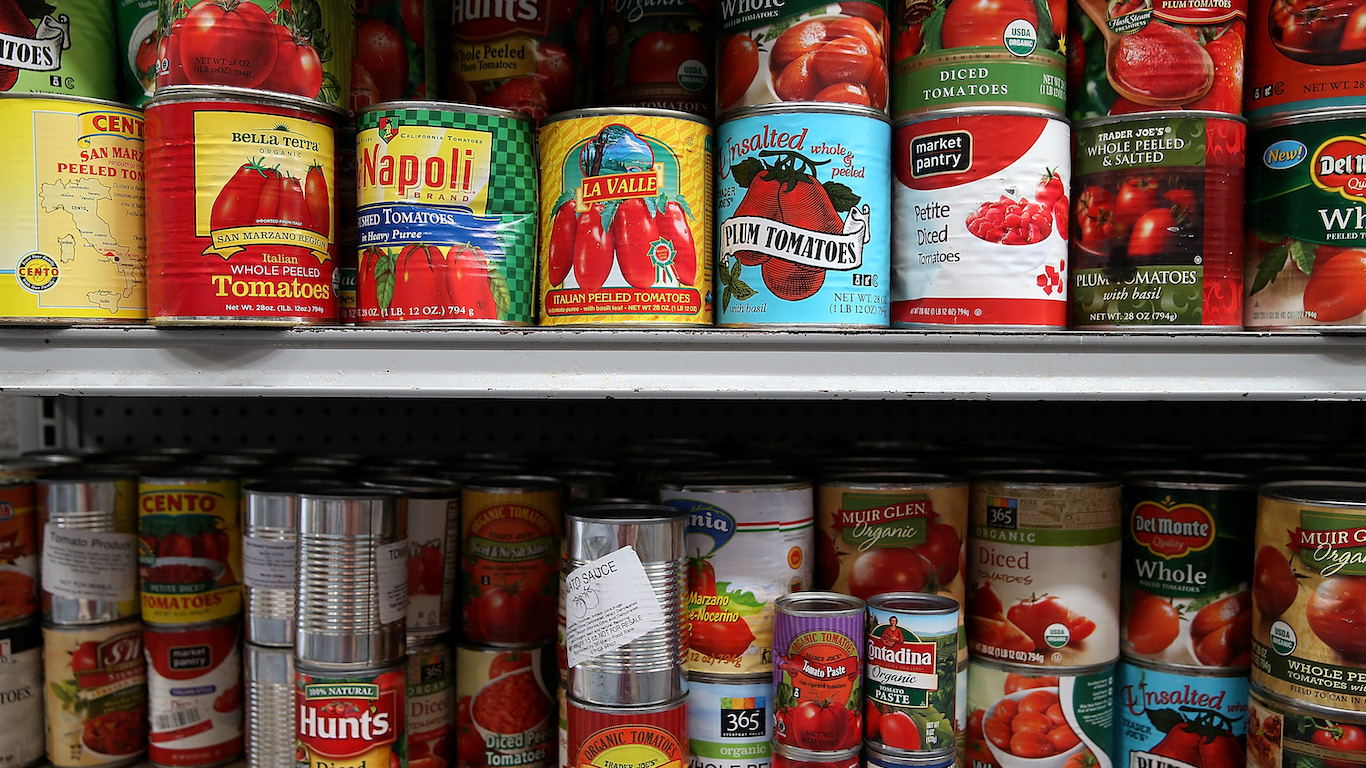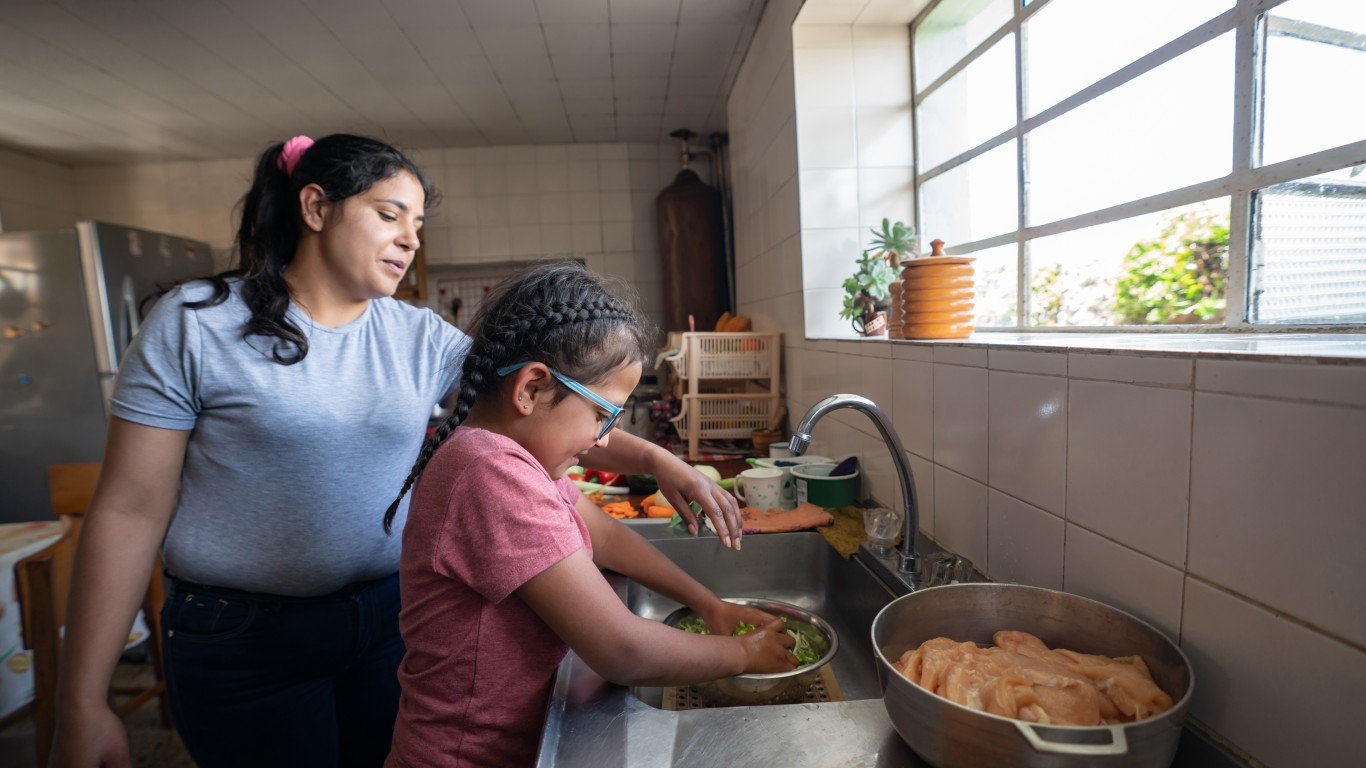
The United States is home to an estimated 35.2 million people who regularly struggle to put food on the table — a problem highlighted by the COVID-19 pandemic. According to an August 2021 survey conducted by the U.S. Census Bureau, some 11 million American households — or more than one in every 10 respondents — could not afford enough to eat at least once in the last week.
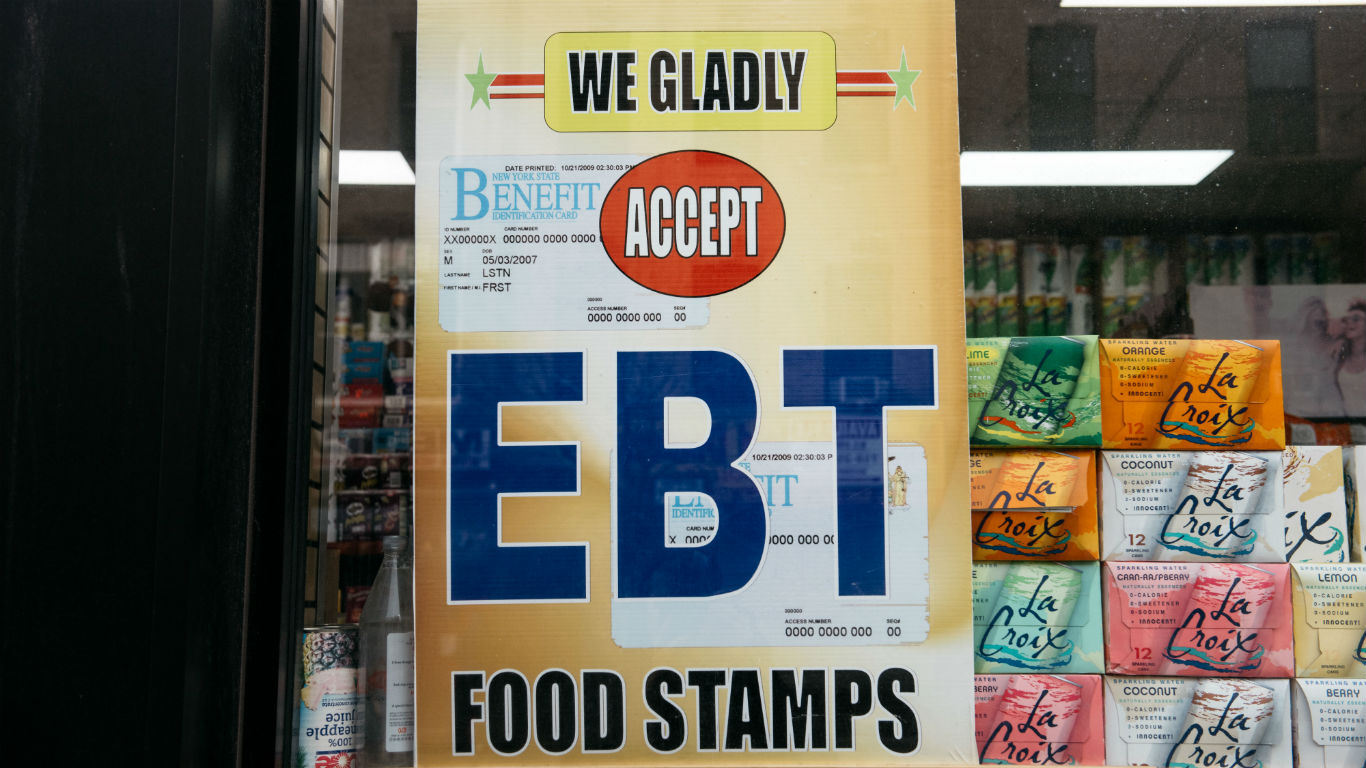
The Supplemental Nutrition Assistance Program — or SNAP — exists to help alleviate hunger and food insecurity among financially struggling families. SNAP, formerly known as food stamps, began as a temporary relief program during the Great Depression and became a permanent social assistance program in 1964 under President Lyndon Johnson. In its first year, the Food Stamp Program, as it was then known, had a budget of $75 million. As of 2020, the federal government spent $83.8 billion on SNAP, in addition to modest administrative costs shouldered by the states.
Using data from the U.S. Census Bureau’s 2019 American Community Survey, 24/7 Wall St. identified the cities with the most people on food stamps. We ranked all metropolitan statistical areas by the share of households receiving SNAP benefits. Every metro area on this list has a SNAP recipiency rate over 16%. For context, 10.7% of U.S. households receive SNAP benefits.
SNAP eligibility is determined largely by income level. As a result, places with high SNAP recipiency rates tend to have lower than average incomes and relatively large populations facing poverty. Every metro area on this list has a median household income below the national median of $65,716, and all but two have a higher poverty rate than the 12.3% national rate. Here is a look at the poorest city in every state.
Many of these areas also appear to be struggling to bring back jobs lost because of the pandemic. As of June 2021, only 10 of the 50 metro areas on this list had an unemployment rate below the 5.9% national jobless rate that month. Here is a look at the American cities that added jobs during the pandemic.
Click here to see the cities with the most people on food stamps.
Click here to see our detailed methodology.
50. Cleveland, TN
> Households with SNAP benefits: 16.1% (7,562 total)
> Poverty rate: 15.2% — middle 50% among metro areas
> Median household income: $52,178 — bottom 25% among metro areas
> June 2021 unemployment: 5.1% — middle 50% among metro areas
[in-text-ad]
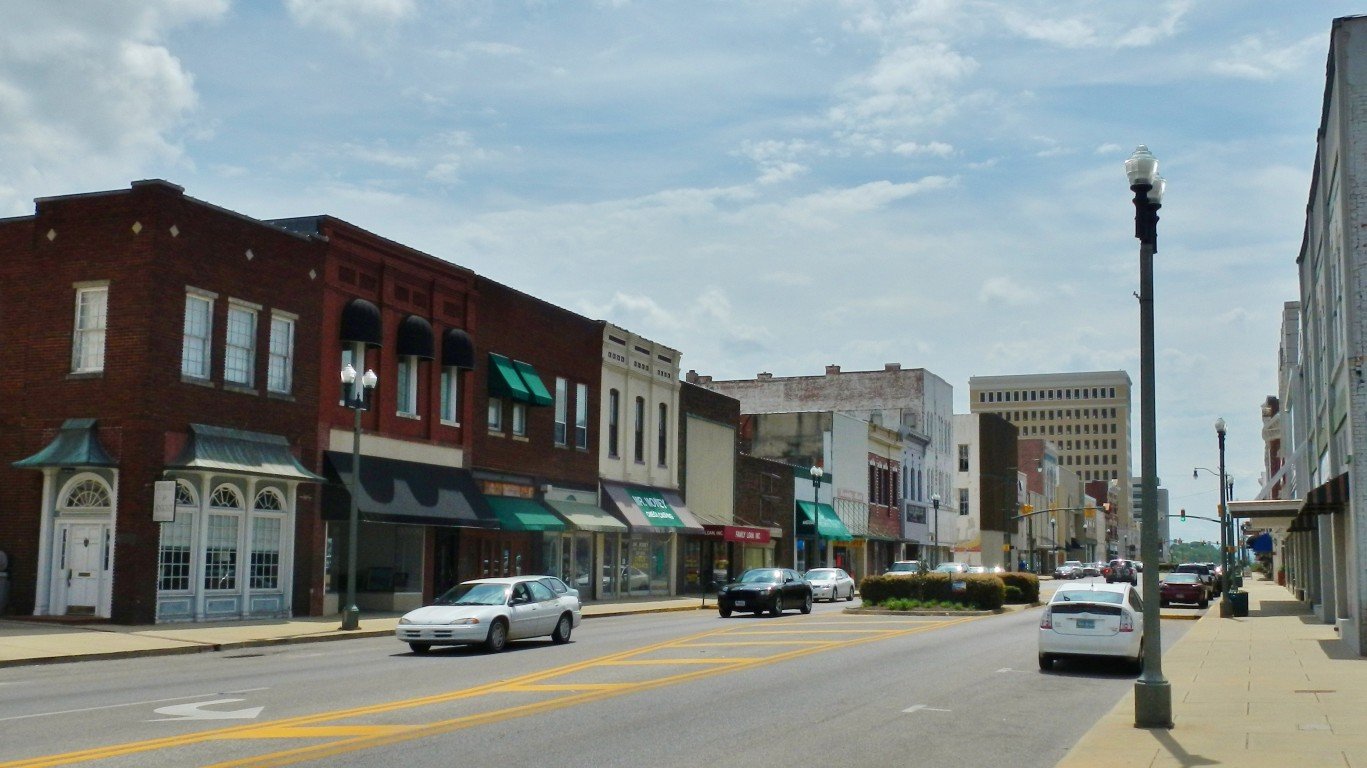
49. Anniston-Oxford-Jacksonville, AL
> Households with SNAP benefits: 16.1% (7,200 total)
> Poverty rate: 17.3% — top 25% among metro areas
> Median household income: $48,156 — bottom 10% among metro areas
> June 2021 unemployment: 3.7% — bottom 25% among metro areas
[recirclink id=836401]

48. Huntington-Ashland, WV-KY-OH
> Households with SNAP benefits: 16.3% (22,307 total)
> Poverty rate: 16.9% — top 25% among metro areas
> Median household income: $48,329 — bottom 10% among metro areas
> June 2021 unemployment: 5.2% — middle 50% among metro areas
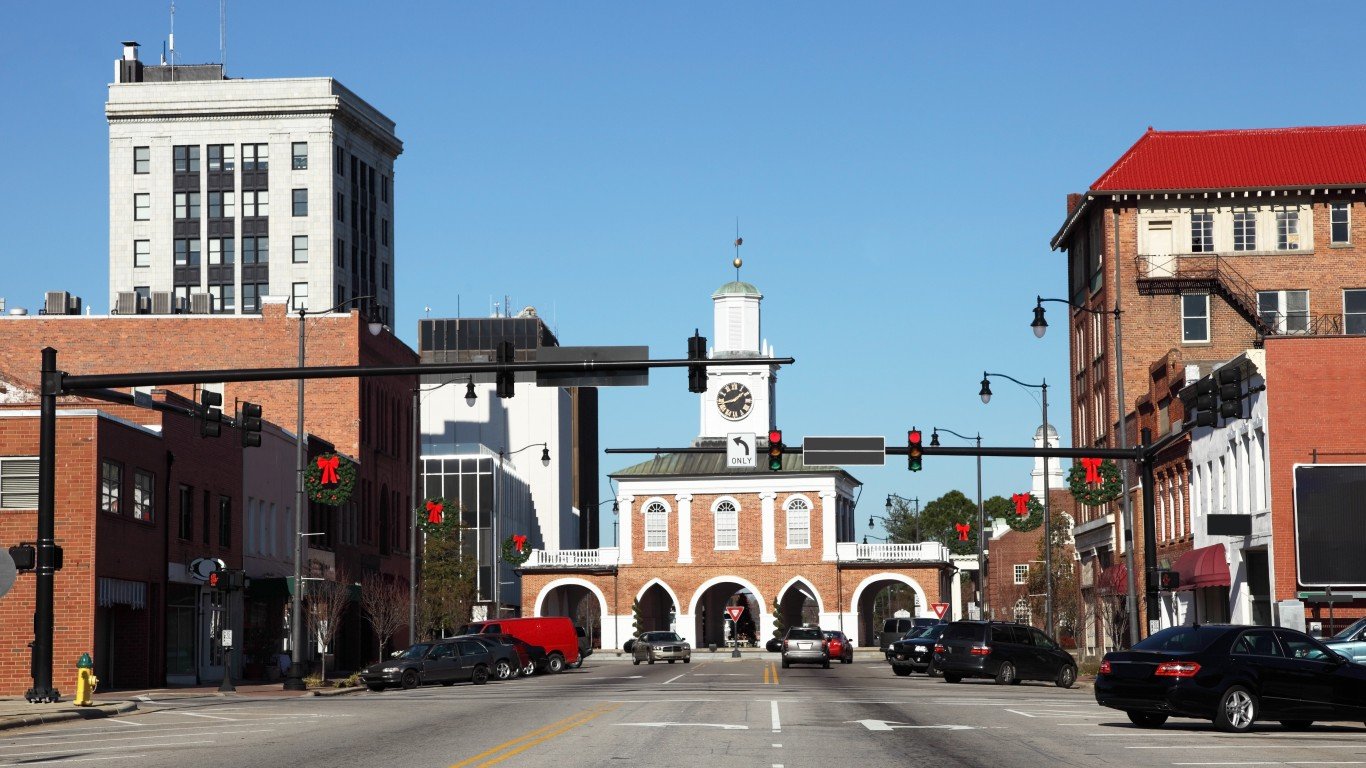
47. Fayetteville, NC
> Households with SNAP benefits: 16.3% (31,701 total)
> Poverty rate: 17.9% — top 25% among metro areas
> Median household income: $47,597 — bottom 10% among metro areas
> June 2021 unemployment: 6.5% — top 25% among metro areas
[in-text-ad-2]

46. Sierra Vista-Douglas, AZ
> Households with SNAP benefits: 16.4% (8,525 total)
> Poverty rate: 16.3% — top 25% among metro areas
> Median household income: $48,484 — bottom 10% among metro areas
> June 2021 unemployment: 6.3% — middle 50% among metro areas

45. Springfield, OH
> Households with SNAP benefits: 16.5% (8,972 total)
> Poverty rate: 14.6% — middle 50% among metro areas
> Median household income: $50,128 — bottom 25% among metro areas
> June 2021 unemployment: 5.9% — middle 50% among metro areas
[in-text-ad]

44. Sumter, SC
> Households with SNAP benefits: 16.5% (9,311 total)
> Poverty rate: 19.4% — top 10% among metro areas
> Median household income: $49,263 — bottom 25% among metro areas
> June 2021 unemployment: 4.5% — middle 50% among metro areas
[recirclink id=874024]

43. Rockford, IL
> Households with SNAP benefits: 16.5% (22,081 total)
> Poverty rate: 16.1% — top 25% among metro areas
> Median household income: $61,078 — middle 50% among metro areas
> June 2021 unemployment: 9.9% — top 10% among metro areas

42. Decatur, IL
> Households with SNAP benefits: 16.7% (7,142 total)
> Poverty rate: 17.4% — top 25% among metro areas
> Median household income: $50,839 — bottom 25% among metro areas
> June 2021 unemployment: 8.1% — top 10% among metro areas
[in-text-ad-2]

41. Weirton-Steubenville, WV-OH
> Households with SNAP benefits: 16.8% (8,405 total)
> Poverty rate: 14.7% — middle 50% among metro areas
> Median household income: $49,510 — bottom 25% among metro areas
> June 2021 unemployment: 8.1% — top 10% among metro areas

40. Eugene, OR
> Households with SNAP benefits: 16.8% (26,198 total)
> Poverty rate: 14.0% — middle 50% among metro areas
> Median household income: $57,325 — middle 50% among metro areas
> June 2021 unemployment: 6.2% — middle 50% among metro areas
[in-text-ad]
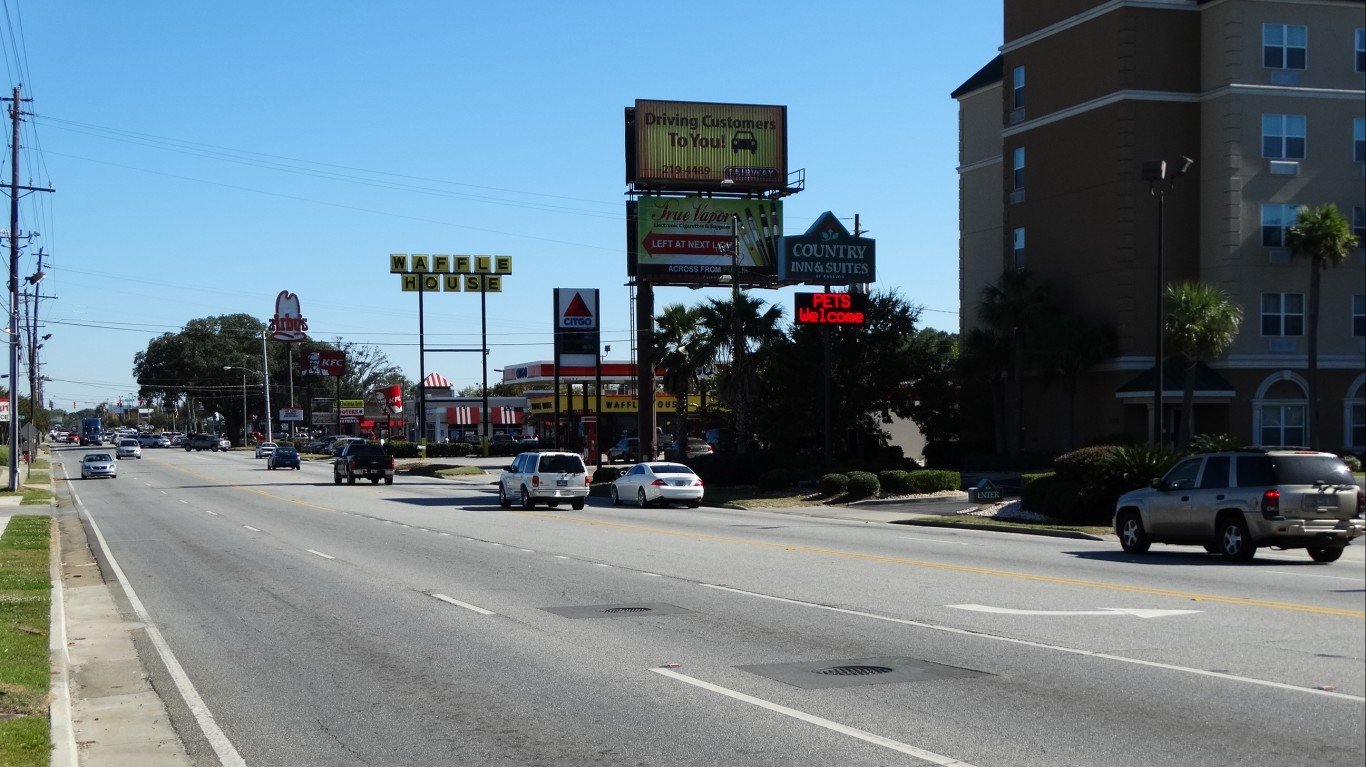
39. Valdosta, GA
> Households with SNAP benefits: 16.9% (9,187 total)
> Poverty rate: 20.9% — top 10% among metro areas
> Median household income: $43,787 — bottom 10% among metro areas
> June 2021 unemployment: 4.2% — middle 50% among metro areas
[recirclink id=931632]
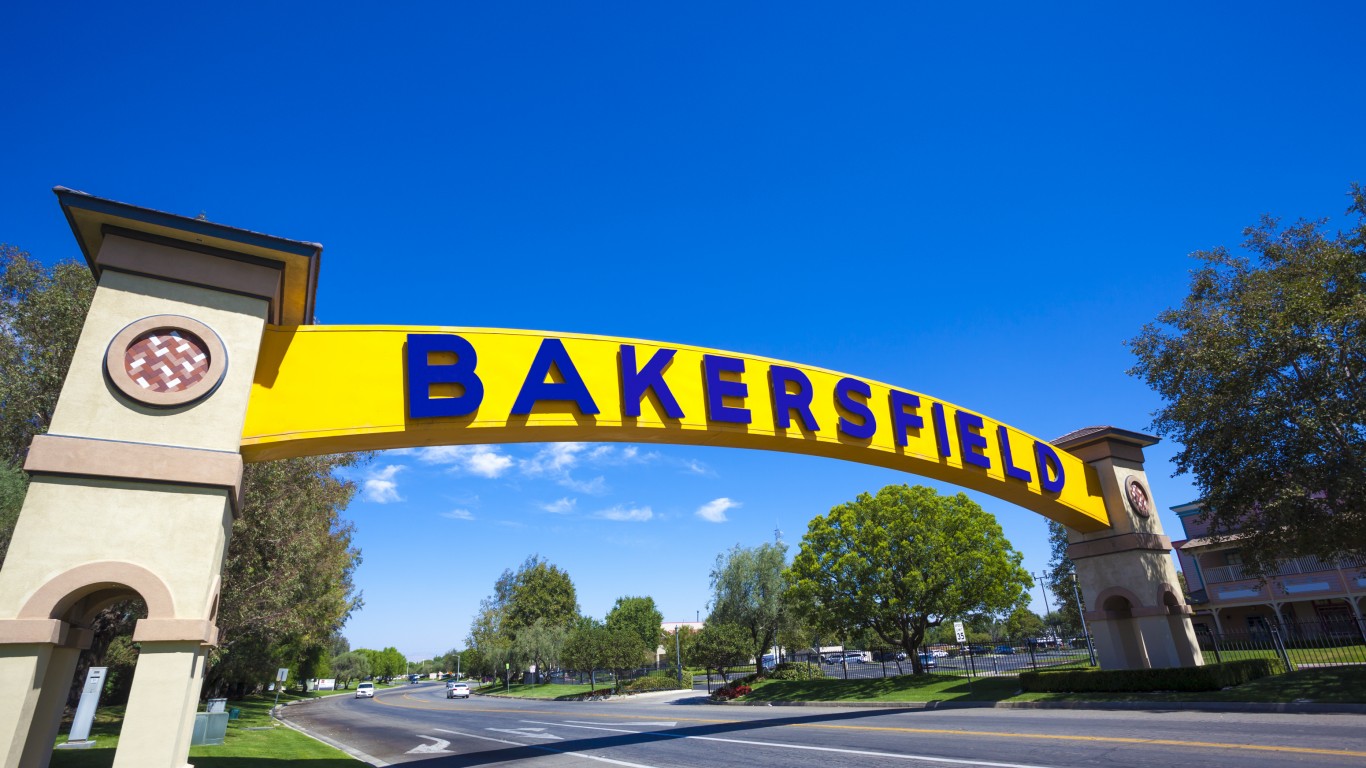
38. Bakersfield, CA
> Households with SNAP benefits: 16.9% (46,194 total)
> Poverty rate: 19.1% — top 10% among metro areas
> Median household income: $53,067 — middle 50% among metro areas
> June 2021 unemployment: 10.3% — top 10% among metro areas

37. Salem, OR
> Households with SNAP benefits: 16.9% (25,791 total)
> Poverty rate: 10.9% — middle 50% among metro areas
> Median household income: $65,689 — middle 50% among metro areas
> June 2021 unemployment: 5.5% — middle 50% among metro areas
[in-text-ad-2]
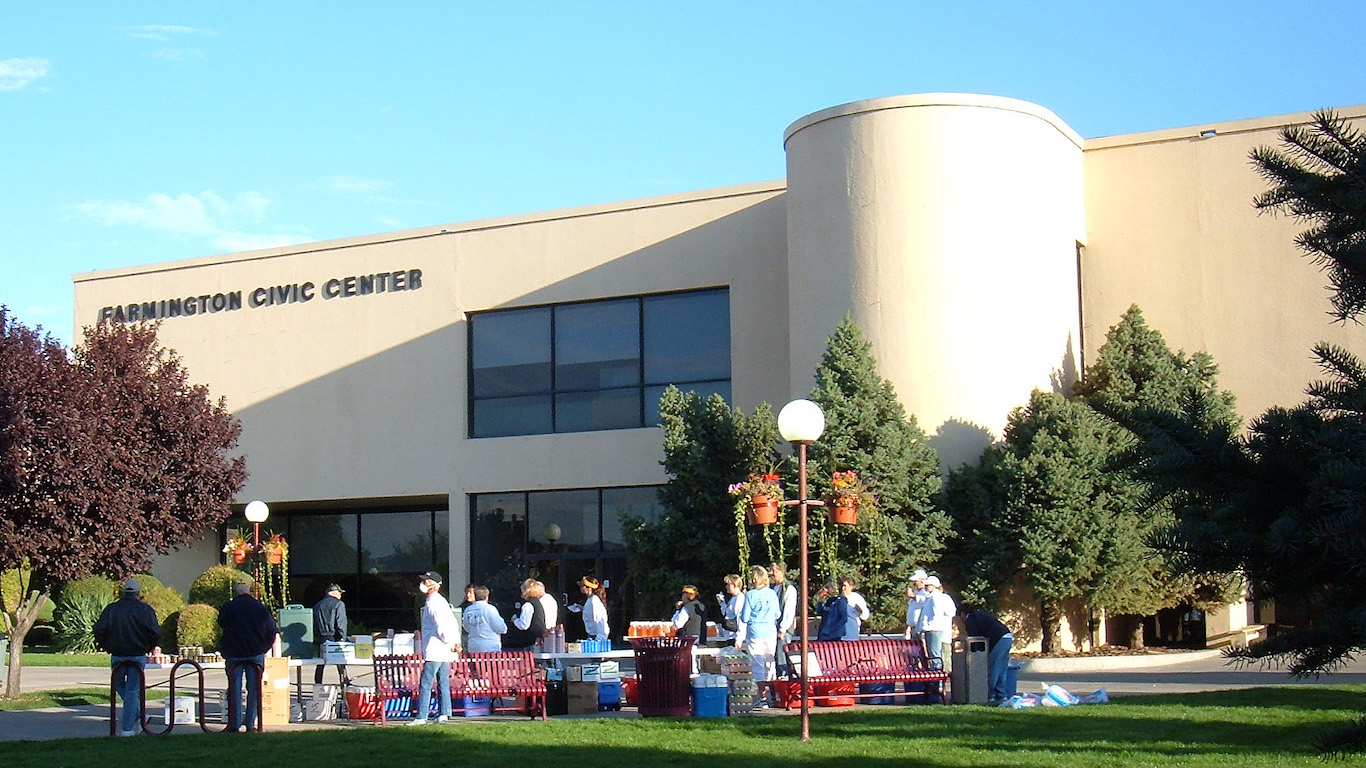
36. Farmington, NM
> Households with SNAP benefits: 17.2% (7,330 total)
> Poverty rate: 21.2% — top 10% among metro areas
> Median household income: $44,321 — bottom 10% among metro areas
> June 2021 unemployment: 9.5% — top 10% among metro areas

35. Rocky Mount, NC
> Households with SNAP benefits: 17.3% (10,119 total)
> Poverty rate: 17.2% — top 25% among metro areas
> Median household income: $46,466 — bottom 10% among metro areas
> June 2021 unemployment: 6.7% — top 25% among metro areas
[in-text-ad]
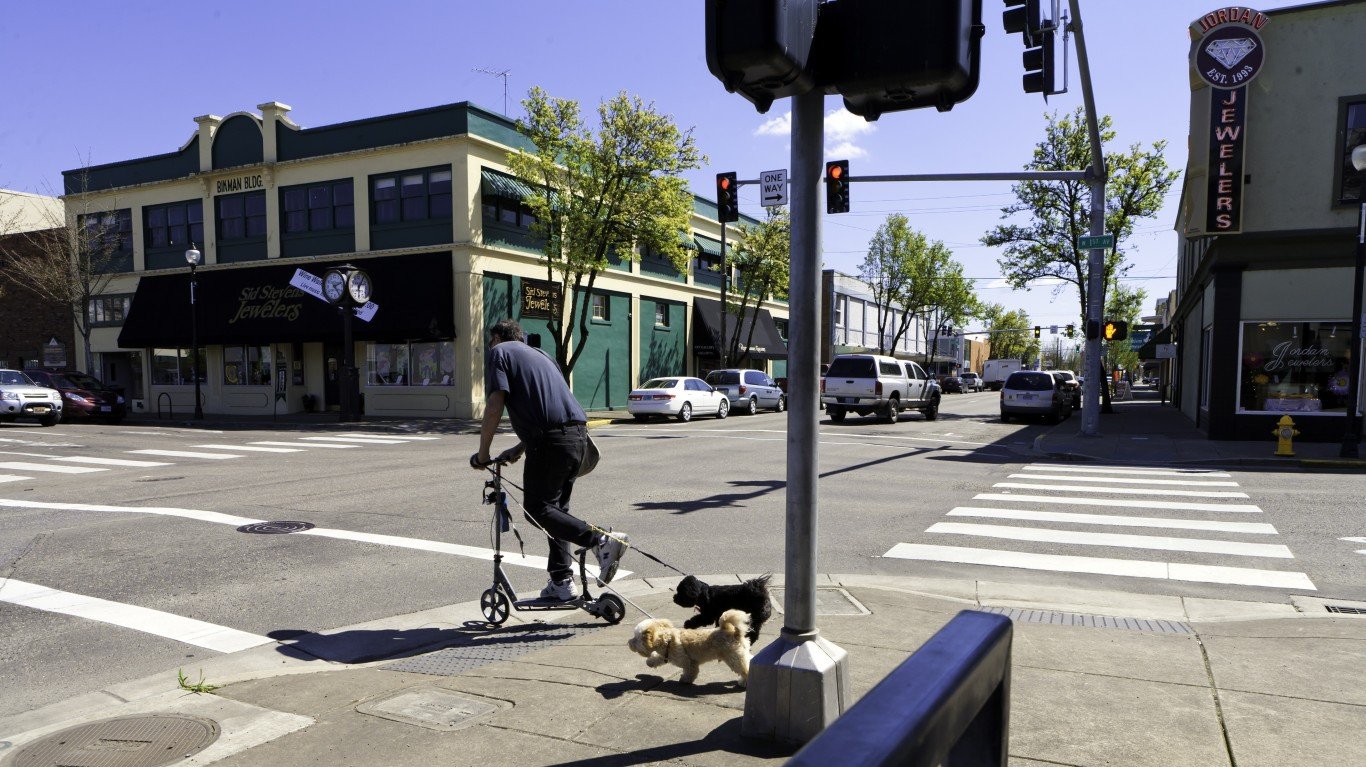
34. Albany, OR
> Households with SNAP benefits: 17.3% (8,560 total)
> Poverty rate: 13.3% — middle 50% among metro areas
> Median household income: $61,488 — middle 50% among metro areas
> June 2021 unemployment: 6.3% — middle 50% among metro areas
[recirclink id=924167]

33. Fresno, CA
> Households with SNAP benefits: 17.4% (55,077 total)
> Poverty rate: 20.6% — top 10% among metro areas
> Median household income: $57,518 — middle 50% among metro areas
> June 2021 unemployment: 9.6% — top 10% among metro areas

32. Scranton–Wilkes-Barre–Hazleton, PA
> Households with SNAP benefits: 17.4% (40,148 total)
> Poverty rate: 14.9% — middle 50% among metro areas
> Median household income: $54,304 — middle 50% among metro areas
> June 2021 unemployment: 7.3% — top 25% among metro areas
[in-text-ad-2]

31. Medford, OR
> Households with SNAP benefits: 17.5% (15,367 total)
> Poverty rate: 13.9% — middle 50% among metro areas
> Median household income: $56,450 — middle 50% among metro areas
> June 2021 unemployment: 6.0% — middle 50% among metro areas
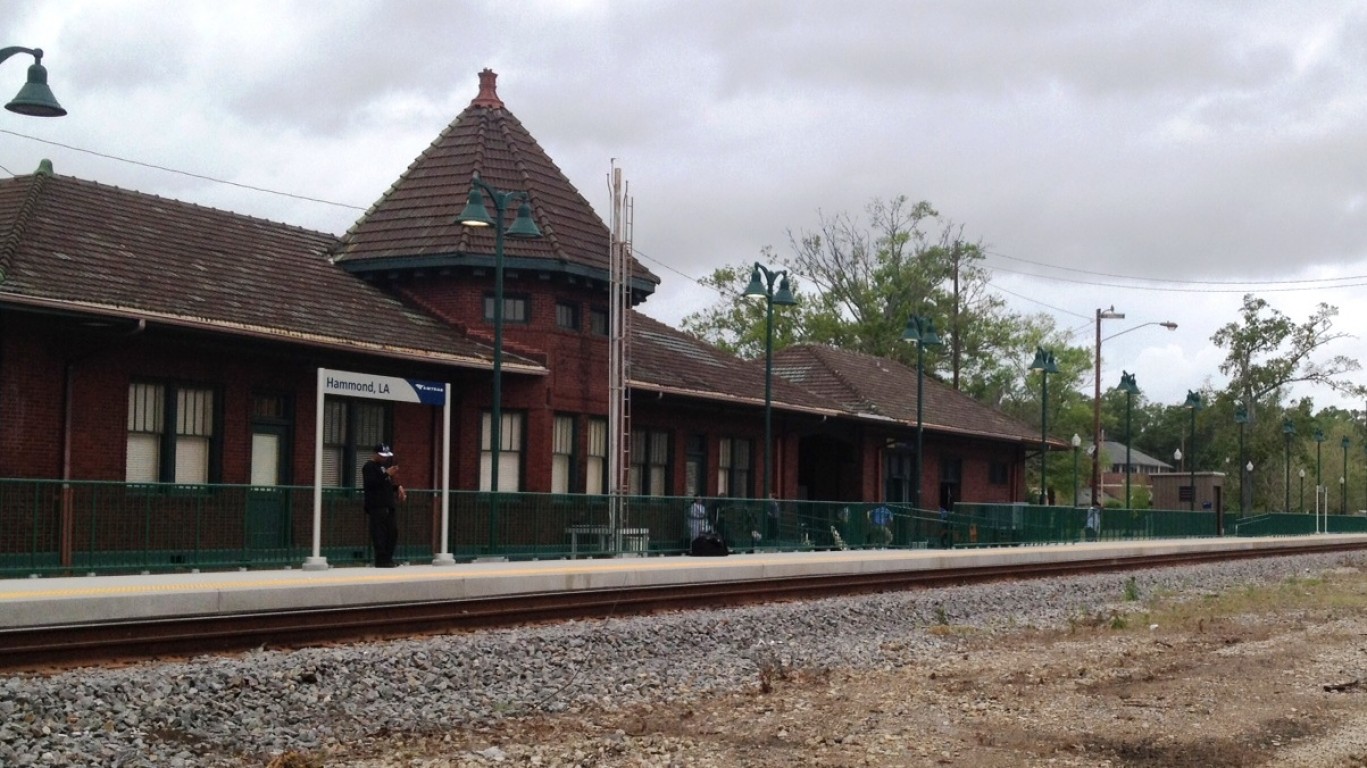
30. Hammond, LA
> Households with SNAP benefits: 17.6% (8,178 total)
> Poverty rate: 22.9% — top 10% among metro areas
> Median household income: $47,825 — bottom 10% among metro areas
> June 2021 unemployment: 7.8% — top 10% among metro areas
[in-text-ad]

29. Springfield, MA-CT
> Households with SNAP benefits: 17.6% (47,646 total)
> Poverty rate: 12.6% — middle 50% among metro areas
> Median household income: $62,346 — middle 50% among metro areas
> June 2021 unemployment: 6.2% — middle 50% among metro areas
[recirclink id=836401]

28. Alexandria, LA
> Households with SNAP benefits: 17.9% (9,965 total)
> Poverty rate: 17.6% — top 25% among metro areas
> Median household income: $50,553 — bottom 25% among metro areas
> June 2021 unemployment: 4.8% — middle 50% among metro areas

27. Danville, IL
> Households with SNAP benefits: 17.9% (5,588 total)
> Poverty rate: 16.5% — top 25% among metro areas
> Median household income: $43,111 — bottom 10% among metro areas
> June 2021 unemployment: 6.7% — top 25% among metro areas
[in-text-ad-2]

26. Charleston, WV
> Households with SNAP benefits: 18.0% (19,702 total)
> Poverty rate: 17.1% — top 25% among metro areas
> Median household income: $47,500 — bottom 10% among metro areas
> June 2021 unemployment: 5.9% — middle 50% among metro areas

25. Altoona, PA
> Households with SNAP benefits: 18.0% (9,461 total)
> Poverty rate: 15.6% — middle 50% among metro areas
> Median household income: $51,004 — bottom 25% among metro areas
> June 2021 unemployment: 5.6% — middle 50% among metro areas
[in-text-ad]

24. Longview, WA
> Households with SNAP benefits: 18.2% (7,809 total)
> Poverty rate: 12.2% — middle 50% among metro areas
> Median household income: $55,497 — middle 50% among metro areas
> June 2021 unemployment: 6.1% — middle 50% among metro areas
[recirclink id=874024]

23. Pueblo, CO
> Households with SNAP benefits: 18.3% (12,080 total)
> Poverty rate: 17.9% — top 25% among metro areas
> Median household income: $51,276 — bottom 25% among metro areas
> June 2021 unemployment: 8.5% — top 10% among metro areas

22. Yuma, AZ
> Households with SNAP benefits: 18.4% (13,589 total)
> Poverty rate: 21.4% — top 10% among metro areas
> Median household income: $46,419 — bottom 10% among metro areas
> June 2021 unemployment: 15.5% — top 10% among metro areas
[in-text-ad-2]

21. Merced, CA
> Households with SNAP benefits: 18.5% (14,889 total)
> Poverty rate: 16.8% — top 25% among metro areas
> Median household income: $61,167 — middle 50% among metro areas
> June 2021 unemployment: 10.1% — top 10% among metro areas

20. Erie, PA
> Households with SNAP benefits: 18.7% (20,540 total)
> Poverty rate: 17.4% — top 25% among metro areas
> Median household income: $51,818 — bottom 25% among metro areas
> June 2021 unemployment: 7.1% — top 25% among metro areas
[in-text-ad]

19. Watertown-Fort Drum, NY
> Households with SNAP benefits: 19.0% (7,814 total)
> Poverty rate: 15.5% — middle 50% among metro areas
> Median household income: $53,917 — middle 50% among metro areas
> June 2021 unemployment: 5.6% — middle 50% among metro areas
[recirclink id=931632]

18. Parkersburg-Vienna, WV
> Households with SNAP benefits: 19.0% (7,005 total)
> Poverty rate: 14.6% — middle 50% among metro areas
> Median household income: $48,680 — bottom 25% among metro areas
> June 2021 unemployment: 6.0% — middle 50% among metro areas
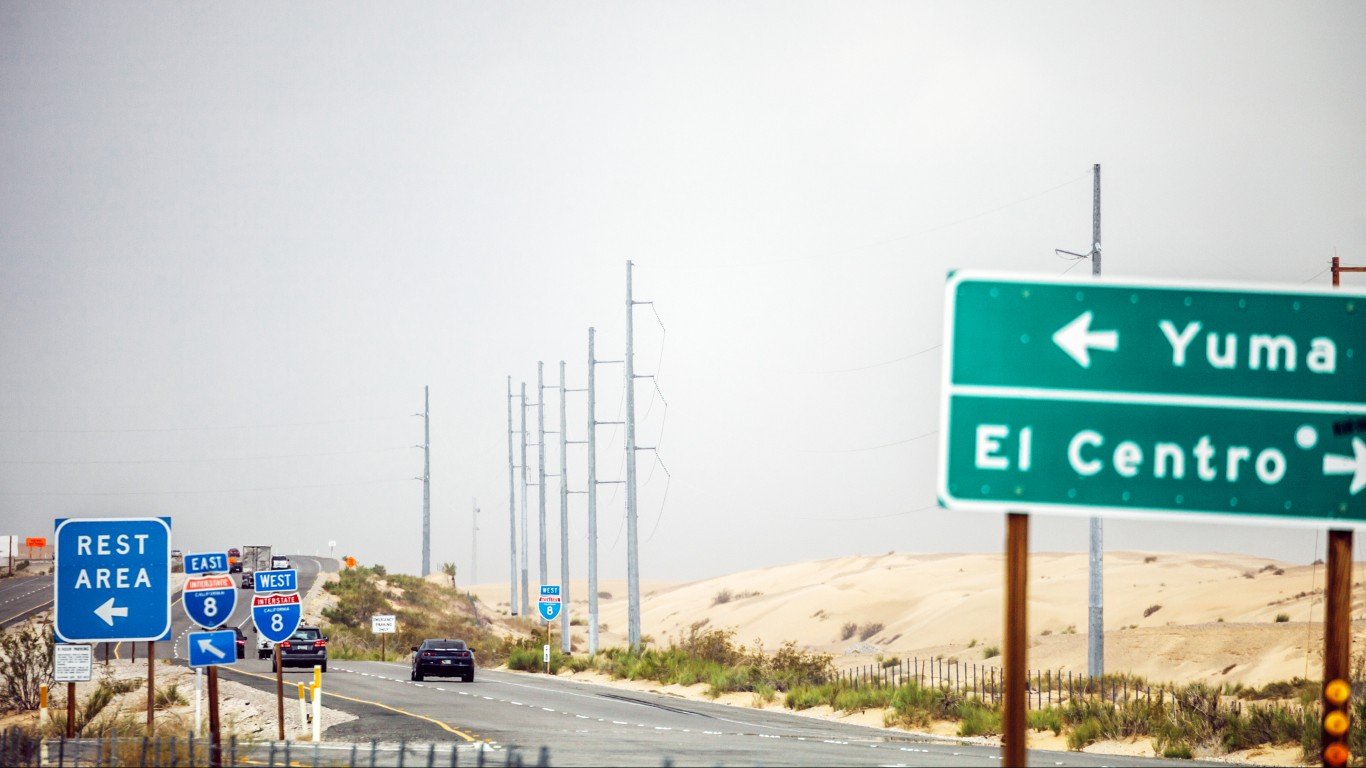
17. El Centro, CA
> Households with SNAP benefits: 19.4% (9,347 total)
> Poverty rate: 25.1% — top 10% among metro areas
> Median household income: $48,472 — bottom 10% among metro areas
> June 2021 unemployment: 17.6% — top 10% among metro areas
[in-text-ad-2]

16. Yakima, WA
> Households with SNAP benefits: 19.6% (16,476 total)
> Poverty rate: 16.9% — top 25% among metro areas
> Median household income: $56,233 — middle 50% among metro areas
> June 2021 unemployment: 7.2% — top 25% among metro areas

15. Saginaw, MI
> Households with SNAP benefits: 19.7% (15,557 total)
> Poverty rate: 19.0% — top 10% among metro areas
> Median household income: $48,303 — bottom 10% among metro areas
> June 2021 unemployment: 6.6% — top 25% among metro areas
[in-text-ad]

14. Madera, CA
> Households with SNAP benefits: 19.8% (8,797 total)
> Poverty rate: 17.6% — top 25% among metro areas
> Median household income: $64,827 — middle 50% among metro areas
> June 2021 unemployment: 8.7% — top 10% among metro areas
[recirclink id=924167]
13. Johnstown, PA
> Households with SNAP benefits: 19.9% (11,238 total)
> Poverty rate: 15.3% — middle 50% among metro areas
> Median household income: $49,076 — bottom 25% among metro areas
> June 2021 unemployment: 7.3% — top 25% among metro areas

12. Flint, MI
> Households with SNAP benefits: 20.3% (34,292 total)
> Poverty rate: 16.5% — top 25% among metro areas
> Median household income: $50,389 — bottom 25% among metro areas
> June 2021 unemployment: 7.2% — top 25% among metro areas
[in-text-ad-2]

11. Monroe, LA
> Households with SNAP benefits: 20.9% (16,145 total)
> Poverty rate: 26.0% — top 10% among metro areas
> Median household income: $40,136 — bottom 10% among metro areas
> June 2021 unemployment: 6.2% — middle 50% among metro areas

10. Albany, GA
> Households with SNAP benefits: 21.2% (11,476 total)
> Poverty rate: 22.6% — top 10% among metro areas
> Median household income: $40,625 — bottom 10% among metro areas
> June 2021 unemployment: 5.6% — middle 50% among metro areas
[in-text-ad]

9. Laredo, TX
> Households with SNAP benefits: 21.8% (16,615 total)
> Poverty rate: 20.5% — top 10% among metro areas
> Median household income: $56,084 — middle 50% among metro areas
> June 2021 unemployment: 7.4% — top 25% among metro areas
[recirclink id=836401]

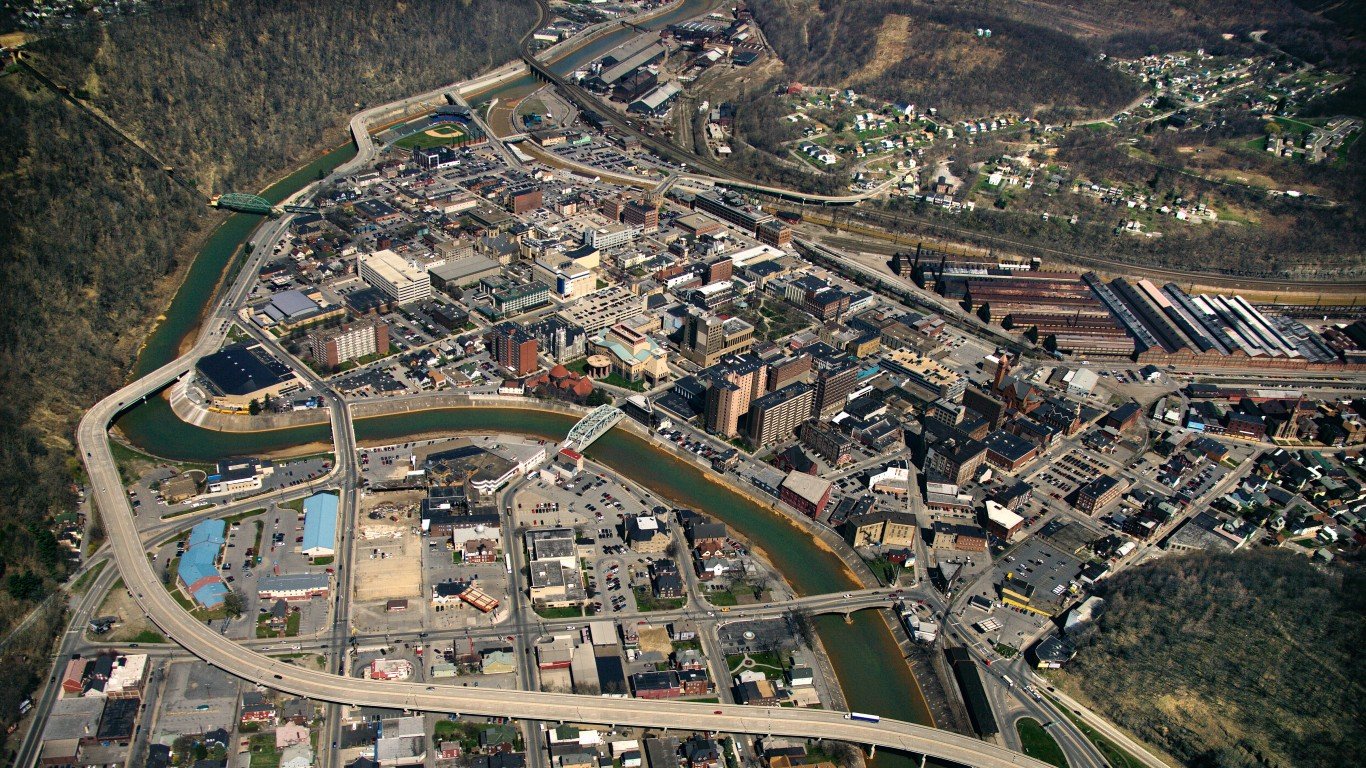
8. Cumberland, MD-WV
> Households with SNAP benefits: 21.8% (7,958 total)
> Poverty rate: 13.9% — middle 50% among metro areas
> Median household income: $49,729 — bottom 25% among metro areas
> June 2021 unemployment: 6.1% — middle 50% among metro areas

7. Beckley, WV
> Households with SNAP benefits: 22.0% (10,789 total)
> Poverty rate: 17.9% — top 25% among metro areas
> Median household income: $44,785 — bottom 10% among metro areas
> June 2021 unemployment: 6.0% — middle 50% among metro areas
[in-text-ad-2]

6. El Paso, TX
> Households with SNAP benefits: 22.3% (60,116 total)
> Poverty rate: 18.7% — top 10% among metro areas
> Median household income: $48,823 — bottom 25% among metro areas
> June 2021 unemployment: 7.2% — top 25% among metro areas

5. Visalia-Porterville, CA
> Households with SNAP benefits: 22.3% (32,116 total)
> Poverty rate: 18.8% — top 10% among metro areas
> Median household income: $57,692 — middle 50% among metro areas
> June 2021 unemployment: 11.4% — top 10% among metro areas
[in-text-ad]
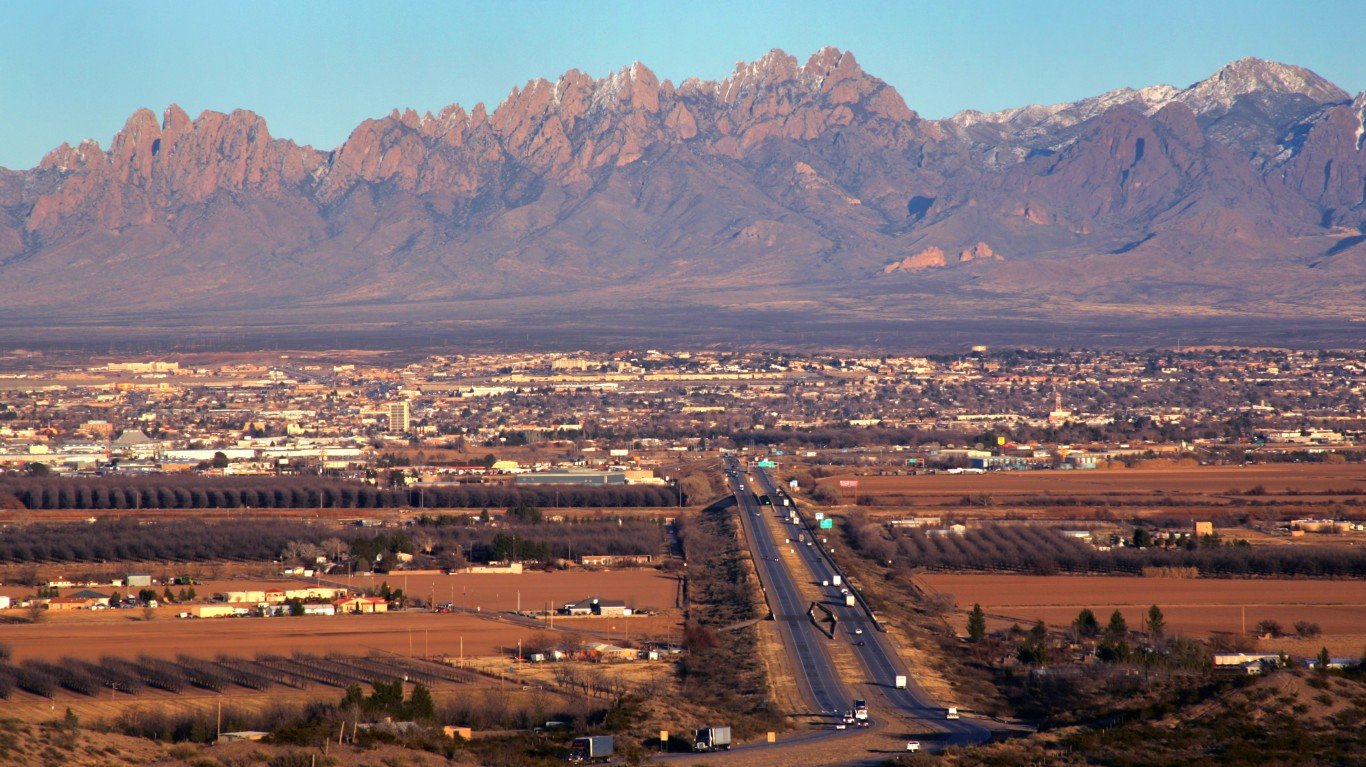
4. Las Cruces, NM
> Households with SNAP benefits: 22.9% (18,144 total)
> Poverty rate: 25.9% — top 10% among metro areas
> Median household income: $43,038 — bottom 10% among metro areas
> June 2021 unemployment: 7.6% — top 25% among metro areas
[recirclink id=874024]

3. Grants Pass, OR
> Households with SNAP benefits: 23.7% (8,327 total)
> Poverty rate: 15.7% — middle 50% among metro areas
> Median household income: $47,573 — bottom 10% among metro areas
> June 2021 unemployment: 6.5% — top 25% among metro areas

2. Brownsville-Harlingen, TX
> Households with SNAP benefits: 26.3% (33,977 total)
> Poverty rate: 25.6% — top 10% among metro areas
> Median household income: $41,123 — bottom 10% among metro areas
> June 2021 unemployment: 9.6% — top 10% among metro areas
[in-text-ad-2]
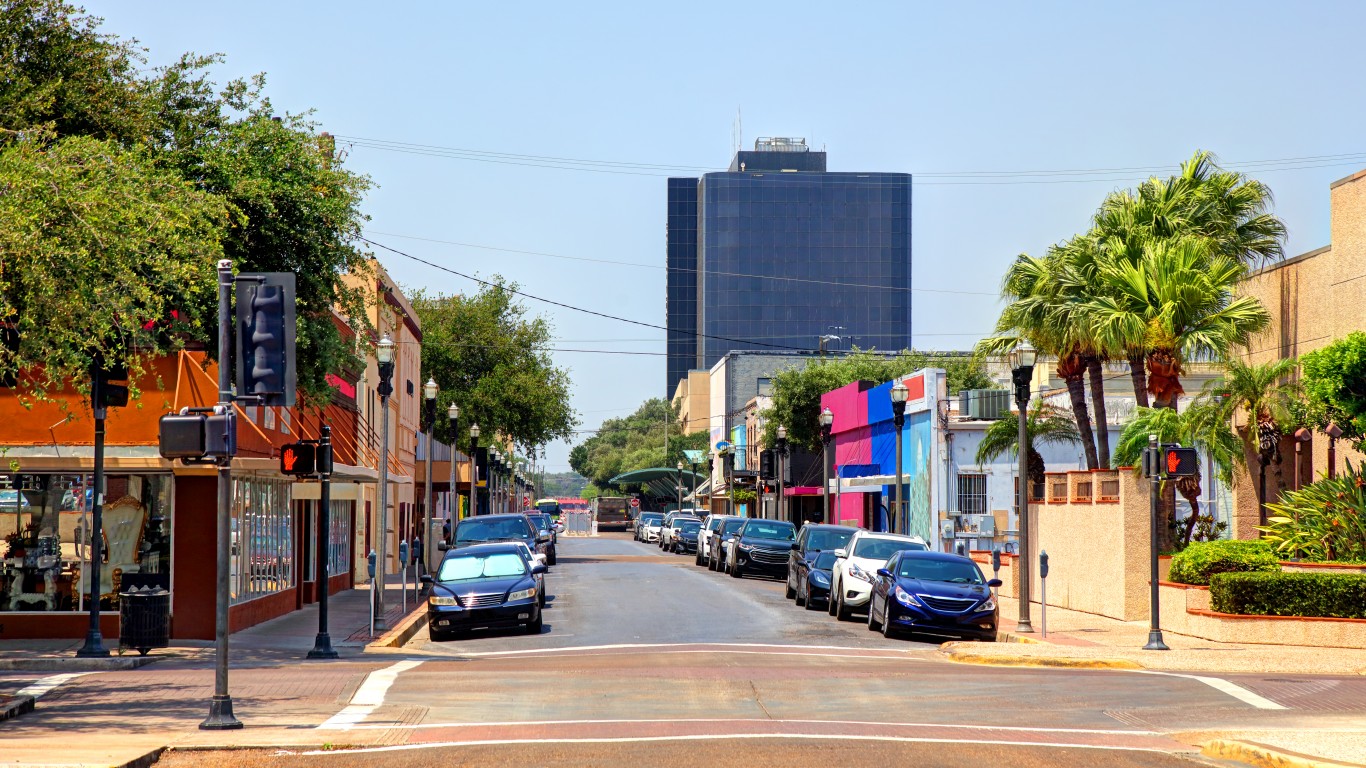
1. McAllen-Edinburg-Mission, TX
> Households with SNAP benefits: 27.1% (67,098 total)
> Poverty rate: 27.3% — top 10% among metro areas
> Median household income: $41,800 — bottom 10% among metro areas
> June 2021 unemployment: 10.5% — top 10% among metro areas
Methodology
To determine the cities with the most people on food stamps, 24/7 Wall St. reviewed data on food stamp recipiency rates from the U.S. Census Bureau’s 2019 American Community Survey. Metropolitan areas were ranked based on the percentage of households receiving Supplemental Nutrition Assistance Program (SNAP) benefits. Supplemental data on poverty rate and median household income also came from the 2019 ACS. Data on unemployment for June 2021 came from the Bureau of Labor Statistics and is seasonally adjusted.
Contact [email protected] for any questions or corrections.