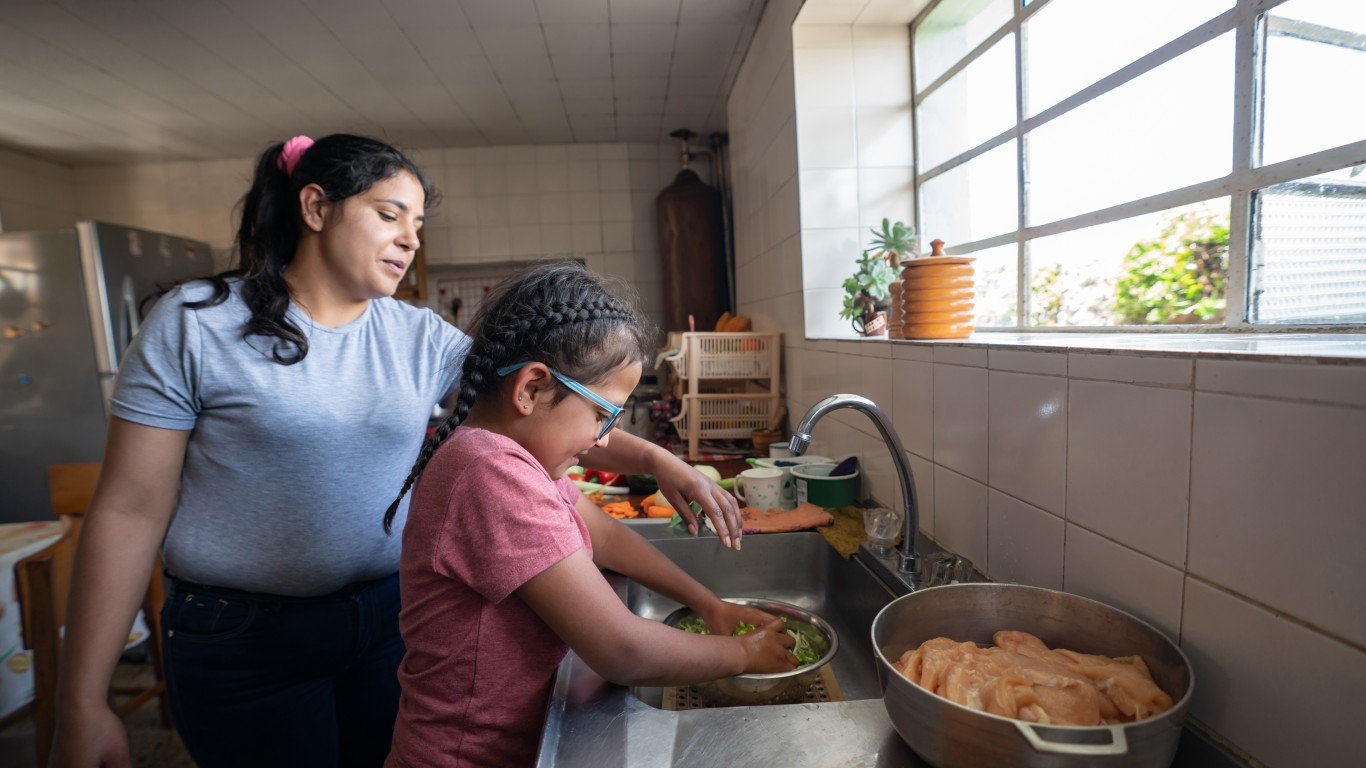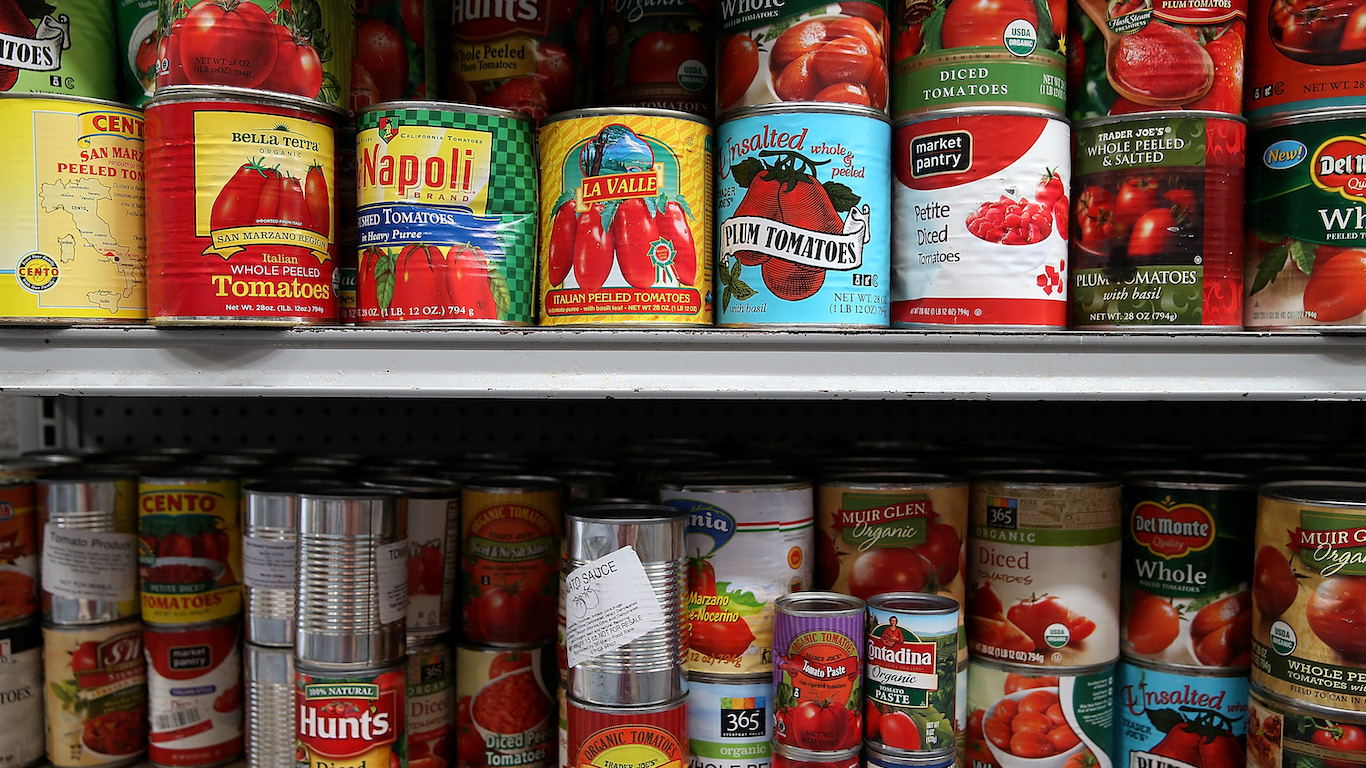
The U.S. is in a period of historic inflation, and rising food prices are a leading driver. At grocery stores across the country, food prices are about 10% higher than they were a year ago, and consumers are feeling the squeeze. An estimated 23.7 million American adults – or 9% of the 18 and older population – recently reported not having enough to eat, either often or some of the time, according to the Census Bureau’s Household Pulse Survey.
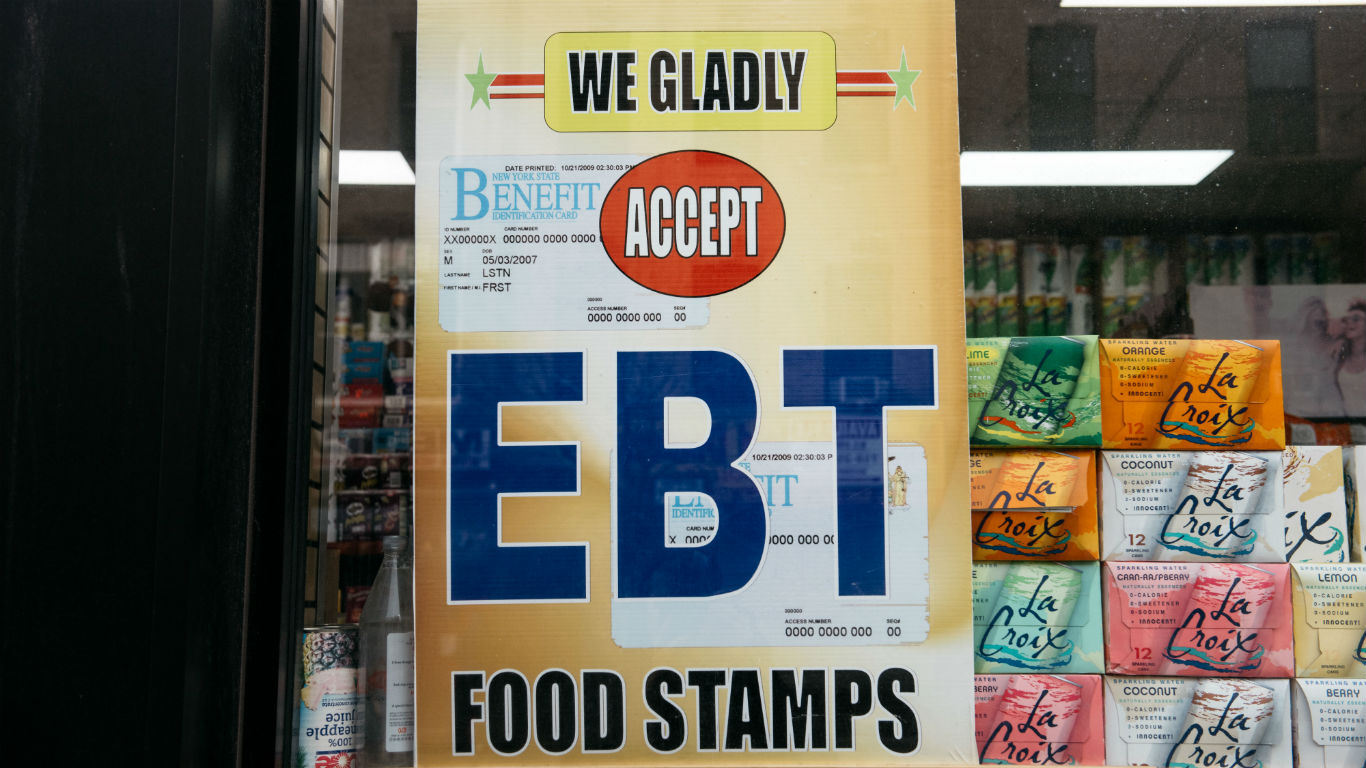
Food insecurity and hunger are not new problems in the United States. In 1964, President Lyndon Johnson established the Food Stamp Program to help struggling families put food on the table. Now known as the Supplemental Nutrition Assistance Program, or SNAP, the program provides families who meet certain criteria, largely income based, with financial assistance to buy groceries. Here is a look at the city in every state where families pay the most for food.
Today, SNAP is an $83.8 billion program that helps an estimated 14.8 million American households.
Using five-year estimates from the U.S. Census Bureau’s 2020 American Community Survey, 24/7 Wall St. identified the cities with the most people on food stamps. We ranked all metropolitan statistical areas by the share of households receiving SNAP benefits.
Among the metro areas on this list, SNAP recipiency rates range from 16.5% to over 28%. For context, 12.1% of U.S. households receive SNAP benefits.
The populations’ widespread reliance on government assistance in the metro areas on this list is closely connected to low incomes and financial hardship in these metros. In the vast majority of these cities, the median household income is below the $64,994 national median, and the share of the population living below the poverty line exceeds the 12.8% national poverty rate. Here is a look at the income a family needs to cover normal living expenses in every state.
Click here to see cities with the most people on food stamps
Click here to see our detailed methodology
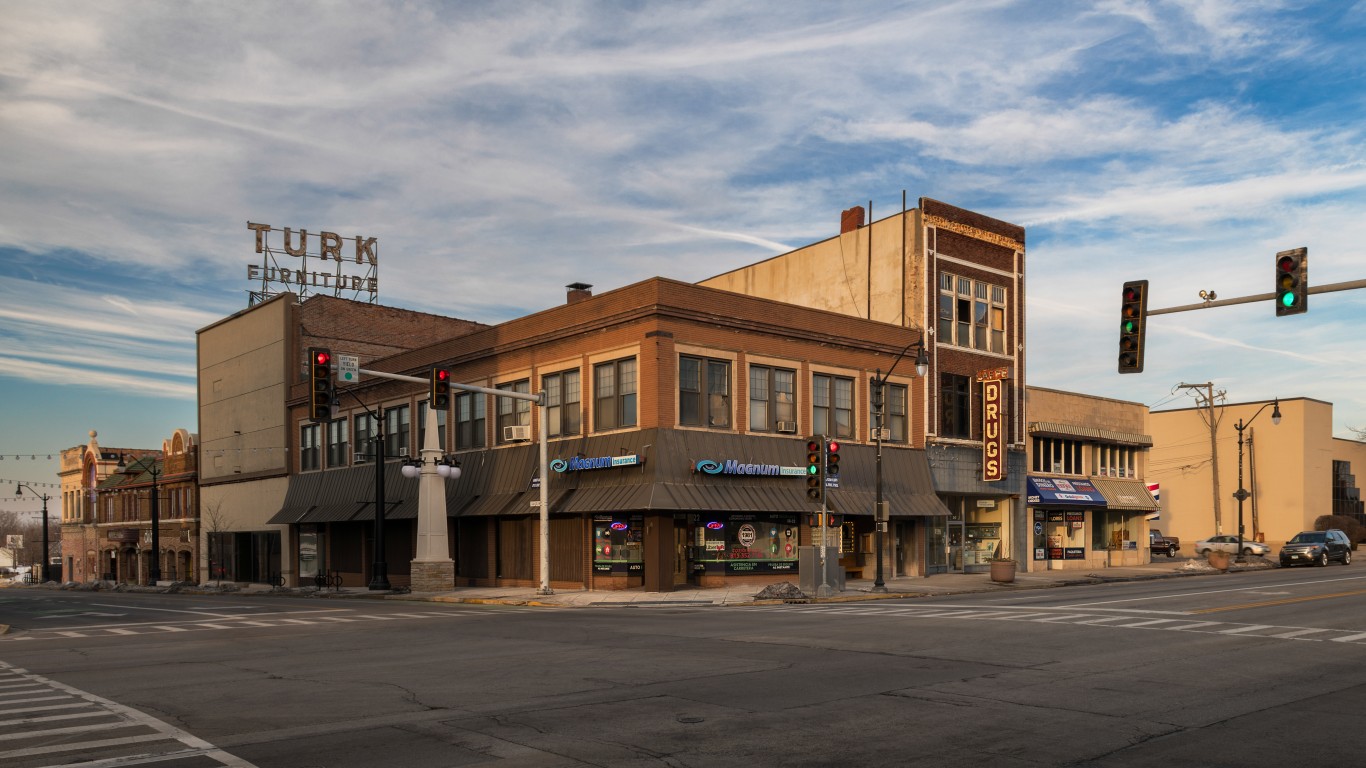
50. Kankakee, IL
> Households with SNAP benefits: 16.5% (6,643 total)
> Poverty rate: 13.0% – bottom 25% among metro areas
> Median household income: $51,261 – middle 50% among metro areas
> February 2022 unemployment: 5.4% – middle 50% among metro areas
[in-text-ad]

49. Altoona, PA
> Households with SNAP benefits: 16.6% (8,596 total)
> Poverty rate: 13.8% – bottom 25% among metro areas
> Median household income: $59,547 – middle 50% among metro areas
> February 2022 unemployment: 4.6% – middle 50% among metro areas
[recirclink id=1023708]

48. Corpus Christi, TX
> Households with SNAP benefits: 16.7% (25,685 total)
> Poverty rate: 16.0% – middle 50% among metro areas
> Median household income: $48,945 – bottom 25% among metro areas
> February 2022 unemployment: 6.1% – middle 50% among metro areas

47. Miami-Fort Lauderdale-Pompano Beach, FL
> Households with SNAP benefits: 16.7% (363,043 total)
> Poverty rate: 13.9% – bottom 25% among metro areas
> Median household income: $49,256 – middle 50% among metro areas
> February 2022 unemployment: 3.5% – bottom 25% among metro areas
[in-text-ad-2]

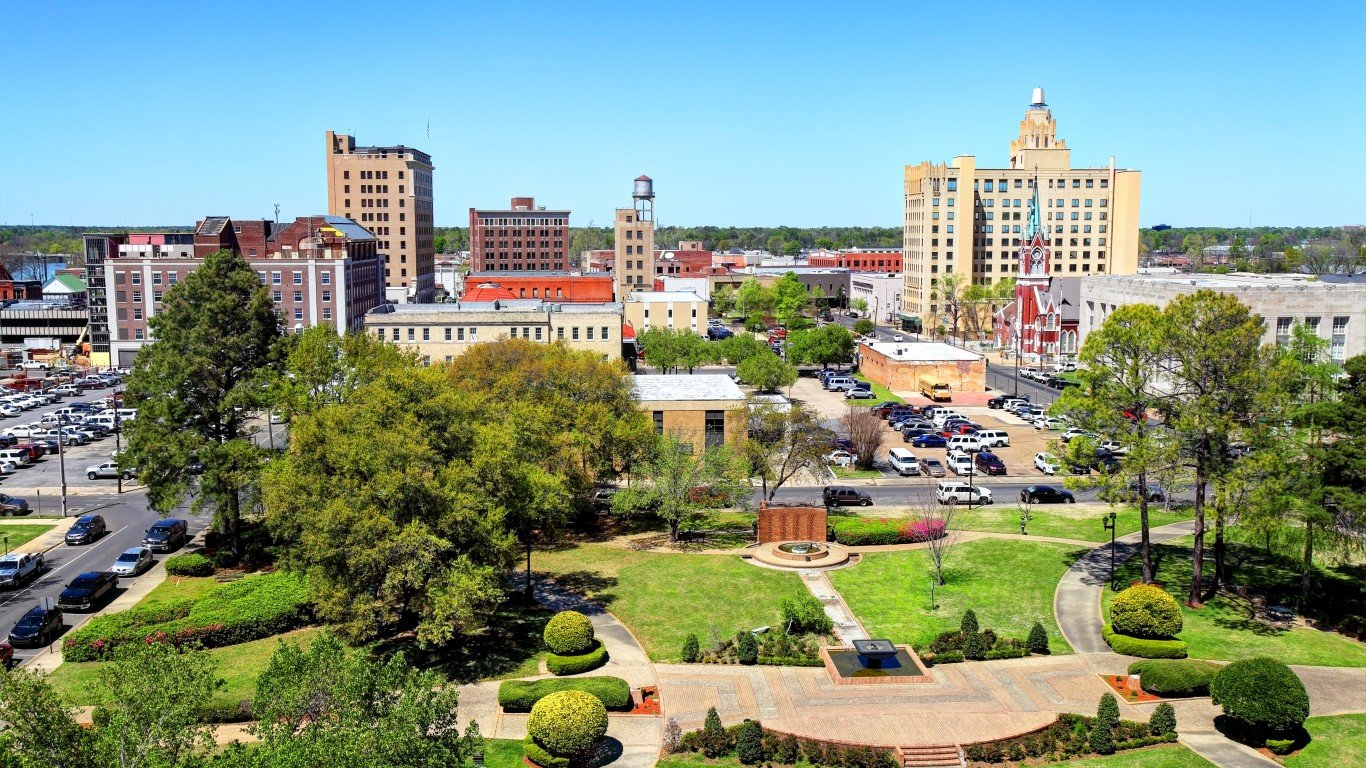
46. Pine Bluff, AR
> Households with SNAP benefits: 16.9% (5,634 total)
> Poverty rate: 20.0% – middle 50% among metro areas
> Median household income: $72,458 – top 25% among metro areas
> February 2022 unemployment: 4.9% – middle 50% among metro areas
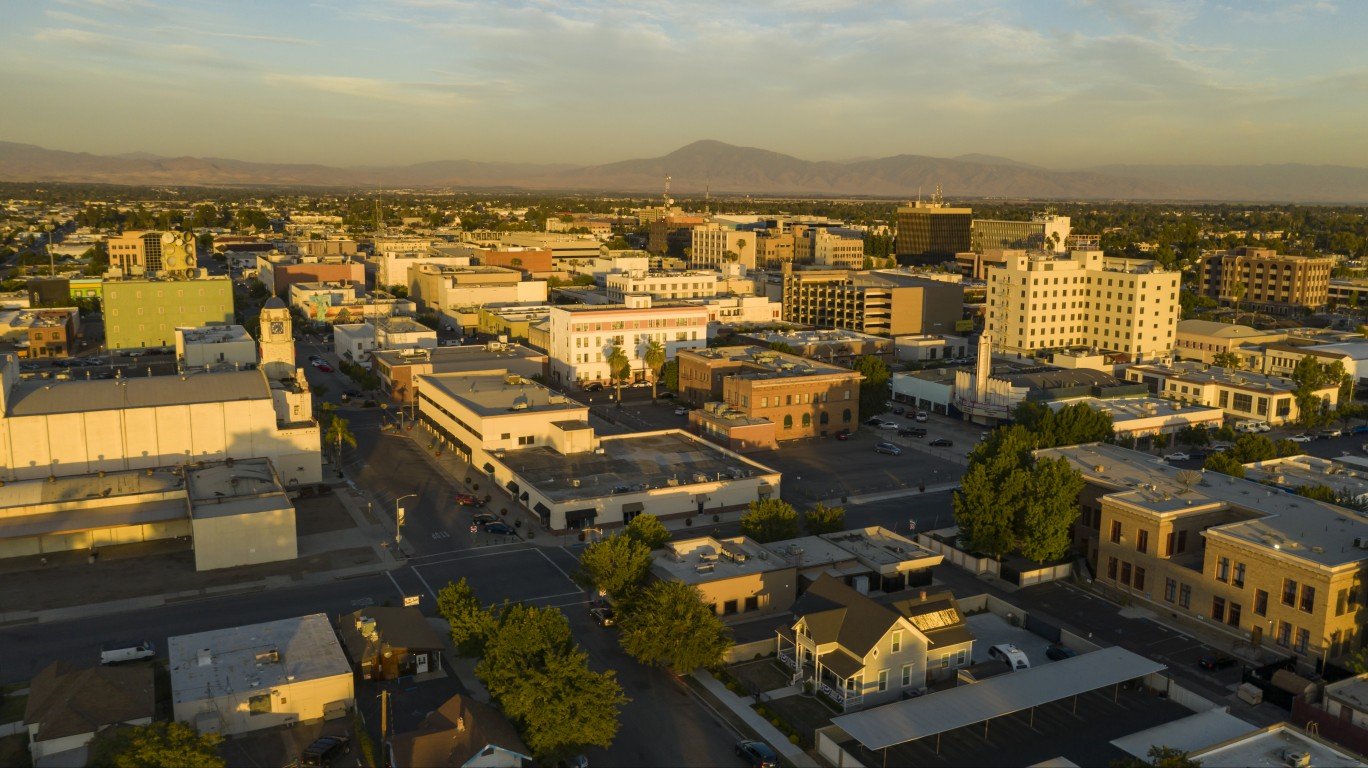
45. Bakersfield, CA
> Households with SNAP benefits: 17.0% (46,597 total)
> Poverty rate: 20.4% – middle 50% among metro areas
> Median household income: $56,055 – middle 50% among metro areas
> February 2022 unemployment: 8.3% – top 25% among metro areas
[in-text-ad]

44. Huntington-Ashland, WV-KY-OH
> Households with SNAP benefits: 17.0% (24,012 total)
> Poverty rate: 18.6% – middle 50% among metro areas
> Median household income: $74,621 – top 25% among metro areas
> February 2022 unemployment: 3.9% – middle 50% among metro areas
[recirclink id=1092222]

43. Rockford, IL
> Households with SNAP benefits: 17.0% (22,858 total)
> Poverty rate: 14.6% – bottom 25% among metro areas
> Median household income: $51,909 – middle 50% among metro areas
> February 2022 unemployment: 7.1% – top 25% among metro areas

42. Florence, SC
> Households with SNAP benefits: 17.1% (13,501 total)
> Poverty rate: 18.7% – middle 50% among metro areas
> Median household income: $53,541 – middle 50% among metro areas
> February 2022 unemployment: 3.6% – bottom 25% among metro areas
[in-text-ad-2]
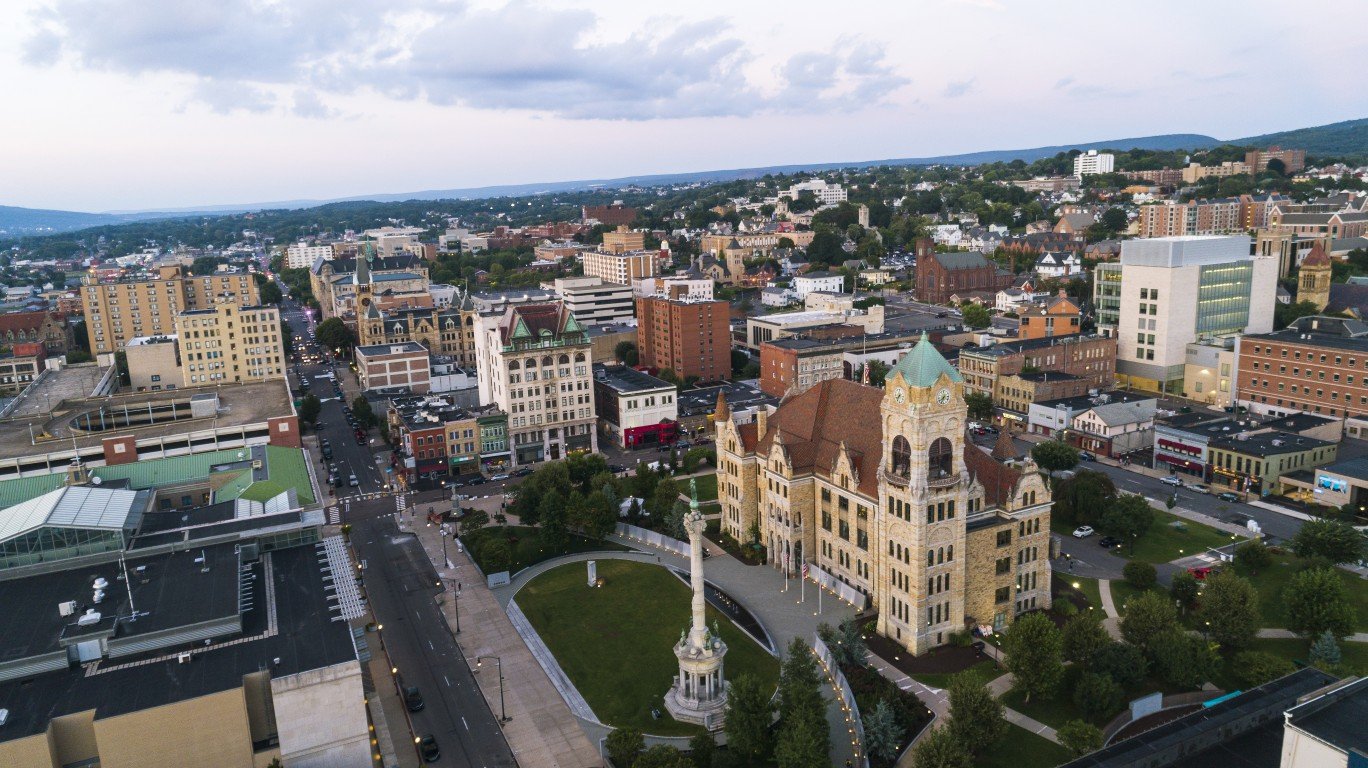
41. Scranton-Wilkes-Barre, PA
> Households with SNAP benefits: 17.1% (39,076 total)
> Poverty rate: 14.1% – bottom 25% among metro areas
> Median household income: $76,735 – top 25% among metro areas
> February 2022 unemployment: 5.9% – middle 50% among metro areas

40. Medford, OR
> Households with SNAP benefits: 17.1% (15,342 total)
> Poverty rate: 13.7% – bottom 25% among metro areas
> Median household income: $53,339 – middle 50% among metro areas
> February 2022 unemployment: 4.2% – middle 50% among metro areas
[in-text-ad]

39. Macon-Bibb County, GA
> Households with SNAP benefits: 17.2% (14,925 total)
> Poverty rate: 21.4% – top 25% among metro areas
> Median household income: $61,756 – top 25% among metro areas
> February 2022 unemployment: 3.1% – bottom 25% among metro areas
[recirclink id=1097193]

38. Charleston, WV
> Households with SNAP benefits: 17.2% (18,955 total)
> Poverty rate: 18.1% – middle 50% among metro areas
> Median household income: $64,862 – top 25% among metro areas
> February 2022 unemployment: 3.7% – bottom 25% among metro areas

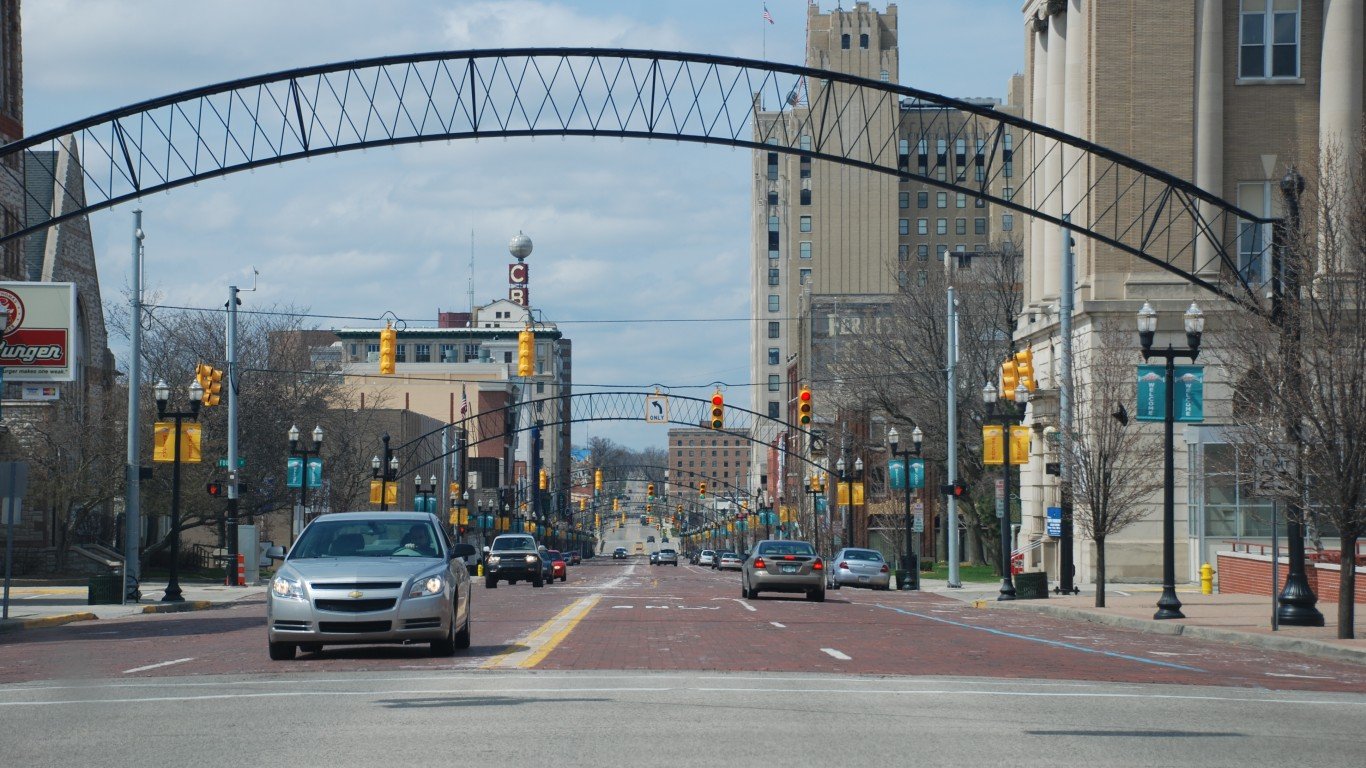
37. Decatur, IL
> Households with SNAP benefits: 17.2% (7,550 total)
> Poverty rate: 15.2% – middle 50% among metro areas
> Median household income: $52,226 – middle 50% among metro areas
> February 2022 unemployment: 6.5% – middle 50% among metro areas
[in-text-ad-2]
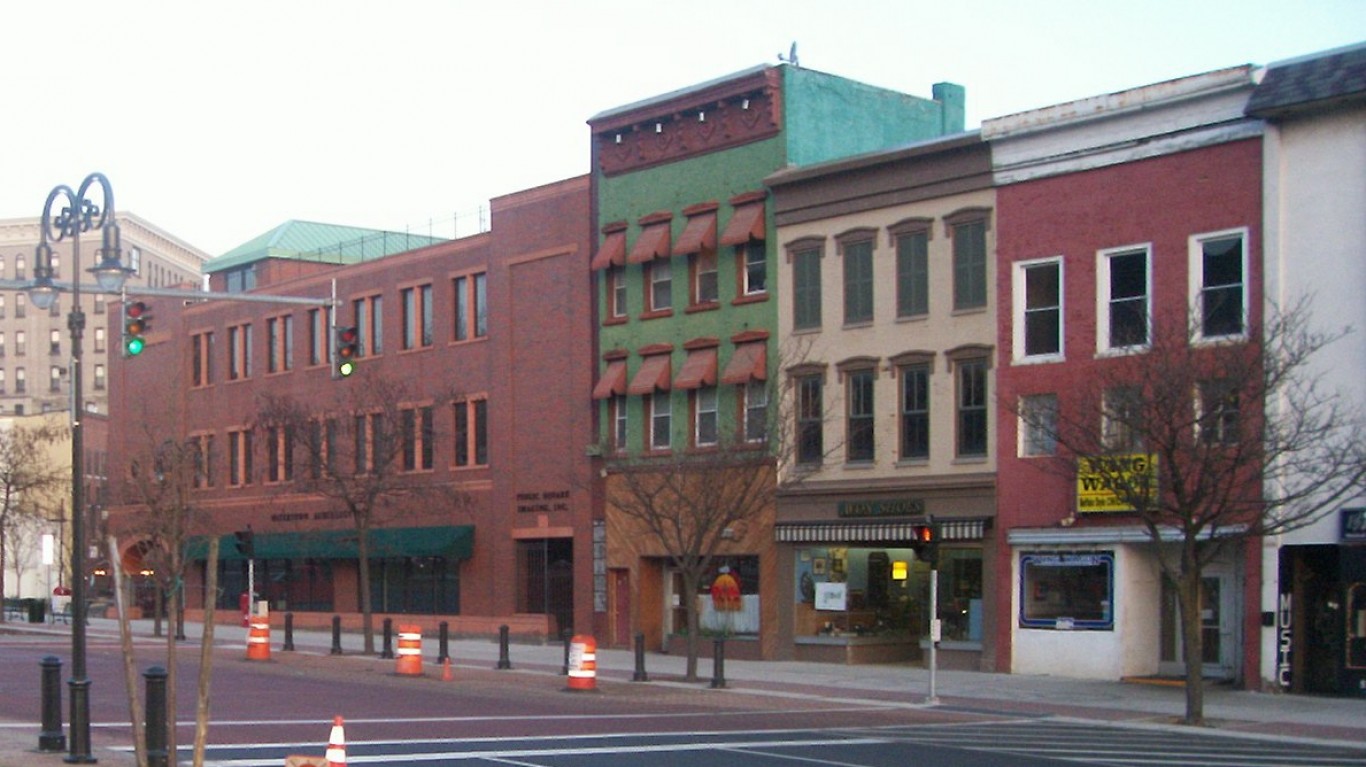
36. Watertown-Fort Drum, NY
> Households with SNAP benefits: 17.2% (7,404 total)
> Poverty rate: 14.4% – bottom 25% among metro areas
> Median household income: $57,791 – middle 50% among metro areas
> February 2022 unemployment: 3.8% – bottom 25% among metro areas

35. Valdosta, GA
> Households with SNAP benefits: 17.3% (9,443 total)
> Poverty rate: 23.1% – top 25% among metro areas
> Median household income: $45,558 – bottom 25% among metro areas
> February 2022 unemployment: 2.7% – bottom 25% among metro areas
[in-text-ad]
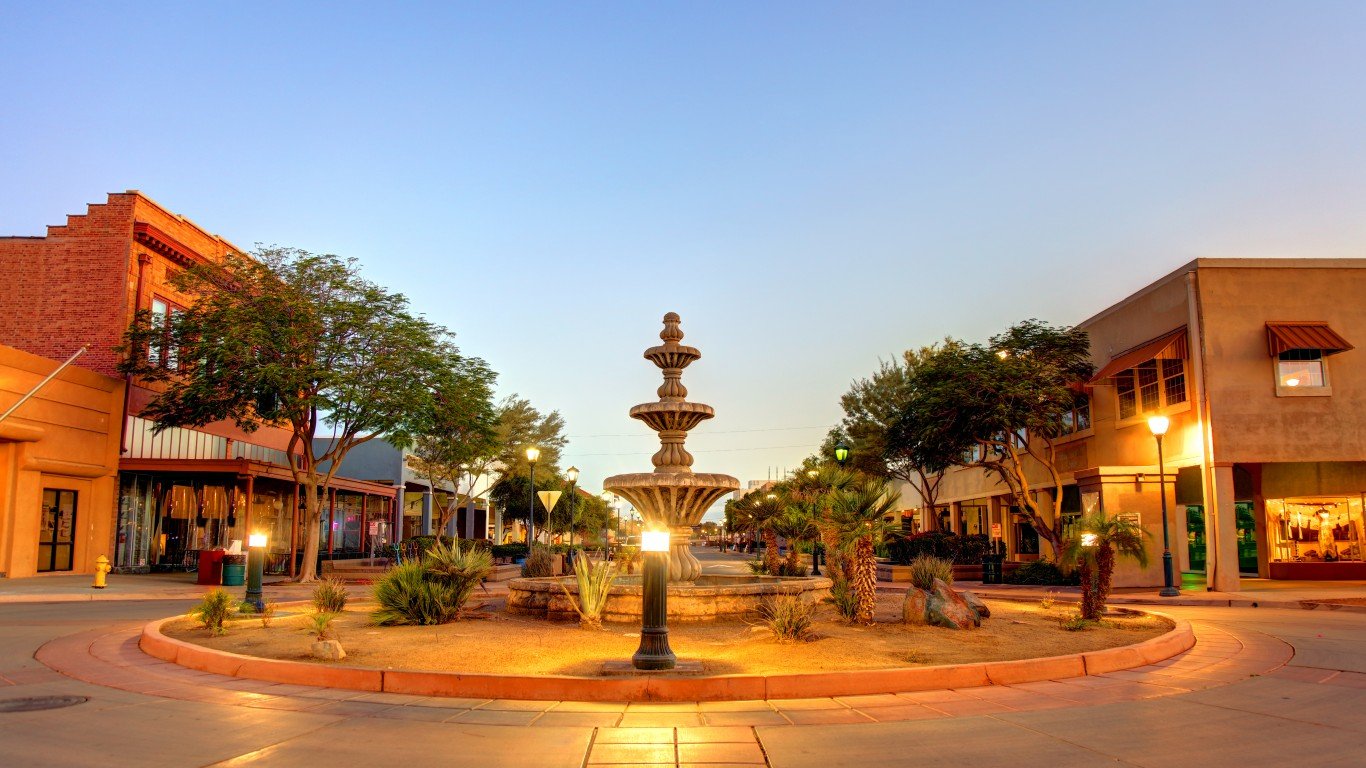
34. Yuma, AZ
> Households with SNAP benefits: 17.3% (12,900 total)
> Poverty rate: 18.2% – middle 50% among metro areas
> Median household income: $54,286 – middle 50% among metro areas
> February 2022 unemployment:13.8% – top 25% among metro areas
[recirclink id=1100321]

33. Lewiston-Auburn, ME
> Households with SNAP benefits: 17.3% (7,947 total)
> Poverty rate: 11.3% – bottom 25% among metro areas
> Median household income: $56,408 – middle 50% among metro areas
> February 2022 unemployment: N/A

32. Erie, PA
> Households with SNAP benefits: 17.5% (19,334 total)
> Poverty rate: 15.5% – middle 50% among metro areas
> Median household income: $78,969 – top 25% among metro areas
> February 2022 unemployment: 5.7% – middle 50% among metro areas
[in-text-ad-2]
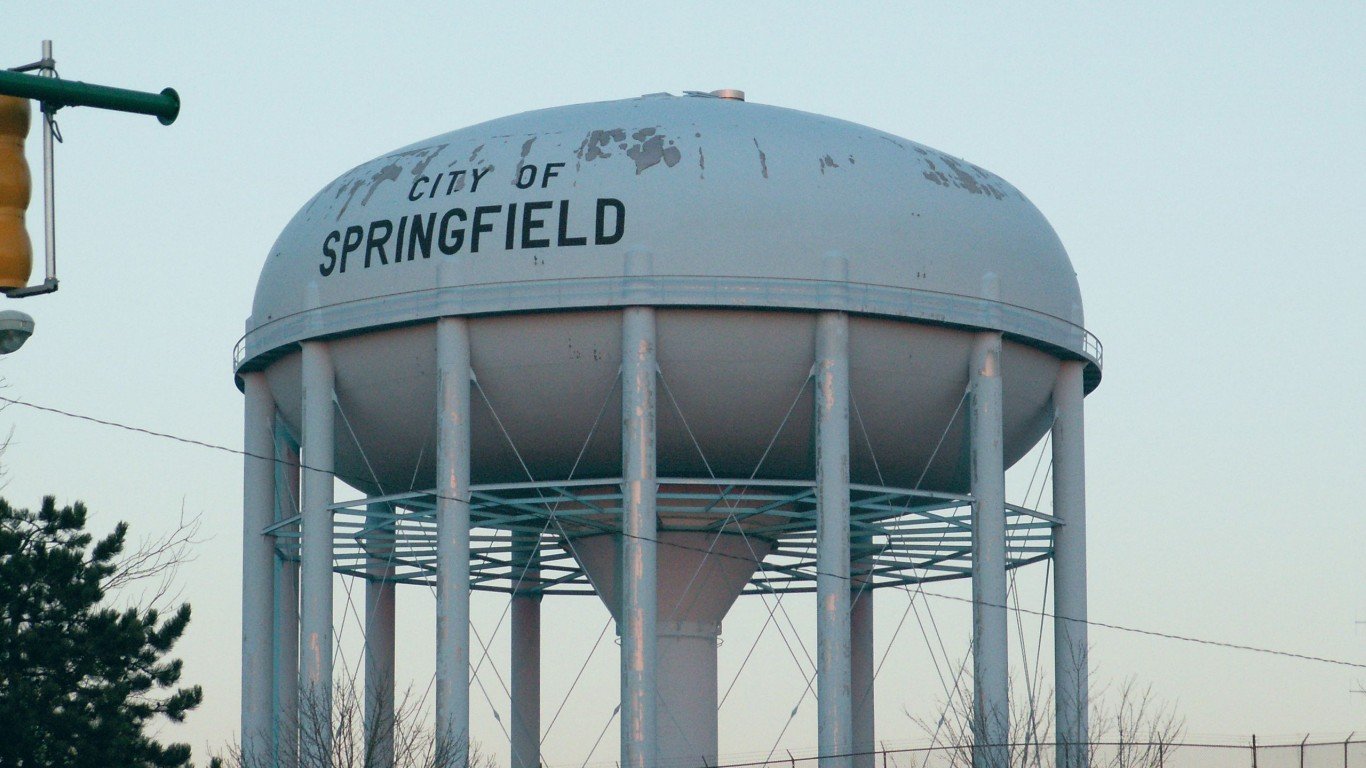
31. Springfield, OH
> Households with SNAP benefits: 17.5% (9,579 total)
> Poverty rate: 15.3% – middle 50% among metro areas
> Median household income: $74,332 – top 25% among metro areas
> February 2022 unemployment: 4.3% – middle 50% among metro areas
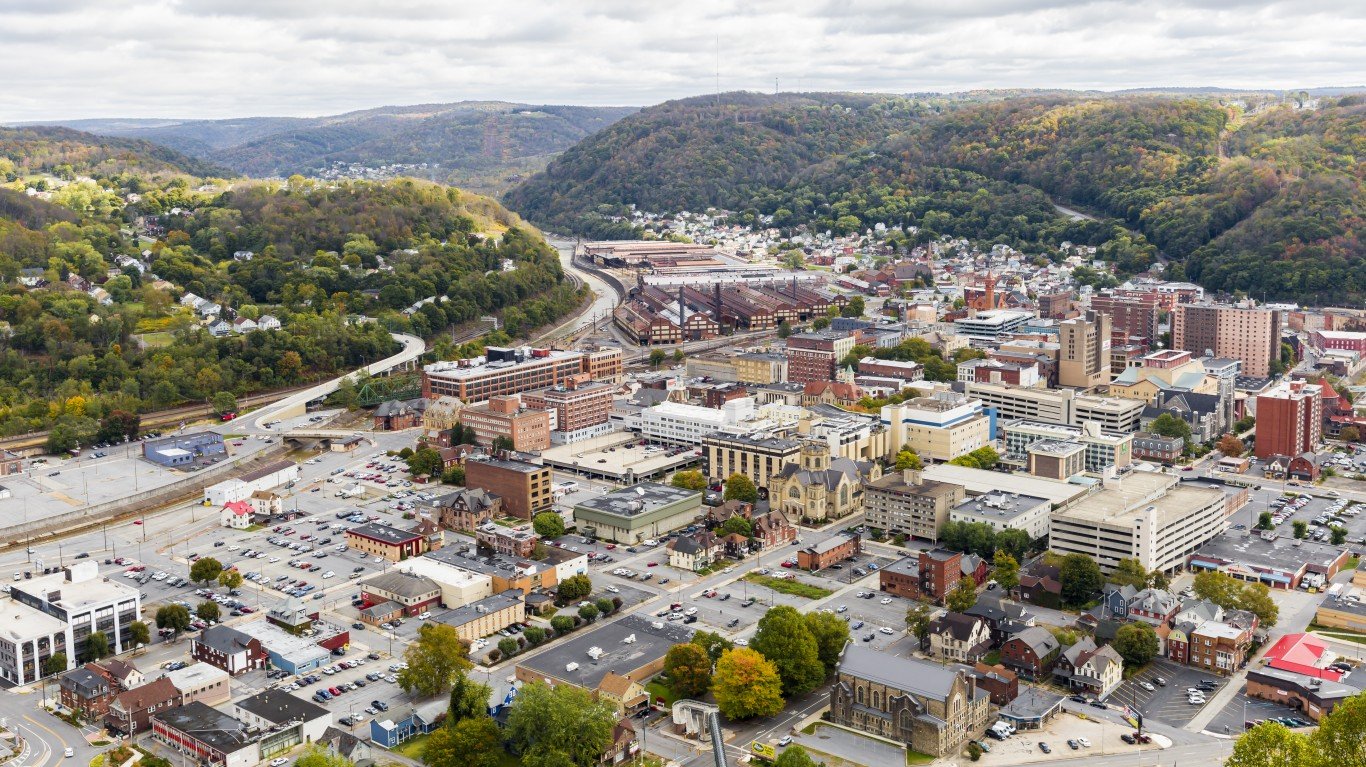
30. Johnstown, PA
> Households with SNAP benefits: 17.5% (9,945 total)
> Poverty rate: 14.5% – bottom 25% among metro areas
> Median household income: $18,319 – bottom 25% among metro areas
> February 2022 unemployment: 5.7% – middle 50% among metro areas
[in-text-ad]

29. Alexandria, LA
> Households with SNAP benefits: 17.6% (9,872 total)
> Poverty rate: 18.4% – middle 50% among metro areas
> Median household income: $45,032 – bottom 25% among metro areas
> February 2022 unemployment: 3.2% – bottom 25% among metro areas
[recirclink id=1096547]
28. Monroe, LA
> Households with SNAP benefits: 17.7% (13,326 total)
> Poverty rate: 23.5% – top 25% among metro areas
> Median household income: $39,364 – bottom 25% among metro areas
> February 2022 unemployment: 3.9% – middle 50% among metro areas

27. Salem, OR
> Households with SNAP benefits: 17.7% (26,758 total)
> Poverty rate: 13.1% – bottom 25% among metro areas
> Median household income: $57,673 – middle 50% among metro areas
> February 2022 unemployment: 3.8% – bottom 25% among metro areas
[in-text-ad-2]

26. Springfield, MA
> Households with SNAP benefits: 17.8% (48,190 total)
> Poverty rate: 14.1% – bottom 25% among metro areas
> Median household income: $48,863 – bottom 25% among metro areas
> February 2022 unemployment: N/A

25. Sumter, SC
> Households with SNAP benefits: 18.0% (9,814 total)
> Poverty rate: 19.0% – middle 50% among metro areas
> Median household income: $60,794 – top 25% among metro areas
> February 2022 unemployment: 3.9% – middle 50% among metro areas
[in-text-ad]

24. Madera, CA
> Households with SNAP benefits: 18.1% (8,033 total)
> Poverty rate: 19.0% – middle 50% among metro areas
> Median household income: $59,876 – middle 50% among metro areas
> February 2022 unemployment: 7.1% – top 25% among metro areas
[recirclink id=1023708]
23. Saginaw, MI
> Households with SNAP benefits: 18.3% (14,470 total)
> Poverty rate: 17.6% – middle 50% among metro areas
> Median household income: $42,267 – bottom 25% among metro areas
> February 2022 unemployment: 6.5% – middle 50% among metro areas
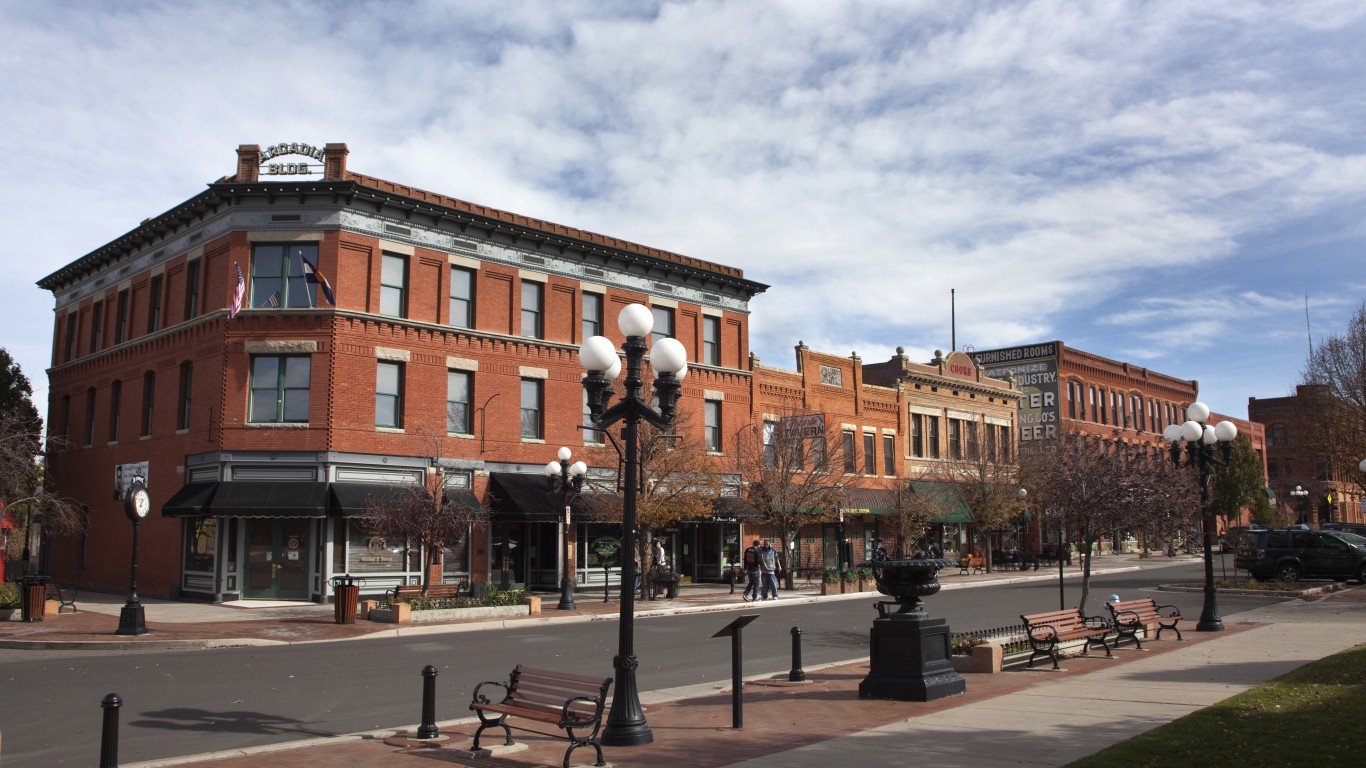
22. Pueblo, CO
> Households with SNAP benefits: 18.5% (12,079 total)
> Poverty rate: 17.6% – middle 50% among metro areas
> Median household income: $61,761 – top 25% among metro areas
> February 2022 unemployment: 6.4% – middle 50% among metro areas
[in-text-ad-2]

21. Hammond, LA
> Households with SNAP benefits: 18.6% (9,053 total)
> Poverty rate: 20.2% – middle 50% among metro areas
> Median household income: $65,566 – top 25% among metro areas
> February 2022 unemployment: 5.2% – middle 50% among metro areas
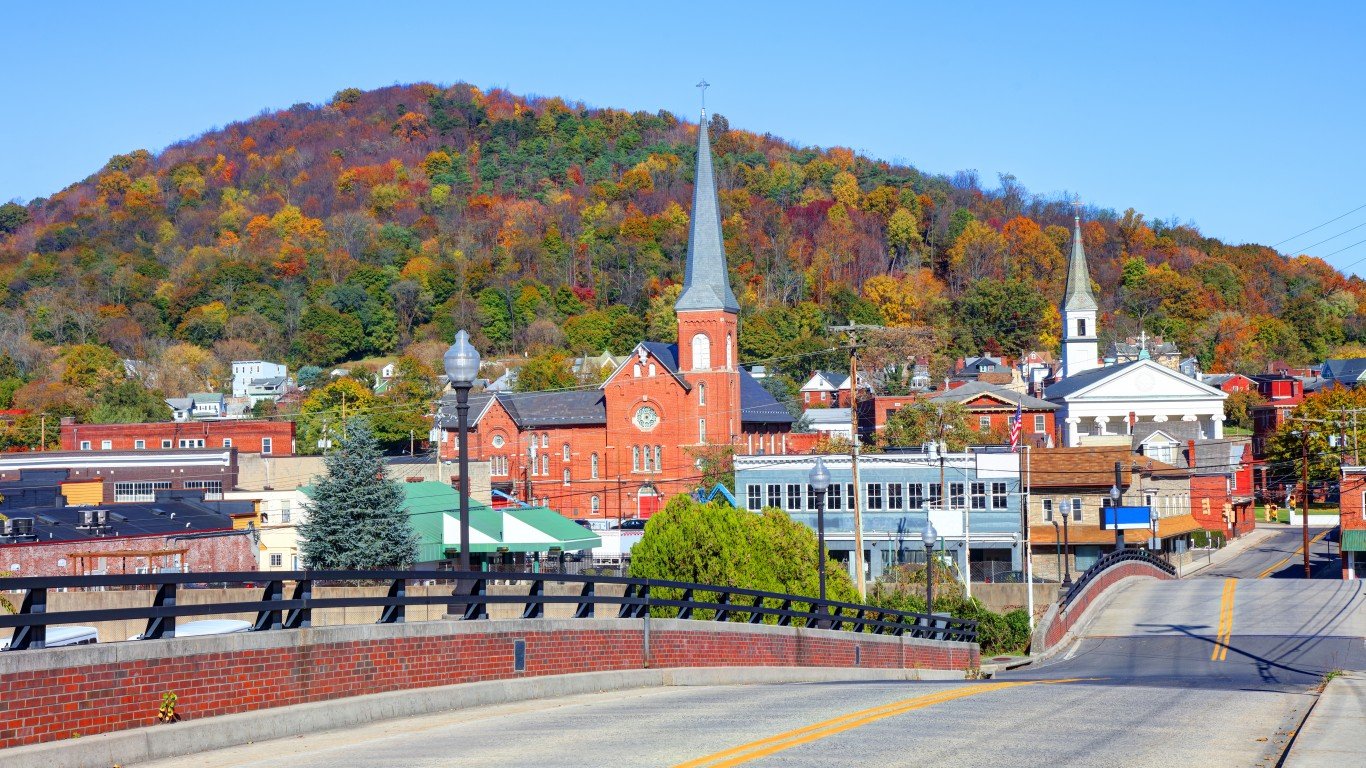
20. Cumberland, MD-WV
> Households with SNAP benefits: 18.6% (7,096 total)
> Poverty rate: 14.9% – middle 50% among metro areas
> Median household income: $39,886 – bottom 25% among metro areas
> February 2022 unemployment: 4.7% – middle 50% among metro areas
[in-text-ad]
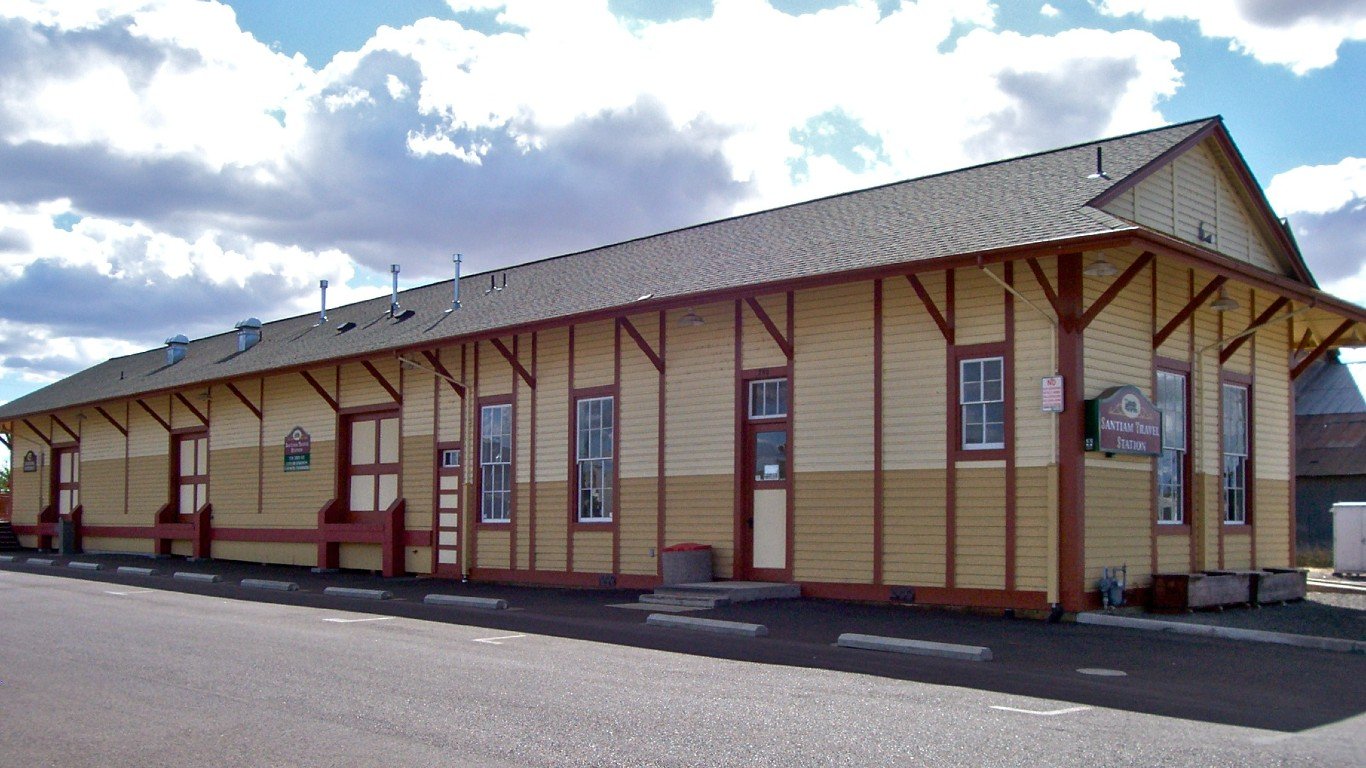
19. Albany-Lebanon, OR
> Households with SNAP benefits: 18.6% (9,006 total)
> Poverty rate: 12.3% – bottom 25% among metro areas
> Median household income: $57,314 – middle 50% among metro areas
> February 2022 unemployment: 4.4% – middle 50% among metro areas
[recirclink id=1092222]
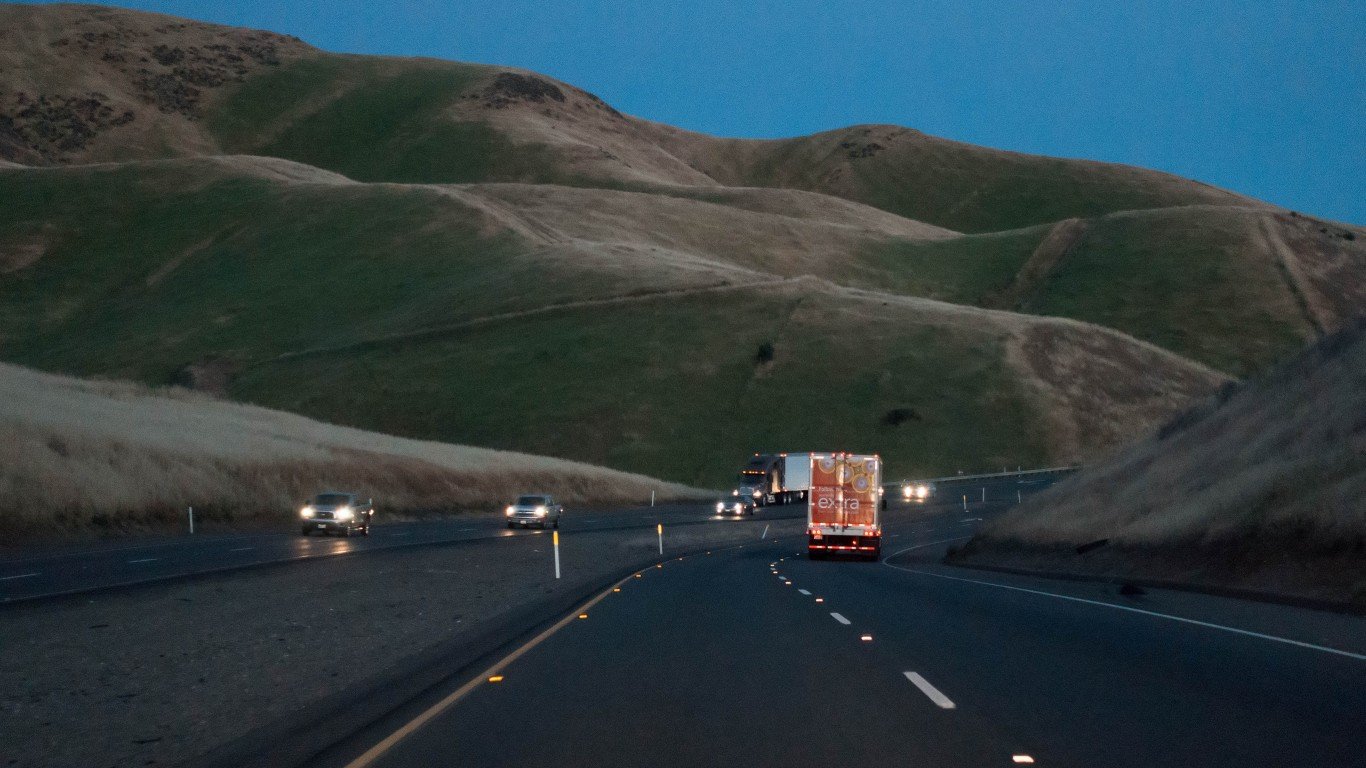
18. Fresno, CA
> Households with SNAP benefits: 18.8% (58,398 total)
> Poverty rate: 20.8% – top 25% among metro areas
> Median household income: $73,447 – top 25% among metro areas
> February 2022 unemployment: 7.4% – top 25% among metro areas

17. Merced, CA
> Households with SNAP benefits: 19.0% (15,453 total)
> Poverty rate: 18.8% – middle 50% among metro areas
> Median household income: $83,289 – top 25% among metro areas
> February 2022 unemployment: 8.6% – top 25% among metro areas
[in-text-ad-2]

16. Eugene-Springfield, OR
> Households with SNAP benefits: 19.0% (29,294 total)
> Poverty rate: 17.2% – middle 50% among metro areas
> Median household income: $59,623 – middle 50% among metro areas
> February 2022 unemployment: 4.2% – middle 50% among metro areas

15. Farmington, NM
> Households with SNAP benefits: 19.5% (8,520 total)
> Poverty rate: 21.7% – top 25% among metro areas
> Median household income: $53,174 – middle 50% among metro areas
> February 2022 unemployment: 6.4% – middle 50% among metro areas
[in-text-ad]
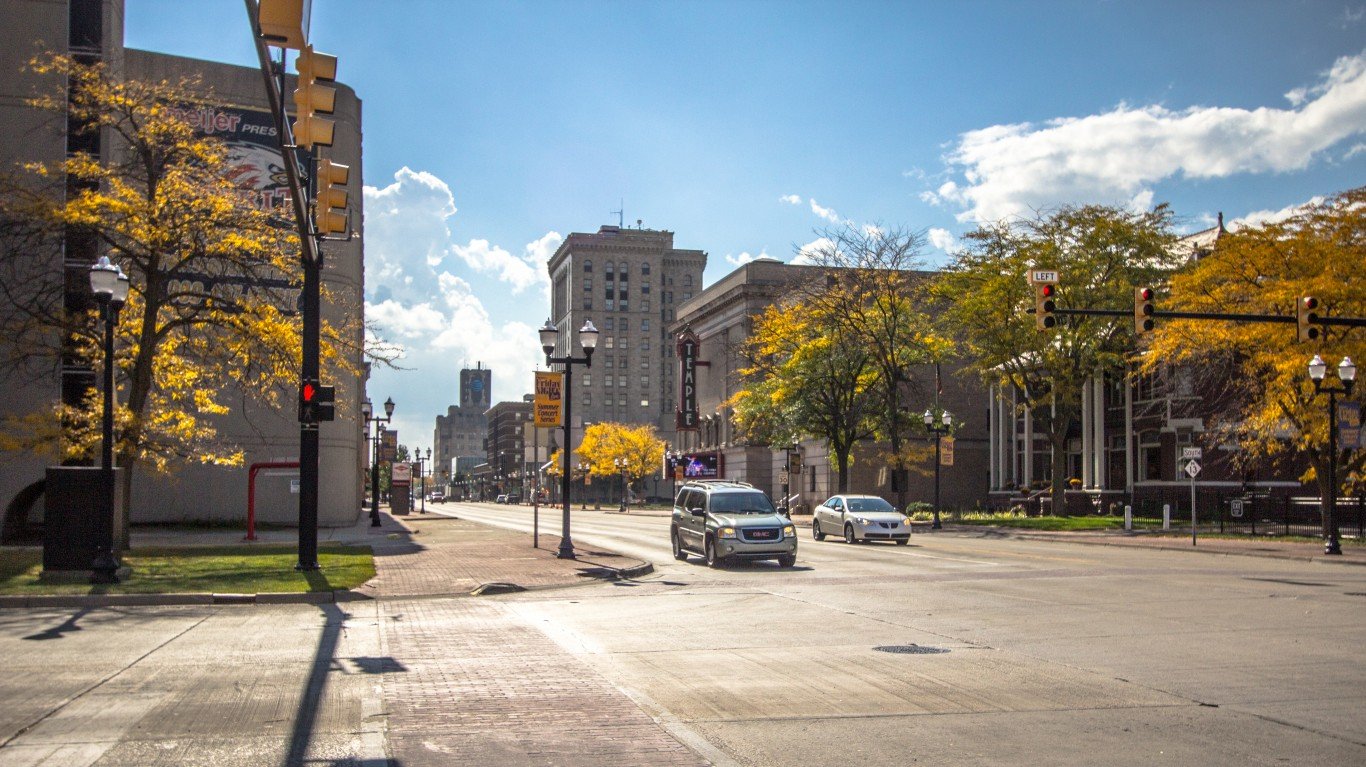
14. Flint, MI
> Households with SNAP benefits: 19.6% (33,382 total)
> Poverty rate: 18.0% – middle 50% among metro areas
> Median household income: $49,180 – bottom 25% among metro areas
> February 2022 unemployment: 7.0% – top 25% among metro areas
[recirclink id=1097193]
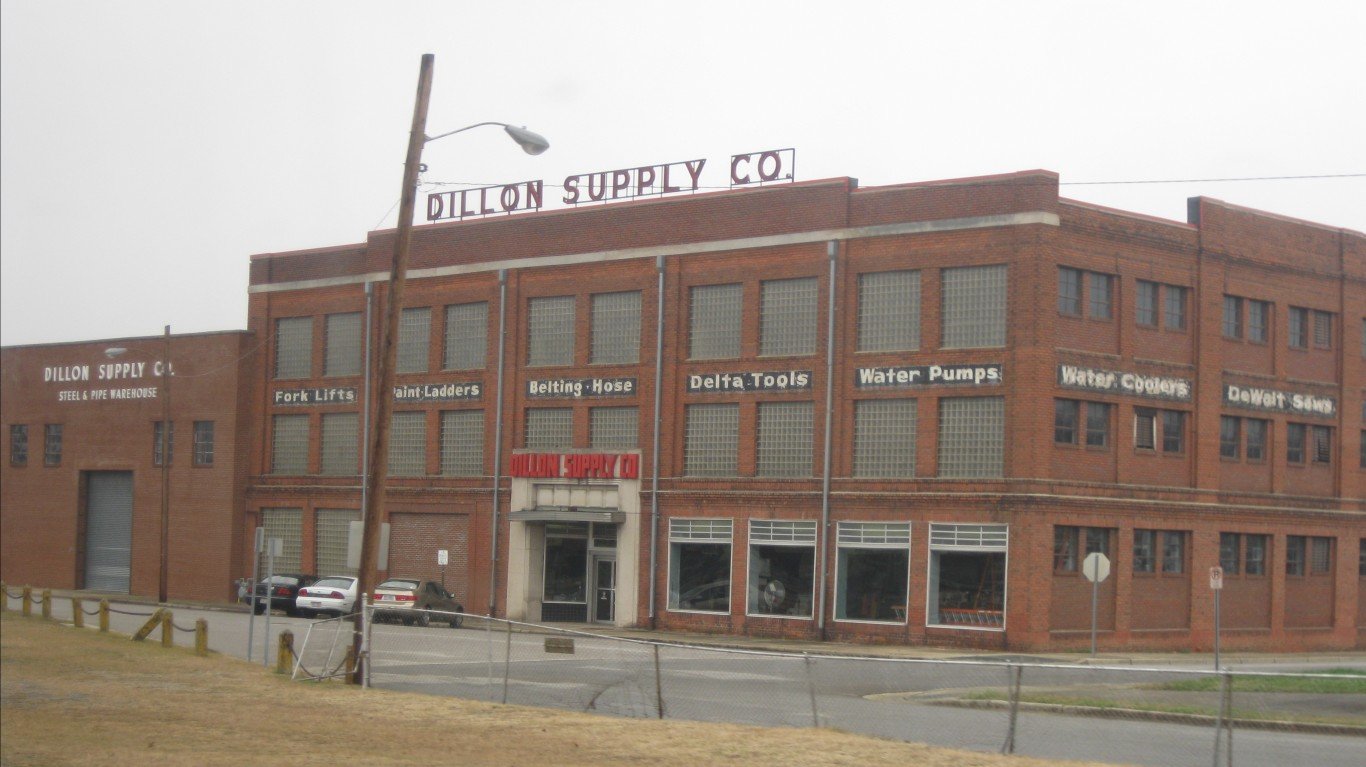
13. Rocky Mount, NC
> Households with SNAP benefits: 19.8% (11,497 total)
> Poverty rate: 18.1% – middle 50% among metro areas
> Median household income: $58,426 – middle 50% among metro areas
> February 2022 unemployment: 5.7% – middle 50% among metro areas

12. Longview, WA
> Households with SNAP benefits: 19.9% (8,418 total)
> Poverty rate: 13.3% – bottom 25% among metro areas
> Median household income: $72,882 – top 25% among metro areas
> February 2022 unemployment: 5.1% – middle 50% among metro areas
[in-text-ad-2]

11. Beckley, WV
> Households with SNAP benefits: 20.1% (9,737 total)
> Poverty rate: 21.0% – top 25% among metro areas
> Median household income: $50,128 – middle 50% among metro areas
> February 2022 unemployment: 3.7% – bottom 25% among metro areas

10. El Paso, TX
> Households with SNAP benefits: 20.1% (55,340 total)
> Poverty rate: 19.5% – middle 50% among metro areas
> Median household income: $47,860 – bottom 25% among metro areas
> February 2022 unemployment: 5.1% – middle 50% among metro areas
[in-text-ad]

9. Albany, GA
> Households with SNAP benefits: 21.3% (11,936 total)
> Poverty rate: 23.3% – top 25% among metro areas
> Median household income: $51,682 – middle 50% among metro areas
> February 2022 unemployment: 3.6% – bottom 25% among metro areas
[recirclink id=1100321]

8. Yakima, WA
> Households with SNAP benefits: 21.5% (17,973 total)
> Poverty rate: 16.5% – middle 50% among metro areas
> Median household income: $45,386 – bottom 25% among metro areas
> February 2022 unemployment: 5.9% – middle 50% among metro areas

7. Visalia, CA
> Households with SNAP benefits: 22.1% (30,718 total)
> Poverty rate: 21.8% – top 25% among metro areas
> Median household income: $57,053 – middle 50% among metro areas
> February 2022 unemployment: 9.0% – top 25% among metro areas
[in-text-ad-2]
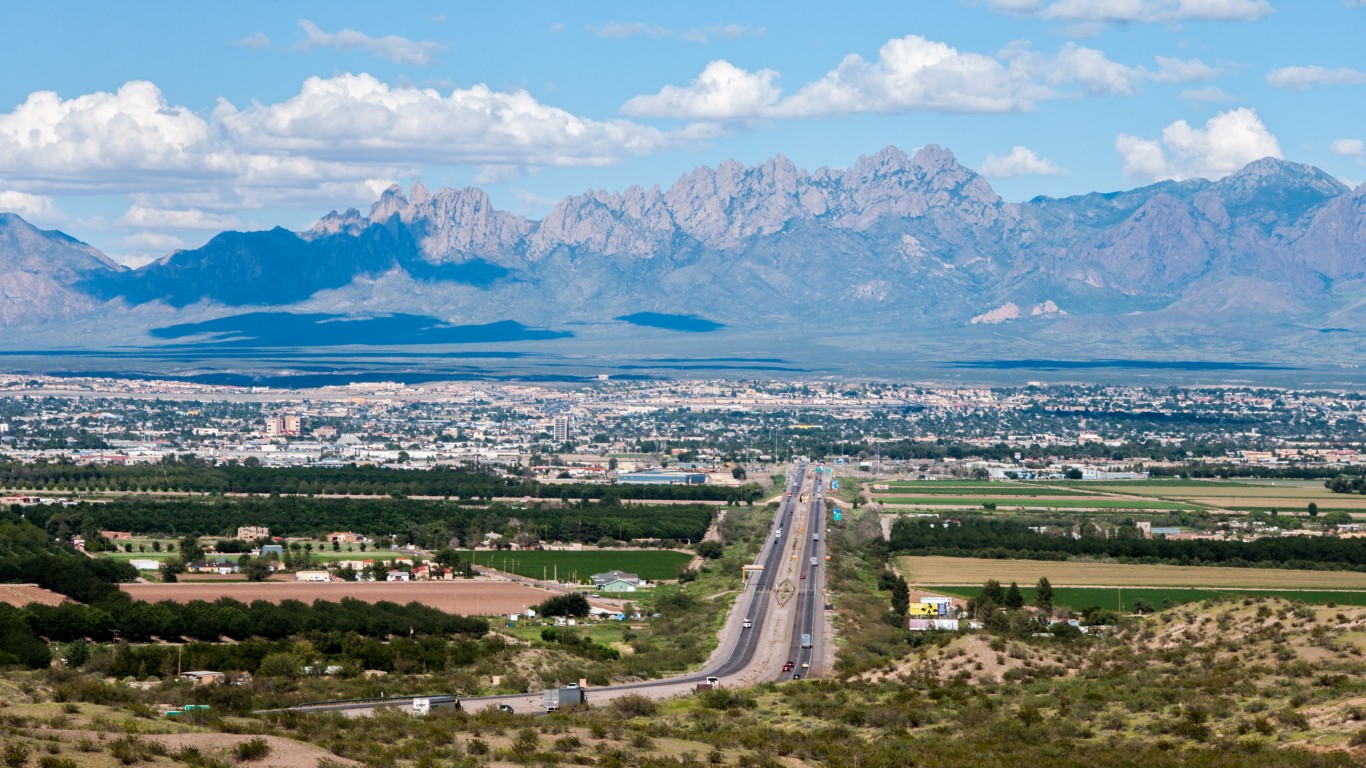
6. Las Cruces, NM
> Households with SNAP benefits: 23.0% (18,248 total)
> Poverty rate: 24.8% – top 25% among metro areas
> Median household income: $56,714 – middle 50% among metro areas
> February 2022 unemployment: 5.4% – middle 50% among metro areas

5. Grants Pass, OR
> Households with SNAP benefits: 23.4% (8,556 total)
> Poverty rate: 16.0% – middle 50% among metro areas
> Median household income: $59,608 – middle 50% among metro areas
> February 2022 unemployment: 4.9% – middle 50% among metro areas
[in-text-ad]
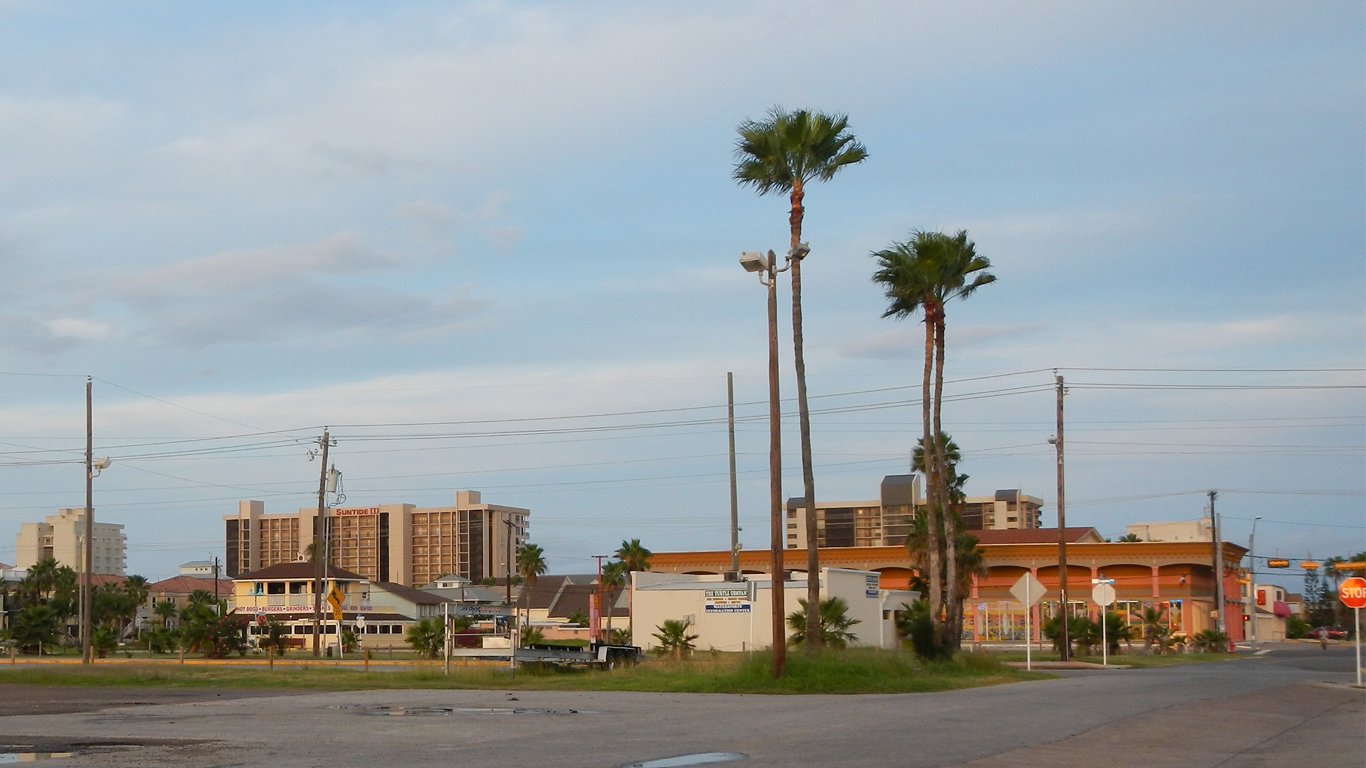
4. Brownsville-Harlingen, TX
> Households with SNAP benefits: 23.6% (29,993 total)
> Poverty rate: 26.7% – top 25% among metro areas
> Median household income: $35,558 – bottom 25% among metro areas
> February 2022 unemployment: 7.2% – top 25% among metro areas
[recirclink id=1096547]

3. El Centro, CA
> Households with SNAP benefits: 23.6% (10,807 total)
> Poverty rate: 22.5% – top 25% among metro areas
> Median household income: $51,591 – middle 50% among metro areas
> February 2022 unemployment:16.2% – top 25% among metro areas

2. Laredo, TX
> Households with SNAP benefits: 24.6% (18,759 total)
> Poverty rate: 24.6% – top 25% among metro areas
> Median household income: $55,349 – middle 50% among metro areas
> February 2022 unemployment: 5.3% – middle 50% among metro areas
[in-text-ad-2]
1. McAllen-Edinburg-Mission, TX
> Households with SNAP benefits: 28.4% (69,373 total)
> Poverty rate: 28.4% – top 25% among metro areas
> Median household income: $47,675 – bottom 25% among metro areas
> February 2022 unemployment: 8.0% – top 25% among metro areas
Methodology
To determine the cities with the most people on food stamps, 24/7 Wall St. reviewed data on five year average food stamp recipiency rates from the U.S. Census Bureau’s 2020 American Community Survey. Metropolitan areas were ranked based on the percentage of households receiving Supplemental Nutrition Assistance Program benefits. Supplemental data on poverty rate and median household income also came from the 2020 ACS. Data on unemployment for February 2022 came from the Bureau of Labor Statistics and is seasonally adjusted.
Contact [email protected] for any questions or corrections.