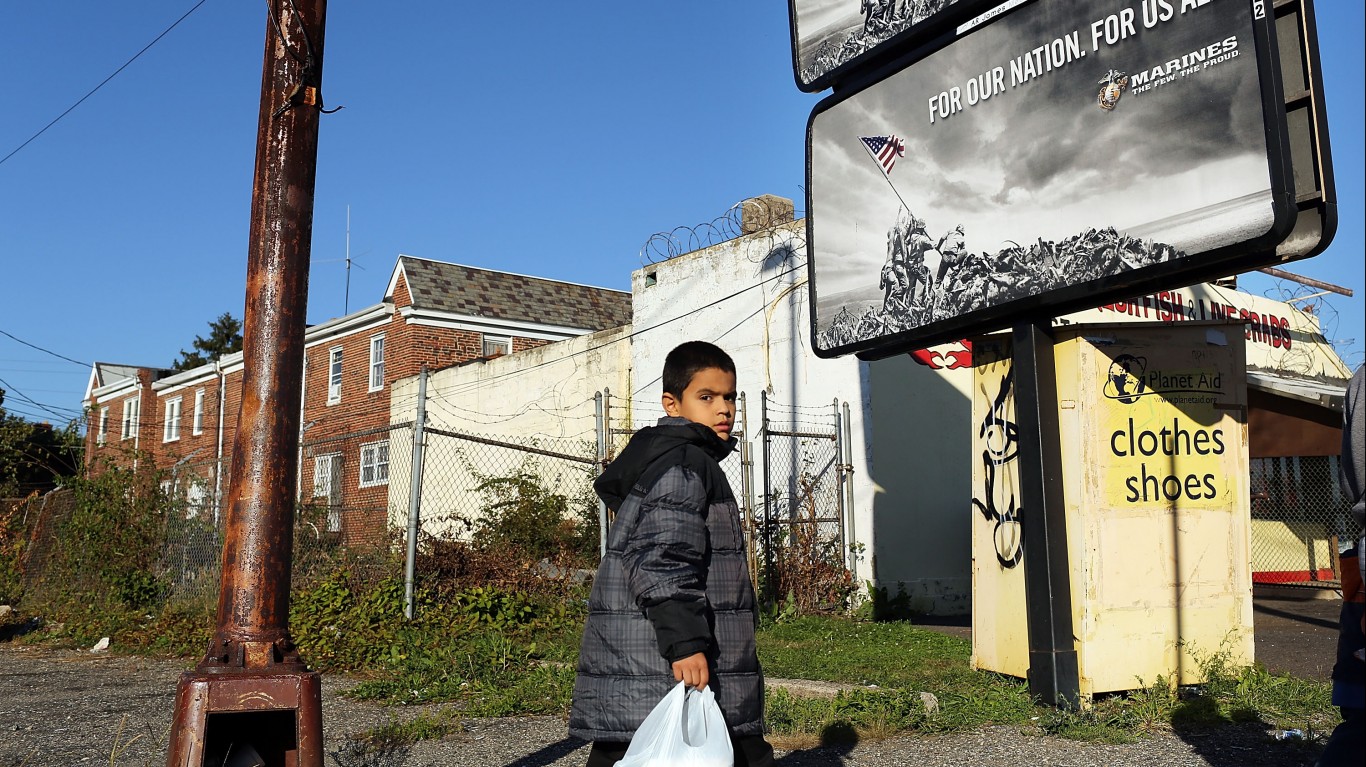
The World Bank predicts that the effects of the pandemic will have pushed somewhere between 88 million and 115 million people worldwide into extreme poverty some time this year. A number of Americans could certainly be among those falling into poverty. Even before the spread of COVID-19, parts of the country already struggled much more with poverty than the nation overall.
The U.S. poverty rate, which was 12.3% in 2019, has likely increased as a result of the pandemic. And in historically impoverished metropolitan areas that were reportedly affected disproportionately by the virus, the poverty rate could increase even more.
To determine the metro with the highest poverty rate in every state, 24/7 Wall St. reviewed one-year estimates of the percentage of people who live below the poverty line in each metropolitan area from the U.S. Census Bureau’s 2019 American Community Survey. It should be noted that a number of states only have one metropolitan area, so that metro ranks as the poorest by default only.
For reference, the U.S. Department of Health and Human services sets the official poverty threshold at an annual income of no more than approximately $26,000 for a family of four.
Poverty can be found all across the country. Still, in some states, even the poorest metro area has a lower poverty rate than the U.S. as a whole. In Nebraska, for example, the poorest metropolitan area — Lincoln — has a poverty rate of 10.6%, compared to the national poverty rate of 12.3%. Generally speaking, the metro areas on this list with lower poverty rates are in states with relatively low poverty as well. Nebraska is one of 11 states with a poverty rate under 10%.
Click here to see the metro with the highest poverty rate in every state.
Click here to see our methodology.
Alabama: Gadsden
> Poverty rate: 19.7% (Alabama: 15.5%)
> Number of people living below poverty line: 19,815 (Alabama: 739,108)
> Households receiving SNAP benefits: 15.0% (Alabama: 13.0%)
> Median household income: $41,447 (Alabama: $51,734)
[in-text-ad]

Alaska: Anchorage*
> Poverty rate: 10.0% (Alaska: 10.1%)
> Number of people living below poverty line: 38,789 (Alaska: 71,938)
> Households receiving SNAP benefits: 9.3% (Alaska: 10.3%)
> Median household income: $80,676 (Alaska: $75,463)
*Because Anchorage is the only eligible metro in Alaska, it is the metro with the highest poverty rate by default.
[recirclink id=910210]
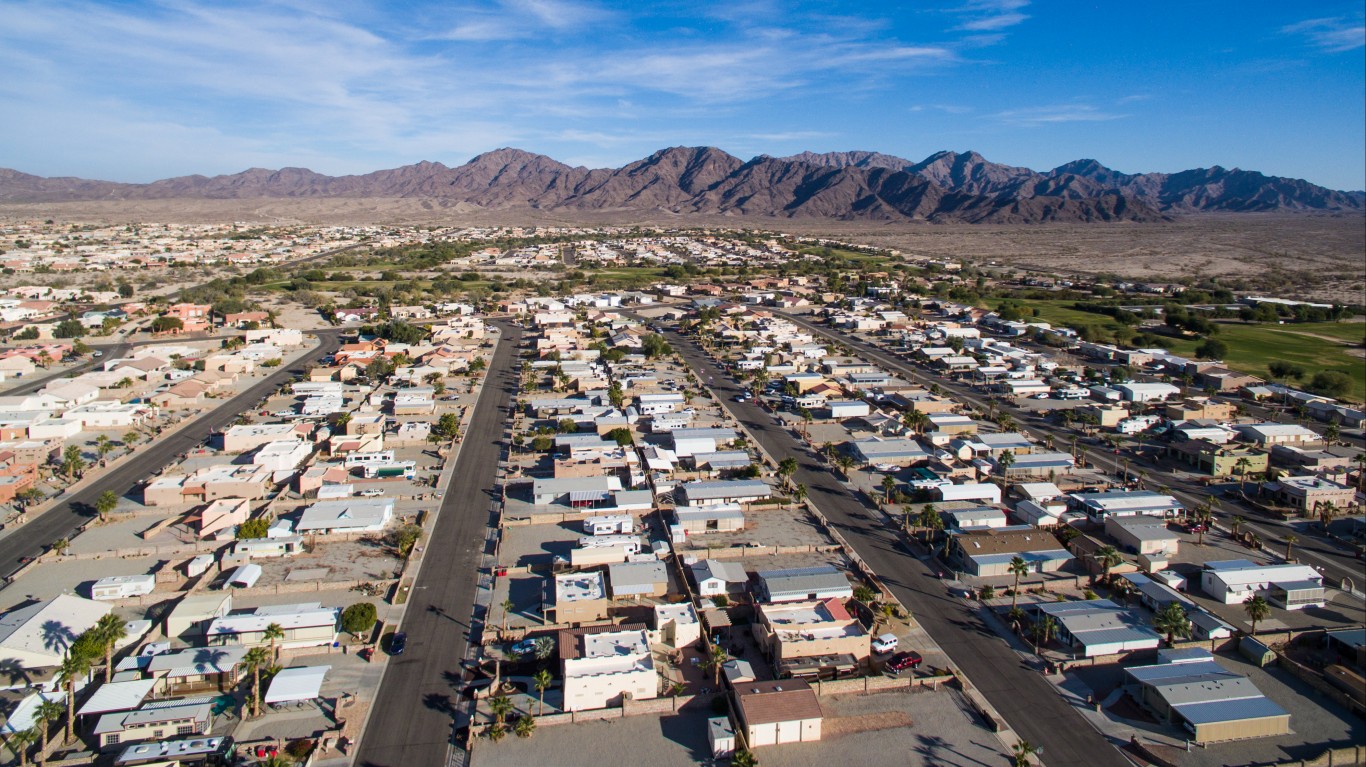
Arizona: Yuma
> Poverty rate: 21.4% (Arizona: 13.5%)
> Number of people living below poverty line: 44,400 (Arizona: 958,442)
> Households receiving SNAP benefits: 18.4% (Arizona: 9.4%)
> Median household income: $46,419 (Arizona: $62,055)
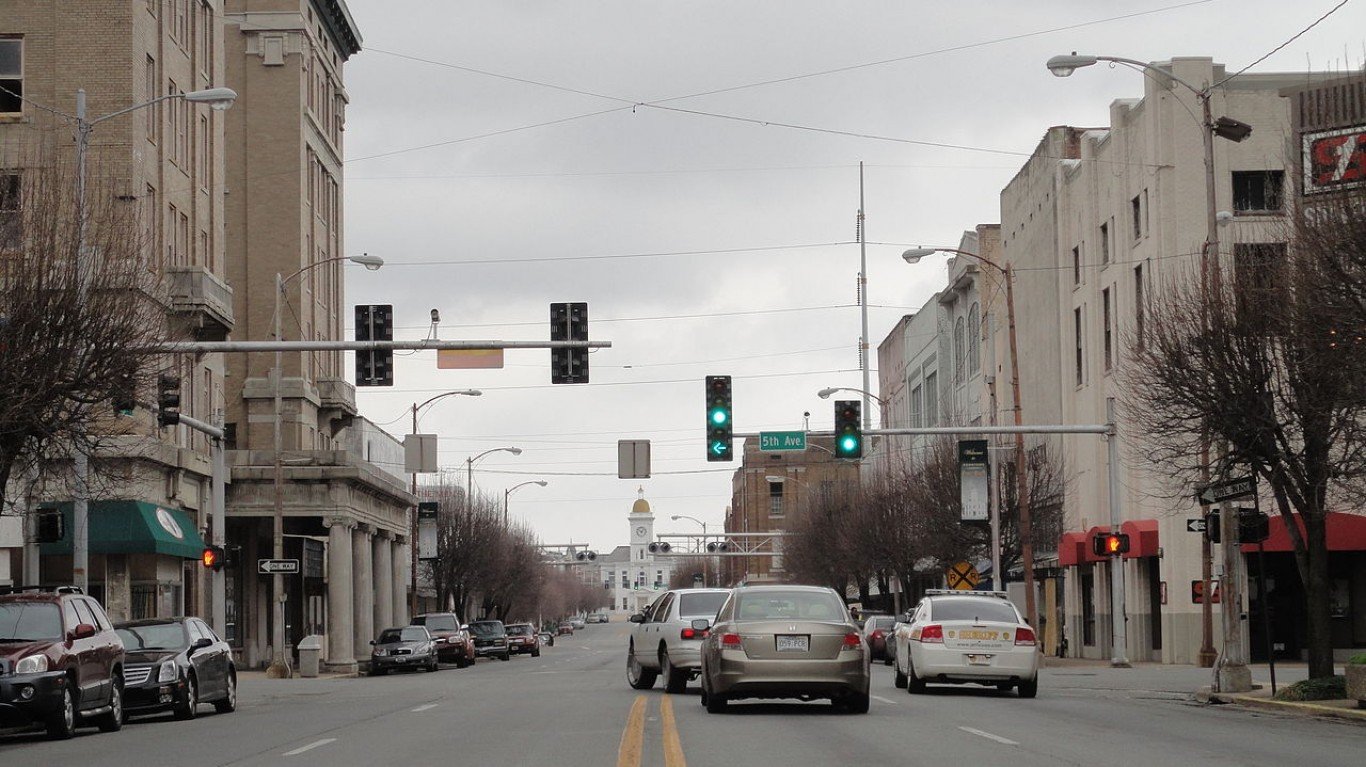
Arkansas: Pine Bluff
> Poverty rate: 23.6% (Arkansas: 16.2%)
> Number of people living below poverty line: 18,358 (Arkansas: 474,739)
> Households receiving SNAP benefits: 14.7% (Arkansas: 11.0%)
> Median household income: $41,541 (Arkansas: $48,952)
[in-text-ad-2]
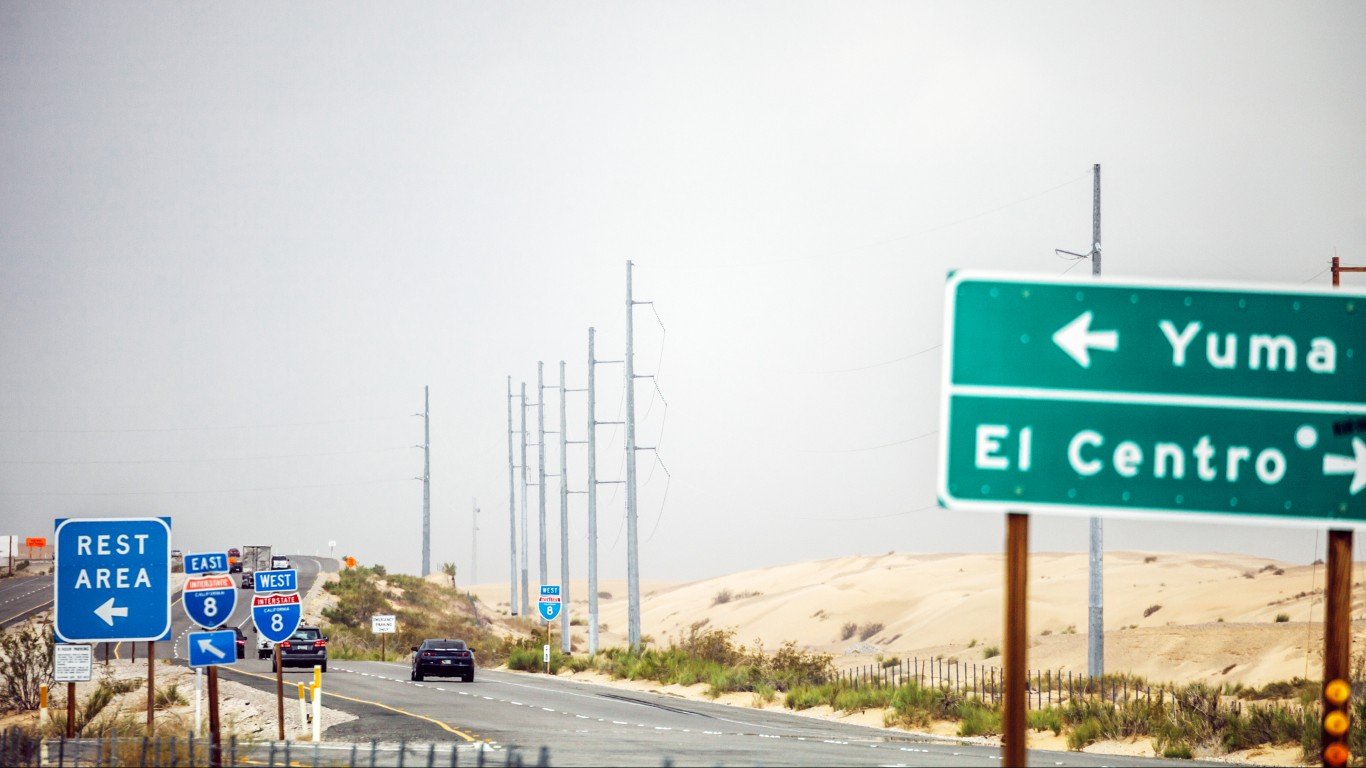
California: El Centro
> Poverty rate: 25.1% (California: 11.8%)
> Number of people living below poverty line: 42,687 (California: 4,552,837)
> Households receiving SNAP benefits: 19.4% (California: 8.4%)
> Median household income: $48,472 (California: $80,440)

Colorado: Pueblo
> Poverty rate: 17.9% (Colorado: 9.3%)
> Number of people living below poverty line: 29,592 (Colorado: 526,979)
> Households receiving SNAP benefits: 18.3% (Colorado: 6.9%)
> Median household income: $51,276 (Colorado: $77,127)
[in-text-ad]

Connecticut: New Haven-Milford
> Poverty rate: 12.2% (Connecticut: 10.0%)
> Number of people living below poverty line: 100,626 (Connecticut: 347,149)
> Households receiving SNAP benefits: 13.8% (Connecticut: 11.1%)
> Median household income: $69,751 (Connecticut: $78,833)
[recirclink id=931307]

Delaware: Dover*
> Poverty rate: 13.0% (Delaware: 11.3%)
> Number of people living below poverty line: 22,573 (Delaware: 106,383)
> Households receiving SNAP benefits: 14.0% (Delaware: 10.1%)
> Median household income: $58,001 (Delaware: $70,176)
*Because Dover is the only eligible metro in Delaware, it is the metro with the highest poverty rate by default.

Florida: Tallahassee
> Poverty rate: 20.5% (Florida: 12.7%)
> Number of people living below poverty line: 74,754 (Florida: 2,664,772)
> Households receiving SNAP benefits: 13.9% (Florida: 11.8%)
> Median household income: $52,729 (Florida: $59,227)
[in-text-ad-2]

Georgia: Albany
> Poverty rate: 22.6% (Georgia: 13.3%)
> Number of people living below poverty line: 32,024 (Georgia: 1,373,909)
> Households receiving SNAP benefits: 21.2% (Georgia: 11.2%)
> Median household income: $40,625 (Georgia: $61,980)

Hawaii: Kahului-Wailuku-Lahaina
> Poverty rate: 11.9% (Hawaii: 9.3%)
> Number of people living below poverty line: 19,716 (Hawaii: 128,722)
> Households receiving SNAP benefits: 7.7% (Hawaii: 10.4%)
> Median household income: $80,754 (Hawaii: $83,102)
[in-text-ad]

Idaho: Pocatello
> Poverty rate: 12.9% (Idaho: 11.2%)
> Number of people living below poverty line: 11,870 (Idaho: 195,984)
> Households receiving SNAP benefits: 9.4% (Idaho: 8.3%)
> Median household income: $51,612 (Idaho: $60,999)
[recirclink id=887395]

Illinois: Champaign-Urbana
> Poverty rate: 20.0% (Illinois: 11.5%)
> Number of people living below poverty line: 42,042 (Illinois: 1,420,542)
> Households receiving SNAP benefits: 10.7% (Illinois: 11.8%)
> Median household income: $53,081 (Illinois: $69,187)

Indiana: Muncie
> Poverty rate: 22.8% (Indiana: 11.9%)
> Number of people living below poverty line: 24,266 (Indiana: 775,823)
> Households receiving SNAP benefits: 13.3% (Indiana: 8.5%)
> Median household income: $45,065 (Indiana: $57,603)
[in-text-ad-2]

Iowa: Iowa City
> Poverty rate: 16.2% (Iowa: 11.2%)
> Number of people living below poverty line: 26,873 (Iowa: 341,613)
> Households receiving SNAP benefits: 5.9% (Iowa: 9.5%)
> Median household income: $63,761 (Iowa: $61,691)

Kansas: Manhattan
> Poverty rate: 18.6% (Kansas: 11.4%)
> Number of people living below poverty line: 21,990 (Kansas: 323,189)
> Households receiving SNAP benefits: 7.7% (Kansas: 7.0%)
> Median household income: $59,010 (Kansas: $62,087)
[in-text-ad]

Kentucky: Bowling Green
> Poverty rate: 16.5% (Kentucky: 16.3%)
> Number of people living below poverty line: 27,857 (Kentucky: 703,627)
> Households receiving SNAP benefits: 9.2% (Kentucky: 11.9%)
> Median household income: $51,198 (Kentucky: $52,295)
[recirclink id=889166]

Louisiana: Monroe
> Poverty rate: 26.0% (Louisiana: 19.0%)
> Number of people living below poverty line: 49,828 (Louisiana: 857,894)
> Households receiving SNAP benefits: 20.9% (Louisiana: 14.4%)
> Median household income: $40,136 (Louisiana: $51,073)

Maine: Bangor
> Poverty rate: 12.1% (Maine: 10.9%)
> Number of people living below poverty line: 17,591 (Maine: 141,803)
> Households receiving SNAP benefits: 15.0% (Maine: 12.3%)
> Median household income: $50,449 (Maine: $58,924)
[in-text-ad-2]

Maryland: Cumberland
> Poverty rate: 13.9% (Maryland: 9.0%)
> Number of people living below poverty line: 12,173 (Maryland: 532,241)
> Households receiving SNAP benefits: 21.8% (Maryland: 9.8%)
> Median household income: $49,729 (Maryland: $86,738)

Massachusetts: Springfield
> Poverty rate: 12.6% (Massachusetts: 9.4%)
> Number of people living below poverty line: 83,122 (Massachusetts: 625,763)
> Households receiving SNAP benefits: 17.6% (Massachusetts: 11.2%)
> Median household income: $62,346 (Massachusetts: $85,843)
[in-text-ad]

Michigan: Saginaw
> Poverty rate: 19.0% (Michigan: 13.0%)
> Number of people living below poverty line: 34,997 (Michigan: 1,269,062)
> Households receiving SNAP benefits: 19.7% (Michigan: 11.7%)
> Median household income: $48,303 (Michigan: $59,584)
[recirclink id=910210]

Minnesota: Mankato
> Poverty rate: 16.1% (Minnesota: 9.0%)
> Number of people living below poverty line: 15,377 (Minnesota: 494,683)
> Households receiving SNAP benefits: 8.0% (Minnesota: 7.4%)
> Median household income: $63,126 (Minnesota: $74,593)
Mississippi: Hattiesburg
> Poverty rate: 22.5% (Mississippi: 19.6%)
> Number of people living below poverty line: 36,946 (Mississippi: 564,192)
> Households receiving SNAP benefits: 12.3% (Mississippi: 13.5%)
> Median household income: $48,359 (Mississippi: $45,792)
[in-text-ad-2]

Missouri: Columbia
> Poverty rate: 18.3% (Missouri: 12.9%)
> Number of people living below poverty line: 36,049 (Missouri: 770,175)
> Households receiving SNAP benefits: 9.7% (Missouri: 10.2%)
> Median household income: $57,359 (Missouri: $57,409)

Montana: Great Falls
> Poverty rate: 15.4% (Montana: 12.6%)
> Number of people living below poverty line: 12,153 (Montana: 131,882)
> Households receiving SNAP benefits: 12.4% (Montana: 8.7%)
> Median household income: $51,227 (Montana: $57,153)
[in-text-ad]

Nebraska: Lincoln
> Poverty rate: 10.6% (Nebraska: 9.9%)
> Number of people living below poverty line: 34,144 (Nebraska: 185,761)
> Households receiving SNAP benefits: 7.1% (Nebraska: 7.6%)
> Median household income: $61,539 (Nebraska: $63,229)
[recirclink id=931307]

Nevada: Las Vegas-Henderson-Paradise
> Poverty rate: 12.8% (Nevada: 12.5%)
> Number of people living below poverty line: 287,386 (Nevada: 379,564)
> Households receiving SNAP benefits: 11.0% (Nevada: 10.5%)
> Median household income: $62,107 (Nevada: $63,276)

New Hampshire: Manchester-Nashua*
> Poverty rate: 7.3% (New Hampshire: 7.3%)
> Number of people living below poverty line: 29,991 (New Hampshire: 95,711)
> Households receiving SNAP benefits: 6.2% (New Hampshire: 6.0%)
> Median household income: $83,626 (New Hampshire: $77,933)
*Because Manchester-Nashua is the only eligible metro in New Hampshire, it is the metro with the highest poverty rate by default.
[in-text-ad-2]

New Jersey: Vineland-Bridgeton
> Poverty rate: 13.2% (New Jersey: 9.2%)
> Number of people living below poverty line: 18,305 (New Jersey: 798,262)
> Households receiving SNAP benefits: 13.3% (New Jersey: 7.4%)
> Median household income: $54,587 (New Jersey: $85,751)
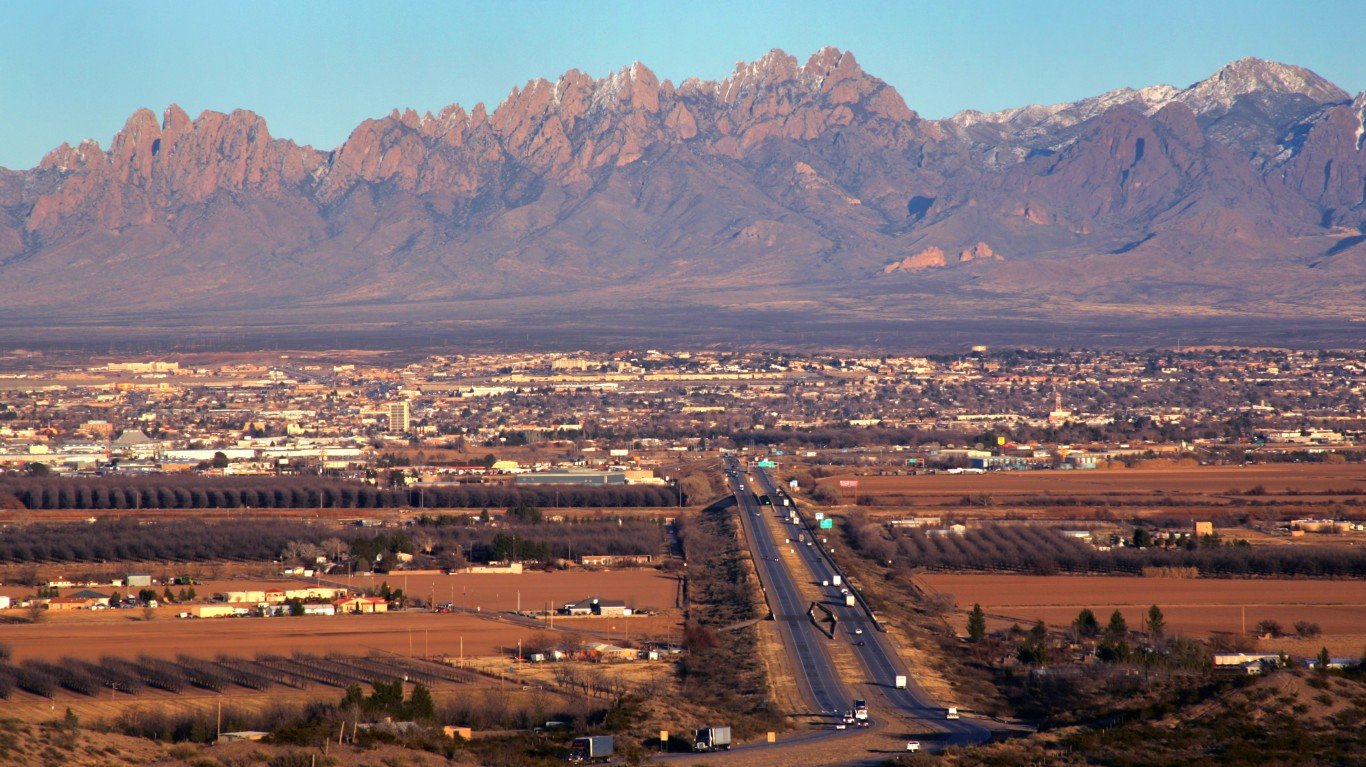
New Mexico: Las Cruces
> Poverty rate: 25.9% (New Mexico: 18.2%)
> Number of people living below poverty line: 55,037 (New Mexico: 373,230)
> Households receiving SNAP benefits: 22.9% (New Mexico: 16.4%)
> Median household income: $43,038 (New Mexico: $51,945)
[in-text-ad]

New York: Binghamton
> Poverty rate: 16.6% (New York: 13.0%)
> Number of people living below poverty line: 38,063 (New York: 2,467,006)
> Households receiving SNAP benefits: 15.6% (New York: 14.1%)
> Median household income: $53,768 (New York: $72,108)
[recirclink id=887395]

North Carolina: Greenville
> Poverty rate: 19.6% (North Carolina: 13.6%)
> Number of people living below poverty line: 33,998 (North Carolina: 1,386,122)
> Households receiving SNAP benefits: 13.6% (North Carolina: 11.6%)
> Median household income: $53,401 (North Carolina: $57,341)

North Dakota: Grand Forks
> Poverty rate: 13.9% (North Dakota: 10.6%)
> Number of people living below poverty line: 13,253 (North Dakota: 78,112)
> Households receiving SNAP benefits: 8.8% (North Dakota: 6.9%)
> Median household income: $57,301 (North Dakota: $64,577)
[in-text-ad-2]

Ohio: Youngstown-Warren-Boardman
> Poverty rate: 16.2% (Ohio: 13.1%)
> Number of people living below poverty line: 84,239 (Ohio: 1,484,862)
> Households receiving SNAP benefits: 15.4% (Ohio: 12.0%)
> Median household income: $48,558 (Ohio: $58,642)

Oklahoma: Lawton
> Poverty rate: 17.8% (Oklahoma: 15.2%)
> Number of people living below poverty line: 20,770 (Oklahoma: 583,029)
> Households receiving SNAP benefits: 15.1% (Oklahoma: 12.0%)
> Median household income: $51,332 (Oklahoma: $54,449)
[in-text-ad]

Oregon: Corvallis
> Poverty rate: 17.9% (Oregon: 11.4%)
> Number of people living below poverty line: 15,662 (Oregon: 470,643)
> Households receiving SNAP benefits: 9.7% (Oregon: 13.4%)
> Median household income: $70,835 (Oregon: $67,058)
[recirclink id=889166]
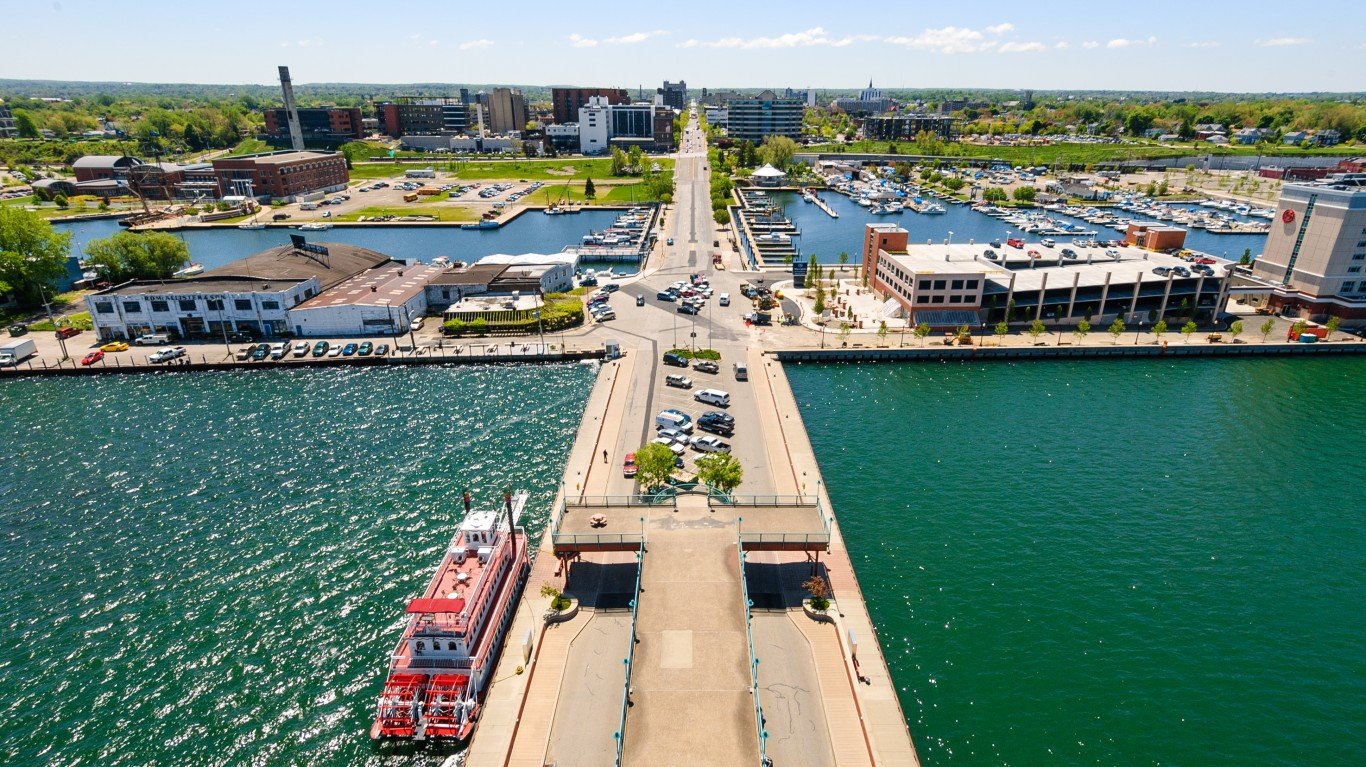
Pennsylvania: Erie
> Poverty rate: 17.4% (Pennsylvania: 12.0%)
> Number of people living below poverty line: 44,656 (Pennsylvania: 1,489,333)
> Households receiving SNAP benefits: 18.7% (Pennsylvania: 13.5%)
> Median household income: $51,818 (Pennsylvania: $63,463)

Rhode Island: Providence-Warwick*
> Poverty rate: 11.0% (Rhode Island: 10.8%)
> Number of people living below poverty line: 173,218 (Rhode Island: 110,244)
> Households receiving SNAP benefits: 14.7% (Rhode Island: 14.5%)
> Median household income: $70,967 (Rhode Island: $71,169)
*Because Providence-Warwick is the only eligible metro in Rhode Island, it is the metro with the highest poverty rate by default.
[in-text-ad-2]

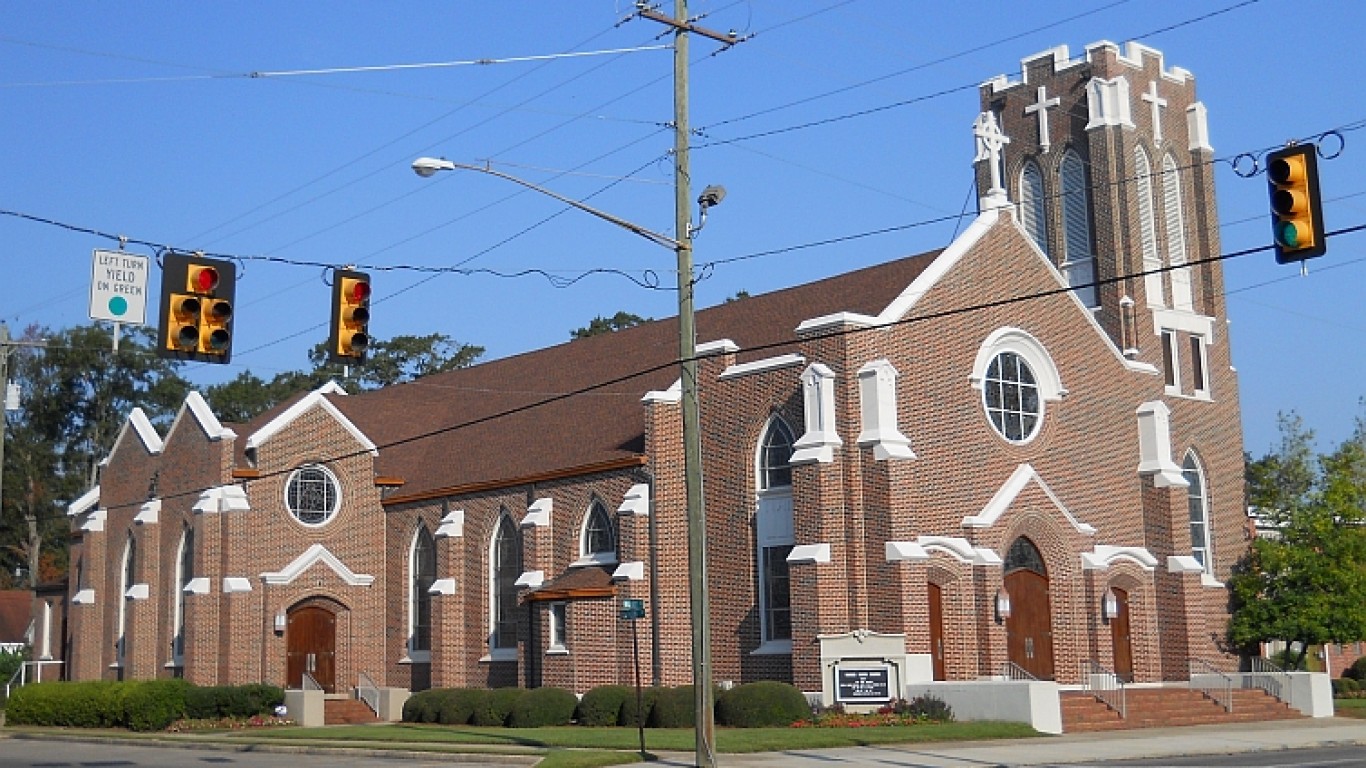
South Carolina: Sumter
> Poverty rate: 19.4% (South Carolina: 13.8%)
> Number of people living below poverty line: 26,650 (South Carolina: 692,744)
> Households receiving SNAP benefits: 16.5% (South Carolina: 9.9%)
> Median household income: $49,263 (South Carolina: $56,227)

South Dakota: Rapid City
> Poverty rate: 11.0% (South Dakota: 11.9%)
> Number of people living below poverty line: 15,154 (South Dakota: 101,946)
> Households receiving SNAP benefits: 9.1% (South Dakota: 8.7%)
> Median household income: $58,361 (South Dakota: $59,533)
[in-text-ad]

Tennessee: Johnson City
> Poverty rate: 17.9% (Tennessee: 13.9%)
> Number of people living below poverty line: 35,126 (Tennessee: 922,176)
> Households receiving SNAP benefits: 11.0% (Tennessee: 11.4%)
> Median household income: $45,917 (Tennessee: $56,071)
[recirclink id=910210]
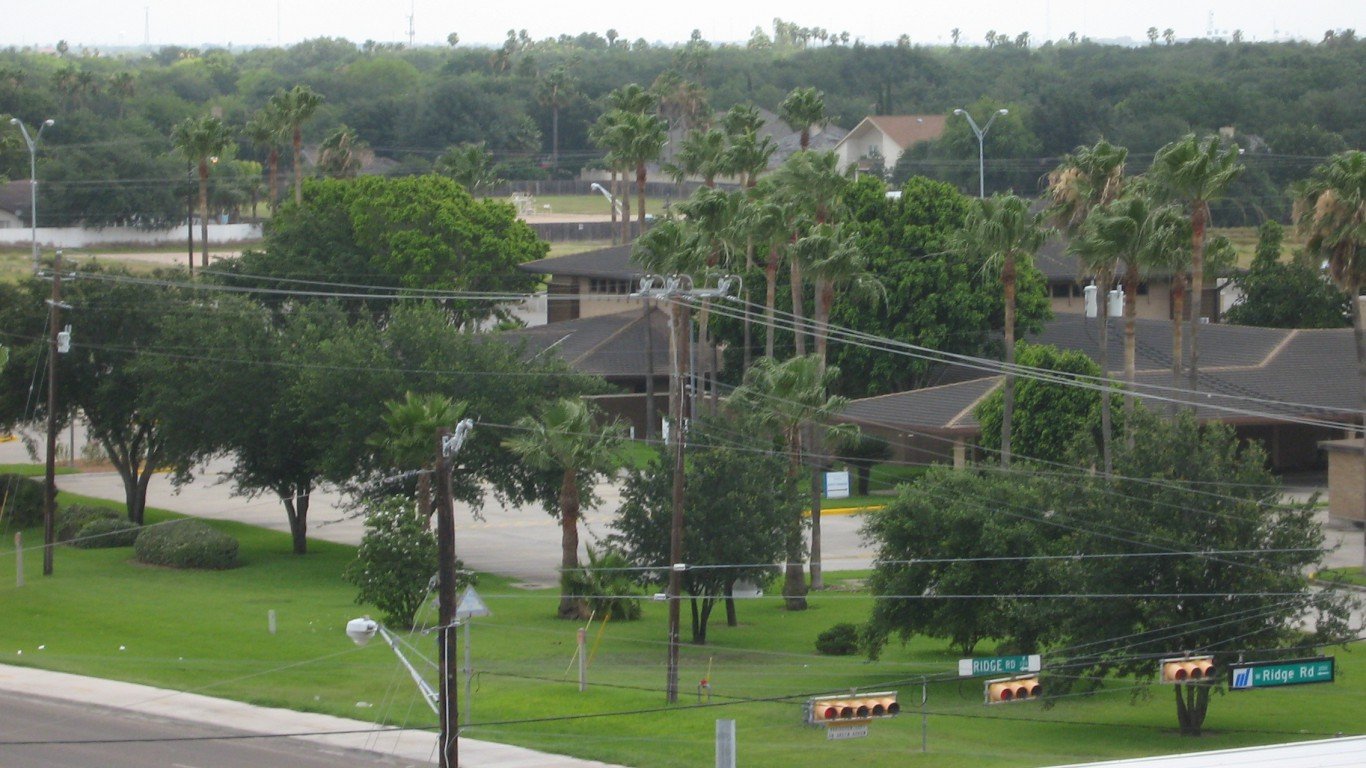
Texas: McAllen-Edinburg-Mission
> Poverty rate: 27.3% (Texas: 13.6%)
> Number of people living below poverty line: 234,015 (Texas: 3,865,010)
> Households receiving SNAP benefits: 27.1% (Texas: 10.8%)
> Median household income: $41,800 (Texas: $64,034)

Utah: Logan
> Poverty rate: 14.7% (Utah: 8.9%)
> Number of people living below poverty line: 20,441 (Utah: 281,279)
> Households receiving SNAP benefits: 5.6% (Utah: 5.5%)
> Median household income: $61,467 (Utah: $75,780)
[in-text-ad-2]

Vermont: Burlington-South Burlington*
> Poverty rate: 11.4% (Vermont: 10.2%)
> Number of people living below poverty line: 23,934 (Vermont: 60,897)
> Households receiving SNAP benefits: 7.9% (Vermont: 10.0%)
> Median household income: $74,909 (Vermont: $63,001)
*Because Burlington-South Burlington is the only eligible metro in Vermont, it is the metro with the highest poverty rate by default.
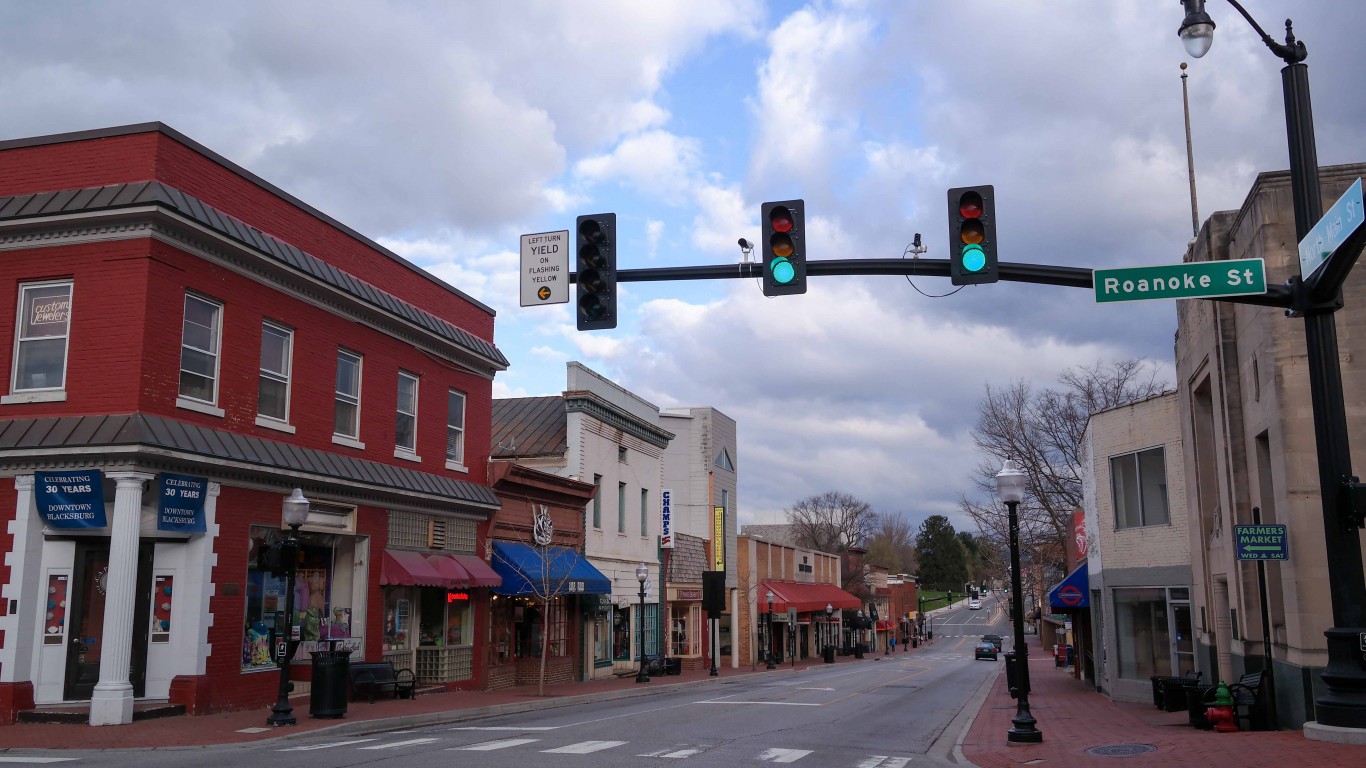
Virginia: Blacksburg-Christiansburg
> Poverty rate: 22.9% (Virginia: 9.9%)
> Number of people living below poverty line: 34,759 (Virginia: 822,775)
> Households receiving SNAP benefits: 7.8% (Virginia: 7.8%)
> Median household income: $56,092 (Virginia: $76,456)
[in-text-ad]

Washington: Yakima
> Poverty rate: 16.9% (Washington: 9.8%)
> Number of people living below poverty line: 41,667 (Washington: 730,240)
> Households receiving SNAP benefits: 19.6% (Washington: 10.6%)
> Median household income: $56,233 (Washington: $78,687)
[recirclink id=931307]

West Virginia: Morgantown
> Poverty rate: 20.1% (West Virginia: 16.0%)
> Number of people living below poverty line: 26,054 (West Virginia: 278,734)
> Households receiving SNAP benefits: 10.3% (West Virginia: 16.9%)
> Median household income: $56,395 (West Virginia: $48,850)

Wisconsin: Janesville-Beloit
> Poverty rate: 13.5% (Wisconsin: 10.4%)
> Number of people living below poverty line: 21,405 (Wisconsin: 591,486)
> Households receiving SNAP benefits: 14.5% (Wisconsin: 9.4%)
> Median household income: $61,243 (Wisconsin: $64,168)
[in-text-ad-2]

Wyoming: Cheyenne*
> Poverty rate: 9.8% (Wyoming: 10.1%)
> Number of people living below poverty line: 9,469 (Wyoming: 56,945)
> Households receiving SNAP benefits: 6.8% (Wyoming: 4.7%)
> Median household income: $70,567 (Wyoming: $65,003)
*Because Cheyenne is the only eligible metro in Wyoming, it is the metro with the highest poverty rate by default.
Methodology:
To determine the metro with the highest poverty rate in every state, 24/7 Wall St. reviewed one-year estimates of the percentage of people who live below the poverty line in each metropolitan area from the U.S. Census Bureau’s 2019 American Community Survey.
We used the 384 metropolitan statistical areas as delineated by the United States Office of Management and Budget and used by the Census Bureau as our definition of metros.
Metros were excluded if 25% or more of a ZIP code’s population were enrolled in undergraduate, professional, or graduate school during the same period, or if the sampling error associated with a metro’s data was deemed too high.
The sampling error was defined as too high if the coefficient of variation — a statistical assessment of how reliable an estimate is — for a metro’s poverty rate was above 15% and greater than two standard deviations above the mean CV for all metros’ poverty rates. We similarly excluded metros that had a sampling error too high for their population, using the same definition.
Since many metros cross state lines, the metro was assigned to the state of its first-listed principal city. Thus, the Washington-Arlington-Alexandria, DC-VA-MD-WV metro area was excluded as it is principally in the District of Columbia.
The remaining 367 metros were ranked within their state based on their poverty rates. Additional information on the number of people living below the poverty line, median household income, and the share of households receiving SNAP benefits are also one-year estimates from the 2019 ACS.
Contact [email protected] for any questions or corrections.