[cnxvideo id=”f4b2e6a6-657c-40a8-9220-d4b960e435a6″ placement=”ros”]
It has been more than five decades since the Fair Housing Act of 1968 outlawed housing discrimination on the basis of race, sex, national origin, and religion, and still segregation persists in some of America’s largest cities, with white Americans living in majority-white neighborhoods and Black Americans in majority-Black neighborhoods.
The patterns of segregation in many major metropolitan areas can be traced back to laws and legal racial housing policies of the early 20th century used to exclude Black residents from certain neighborhoods. Even after the Supreme Court began to ban explicitly racist zoning policies in the mid-20th century, governments used the federally-backed Home Owners’ Loan Corporation to continue segregation policies.
The HOLC created “residential security” maps according to investment risk, often redlining Black neighborhoods as “hazardous” areas. According to advocacy group National Community Reinvestment Coalition, 74% of the neighborhoods that the HOLC designated as high risk or “hazardous” are low-to-moderate income neighborhoods today, and 64% are minority neighborhoods.
Many of the most segregated cities experienced a period of economic decline starting in the 1960s as wealthy white families moved from the inner city to outlying suburbs, leaving behind families without the resources to move with a shrunken tax base and declining infrastructure.
To identify the most segregated cities in America, 24/7 Wall St. calculated the percentage of Black residents who live in predominantly Black census tracts — where at least 50% of the population is Black.
Nationwide, 19.5% of Black Americans live in majority-Black neighborhoods. Segregation often limits access to education and employment opportunities for residents of minority communities and contributes to racial disparities in urban areas.
One important lasting effect of the history of racial housing segregation is the resultant school funding disparities between schools in primarily Black neighborhoods and those in primarily white neighborhoods. While schools today are integrated, housing segregation and district gerrymandering means that primarily white school districts in some parts of the country stayed mostly white and consequently received better funding.
Adult residents of majority-Black neighborhoods in highly segregated cities are less likely to have a college education than residents of predominantly white neighborhoods, and they are twice as likely to be unemployed or to live in poverty. Due in part to these disparities, some of the most segregated cities in America also rank among the worst cities for Black Americans.
Click here to see the most segregated cities in America.
Click here to see our methodology.
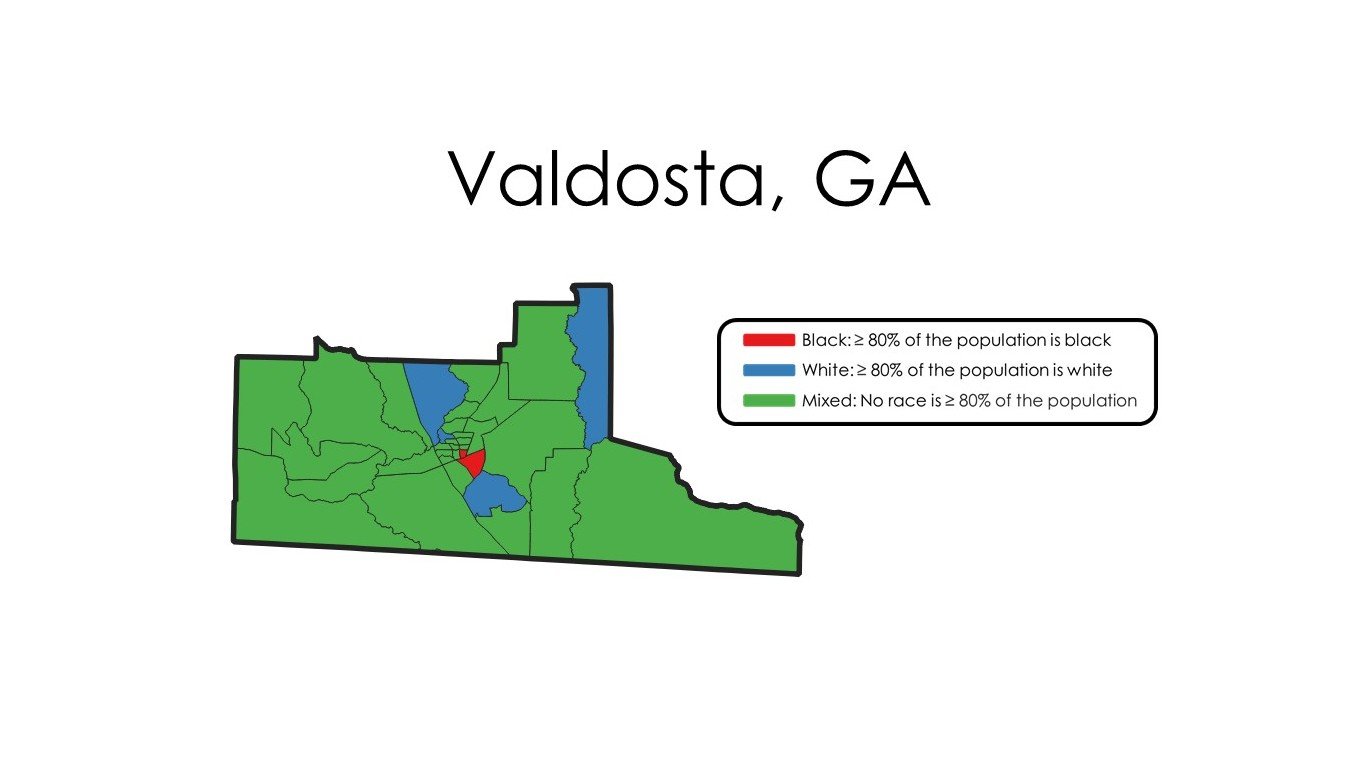
25. Valdosta, GA
> Black pop. in Black neighborhoods: 57.9% (29,016)
> Black population: 34.5% (50,146)
> Black poverty rate: 37.1% (17,835)
> White poverty rate: 15.9% (13,235)
One of six metropolitan areas in Georgia to rank among the most racially segregated places in the United States, 57.9% of Valdosta’s Black population lives in a neighborhood where at least half the population is Black, compared to a national share of 19.5%. Meanwhile, 86.4% of white residents in Valdosta live in primarily white neighborhoods.
Residents of poor, segregated minority neighborhoods often lack access to education and employment opportunities and face major economic disadvantages that can lead to high rates of poverty and unemployment. In Valdosta, 37.1% of Black residents live in poverty, compared to just 15.9% of white residents.
[in-text-ad]
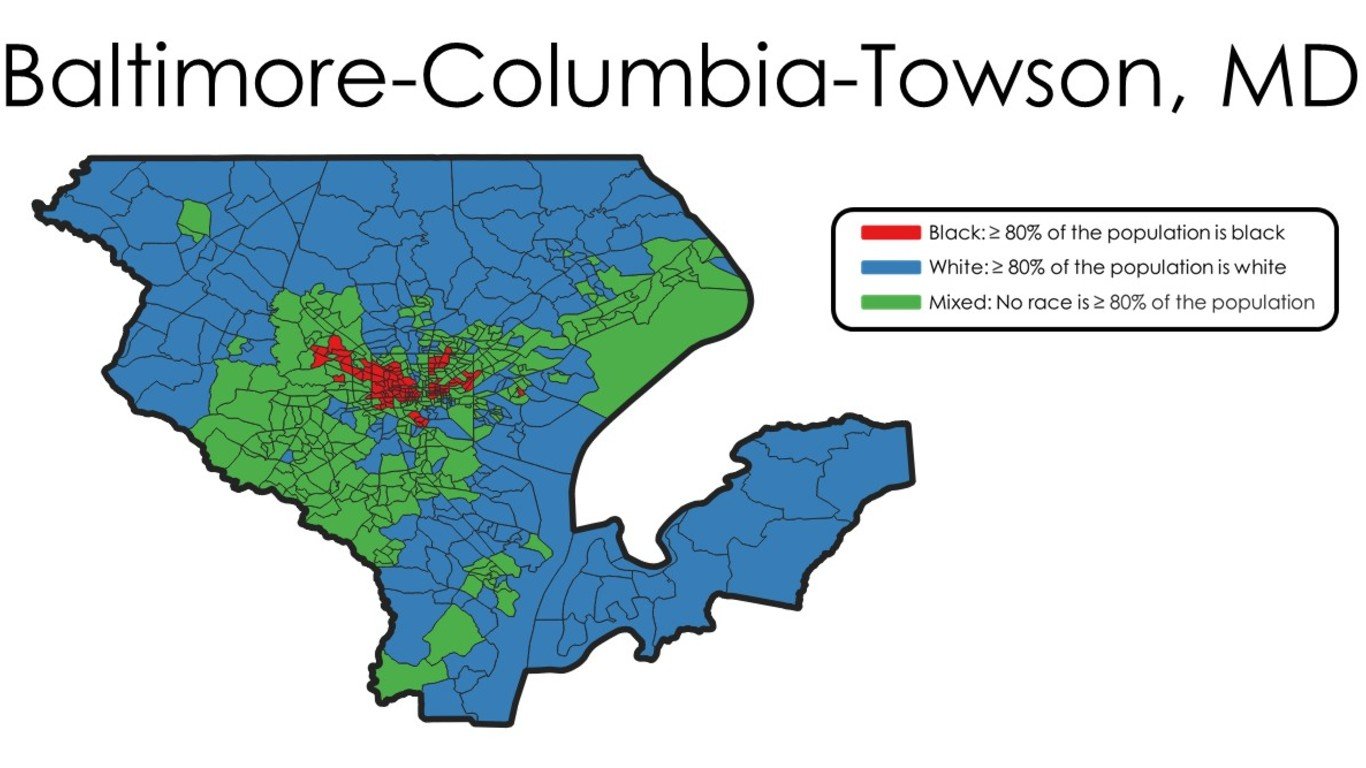
24. Baltimore-Columbia-Towson, MD
> Black pop. in Black neighborhoods: 58.8% (474,949)
> Black population: 28.9% (807,182)
> Black poverty rate: 17.7% (139,981)
> White poverty rate: 6.4% (104,504)
Despite being one of the first cities targeted by the Congress of Racial Equality to end racial injustice during the civil rights movement, Baltimore continues to be one of the most segregated cities in the country. An estimated 58.8% of Black residents live in predominantly Black neighborhoods, far greater than the 19.5% of Black Americans living in Black neighborhoods nationwide.
Segregation can limit access to education and employment opportunities for minorities and can contribute to racial disparities in urban areas. Just 23.8% of adults in majority-Black neighborhoods in Baltimore have a bachelor’s degree, far less than the 45.6% college attainment rate in white neighborhoods. In the metropolitan area, 19.2% of residents of majority-Black neighborhoods live in poverty, nearly three times the 6.6% poverty rate in primarily white neighborhoods.
[recirclink id=838602]
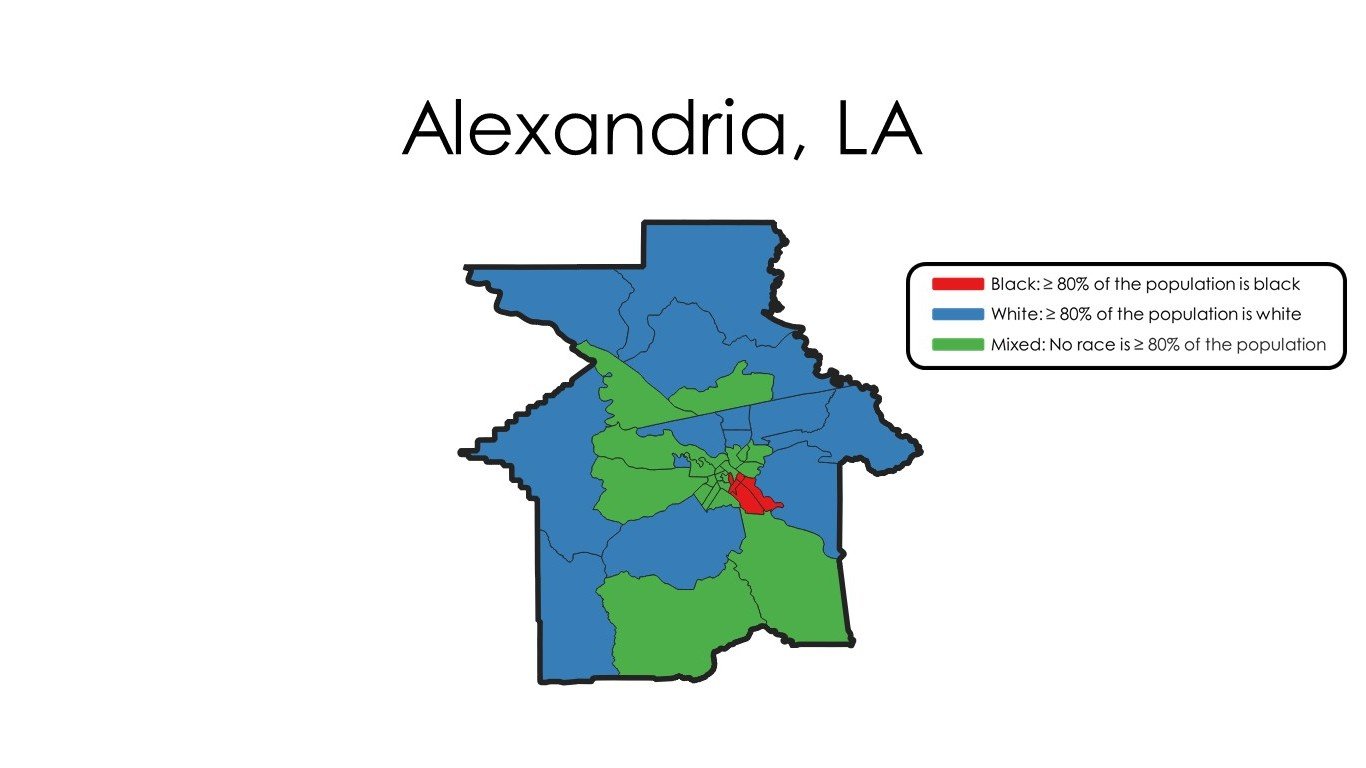
23. Alexandria, LA
> Black pop. in Black neighborhoods: 59.0% (26,362)
> Black population: 29.2% (44,695)
> Black poverty rate: 34.7% (14,674)
> White poverty rate: 12.2% (11,864)
Just under 30% of the Alexandria, Louisiana, metropolitan area’s population is Black. Almost 60% of that group, roughly 26,400 people, live in a primarily Black neighborhood. Meanwhile, nearly 90% of the city’s white population lives in a majority-white neighborhood.
While one of the resultant policies of the civil rights movement was the integration of public schools, many communities were slow to integrate. The Rapides Parish School District, which is part of the metro area, was sued in 1969 for failing to uphold Brown vs. the Board of Education. In 1980, in response to a district judge’s move to desegregate the region’s schools through busing, a group of white parents in Buckeye — which is part of the Alexandria metro area — gained regional fame for signing custody of their children over to people living in another district to avoid sending their children to a majority Black school.

22. Macon-Bibb County, GA
> Black pop. in Black neighborhoods: 59.0% (60,617)
> Black population: 44.8% (102,727)
> Black poverty rate: 31.5% (31,280)
> White poverty rate: 12.8% (14,408)
In the Macon, Georgia, metropolitan area, an estimated 59.0% of Black residents live in predominantly Black neighborhoods, nearly triple the 19.5% national figure. Residential segregation has likely contributed to de facto school segregation in Macon and surrounding Bibb County. According to local newspaper The Telegraph, the proportion of white students in Bibb County public schools was 32% two decades ago and declined to 18% as of 2016, an over 40% drop.
Educational segregation likely exacerbates racial disparities in educational attainment. Just 14.6% of adults in majority-Black neighborhoods in Macon have a bachelor’s degree, far less than the 28.3% college attainment rate in majority-white neighborhoods.
[in-text-ad-2]
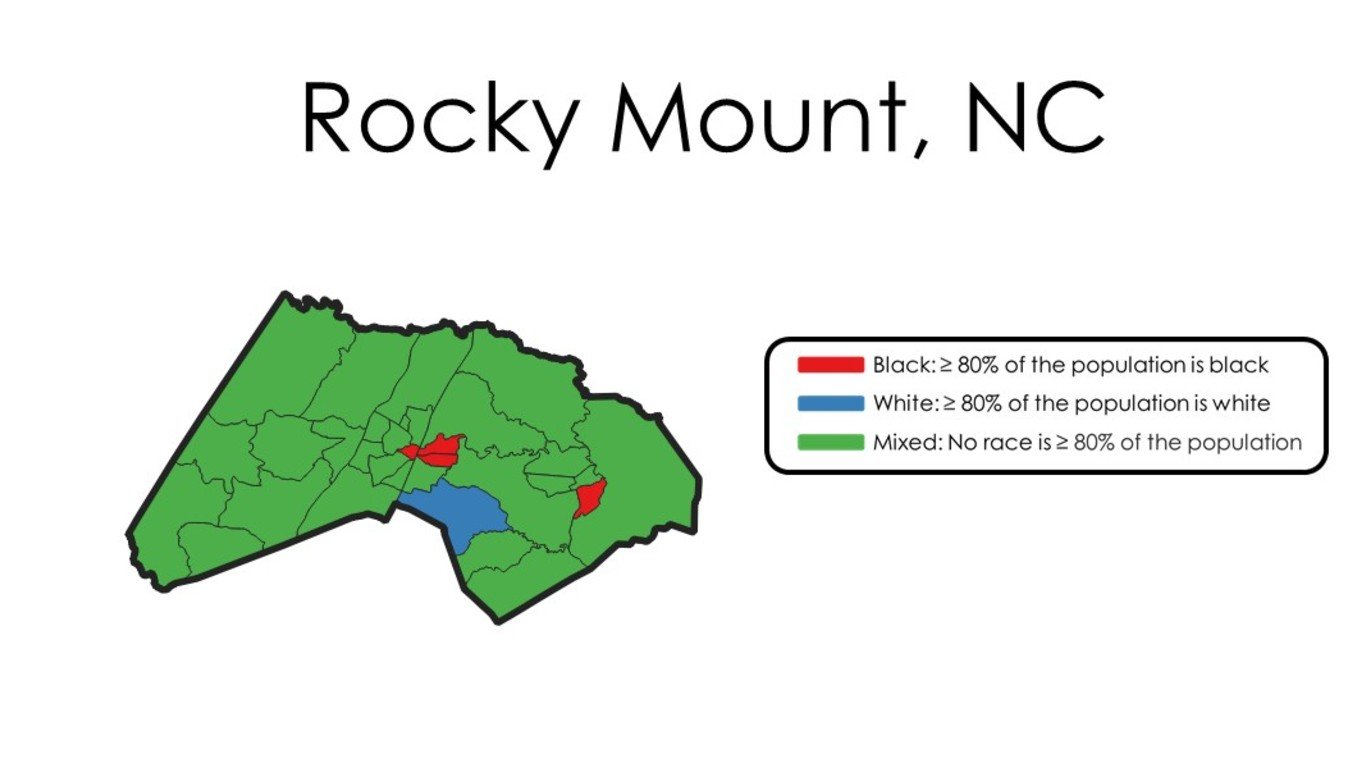
21. Rocky Mount, NC
> Black pop. in Black neighborhoods: 59.8% (40,108)
> Black population: 45.8% (67,117)
> Black poverty rate: 24.4% (16,120)
> White poverty rate: 11.9% (8,125)
Nearly 60% of the Black residents of Rocky Mount, North Carolina, live in a neighborhood that is primarily Black. Residents of poor, segregated minority neighborhoods often lack access to education and employment opportunities and face major economic disadvantages that can lead to high rates of poverty and unemployment. In Rocky Mount, the poverty rate in majority-Black neighborhoods is 21.5%, compared to the 15.5% in primarily white neighborhoods. That disparity is actually lower than in many other highly-segregated metropolitan areas.
Homeownership is usually an indicator of financial stability. In Rocky Mount’s majority-white neighborhoods, 74.6% of households live in a home they own, compared to a homeownership rate of 49.1% in primarily Black neighborhoods.
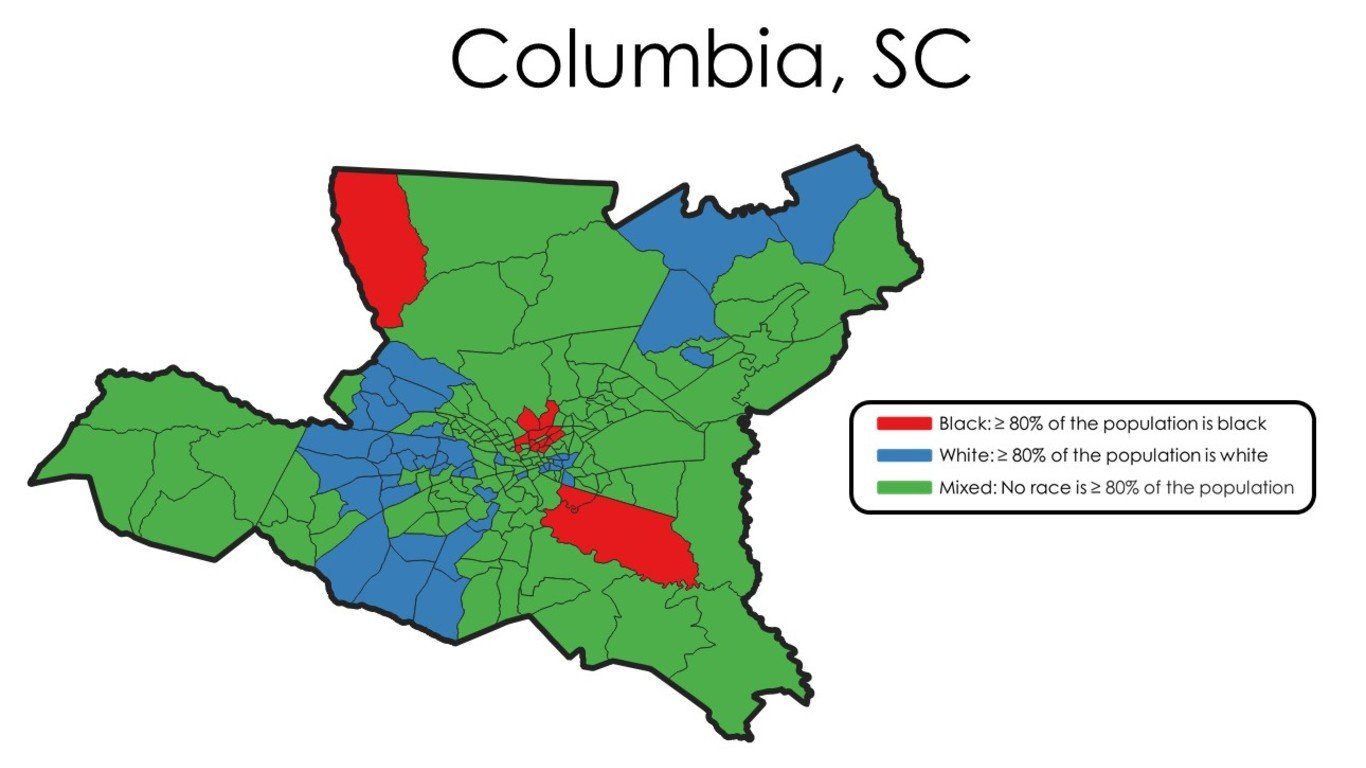
20. Columbia, SC
> Black pop. in Black neighborhoods: 61.2% (166,972)
> Black population: 33.1% (273,020)
> Black poverty rate: 20.9% (55,237)
> White poverty rate: 10.7% (50,479)
While nationwide 19.5% of Black Americans live in predominantly Black neighborhoods, 61.2% of Black residents in Columbia, South Carolina, do. Socioeconomic racial inequalities are often made worse by segregation. An estimated 20.9% of the Columbia Black population live in poverty, more than twice the 10.7% area white poverty rate. Similarly, 8.1% of the labor force in predominantly Black neighborhoods in Columbia is unemployed, compared to the 5.0% unemployment rate in majority-white neighborhoods in the metro area.
[in-text-ad]
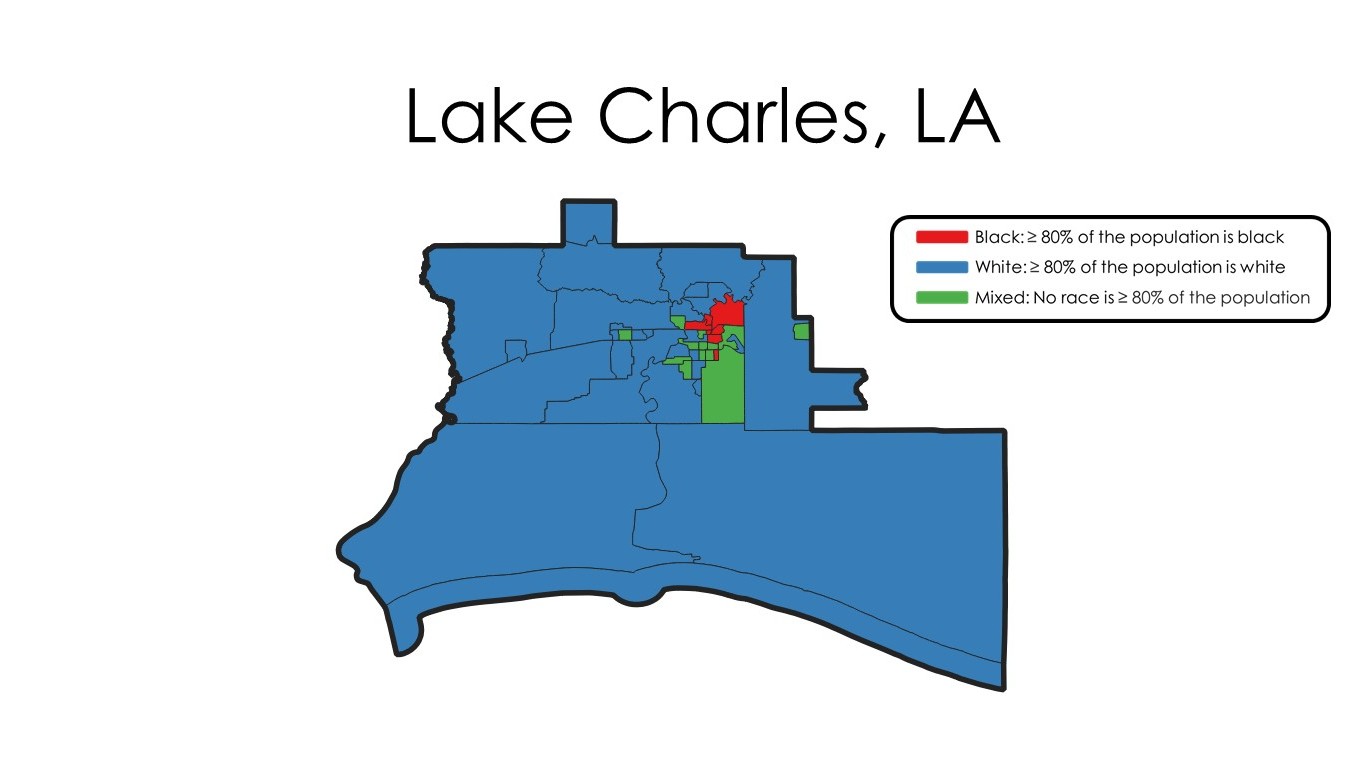
19. Lake Charles, LA
> Black pop. in Black neighborhoods: 61.2% (30,764)
> Black population: 24.1% (50,246)
> Black poverty rate: 28.5% (13,962)
> White poverty rate: 12.7% (18,492)
Lake Charles is one of six metro areas in Louisiana to rank among the most segregated places in America. More than 60% of Black residents live in predominantly Black neighborhoods, and 94.1% of white residents live in predominantly white neighborhoods — each greater than the national shares of 19.5% and 93.5%, respectively.
Segregation can reduce access to education and employment opportunities for minorities and exacerbate racial disparities. In Lake Charles, the median income of white households is $26,146 greater than the median income for Black households, and Black residents are more than twice as likely as white residents to be unemployed. While 12.7% of white residents live in poverty, 28.5% of Black residents do — a larger poverty gap than across the nation as a whole.
[recirclink id=837736]
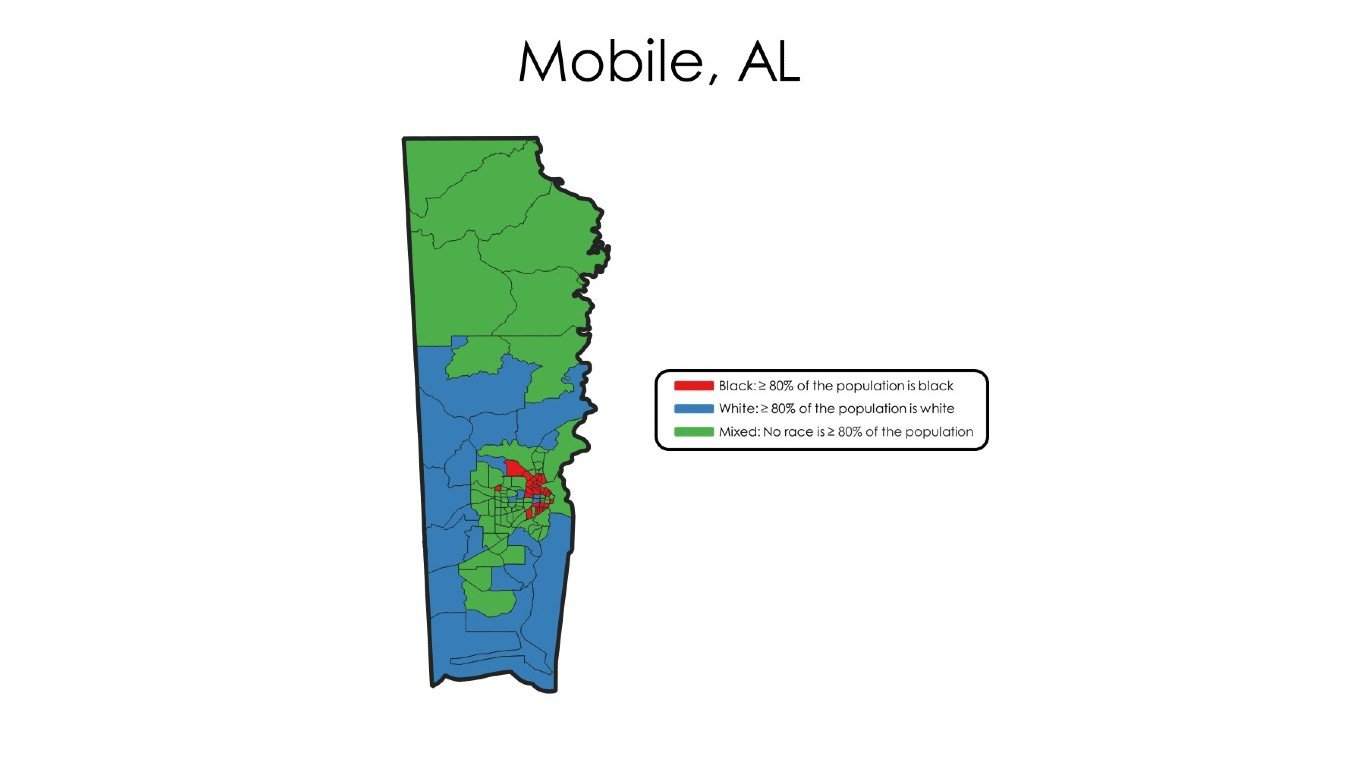
18. Mobile, AL
> Black pop. in Black neighborhoods: 62.4% (94,349)
> Black population: 35.1% (151,080)
> Black poverty rate: 28.3% (42,039)
> White poverty rate: 13.0% (32,511)
Mobile, Alabama, is one of five metro areas at least partially in Alabama to rank among the most segregated cities in America. An estimated 62.4% of Black residents in the metro area live in predominantly Black census tracts, more than three times the 19.5% national figure.
Residents of poor, segregated minority neighborhoods often lack access to education and employment opportunities and face major economic disadvantages that can lead to high rates of poverty and unemployment. In Mobile, the poverty rate in majority-Black neighborhoods is 28.1%, nearly twice the poverty rate of 14.7% in primarily white neighborhoods.

17. Shreveport-Bossier City, LA
> Black pop. in Black neighborhoods: 62.5% (99,152)
> Black population: 39.7% (158,575)
> Black poverty rate: 33.5% (52,136)
> White poverty rate: 12.8% (27,790)
In Shreveport, Louisiana, 62.5% of Black residents live in neighborhoods where at least half of residents are also Black, compared to 19.5% of Black Americans nationwide. Shreveport is a good example of how housing segregation often coincides with concentrated poverty and the socioeconomic outcomes associated with poverty, such as unemployment and low educational attainment. In Shreveport, 34.3% of people living in majority-Black neighborhoods earn poverty-level incomes, compared to just 13.9% of those living in primarily white neighborhoods. In majority Black neighborhoods, adults are less than half as likely to have a college education compared to those in white neighborhoods.
In the mid-20th century, highway and urban renewal projects were often constructed in poor, Black neighborhoods, displacing thousands of families and physically separating minority communities from the rest of the city. In Shreveport, plans are currently underway for a new 3.5-mile stretch of Interstate 49 that would run through the middle of the historically Black neighborhood of Allendale and require the demolition of homes built in the area.
[in-text-ad-2]
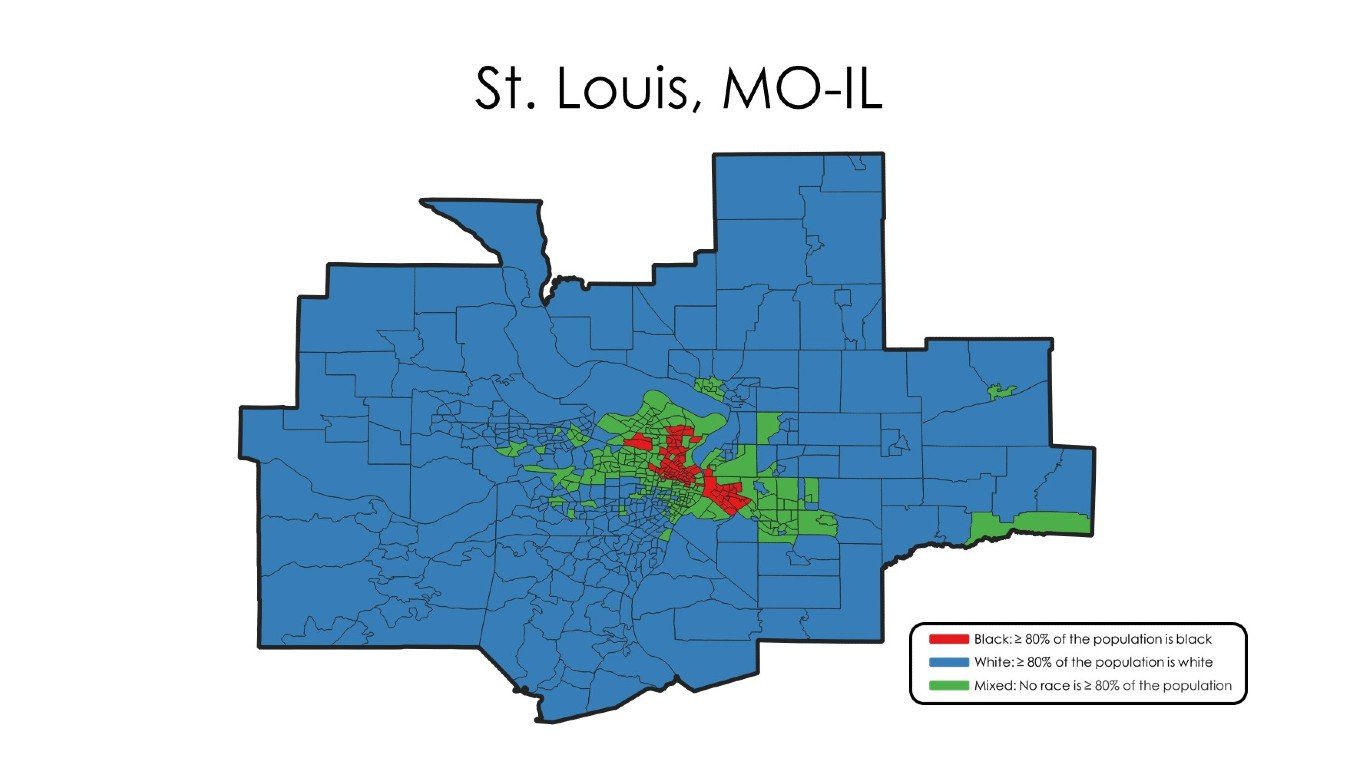
16. St. Louis, MO-IL
> Black pop. in Black neighborhoods: 62.7% (318,709)
> Black population: 18.1% (508,558)
> Black poverty rate: 24.9% (123,718)
> White poverty rate: 7.8% (162,412)
An estimated 62.7% of Black residents in the St. Louis metro area live in census tracts where more than half of residents are also Black, more than three times the 19.5% national figure. Just 18.5% of adults in predominantly Black neighborhoods have a bachelor’s degree, compared to 37.2% of adults in primarily white neighborhoods. In addition, 25.1% of residents in Black neighborhoods live in poverty, nearly three times the 8.6% poverty rate in white neighborhoods.
Segregation in St. Louis is largely delineated by Delmar Boulevard, an east-west thoroughfare that divides the poor, predominantly Black neighborhoods in the north from the wealthier, predominantly white neighborhoods in the south.
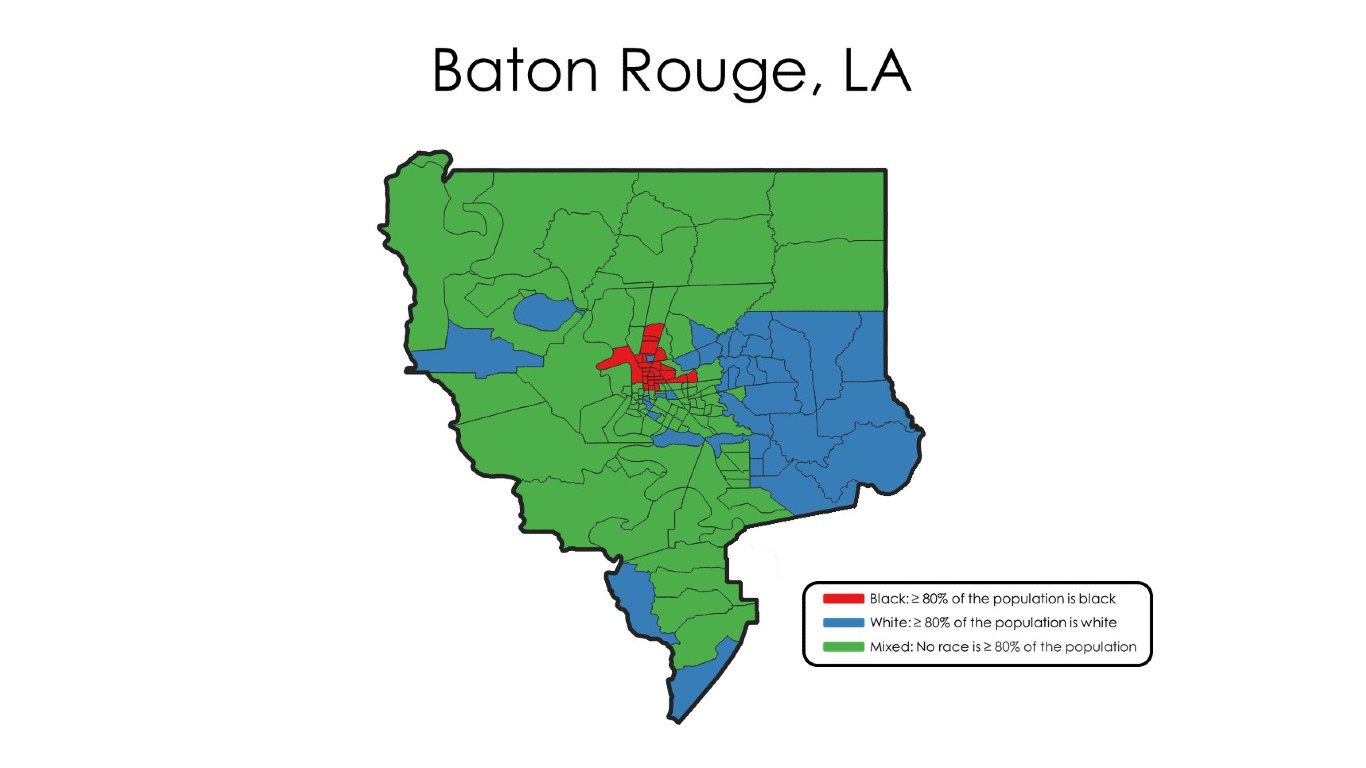
15. Baton Rouge, LA
> Black pop. in Black neighborhoods: 63.0% (189,065)
> Black population: 35.1% (300,256)
> Black poverty rate: 25.0% (72,320)
> White poverty rate: 10.3% (51,277)
While nationwide 19.5% of Black Americans live in predominantly Black neighborhoods, 63.3% of Black residents in Baton Rouge, Louisiana, do. Socioeconomic racial inequalities are often made worse by segregation, and the typical white household in Baton Rouge makes $34,717 more a year than the typical Black households — a $10,000 larger gap than the $24,601 white-Black income gap nationwide. An estimated 25.0% of the Baton Rouge Black population live in poverty, more than twice the 10.3% area white poverty rate.
Segregation in Baton Rouge is largely demarcated by Florida Boulevard, an east-west thoroughfare that separates the mostly Black neighborhoods in the north side of the city from the largely white neighborhoods in the south side.
[in-text-ad]
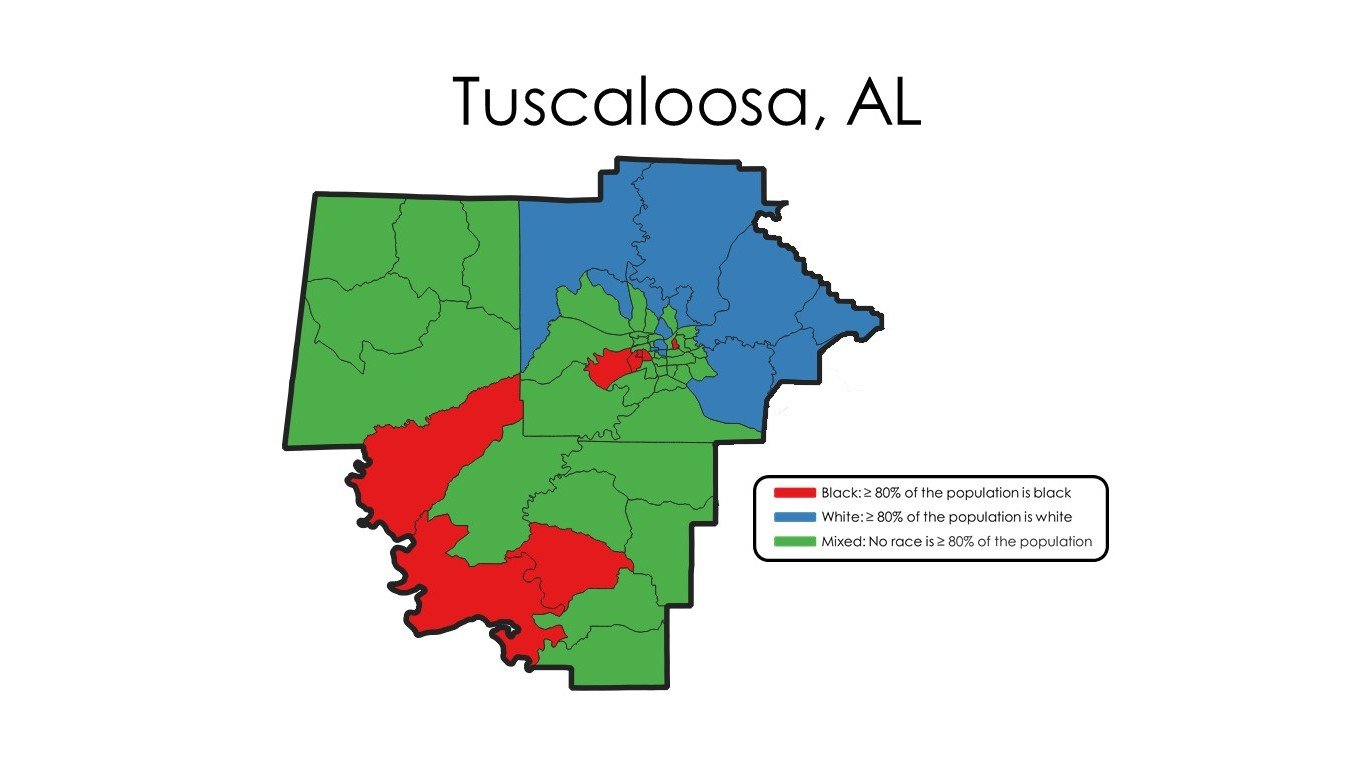
14. Tuscaloosa, AL
> Black pop. in Black neighborhoods: 63.0% (56,462)
> Black population: 35.7% (89,584)
> Black poverty rate: 30.1% (26,314)
> White poverty rate: 11.9% (16,947)
On June 9, 1964, known today as “Bloody Tuesday,” a group of marchers went to the Tuscaloosa County Courthouse to remove whites-only signs at drinking fountains and restrooms. They were tear-gassed and beaten by police, resulting in 33 hospitalizations. A month later, the Civil Rights Act of 1964 would be passed.
To this day, Tuscaloosa remains one of the most segregated metro areas in the country. Of the city’s roughly 90,000 Black residents, 63% live in majority-Black neighborhoods, compared to 19.5% of Black Americans nationwide.
Segregation can limit education and employment opportunities for minority communities and can contribute to racial disparities in urban areas. In Tuscaloosa, just 19.7% of adults in majority-Black neighborhoods have a bachelor’s degree, compared to 32.1% of adults in majority-white neighborhoods.
[recirclink id=837556]
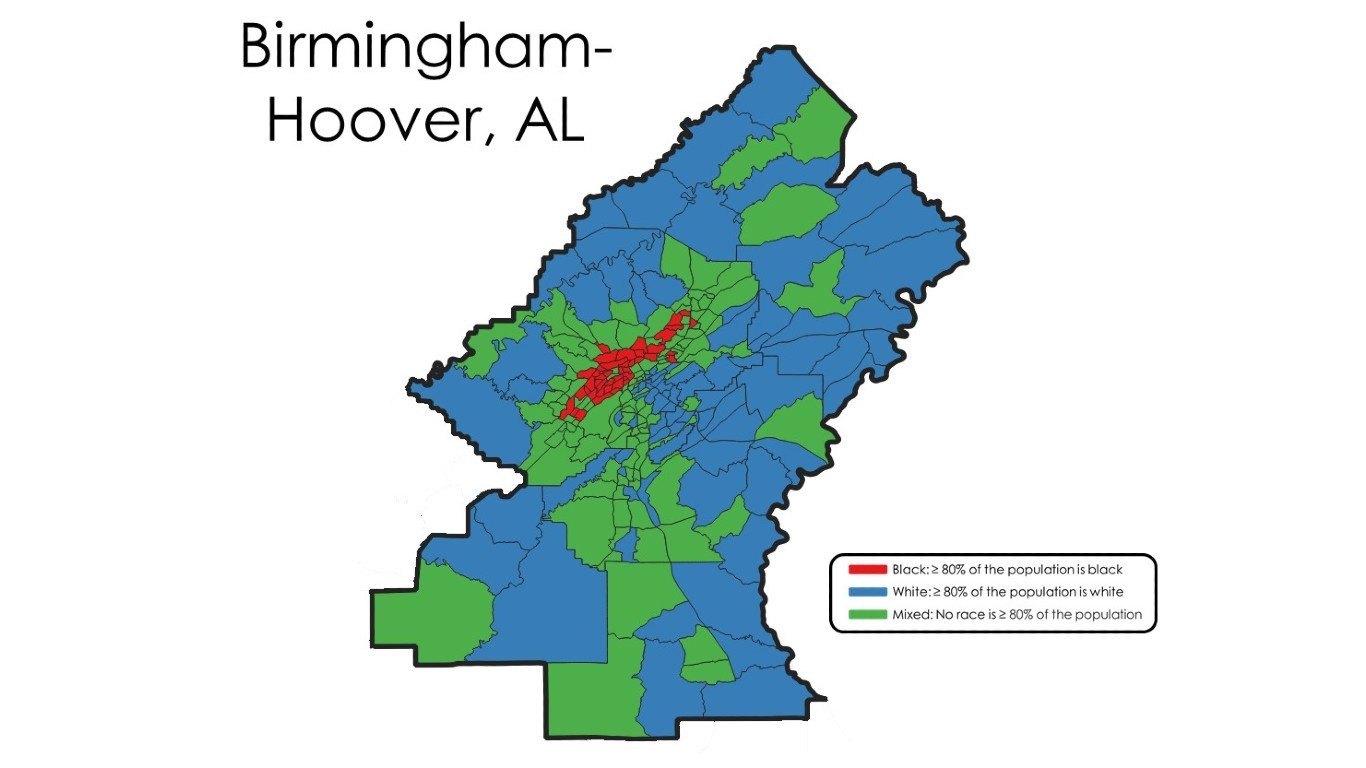
13. Birmingham-Hoover, AL
> Black pop. in Black neighborhoods: 63.9% (208,523)
> Black population: 30.1% (326,349)
> Black poverty rate: 22.5% (71,833)
> White poverty rate: 9.6% (66,074)
One of the most important early battlegrounds of the civil rights movement, the Birmingham metro area is one of five metropolitan areas at least partially in Alabama to rank among the most segregated cities in America. An estimated 63.9% of Black residents in Birmingham-Hoover live in predominantly Black census tracts, more than three times the 19.5% national figure.
Segregation often limits education and employment opportunities for poor minority communities, and it can exacerbate racial disparities in urban areas. In Birmingham, the typical white household earns $27,910 more a year than the typical Black household, slightly more than the national disparity in median household income of $24,601. Similarly, Black residents in Birmingham are more than twice as likely as white residents to live in poverty.
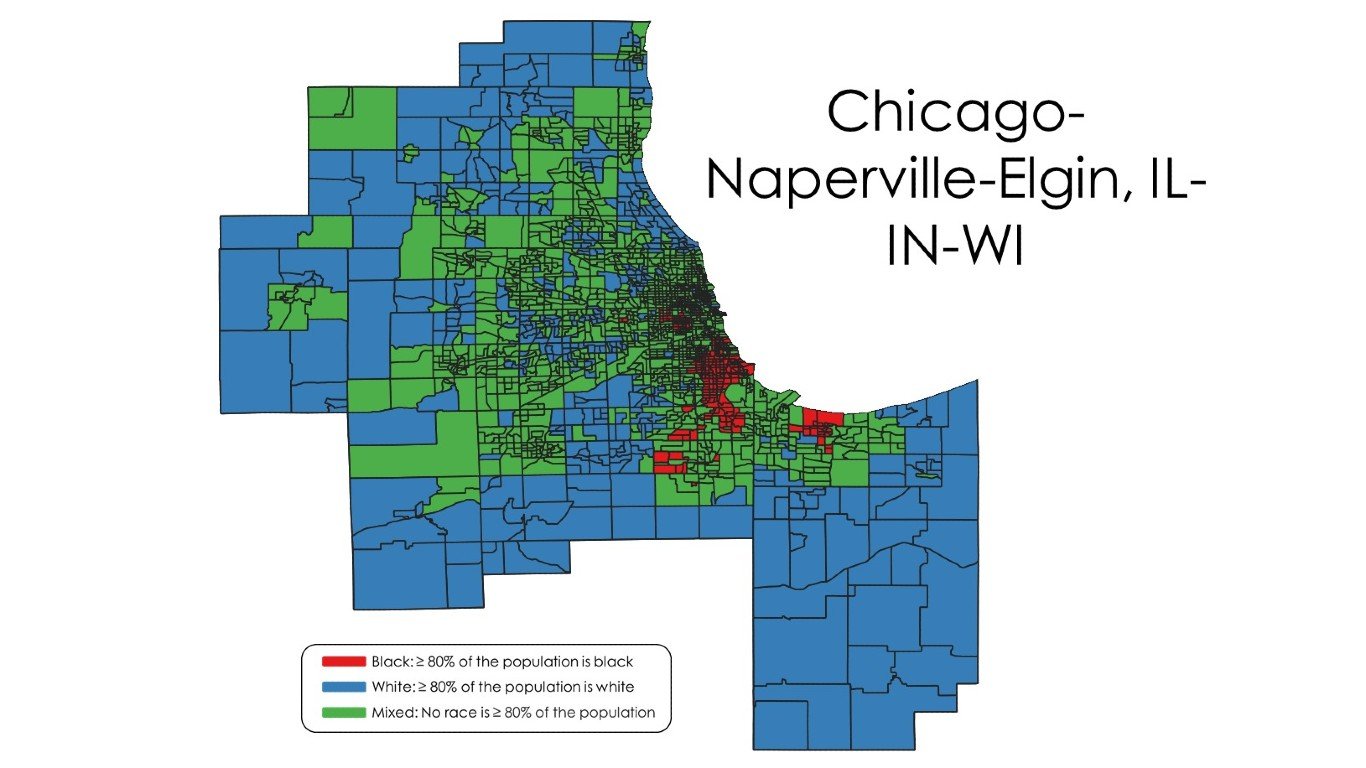
12. Chicago-Naperville-Elgin, IL-IN-WI
> Black pop. in Black neighborhoods: 64.3% (994,372)
> Black population: 16.3% (1,546,992)
> Black poverty rate: 24.4% (375,073)
> White poverty rate: 8.1% (496,332)
Like in many Midwestern cities, government officials and property owners in Chicago used discriminatory zoning practices and racially restrictive housing covenants to exclude Black residents from certain neighborhoods in the 20th century. Property in as much as 80% of the city was bound by restrictive covenants by 1927, with Black residents mostly limited to an area known as the “Black Belt” in South Side Chicago.
Today, 64.3% of Chicago’s 1.5 million Black residents live in majority-Black neighborhoods, many in the South Side. Residents of majority-Black neighborhoods are less than half as likely to have obtained a bachelor’s degree as residents of predominantly white neighborhoods, and they are more than three times as likely to be unemployed.
[in-text-ad-2]
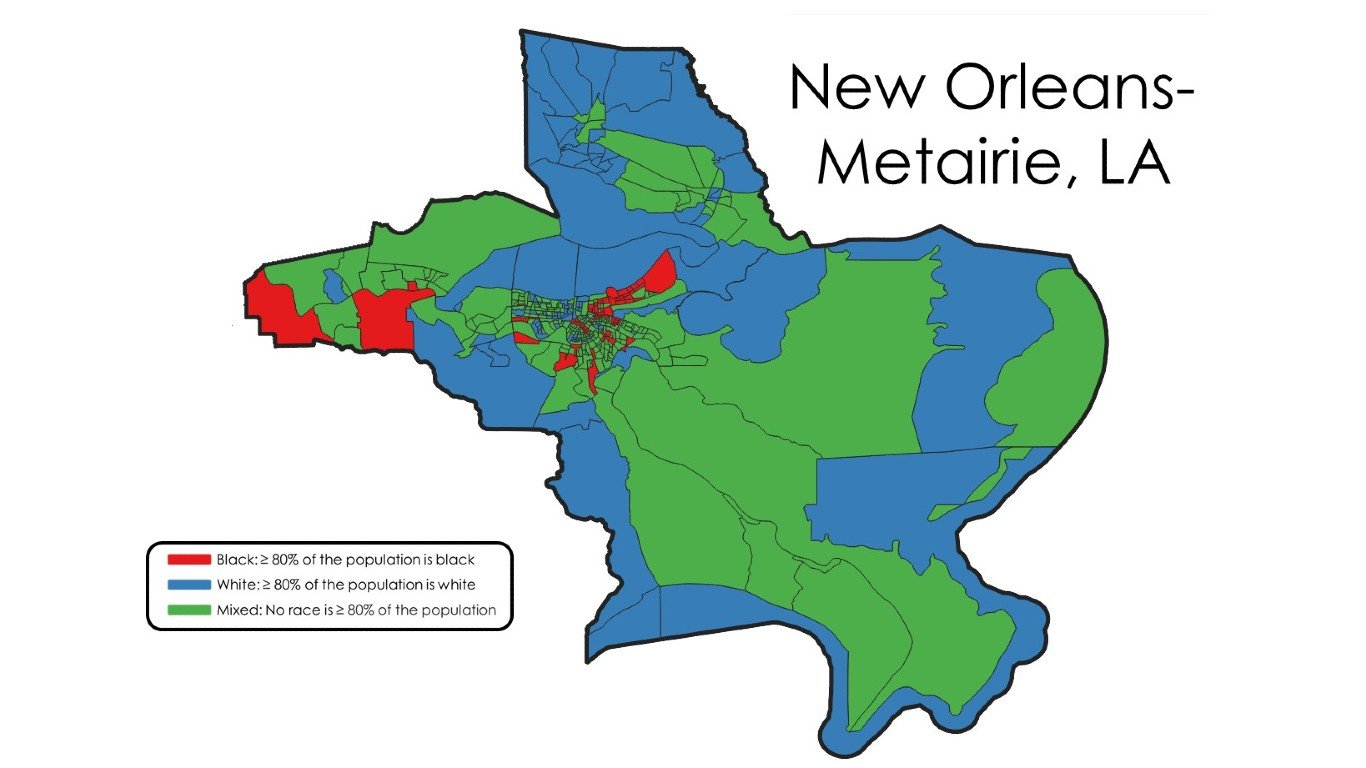
11. New Orleans-Metairie, LA
> Black pop. in Black neighborhoods: 64.4% (282,047)
> Black population: 34.6% (439,281)
> Black poverty rate: 27.8% (120,676)
> White poverty rate: 10.7% (76,496)
Like many major U.S. cities, current patterns of segregation in New Orleans were shaped by racist zoning ordinances in the early 20th century, discriminatory, federally-backed appraisal maps starting in the 1930s, and urban renewal projects that further separated majority-Black neighborhoods. Projects such as the Louis Armstrong Park, the Greater New Orleans Bridge, and the Claiborne Avenue elevated highway in the 1950s and 1960s displaced large numbers of Black families.
Hurricane Katrina and its aftermath also contributed to segregation in the New Orleans metro area, as rebuilding funds were continuously allocated to higher-value, predominantly white neighborhoods over predominantly Black neighborhoods. Today, 64.4% of Black residents in New Orleans live in predominantly Black neighborhoods, far more than the 19.5% national rate.
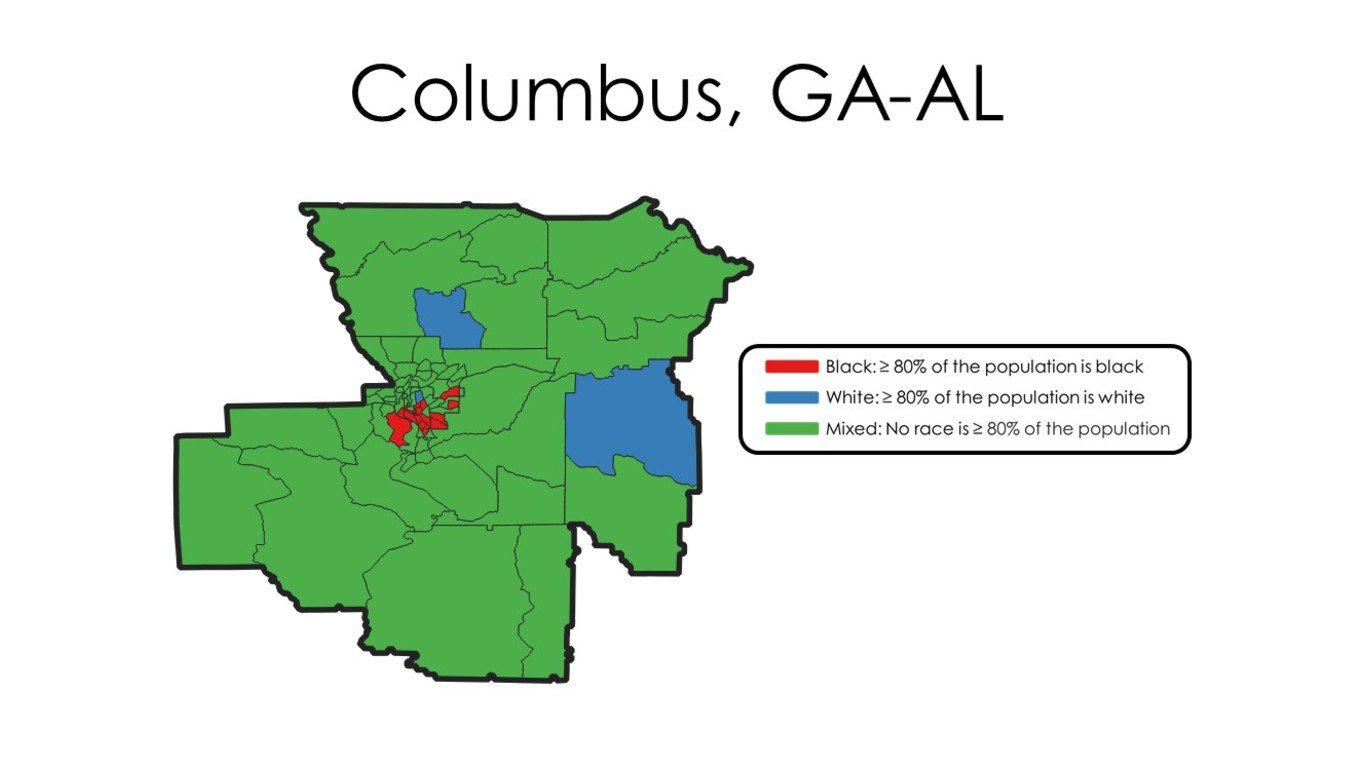
10. Columbus, GA-AL
> Black pop. in Black neighborhoods: 64.6% (84,954)
> Black population: 41.2% (131,534)
> Black poverty rate: 27.2% (34,781)
> White poverty rate: 11.4% (17,156)
Columbus is one of four metro areas in Georgia to rank among the 25 most segregated cities in America. An estimated 64.6% of Black residents in the Columbus metro area live in predominantly Black neighborhoods, more than three times the 19.5% national figure.
Segregation can limit education and employment opportunities for minority communities and contribute to racial disparities in urban areas. In Columbus, the poverty rate in Black neighborhoods of 28.2% is close to three times greater than the poverty rate in majority-white neighborhoods of 12.1%.
[in-text-ad]
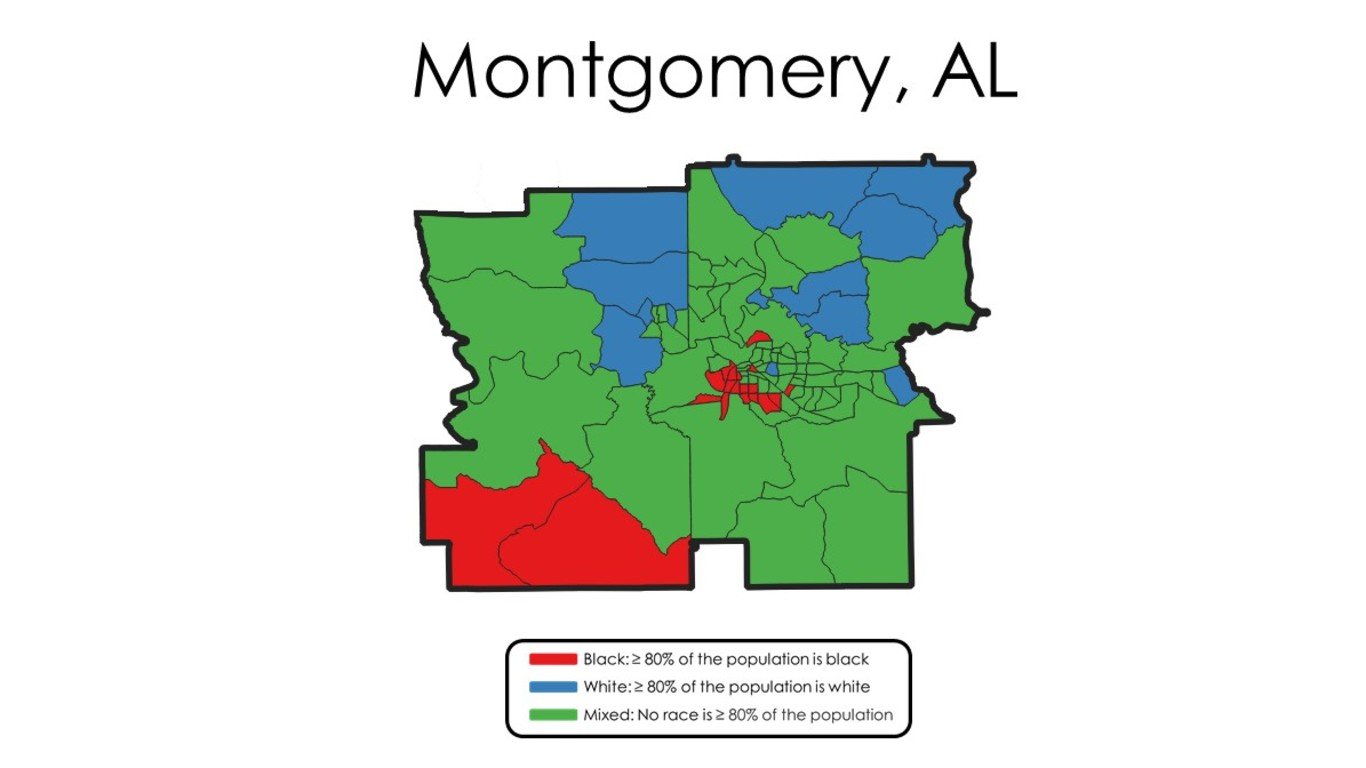
9. Montgomery, AL
> Black pop. in Black neighborhoods: 65.5% (108,868)
> Black population: 44.5% (166,402)
> Black poverty rate: 25.8% (41,227)
> White poverty rate: 9.6% (17,528)
More than 60 years after the Montgomery, Alabama, bus boycott became the event recognized as the beginning of the U.S. civil rights movement, Montgomery remains one of the most segregated cities in America. An estimated 65.5% of Black city residents live in majority-Black neighborhoods, compared to 19.5% of Black Americans nationwide. Also, 27.3% of residents in Black neighborhoods live in poverty, compared to 11.2% of residents in primarily white neighborhoods.
Like many segregated cities, urban renewal and highway infrastructure projects in Montgomery in the mid-20th century, such as the construction of interstates 65 and 85, displaced hundreds of Black families and cut off minority communities from the larger metro area.
[recirclink id=839643]
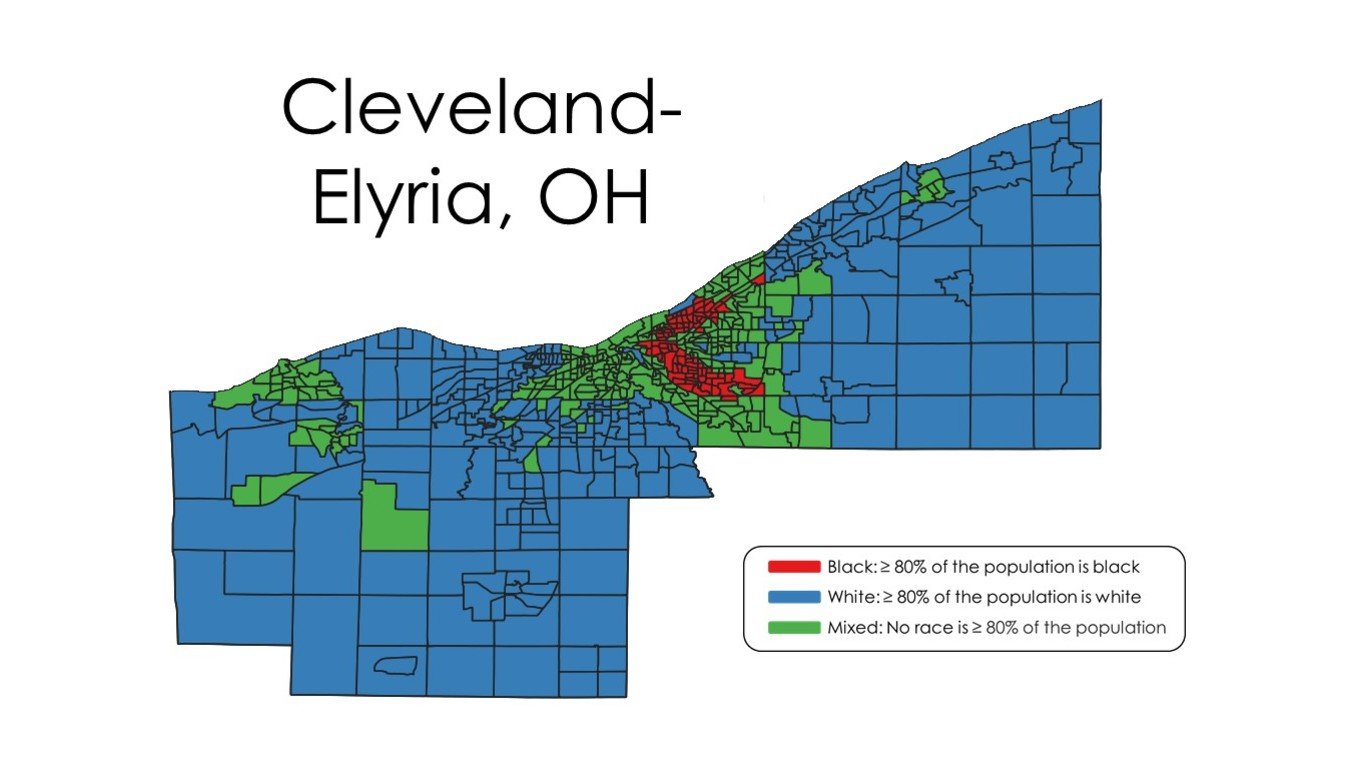
8. Cleveland-Elyria, OH
> Black pop. in Black neighborhoods: 67.0% (269,360)
> Black population: 19.6% (402,320)
> Black poverty rate: 31.0% (123,400)
> White poverty rate: 9.1% (135,099)
Like many Rust Belt cities, Cleveland’s current segregation patterns can be traced back to discriminatory zoning practices and racial housing covenants used during the influx of Black residents in the early 20th century. Later, the outbound migration of white families moving to the suburbs in the 1960s exacerbated segregation.
Today, 67.0% of Black residents in Cleveland live in predominantly Black neighborhoods, far more than the 19.5% national figure. More than 31% of residents of predominantly Black neighborhoods live in poverty, roughly three and a half times the 9% poverty rate in majority-white neighborhoods.
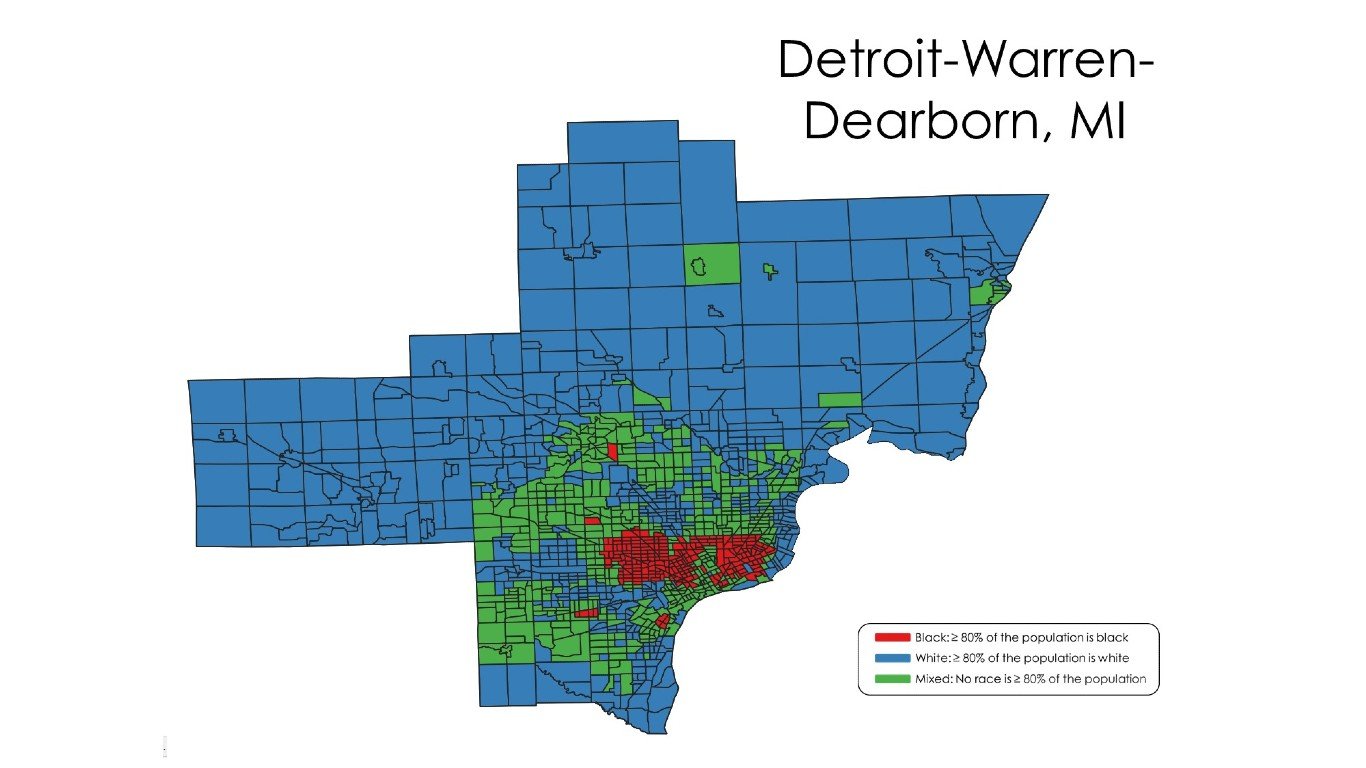
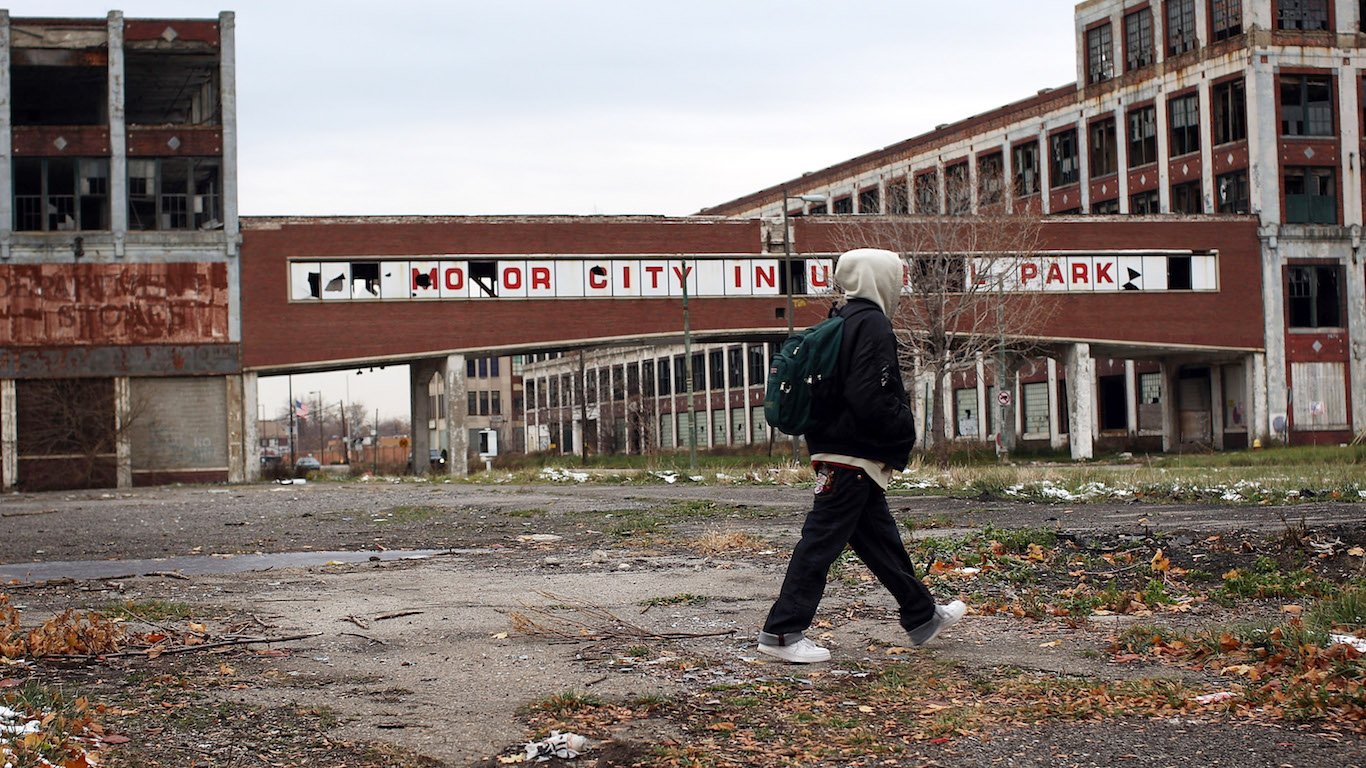
7. Detroit-Warren-Dearborn, MI
> Black pop. in Black neighborhoods: 69.7% (663,688)
> Black population: 22.1% (953,543)
> Black poverty rate: 27.8% (262,469)
> White poverty rate: 10.0% (296,111)
Like in many Rust Belt cities, segregation in Detroit was exacerbated after the Great Migration of the mid-20th century, as Detroit residents fought to keep new Black residents seeking auto factory jobs out of their neighborhoods. As Detroit deindustrialized during the 20th century, large waves of wealthy white families left the city center for the suburbs, draining the city’s tax base and leaving the poorer residents with fewer public services and less infrastructure. Racial tensions in Detroit culminated in major race riots in 1943 and 1967 that resulted in dozens of deaths, hundreds of injuries, and more than 1,000 buildings burned.
Today, nearly 70% of Black residents in the Detroit metro area live in neighborhoods that are predominantly Black — more than three times the 19.5% national figure.
[in-text-ad-2]
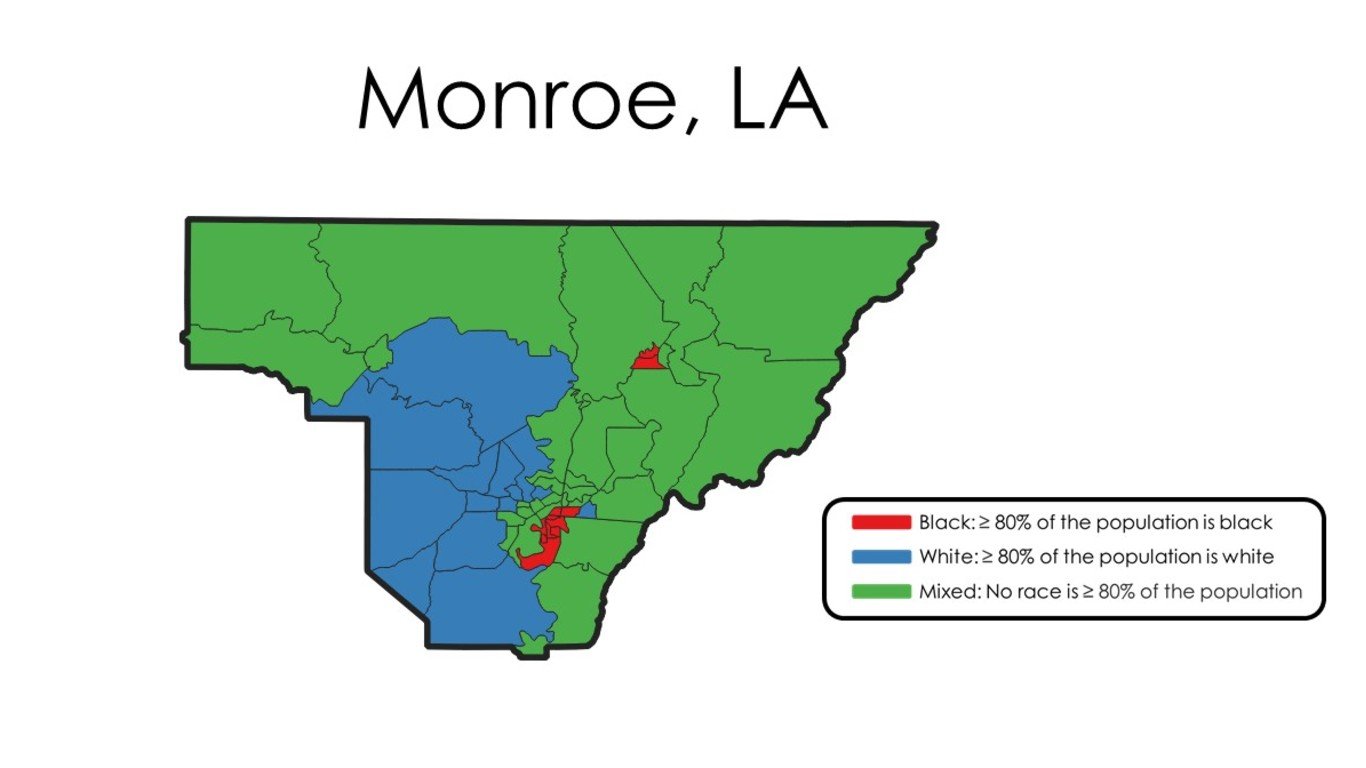
6. Monroe, LA
> Black pop. in Black neighborhoods: 72.2% (54,973)
> Black population: 37.4% (76,140)
> Black poverty rate: 41.7% (30,160)
> White poverty rate: 13.5% (15,787)
Monroe is one of six metro areas in Louisiana to rank among the most segregated cities in America. An estimated 72.2% of Black residents live in predominantly Black neighborhoods, more than double the 19.5% national figure and the sixth largest share of any U.S. metropolitan statistical area.
Segregation often limits access to education and employment opportunities in minority neighborhoods and can significantly contribute to racial disparities in urban areas. In the Monroe metropolitan area, 14.4% of residents in predominantly white neighborhoods live in poverty, while 42.8% of residents in predominantly Black neighborhoods do — one of the largest such gaps of any U.S. city.
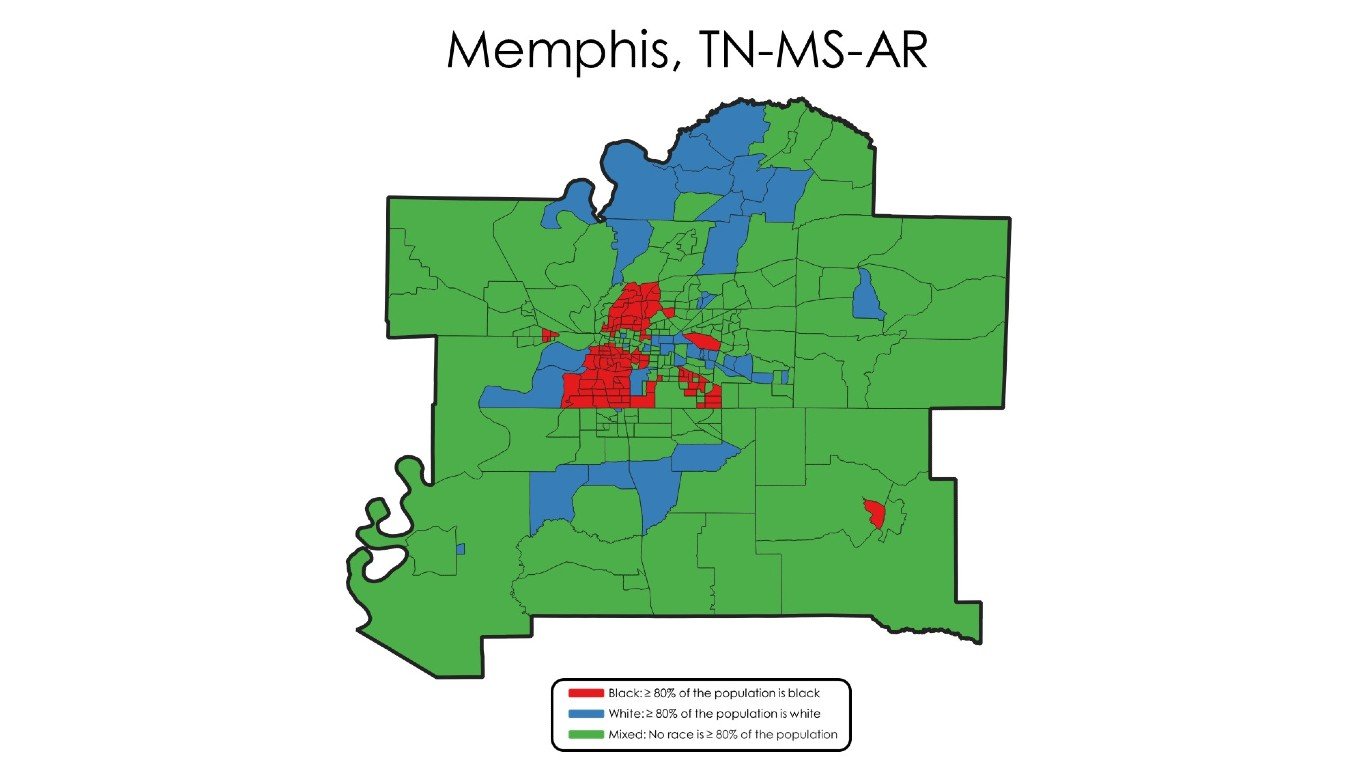
5. Memphis, TN-MS-AR
> Black pop. in Black neighborhoods: 72.2% (453,524)
> Black population: 46.9% (627,814)
> Black poverty rate: 25.5% (156,810)
> White poverty rate: 9.4% (57,126)
An estimated 72.2% of the Black population in the Memphis metropolitan area live in neighborhoods where more than half of the residents are also Black, far more than the 19.5% national share. Segregated Black neighborhoods in racially divided cities often lack access to education and employment opportunities and are more likely to struggle with poverty than white neighborhoods.
In Memphis, just 17.7% of adults in majority-Black neighborhoods have a bachelor’s degree, compared to 36.6% of adults in majority-white neighborhoods — one of the larger gaps in college attainment of any metropolitan area. The income gap between Black and white households in Memphis is just over $33,000, and 26.7% of residents of Black neighborhoods live in poverty — nearly three times the 9.5% poverty rate in primarily white neighborhoods.
[in-text-ad]

4. Albany, GA
> Black pop. in Black neighborhoods: 72.9% (57,680)
> Black population: 53.3% (79,171)
> Black poverty rate: 32.9% (24,969)
> White poverty rate: 12.6% (7,668)
Albany is one of four Georgia metro areas to rank among the most segregated cities. An estimated 72.9% of Black residents live in predominantly Black neighborhoods, the third largest share of any metro area nationwide and more than three times the 19.5% national rate.
In Albany neighborhoods where more than half of the population is Black, 35.4% of residents live in poverty, far more than the 25.3% comparable national figure and the 15.6% poverty rate for majority-white neighborhoods in the metro area. Similarly, 15.2% of the labor force in predominantly Black neighborhoods in Albany is unemployed, far more than the 10.1% comparable national figure and the 7.0% unemployment rate in majority-white neighborhoods in the metro area.
[recirclink id=838602]
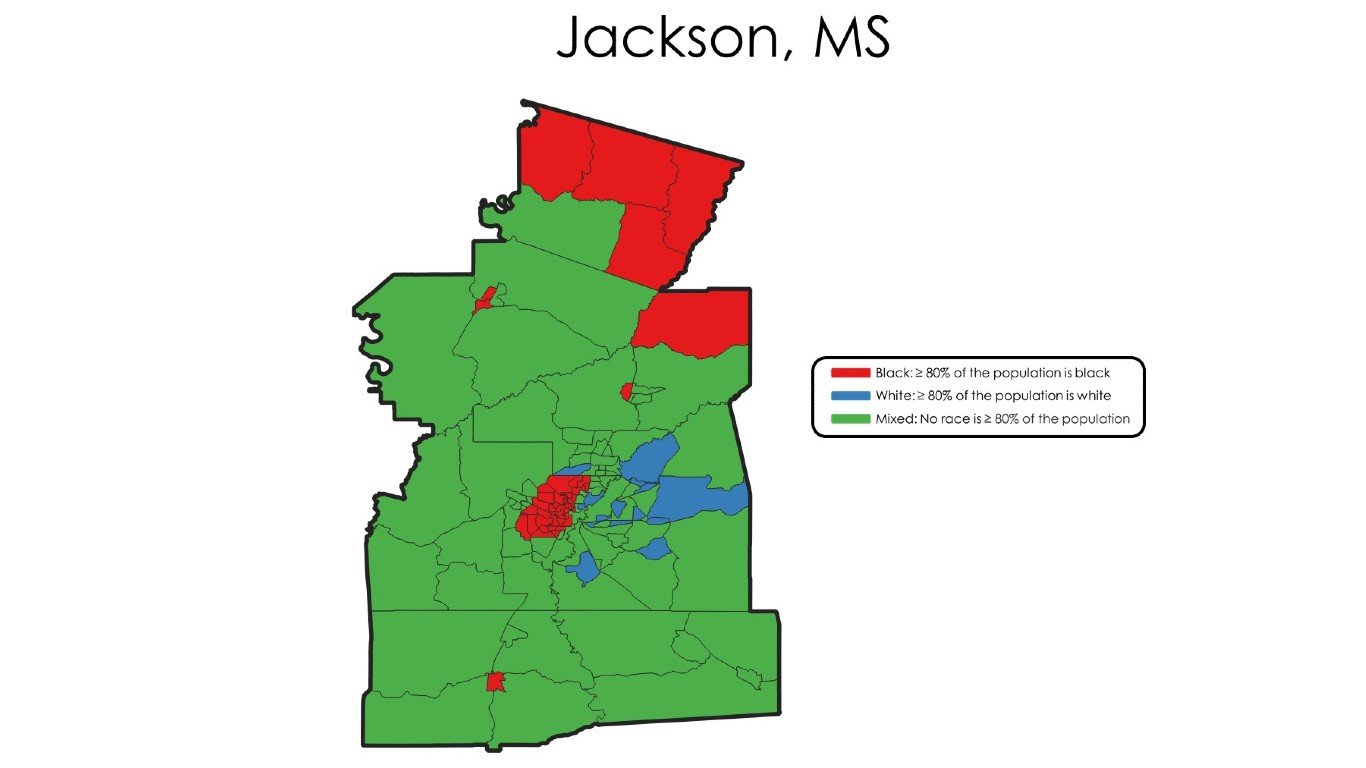
3. Jackson, MS
> Black pop. in Black neighborhoods: 74.0% (222,198)
> Black population: 50.3% (300,415)
> Black poverty rate: 25.0% (71,969)
> White poverty rate: 8.3% (22,354)
An estimated 74.0% of Black residents in Jackson, Mississippi, live in neighborhoods that are predominantly Black, more than 3.5 times the national figure. Segregation can contribute to racial disparities in urban areas, and in Jackson, Black residents are more than three times as likely to live in poverty as white residents.
Mississippi has a long history of state-sanctioned segregation and was still litigating issues related to segregation and the Brown v. Board of Education decision up until several years ago. As recently as 2017, a school district in Cleveland, Mississippi — roughly two hours northwest of Jackson — conceded to integrate its two racially divided high schools and two middle schools into one high school and one middle school after 50 years of litigation.

2. Milwaukee-Waukesha, WI
> Black pop. in Black neighborhoods: 74.6% (191,710)
> Black population: 16.3% (256,974)
> Black poverty rate: 31.5% (80,193)
> White poverty rate: 8.0% (90,079)
Like many Rust Belt cities, Milwaukee’s current segregation patterns can be traced back to discriminatory appraisal maps drawn up by the Home Owners Loan Corporation. Neighborhoods just north of downtown Milwaukee, such as Halyard Park, Hillside, and Haymarket were deemed hazardous for investment, with assessors citing the area’s African American population as a threat to property values.
Today, 74.6% of Black residents in the Milwaukee metro area live in neighborhoods where the majority of residents are Black, compared to 19.5% of Black Americans living in majority-Black neighborhoods nationwide. An estimated 30.5% of residents in majority-Black neighborhoods in Milwaukee live below the poverty line, nearly four times the 7.8% poverty rate for majority-white neighborhoods.
[in-text-ad-2]

1. Pine Bluff, AR
> Black pop. in Black neighborhoods: 80.8% (35,778)
> Black population: 48.7% (44,281)
> Black poverty rate: 27.7% (10,683)
> White poverty rate: 15.1% (5,738)
Pine Bluff, Arkansas, was the site of a student sit-in movement in 1963. Today, Pine Bluff is the most segregated metro area in the country. An estimated 80.8% of the Black population of Pine Bluff live in predominantly Black neighborhoods, more than four times the 19.5% national figure.
Although segregation often exacerbates racial inequality, Pine Bluff is one of America’s poorest cities and has relatively small achievement gaps between white and Black neighborhoods. For example, Pine Bluff is one of only two metro areas in which a larger share of residents have a bachelor’s degree in Black neighborhoods than white neighborhoods.
Methodology:
To determine the most segregated cities in America, 24/7 Wall St. calculated for all U.S. metro areas the percentage of a city’s Black population living in predominantly Black neighborhoods — census tracts where Black or African American residents constitute at least 50% of the population. Metro areas where a larger share of Black residents live in racially homogenous African American neighborhoods were considered more segregated. All data came from the U.S. Census Bureau’s American Community Survey and are five-year estimates through 2019.
To calculate segregation and other socioeconomic inequalities at the metro area level, we aggregated data from the census tract to the metropolitan area level using boundary definitions from the Census Bureau. Census tracts are statistical subdivisions defined by the U.S. Census Bureau that have an average population of approximately 4,000 people. Census tracts with fewer than 500 residents were excluded.
Data on poverty, educational attainment, average home value, and homeownership across predominantly Black and predominantly white neighborhoods came from the ACS and was aggregated from the census tract to the metropolitan area level. Data on poverty and median household income for all white and all Black residents in each metropolitan area are original estimates from the ACS. Data on racial composition in each metro area also came from the ACS and are original estimates.
Contact [email protected] for any questions or corrections.