Exercise is one of the most effective ways for people to improve their overall health. Regular exercise has been shown to reduce the risk of depression, weight gain, and certain chronic diseases, while improving cognitive function, sleep quality, and physical balance — among many other benefits.
Though the importance of physical activity is well established, over 55 million American adults lead completely sedentary lifestyles. Physical inactivity accounts for about one in every 10 premature deaths in the U.S. and also has broader social costs — presenting an estimated $117 billion burden on the health care system annually, according to the Centers for Disease Control and Prevention.
Insufficient exercise is a major public health challenge across the United States, but in some parts of the country, the problem is far worse than in others.
Using data from County Health Rankings & Roadmaps, a Robert Wood Johnson Foundation and University of Wisconsin Population Health Institute joint program, 24/7 Tempo identified the least physically active metropolitan area in each state. Metro areas are ranked by the share of adults 20 or older who never exercise in their leisure time. Four states — Delaware, New Hampshire, Rhode Island, and Vermont — have only one metro area. As a result, these areas rank as the least active in their state by default only.
Though each metro on this list ranks as the least physically active in its state, the share of adults who never exercise varies considerably in these places — from less than 17% to over 35%. Nationwide, 22.7% of adults never exercise.
Given the benefits associated with regular exercise, it is perhaps not surprising that overall health outcomes are often worse in places where larger shares of the population are not physically active. For example, in the majority of metro areas on this list, both the obesity rate and the share of adults who report being in fair or poor health are higher than the respective statewide averages. Here is a look at the most obese states in America.
For many residents of the metro areas on this list, a lack of regular physical exercise is partially attributable to limited opportunities. In most of these places, the share of the population living in close proximity to places to exercise, like parks or recreational facilities, is below the 84.2% national average.
Click here to see the laziest metro area in every state
Click here to read our detailed methodology
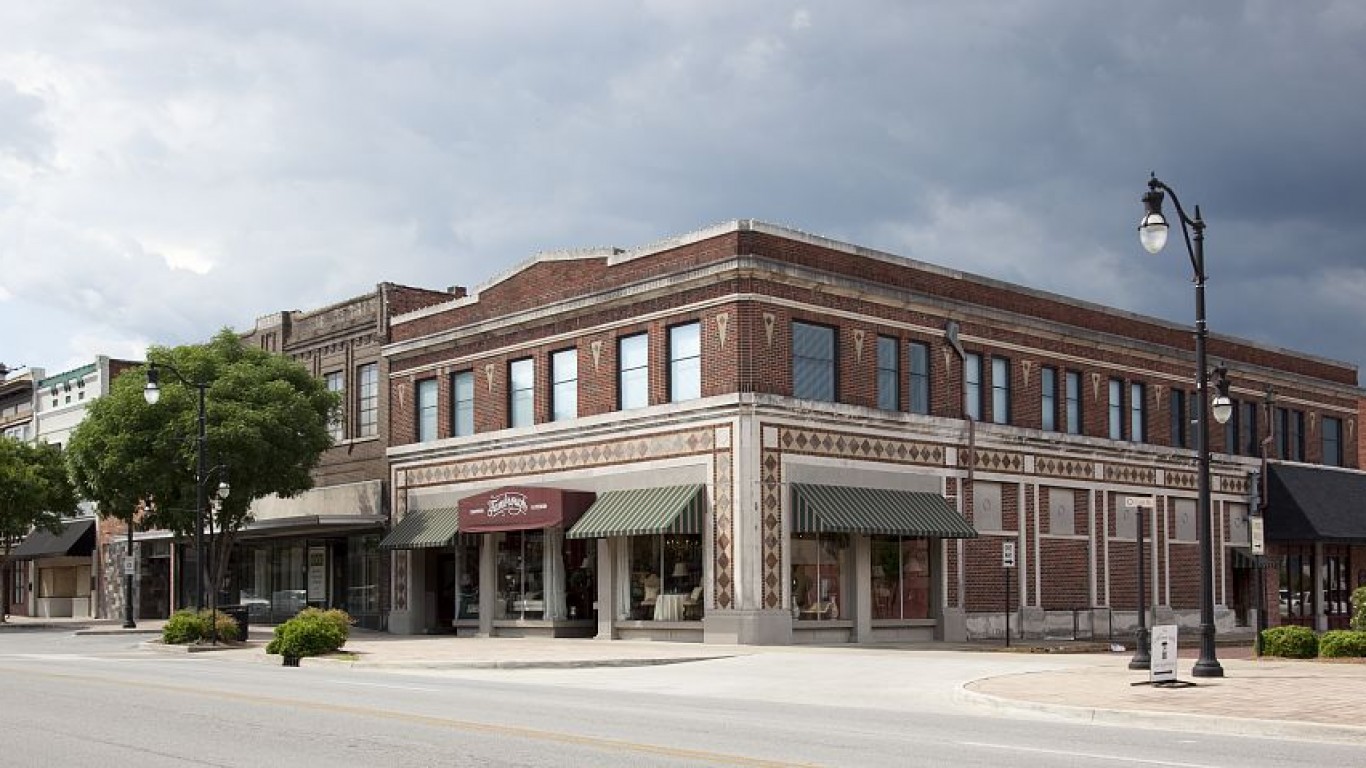
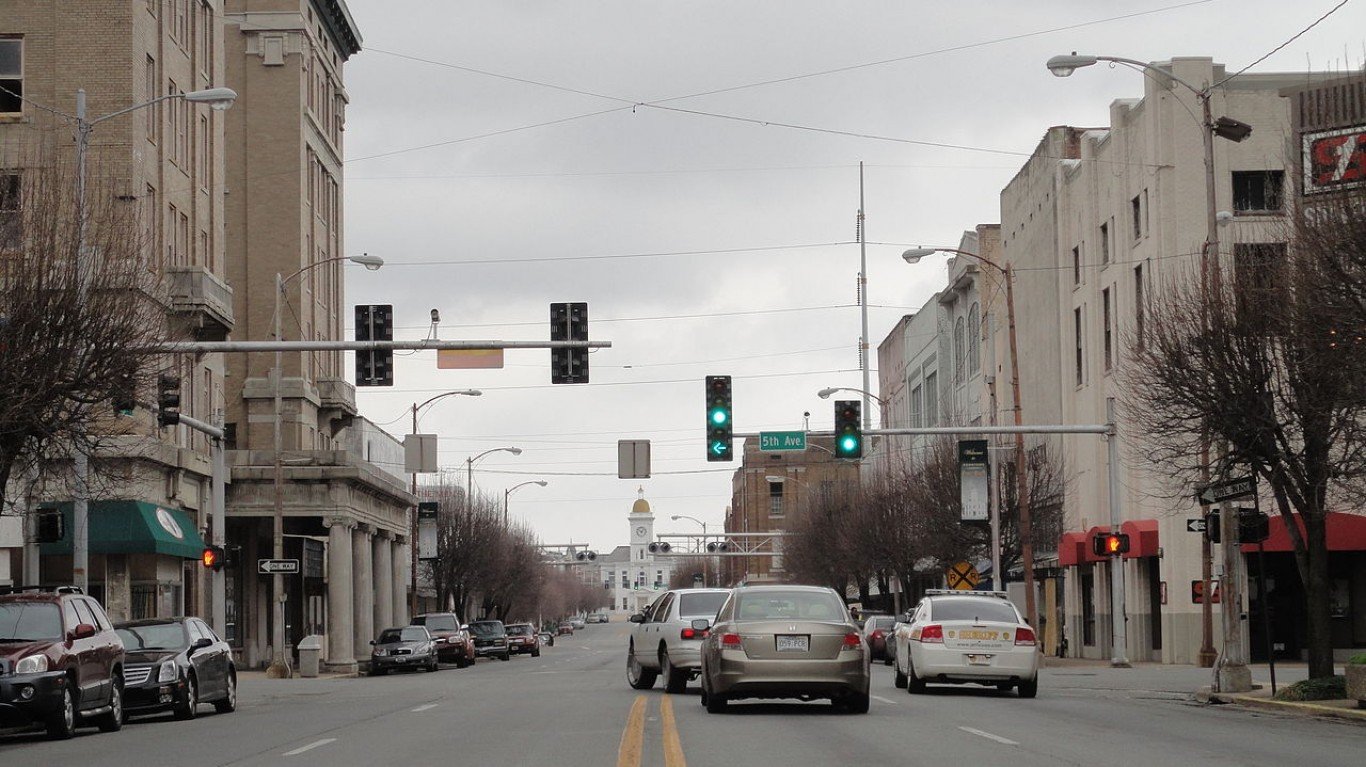
Alabama: Gadsden
> Adults who don’t exercise: 33.6% (Alabama: 29.3%)
> Pop. with access to places for physical activity: 49.5% (Alabama: 61.1%)
> Adult obesity rate: 36.2% (Alabama: 36.1%)
> Adults with diabetes: 17.3% (Alabama: 14.5%)
> Adults reporting poor or fair health: 22.0% (Alabama: 21.4%)
> Physically unhealthy days per month: 4.8 (Alabama: 4.4)
[in-text-ad]
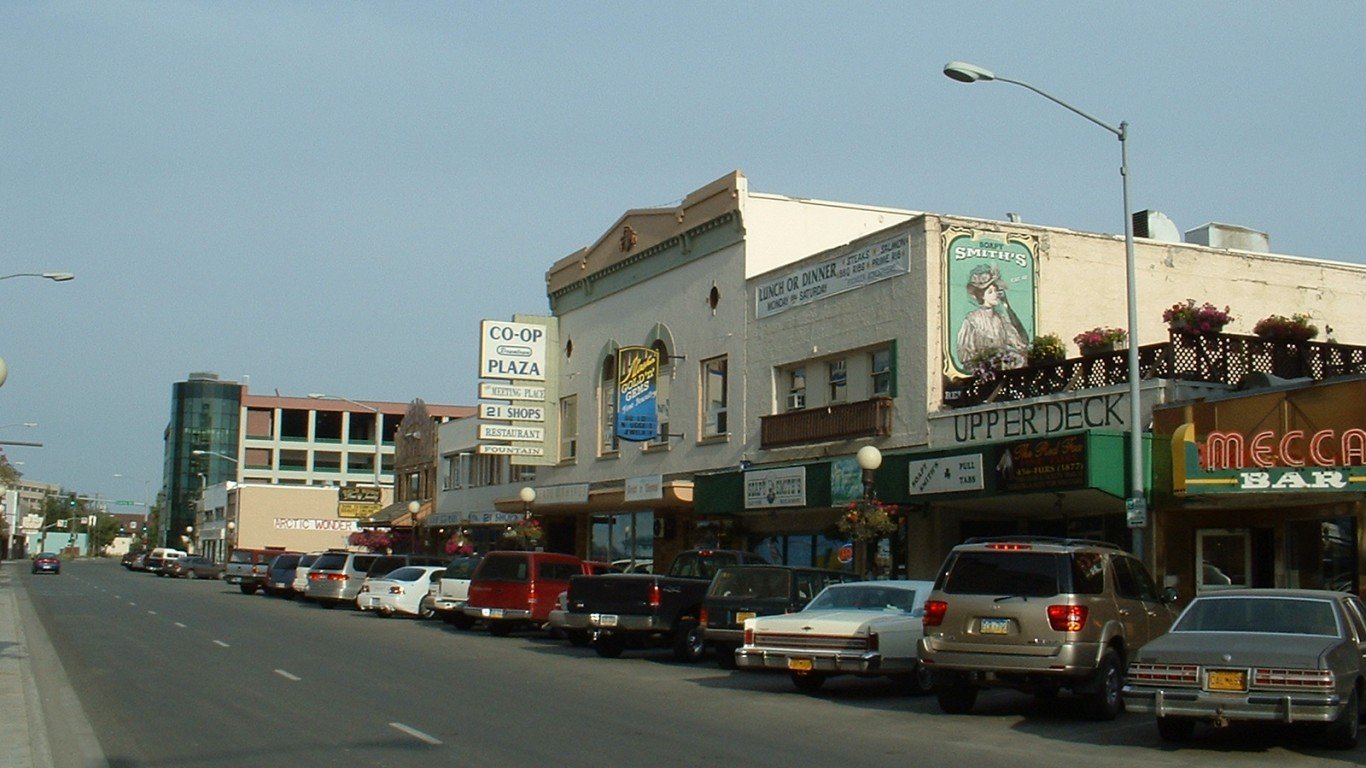
Alaska: Fairbanks
> Adults who don’t exercise: 18.2% (Alaska: 19.3%)
> Pop. with access to places for physical activity: 100.0% (Alaska: 100.0%)
> Adult obesity rate: 31.0% (Alaska: 31.9%)
> Adults with diabetes: 7.1% (Alaska: 8.3%)
> Adults reporting poor or fair health: 14.0% (Alaska: 15.6%)
> Physically unhealthy days per month: 4 (Alaska: 4.1)
[recirclink id=937287]
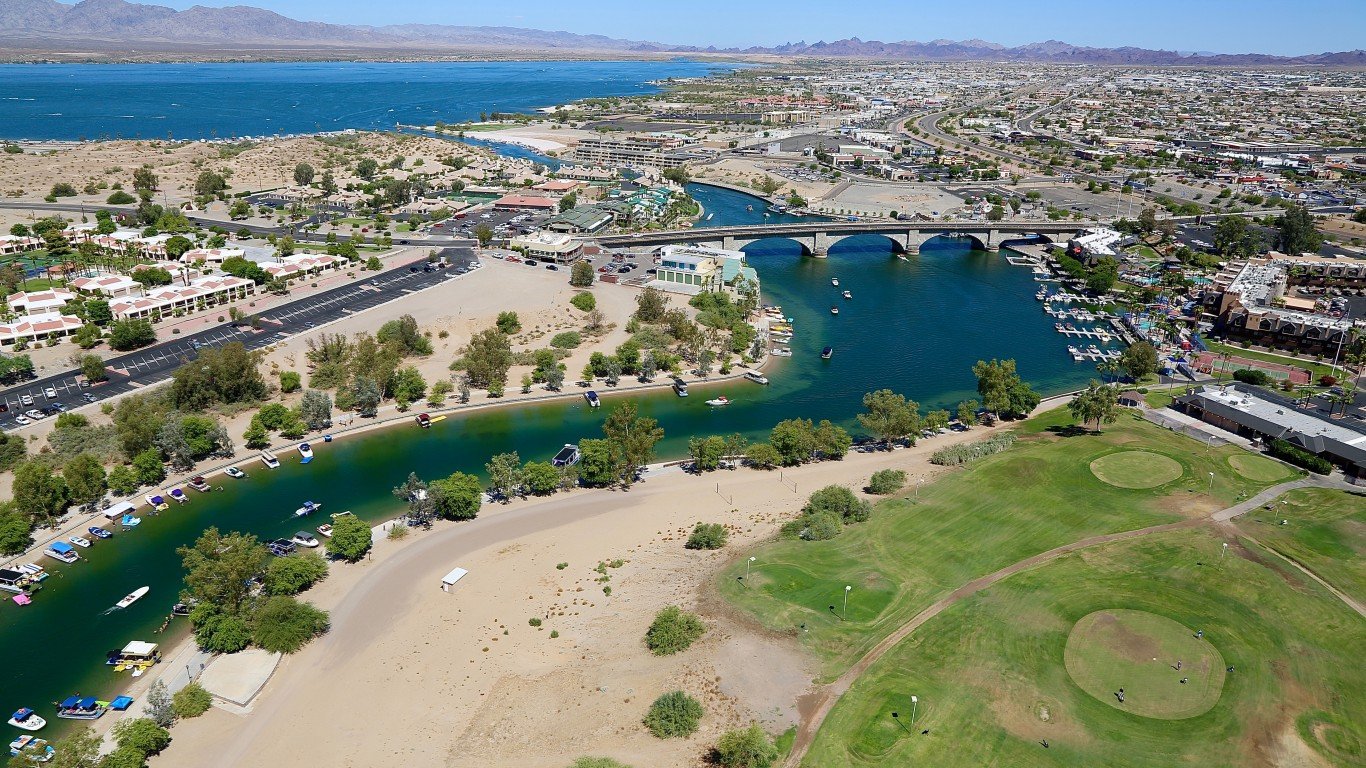
Arizona: Lake Havasu City-Kingman
> Adults who don’t exercise: 32.2% (Arizona: 21.2%)
> Pop. with access to places for physical activity: 58.6% (Arizona: 85.1%)
> Adult obesity rate: 30.7% (Arizona: 27.9%)
> Adults with diabetes: 14.0% (Arizona: 9.6%)
> Adults reporting poor or fair health: 22.5% (Arizona: 18.6%)
> Physically unhealthy days per month: 5 (Arizona: 4.2)
Arkansas: Pine Bluff
> Adults who don’t exercise: 34.0% (Arkansas: 30.4%)
> Pop. with access to places for physical activity: 46.7% (Arkansas: 63.5%)
> Adult obesity rate: 42.5% (Arkansas: 35.0%)
> Adults with diabetes: 14.7% (Arkansas: 13.5%)
> Adults reporting poor or fair health: 28.0% (Arkansas: 23.3%)
> Physically unhealthy days per month: 5.5 (Arkansas: 4.8)
[in-text-ad-2]

California: Yuba City
> Adults who don’t exercise: 30.5% (California: 17.7%)
> Pop. with access to places for physical activity: 76.1% (California: 93.1%)
> Adult obesity rate: 29.6% (California: 24.3%)
> Adults with diabetes: 12.9% (California: 8.8%)
> Adults reporting poor or fair health: 21.7% (California: 17.6%)
> Physically unhealthy days per month: 4.9 (California: 3.9)
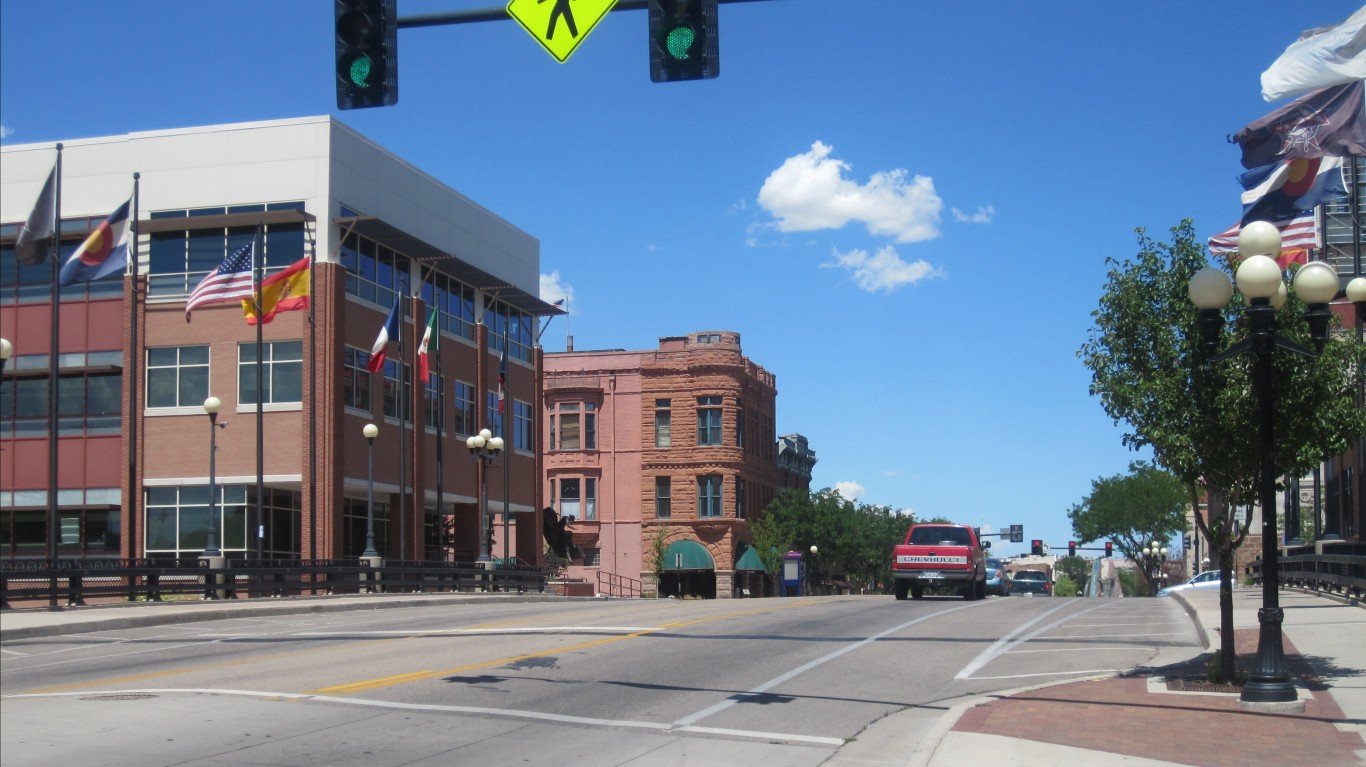
Colorado: Pueblo
> Adults who don’t exercise: 23.2% (Colorado: 14.8%)
> Pop. with access to places for physical activity: 64.5% (Colorado: 90.5%)
> Adult obesity rate: 31.0% (Colorado: 22.4%)
> Adults with diabetes: 10.0% (Colorado: 6.6%)
> Adults reporting poor or fair health: 20.1% (Colorado: 13.8%)
> Physically unhealthy days per month: 4.2 (Colorado: 3.3)
[in-text-ad]

Connecticut: New Haven-Milford
> Adults who don’t exercise: 21.6% (Connecticut: 19.9%)
> Pop. with access to places for physical activity: 95.4% (Connecticut: 94.0%)
> Adult obesity rate: 28.8% (Connecticut: 26.3%)
> Adults with diabetes: 10.2% (Connecticut: 9.2%)
> Adults reporting poor or fair health: 15.3% (Connecticut: 13.0%)
> Physically unhealthy days per month: 3.8 (Connecticut: 3.3)
[recirclink id=938898]

Delaware: Dover*
> Adults who don’t exercise: 30.9% (Delaware: 27.3%)
> Pop. with access to places for physical activity: 66.8% (Delaware: 86.5%)
> Adult obesity rate: 38.4% (Delaware: 32.4%)
> Adults with diabetes: 13.9% (Delaware: 11.8%)
> Adults reporting poor or fair health: 21.0% (Delaware: 16.3%)
> Physically unhealthy days per month: 4.5 (Delaware: 3.7)
*Because Dover is the only eligible metro in Delaware, it is the laziest metro by default.

Florida: Homosassa Springs
> Adults who don’t exercise: 35.7% (Florida: 25.8%)
> Pop. with access to places for physical activity: 73.3% (Florida: 88.7%)
> Adult obesity rate: 28.7% (Florida: 27.2%)
> Adults with diabetes: 13.3% (Florida: 10.8%)
> Adults reporting poor or fair health: 19.8% (Florida: 19.5%)
> Physically unhealthy days per month: 4.8 (Florida: 4)
[in-text-ad-2]

Georgia: Hinesville
> Adults who don’t exercise: 34.3% (Georgia: 26.4%)
> Pop. with access to places for physical activity: 58.6% (Georgia: 75.5%)
> Adult obesity rate: 36.5% (Georgia: 32.3%)
> Adults with diabetes: 12.4% (Georgia: 12.0%)
> Adults reporting poor or fair health: 22.3% (Georgia: 18.4%)
> Physically unhealthy days per month: 4.6 (Georgia: 3.9)

Hawaii: Urban Honolulu
> Adults who don’t exercise: 20.0% (Hawaii: 19.6%)
> Pop. with access to places for physical activity: 96.7% (Hawaii: 92.5%)
> Adult obesity rate: 24.4% (Hawaii: 24.6%)
> Adults with diabetes: 11.3% (Hawaii: 11.1%)
> Adults reporting poor or fair health: 17.0% (Hawaii: 15.4%)
> Physically unhealthy days per month: 3.6 (Hawaii: 3.2)
[in-text-ad]

Idaho: Twin Falls
> Adults who don’t exercise: 26.1% (Idaho: 20.4%)
> Pop. with access to places for physical activity: 75.0% (Idaho: 78.9%)
> Adult obesity rate: 31.5% (Idaho: 29.0%)
> Adults with diabetes: 10.0% (Idaho: 9.3%)
> Adults reporting poor or fair health: 19.4% (Idaho: 15.1%)
> Physically unhealthy days per month: 4.4 (Idaho: 3.7)
[recirclink id=945348]
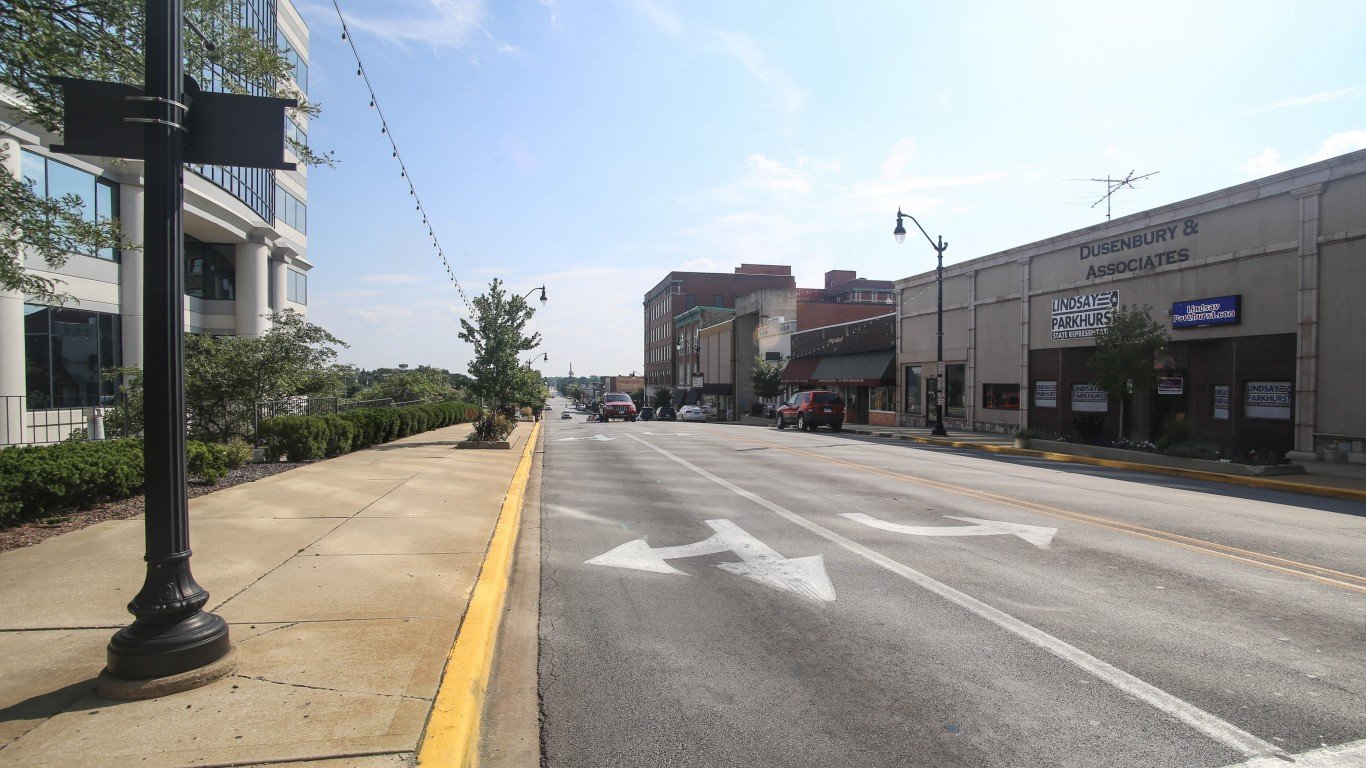
Illinois: Kankakee
> Adults who don’t exercise: 33.0% (Illinois: 21.6%)
> Pop. with access to places for physical activity: 80.0% (Illinois: 90.8%)
> Adult obesity rate: 38.0% (Illinois: 29.7%)
> Adults with diabetes: 13.2% (Illinois: 9.9%)
> Adults reporting poor or fair health: 19.2% (Illinois: 15.9%)
> Physically unhealthy days per month: 4.3 (Illinois: 3.6)

Indiana: Kokomo
> Adults who don’t exercise: 34.1% (Indiana: 26.7%)
> Pop. with access to places for physical activity: 68.6% (Indiana: 75.2%)
> Adult obesity rate: 35.2% (Indiana: 33.9%)
> Adults with diabetes: 14.8% (Indiana: 12.1%)
> Adults reporting poor or fair health: 20.2% (Indiana: 18.2%)
> Physically unhealthy days per month: 4.4 (Indiana: 4)
[in-text-ad-2]

Iowa: Sioux City
> Adults who don’t exercise: 28.4% (Iowa: 22.6%)
> Pop. with access to places for physical activity: 88.0% (Iowa: 82.9%)
> Adult obesity rate: 35.0% (Iowa: 34.3%)
> Adults with diabetes: 10.9% (Iowa: 9.9%)
> Adults reporting poor or fair health: 16.6% (Iowa: 13.5%)
> Physically unhealthy days per month: 3.4 (Iowa: 3.1)

Kansas: Wichita
> Adults who don’t exercise: 25.2% (Kansas: 23.9%)
> Pop. with access to places for physical activity: 81.8% (Kansas: 80.1%)
> Adult obesity rate: 33.4% (Kansas: 33.0%)
> Adults with diabetes: 11.3% (Kansas: 10.5%)
> Adults reporting poor or fair health: 17.3% (Kansas: 16.3%)
> Physically unhealthy days per month: 4 (Kansas: 3.6)
[in-text-ad]

Kentucky: Elizabethtown-Fort Knox
> Adults who don’t exercise: 30.2% (Kentucky: 28.7%)
> Pop. with access to places for physical activity: 53.3% (Kentucky: 71.1%)
> Adult obesity rate: 38.8% (Kentucky: 34.6%)
> Adults with diabetes: 12.1% (Kentucky: 12.7%)
> Adults reporting poor or fair health: 21.7% (Kentucky: 21.8%)
> Physically unhealthy days per month: 5 (Kentucky: 4.6)
[recirclink id=952318]

Louisiana: Hammond
> Adults who don’t exercise: 33.1% (Louisiana: 28.0%)
> Pop. with access to places for physical activity: 67.9% (Louisiana: 75.0%)
> Adult obesity rate: 40.3% (Louisiana: 36.3%)
> Adults with diabetes: 11.7% (Louisiana: 13.0%)
> Adults reporting poor or fair health: 23.1% (Louisiana: 21.4%)
> Physically unhealthy days per month: 4.7 (Louisiana: 4.3)

Maine: Bangor
> Adults who don’t exercise: 23.5% (Maine: 20.8%)
> Pop. with access to places for physical activity: 63.4% (Maine: 70.0%)
> Adult obesity rate: 34.2% (Maine: 29.8%)
> Adults with diabetes: 12.3% (Maine: 10.4%)
> Adults reporting poor or fair health: 19.1% (Maine: 17.1%)
> Physically unhealthy days per month: 4.5 (Maine: 4.2)
[in-text-ad-2]
Maryland: Salisbury
> Adults who don’t exercise: 29.2% (Maryland: 21.9%)
> Pop. with access to places for physical activity: 76.1% (Maryland: 92.6%)
> Adult obesity rate: 34.9% (Maryland: 31.6%)
> Adults with diabetes: 13.1% (Maryland: 11.1%)
> Adults reporting poor or fair health: 18.6% (Maryland: 15.2%)
> Physically unhealthy days per month: 4.2 (Maryland: 3.4)

Massachusetts: Springfield
> Adults who don’t exercise: 23.6% (Massachusetts: 20.0%)
> Pop. with access to places for physical activity: 92.6% (Massachusetts: 94.5%)
> Adult obesity rate: 28.1% (Massachusetts: 25.0%)
> Adults with diabetes: 9.2% (Massachusetts: 8.7%)
> Adults reporting poor or fair health: 17.6% (Massachusetts: 13.5%)
> Physically unhealthy days per month: 4.3 (Massachusetts: 3.5)
[in-text-ad]

Michigan: Battle Creek
> Adults who don’t exercise: 27.2% (Michigan: 23.1%)
> Pop. with access to places for physical activity: 76.7% (Michigan: 85.5%)
> Adult obesity rate: 36.8% (Michigan: 32.4%)
> Adults with diabetes: 14.7% (Michigan: 11.0%)
> Adults reporting poor or fair health: 18.9% (Michigan: 18.3%)
> Physically unhealthy days per month: 4.4 (Michigan: 4.3)
[recirclink id=964573]

Minnesota: Mankato
> Adults who don’t exercise: 21.3% (Minnesota: 19.6%)
> Pop. with access to places for physical activity: 83.0% (Minnesota: 86.9%)
> Adult obesity rate: 32.6% (Minnesota: 29.0%)
> Adults with diabetes: 8.2% (Minnesota: 8.5%)
> Adults reporting poor or fair health: 14.1% (Minnesota: 12.9%)
> Physically unhealthy days per month: 3.4 (Minnesota: 3.1)

Mississippi: Jackson
> Adults who don’t exercise: 29.2% (Mississippi: 30.4%)
> Pop. with access to places for physical activity: 65.1% (Mississippi: 54.5%)
> Adult obesity rate: 40.1% (Mississippi: 39.1%)
> Adults with diabetes: 12.5% (Mississippi: 14.6%)
> Adults reporting poor or fair health: 21.4% (Mississippi: 22.1%)
> Physically unhealthy days per month: 4.1 (Mississippi: 4.5)
[in-text-ad-2]

Missouri: St. Joseph
> Adults who don’t exercise: 31.5% (Missouri: 25.5%)
> Pop. with access to places for physical activity: 74.9% (Missouri: 76.7%)
> Adult obesity rate: 37.0% (Missouri: 32.5%)
> Adults with diabetes: 12.4% (Missouri: 11.4%)
> Adults reporting poor or fair health: 20.9% (Missouri: 19.5%)
> Physically unhealthy days per month: 4.7 (Missouri: 4.2)

Montana: Great Falls
> Adults who don’t exercise: 24.0% (Montana: 21.7%)
> Pop. with access to places for physical activity: 83.5% (Montana: 75.2%)
> Adult obesity rate: 31.1% (Montana: 27.1%)
> Adults with diabetes: 9.8% (Montana: 8.9%)
> Adults reporting poor or fair health: 16.8% (Montana: 14.1%)
> Physically unhealthy days per month: 4.1 (Montana: 3.6)
[in-text-ad]

Nebraska: Grand Island
> Adults who don’t exercise: 27.6% (Nebraska: 22.7%)
> Pop. with access to places for physical activity: 79.4% (Nebraska: 83.5%)
> Adult obesity rate: 37.4% (Nebraska: 33.4%)
> Adults with diabetes: 11.5% (Nebraska: 10.0%)
> Adults reporting poor or fair health: 16.0% (Nebraska: 13.8%)
> Physically unhealthy days per month: 3.4 (Nebraska: 3.2)
[recirclink id=937287]

Nevada: Las Vegas-Henderson-Paradise
> Adults who don’t exercise: 23.4% (Nevada: 22.5%)
> Pop. with access to places for physical activity: 97.1% (Nevada: 93.0%)
> Adult obesity rate: 27.3% (Nevada: 27.1%)
> Adults with diabetes: 10.9% (Nevada: 10.5%)
> Adults reporting poor or fair health: 21.6% (Nevada: 19.1%)
> Physically unhealthy days per month: 4.4 (Nevada: 4.2)

New Hampshire: Manchester-Nashua*
> Adults who don’t exercise: 21.7% (New Hampshire: 20.8%)
> Pop. with access to places for physical activity: 91.7% (New Hampshire: 88.2%)
> Adult obesity rate: 28.5% (New Hampshire: 28.6%)
> Adults with diabetes: 9.7% (New Hampshire: 9.6%)
> Adults reporting poor or fair health: 12.2% (New Hampshire: 12.8%)
> Physically unhealthy days per month: 3.4 (New Hampshire: 3.5)
*Because Manchester-Nashua is the only eligible metro in New Hampshire, it is the laziest metro by default.
[in-text-ad-2]

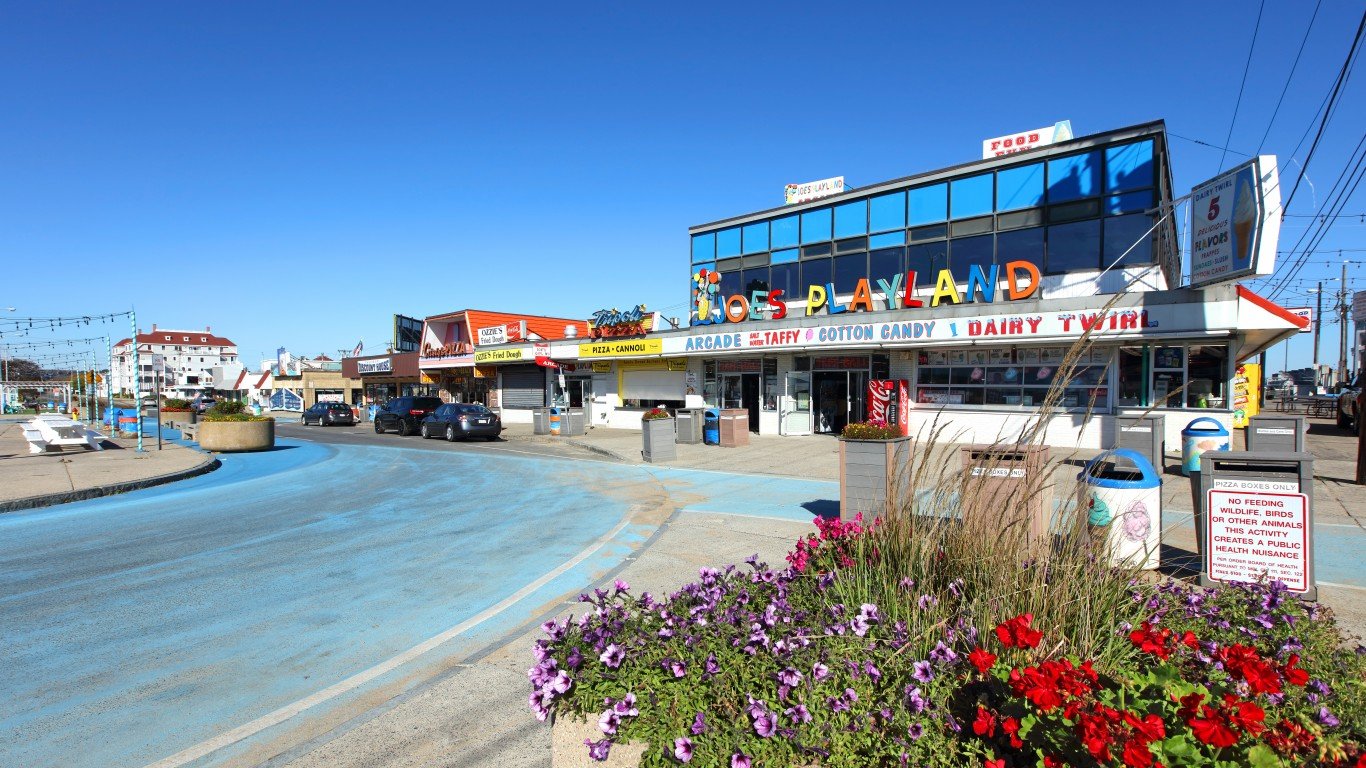
New Jersey: Atlantic City-Hammonton
> Adults who don’t exercise: 32.4% (New Jersey: 26.6%)
> Pop. with access to places for physical activity: 91.4% (New Jersey: 94.7%)
> Adult obesity rate: 32.5% (New Jersey: 27.0%)
> Adults with diabetes: 13.2% (New Jersey: 9.9%)
> Adults reporting poor or fair health: 18.7% (New Jersey: 15.5%)
> Physically unhealthy days per month: 4.3 (New Jersey: 3.7)

New Mexico: Farmington
> Adults who don’t exercise: 22.6% (New Mexico: 19.0%)
> Pop. with access to places for physical activity: 55.6% (New Mexico: 76.9%)
> Adult obesity rate: 34.6% (New Mexico: 27.3%)
> Adults with diabetes: 13.5% (New Mexico: 9.5%)
> Adults reporting poor or fair health: 23.5% (New Mexico: 20.3%)
> Physically unhealthy days per month: 5 (New Mexico: 4.3)
[in-text-ad]

New York: Elmira
> Adults who don’t exercise: 29.6% (New York: 23.4%)
> Pop. with access to places for physical activity: 82.6% (New York: 93.2%)
> Adult obesity rate: 35.1% (New York: 26.4%)
> Adults with diabetes: 12.7% (New York: 10.1%)
> Adults reporting poor or fair health: 17.6% (New York: 16.3%)
> Physically unhealthy days per month: 4.3 (New York: 3.6)
[recirclink id=938898]

North Carolina: Goldsboro
> Adults who don’t exercise: 28.6% (North Carolina: 23.3%)
> Pop. with access to places for physical activity: 45.2% (North Carolina: 73.5%)
> Adult obesity rate: 39.7% (North Carolina: 32.3%)
> Adults with diabetes: 16.0% (North Carolina: 11.5%)
> Adults reporting poor or fair health: 23.6% (North Carolina: 18.0%)
> Physically unhealthy days per month: 4.5 (North Carolina: 3.6)

North Dakota: Grand Forks
> Adults who don’t exercise: 23.7% (North Dakota: 23.1%)
> Pop. with access to places for physical activity: 77.5% (North Dakota: 74.0%)
> Adult obesity rate: 33.6% (North Dakota: 33.9%)
> Adults with diabetes: 9.2% (North Dakota: 9.4%)
> Adults reporting poor or fair health: 15.7% (North Dakota: 13.6%)
> Physically unhealthy days per month: 3.5 (North Dakota: 3.2)
[in-text-ad-2]

Ohio: Mansfield
> Adults who don’t exercise: 32.0% (Ohio: 26.1%)
> Pop. with access to places for physical activity: 67.3% (Ohio: 83.9%)
> Adult obesity rate: 35.6% (Ohio: 33.5%)
> Adults with diabetes: 14.2% (Ohio: 12.2%)
> Adults reporting poor or fair health: 20.6% (Ohio: 17.8%)
> Physically unhealthy days per month: 4.6 (Ohio: 4.1)

Oklahoma: Enid
> Adults who don’t exercise: 29.2% (Oklahoma: 27.8%)
> Pop. with access to places for physical activity: 66.8% (Oklahoma: 71.3%)
> Adult obesity rate: 35.1% (Oklahoma: 34.5%)
> Adults with diabetes: 10.1% (Oklahoma: 12.3%)
> Adults reporting poor or fair health: 20.5% (Oklahoma: 20.9%)
> Physically unhealthy days per month: 4.7 (Oklahoma: 4.5)
[in-text-ad]
Oregon: Grants Pass
> Adults who don’t exercise: 22.5% (Oregon: 17.3%)
> Pop. with access to places for physical activity: 81.9% (Oregon: 87.9%)
> Adult obesity rate: 32.0% (Oregon: 29.3%)
> Adults with diabetes: 12.5% (Oregon: 9.7%)
> Adults reporting poor or fair health: 21.9% (Oregon: 18.2%)
> Physically unhealthy days per month: 5.2 (Oregon: 4.7)
[recirclink id=945348]
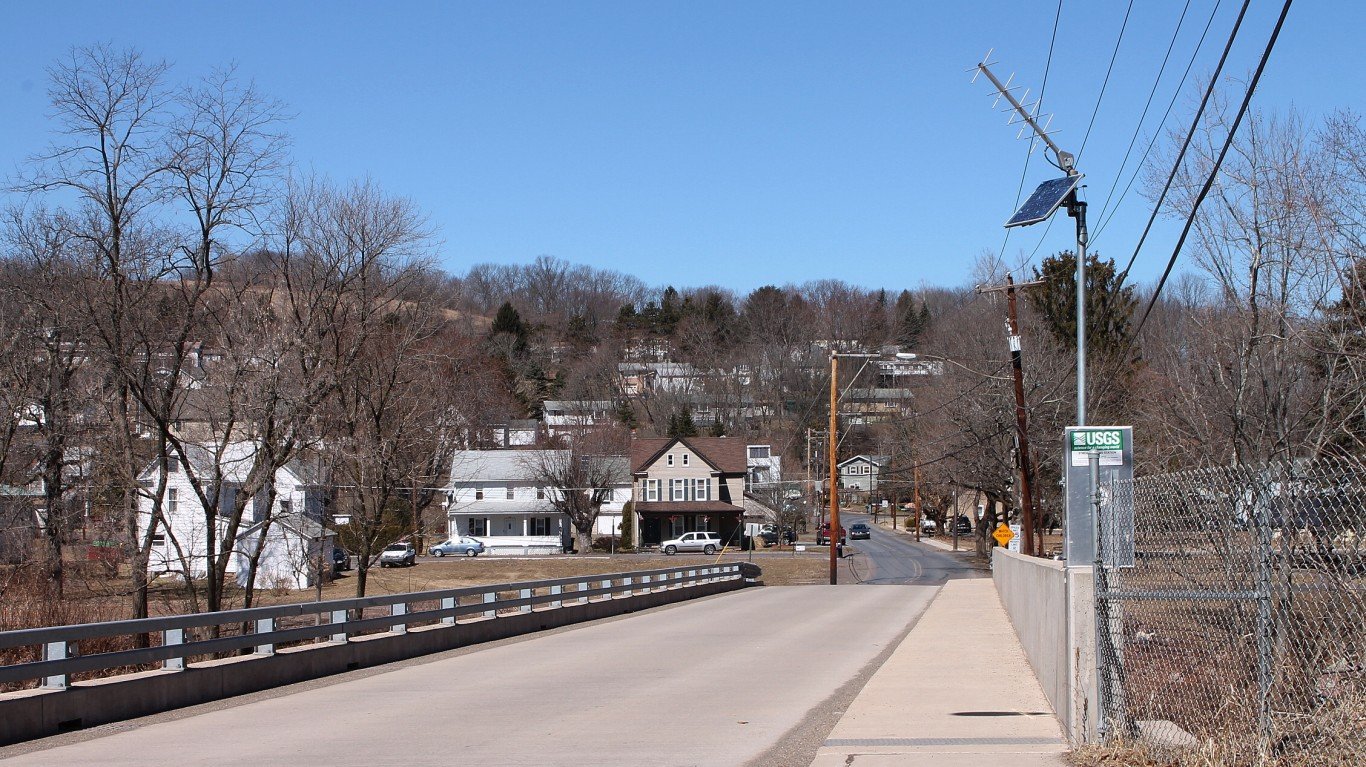
Pennsylvania: Bloomsburg-Berwick
> Adults who don’t exercise: 33.0% (Pennsylvania: 22.0%)
> Pop. with access to places for physical activity: 73.6% (Pennsylvania: 84.4%)
> Adult obesity rate: 35.3% (Pennsylvania: 30.8%)
> Adults with diabetes: 12.7% (Pennsylvania: 11.0%)
> Adults reporting poor or fair health: 18.1% (Pennsylvania: 17.6%)
> Physically unhealthy days per month: 4.2 (Pennsylvania: 4)

Rhode Island: Providence-Warwick*
> Adults who don’t exercise: 23.8% (Rhode Island: 23.5%)
> Pop. with access to places for physical activity: 95.1% (Rhode Island: 94.9%)
> Adult obesity rate: 28.6% (Rhode Island: 28.5%)
> Adults with diabetes: 10.1% (Rhode Island: 10.1%)
> Adults reporting poor or fair health: 16.8% (Rhode Island: 16.5%)
> Physically unhealthy days per month: 4.2 (Rhode Island: 3.9)
*Because Providence-Warwick is the only eligible metro in Rhode Island, it is the laziest metro by default.
[in-text-ad-2]
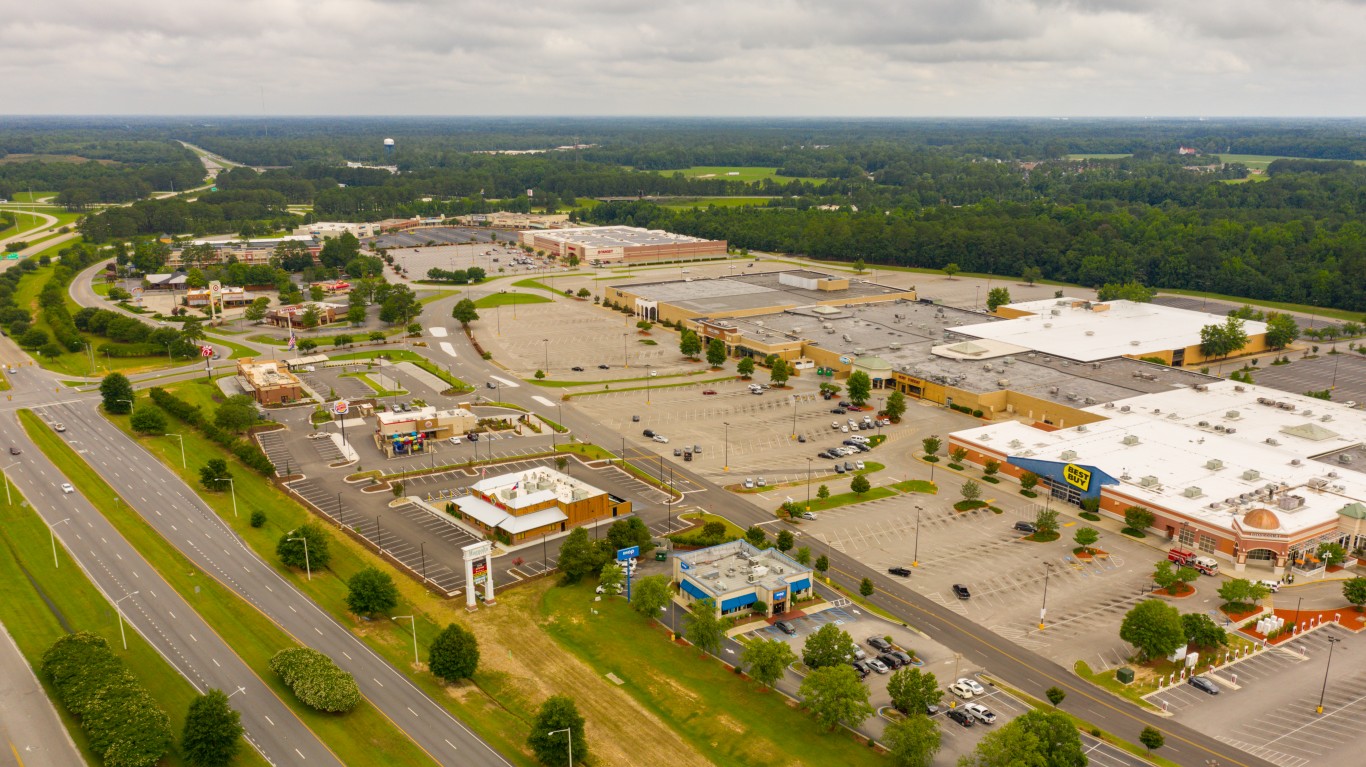
South Carolina: Florence
> Adults who don’t exercise: 31.8% (South Carolina: 26.0%)
> Pop. with access to places for physical activity: 52.3% (South Carolina: 68.3%)
> Adult obesity rate: 38.4% (South Carolina: 34.0%)
> Adults with diabetes: 16.8% (South Carolina: 13.3%)
> Adults reporting poor or fair health: 21.5% (South Carolina: 17.8%)
> Physically unhealthy days per month: 4.4 (South Carolina: 4)

South Dakota: Rapid City
> Adults who don’t exercise: 21.9% (South Dakota: 22.0%)
> Pop. with access to places for physical activity: 88.4% (South Dakota: 73.5%)
> Adult obesity rate: 29.3% (South Dakota: 32.4%)
> Adults with diabetes: 9.8% (South Dakota: 10.1%)
> Adults reporting poor or fair health: 14.2% (South Dakota: 13.4%)
> Physically unhealthy days per month: 3.2 (South Dakota: 3)
[in-text-ad]

Tennessee: Morristown
> Adults who don’t exercise: 32.3% (Tennessee: 27.2%)
> Pop. with access to places for physical activity: 59.5% (Tennessee: 70.2%)
> Adult obesity rate: 38.1% (Tennessee: 33.3%)
> Adults with diabetes: 14.9% (Tennessee: 12.5%)
> Adults reporting poor or fair health: 24.1% (Tennessee: 21.2%)
> Physically unhealthy days per month: 5.3 (Tennessee: 4.7)
[recirclink id=952318]
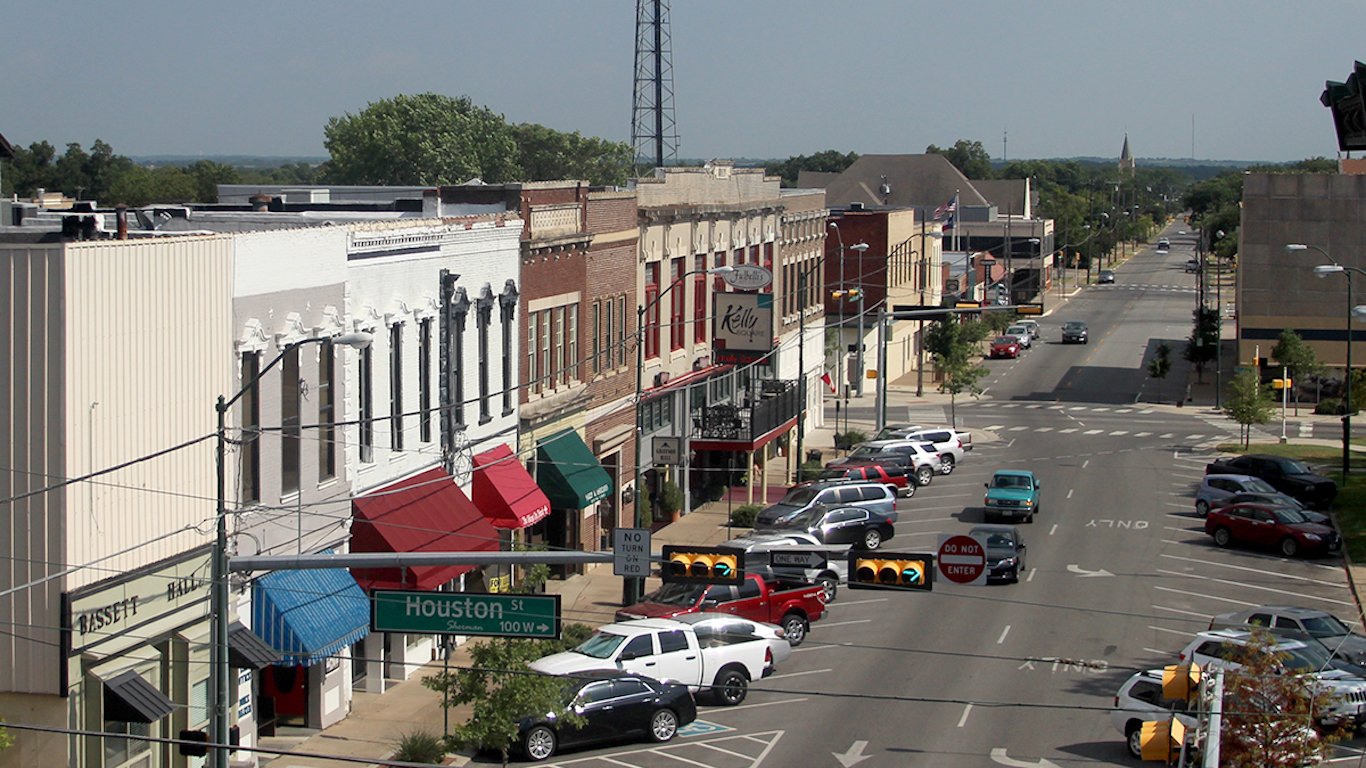
Texas: Sherman-Denison
> Adults who don’t exercise: 34.9% (Texas: 23.2%)
> Pop. with access to places for physical activity: 66.6% (Texas: 80.5%)
> Adult obesity rate: 38.1% (Texas: 31.4%)
> Adults with diabetes: 11.0% (Texas: 10.2%)
> Adults reporting poor or fair health: 19.3% (Texas: 18.7%)
> Physically unhealthy days per month: 4.2 (Texas: 3.8)

Utah: St. George
> Adults who don’t exercise: 17.4% (Utah: 16.7%)
> Pop. with access to places for physical activity: 81.4% (Utah: 85.7%)
> Adult obesity rate: 24.0% (Utah: 27.0%)
> Adults with diabetes: 8.6% (Utah: 7.5%)
> Adults reporting poor or fair health: 15.9% (Utah: 14.8%)
> Physically unhealthy days per month: 4 (Utah: 3.5)
[in-text-ad-2]

Vermont: Burlington-South Burlington*
> Adults who don’t exercise: 16.6% (Vermont: 18.4%)
> Pop. with access to places for physical activity: 77.9% (Vermont: 75.8%)
> Adult obesity rate: 25.4% (Vermont: 27.0%)
> Adults with diabetes: 7.7% (Vermont: 8.8%)
> Adults reporting poor or fair health: 11.8% (Vermont: 12.8%)
> Physically unhealthy days per month: 3.7 (Vermont: 3.7)
*Because Burlington-South Burlington is the only eligible metro in Vermont, it is the laziest metro by default.

Virginia: Roanoke
> Adults who don’t exercise: 27.1% (Virginia: 22.2%)
> Pop. with access to places for physical activity: 79.5% (Virginia: 82.4%)
> Adult obesity rate: 33.5% (Virginia: 30.5%)
> Adults with diabetes: 12.7% (Virginia: 10.7%)
> Adults reporting poor or fair health: 18.4% (Virginia: 16.6%)
> Physically unhealthy days per month: 4.2 (Virginia: 3.5)
[in-text-ad]

Washington: Longview
> Adults who don’t exercise: 21.7% (Washington: 16.4%)
> Pop. with access to places for physical activity: 73.5% (Washington: 86.2%)
> Adult obesity rate: 37.7% (Washington: 28.6%)
> Adults with diabetes: 13.2% (Washington: 9.3%)
> Adults reporting poor or fair health: 19.5% (Washington: 15.0%)
> Physically unhealthy days per month: 4.9 (Washington: 3.7)
[recirclink id=964573]
West Virginia: Weirton-Steubenville
> Adults who don’t exercise: 32.0% (West Virginia: 28.0%)
> Pop. with access to places for physical activity: 85.2% (West Virginia: 59.4%)
> Adult obesity rate: 38.4% (West Virginia: 37.8%)
> Adults with diabetes: 15.3% (West Virginia: 15.1%)
> Adults reporting poor or fair health: 20.9% (West Virginia: 23.6%)
> Physically unhealthy days per month: 4.8 (West Virginia: 5.3)

Wisconsin: Fond du Lac
> Adults who don’t exercise: 23.0% (Wisconsin: 20.3%)
> Pop. with access to places for physical activity: 84.9% (Wisconsin: 85.2%)
> Adult obesity rate: 32.0% (Wisconsin: 31.7%)
> Adults with diabetes: 8.7% (Wisconsin: 9.5%)
> Adults reporting poor or fair health: 14.6% (Wisconsin: 14.8%)
> Physically unhealthy days per month: 3.6 (Wisconsin: 3.7)
[in-text-ad-2]
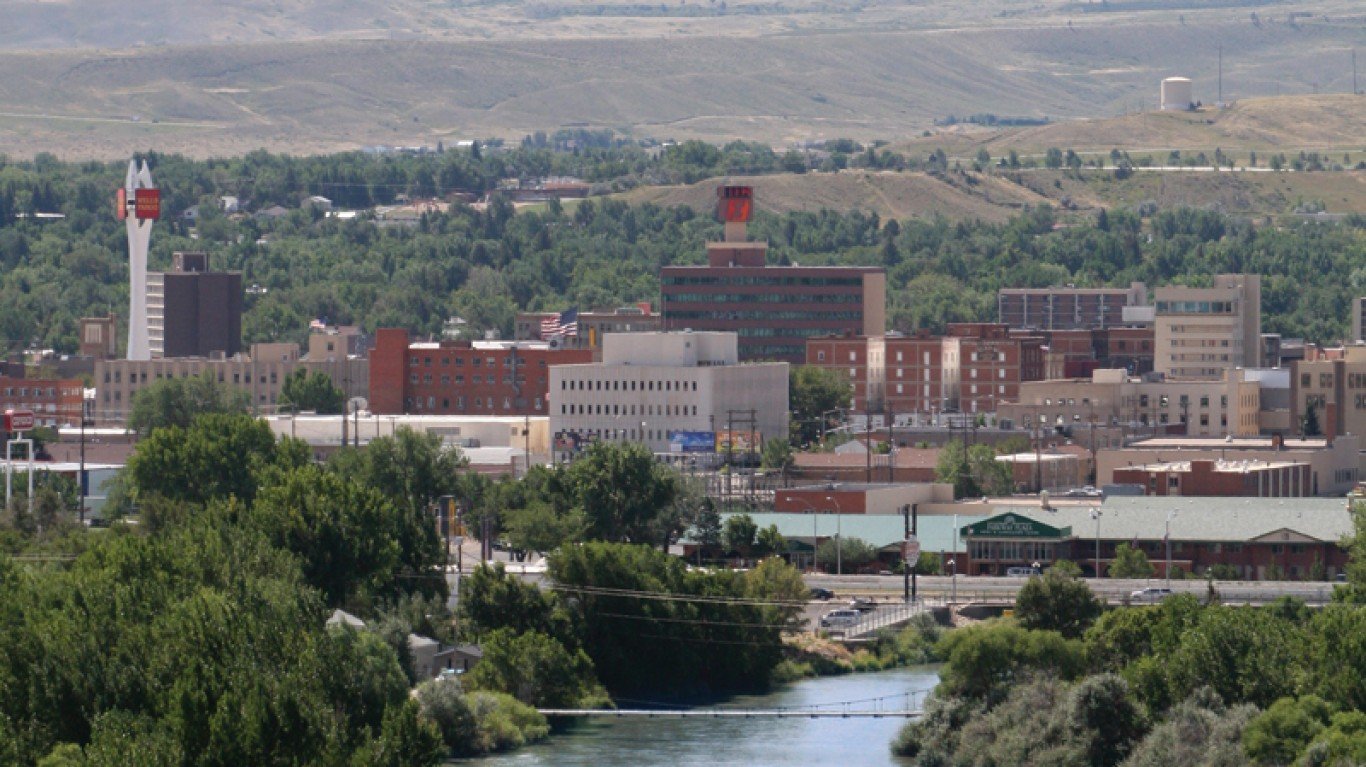
Wyoming: Casper
> Adults who don’t exercise: 23.6% (Wyoming: 23.1%)
> Pop. with access to places for physical activity: 85.6% (Wyoming: 76.5%)
> Adult obesity rate: 31.2% (Wyoming: 29.2%)
> Adults with diabetes: 9.1% (Wyoming: 9.0%)
> Adults reporting poor or fair health: 15.6% (Wyoming: 15.3%)
> Physically unhealthy days per month: 3.8 (Wyoming: 3.5)
Methodology
To determine the laziest metro in every state, 24/7 Tempo reviewed adult physical inactivity rates from the Robert Wood Johnson Foundation and the University of Wisconsin Population Health Institute joint program’s 2021 County Health Rankings & Roadmaps report.
The physical inactivity rate is defined as the share of adults 20 years and older who report no leisure-time physical activity. While the CHR report is from 2021, physical inactivity figures published in the report are from 2017.
We used the 384 metropolitan statistical areas as delineated by the United States Office of Management and Budget and used by the Census Bureau as our definition of metros.
Metros were ranked within their state based on the adult physical inactivity rate. Since many metros cross state lines, the metro was assigned to the state of its first-listed principal city. Thus, the Washington-Arlington-Alexandria, DC-VA-MD-WV metro area was excluded as it is principally in the District of Columbia.
Additional information on the share of the population with adequate access to locations for physical activity, the share of adults 20 years and older who report a body mass index of 30 kg/m2 or higher (adult obesity rate), the share of adults 20 years and older with diagnosed diabetes, the share of adults reporting poor or fair health, and the average number of physically unhealthy days reported in the past 30 days also came from the 2021 CHR.
Contact [email protected] for any questions or corrections.