
The United States has some of the highest levels of income and wealth inequality in the world. U.S. Federal Reserve data shows that the wealthiest 10% of Americans control $93.8 trillion, more than double the $40.3 trillion in the hands of the remaining 90% of Americans.
The income and wealth divide only appears to be growing wider. A January 2020 report published by the Pew Research Center found that over the last four decades, income growth for the top 5% of families by earnings has far outpaced income growth for families in lower income strata.
In a nation as large as the U.S., varied levels of income inequality may be expected. While some parts have wide income gaps, other parts of the country are defined, at least in part, by their relative income equality.
Using data from the U.S. Census Bureau’s 2019 American Community Survey, 24/7 Wall St. identified the 50 U.S. towns with the smallest income gaps. Towns are ranked by their Gini coefficient, a measure of income inequality based on the distribution of income across a population on a 0 to 1 scale — 0 representing perfect equality and 1 representing the highest possible level of inequality. For the purposes of this story, towns are defined as any place covered by the census with populations between 1,000 and 25,000.
Among the towns on this list, Gini scores range from 0.296 down to 0.212 — well below the national Gini coefficient of 0.482. The places on this list span the country but tend to be concentrated in the South. However, Illinois and Minnesota are each home to four towns on this list, more than in any other states.
Incomes are generally high in the places on this list. Most of the 50 towns with the lowest income inequality have a higher median household income than the national median of $62,843.
Causes behind rising inequality are complex and varied. A report published by the National Bureau of Economic Research ties the rising disparity to a range of economic factors, including globalization, technological advancement, a stagnant minimum wage, and the decline of labor unions.
Click here to see America’s towns with the smallest income gaps
Click here to see our detailed methodology
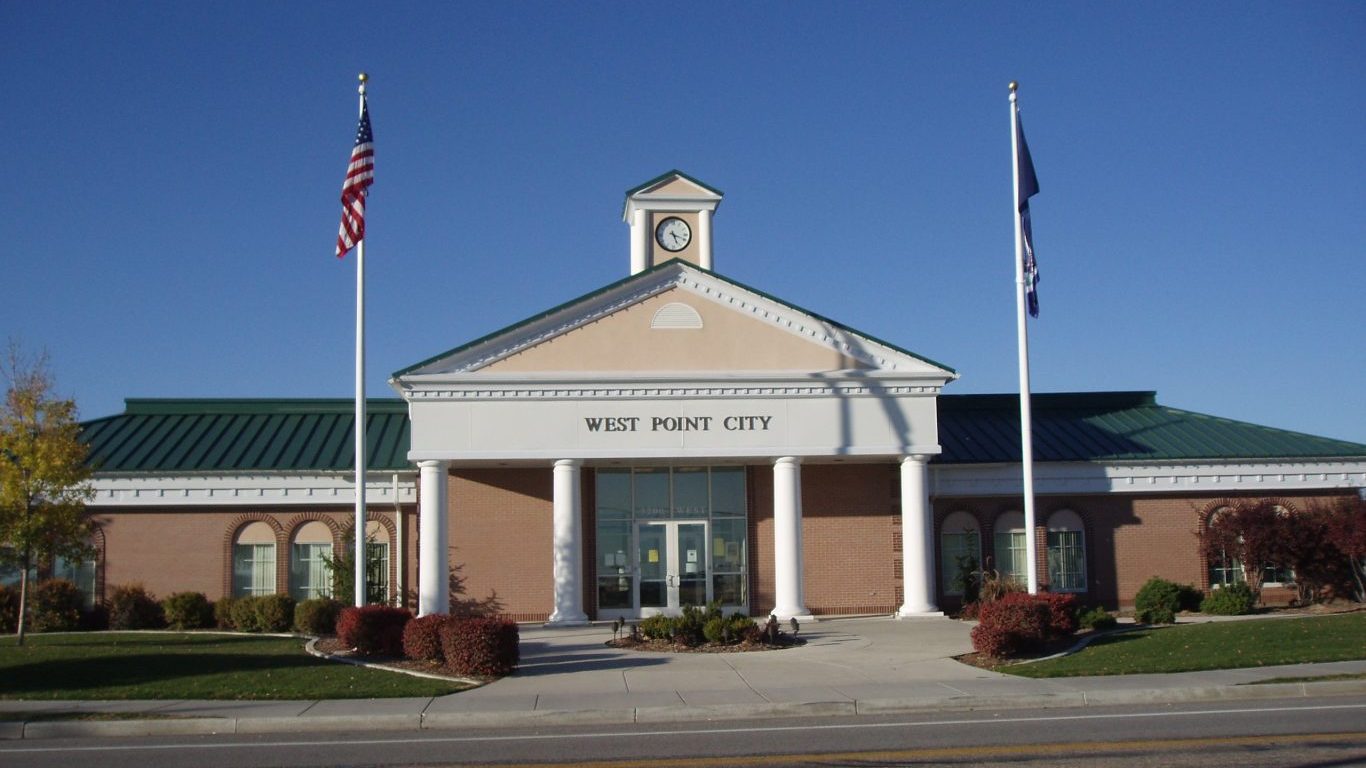
50. West Point, Utah
> Gini index: 0.296
> Avg. household income, top 20%: $192,882 — 2,725th highest of 7,632 towns
> Avg. household income, bottom 20%: $39,184 — 278th highest of 7,632 towns
> Share of all income in West Point that went to top 20%: 37.7% — 162nd lowest of 7,632 towns (tied)
> Share of all income in West Point that went to bottom 20%: 7.7% — 34th highest of 7,632 towns
> Median household income: $92,655 — 1,296th highest of 7,696 towns
[in-text-ad]
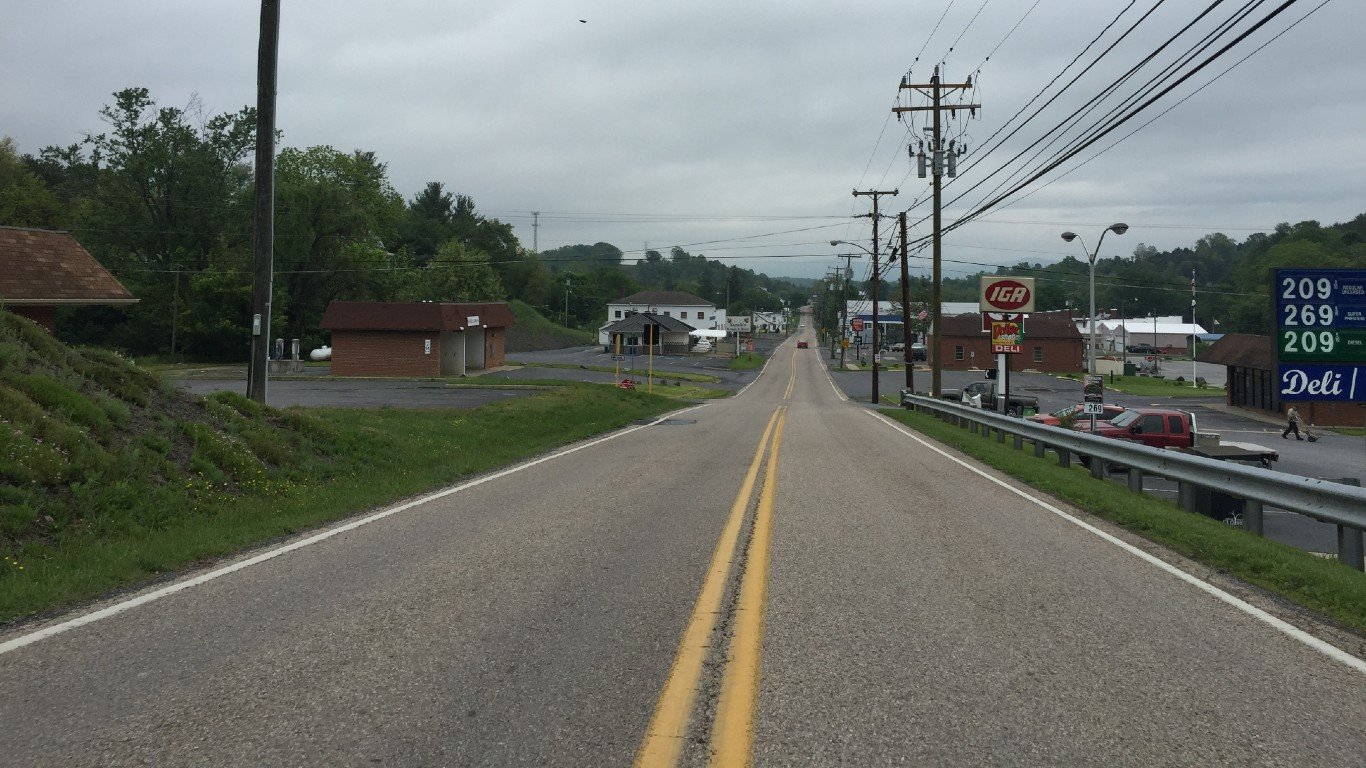
49. Inwood, West Virginia
> Gini index: 0.295
> Avg. household income, top 20%: $122,396 — 1,179th lowest of 7,632 towns
> Avg. household income, bottom 20%: $26,651 — 1,122nd highest of 7,632 towns
> Share of all income in Inwood that went to top 20%: 36.2% — 47th lowest of 7,632 towns
> Share of all income in Inwood that went to bottom 20%: 7.9% — 27th highest of 7,632 towns
> Median household income: $62,162 — 3,400th highest of 7,696 towns
[recirclink id=887395]
48. Frankfort Square, Illinois
> Gini index: 0.294
> Avg. household income, top 20%: $202,118 — 2,452nd highest of 7,632 towns
> Avg. household income, bottom 20%: $38,696 — 292nd highest of 7,632 towns
> Share of all income in Frankfort Square that went to top 20%: 36.8% — 85th lowest of 7,632 towns
> Share of all income in Frankfort Square that went to bottom 20%: 7.0% — 86th highest of 7,632 towns
> Median household income: $99,951 — 1,040th highest of 7,696 towns
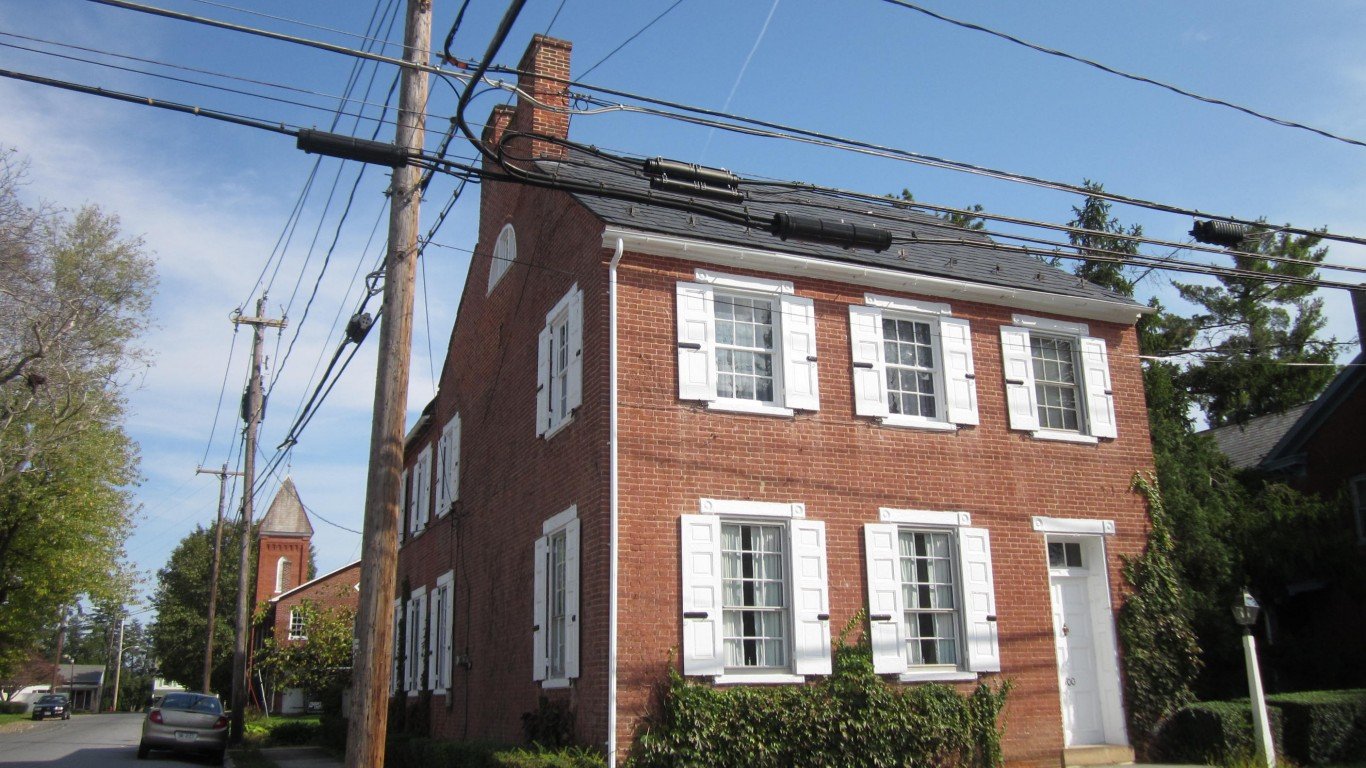
47. Maytown, Pennsylvania
> Gini index: 0.294
> Avg. household income, top 20%: $143,829 — 2,574th lowest of 7,632 towns
> Avg. household income, bottom 20%: $25,323 — 1,305th highest of 7,632 towns (tied)
> Share of all income in Maytown that went to top 20%: 35.0% — 15th lowest of 7,632 towns
> Share of all income in Maytown that went to bottom 20%: 6.2% — 314th highest of 7,632 towns (tied)
> Median household income: $77,152 — 2,141st highest of 7,696 towns
[in-text-ad-2]

46. Grayson, Georgia
> Gini index: 0.294
> Avg. household income, top 20%: $217,229 — 2,056th highest of 7,632 towns
> Avg. household income, bottom 20%: $46,076 — 130th highest of 7,632 towns
> Share of all income in Grayson that went to top 20%: 36.7% — 74th lowest of 7,632 towns (tied)
> Share of all income in Grayson that went to bottom 20%: 7.8% — 32nd highest of 7,632 towns
> Median household income: $111,528 — 716th highest of 7,696 towns
45. Carver, Minnesota
> Gini index: 0.293
> Avg. household income, top 20%: $252,183 — 1,434th highest of 7,632 towns
> Avg. household income, bottom 20%: $53,668 — 57th highest of 7,632 towns
> Share of all income in Carver that went to top 20%: 37.5% — 148th lowest of 7,632 towns (tied)
> Share of all income in Carver that went to bottom 20%: 8.0% — 20th highest of 7,632 towns
> Median household income: $114,906 — 638th highest of 7,696 towns
[in-text-ad]
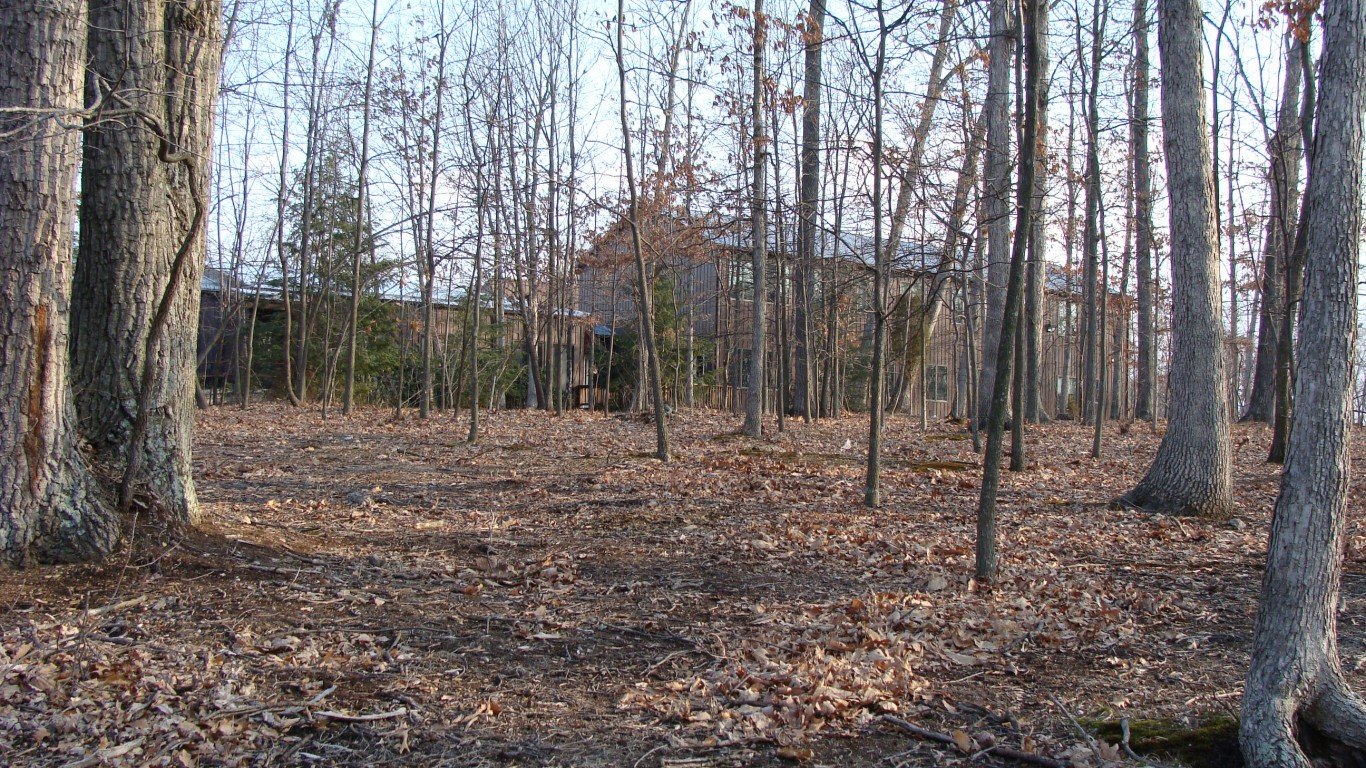
44. Independent Hill, Virginia
> Gini index: 0.293
> Avg. household income, top 20%: $346,290 — 579th highest of 7,632 towns
> Avg. household income, bottom 20%: $68,812 — 11th highest of 7,632 towns
> Share of all income in Independent Hill that went to top 20%: 37.0% — 96th lowest of 7,632 towns
> Share of all income in Independent Hill that went to bottom 20%: 7.3% — 52nd highest of 7,632 towns (tied)
> Median household income: $173,358 — 122nd highest of 7,696 towns
[recirclink id=848904]
43. Mountain House, California
> Gini index: 0.293
> Avg. household income, top 20%: $278,892 — 1,119th highest of 7,632 towns
> Avg. household income, bottom 20%: $51,898 — 68th highest of 7,632 towns
> Share of all income in Mountain House that went to top 20%: 36.5% — 64th lowest of 7,632 towns (tied)
> Share of all income in Mountain House that went to bottom 20%: 6.8% — 119th highest of 7,632 towns (tied)
> Median household income: $140,801 — 281st highest of 7,696 towns
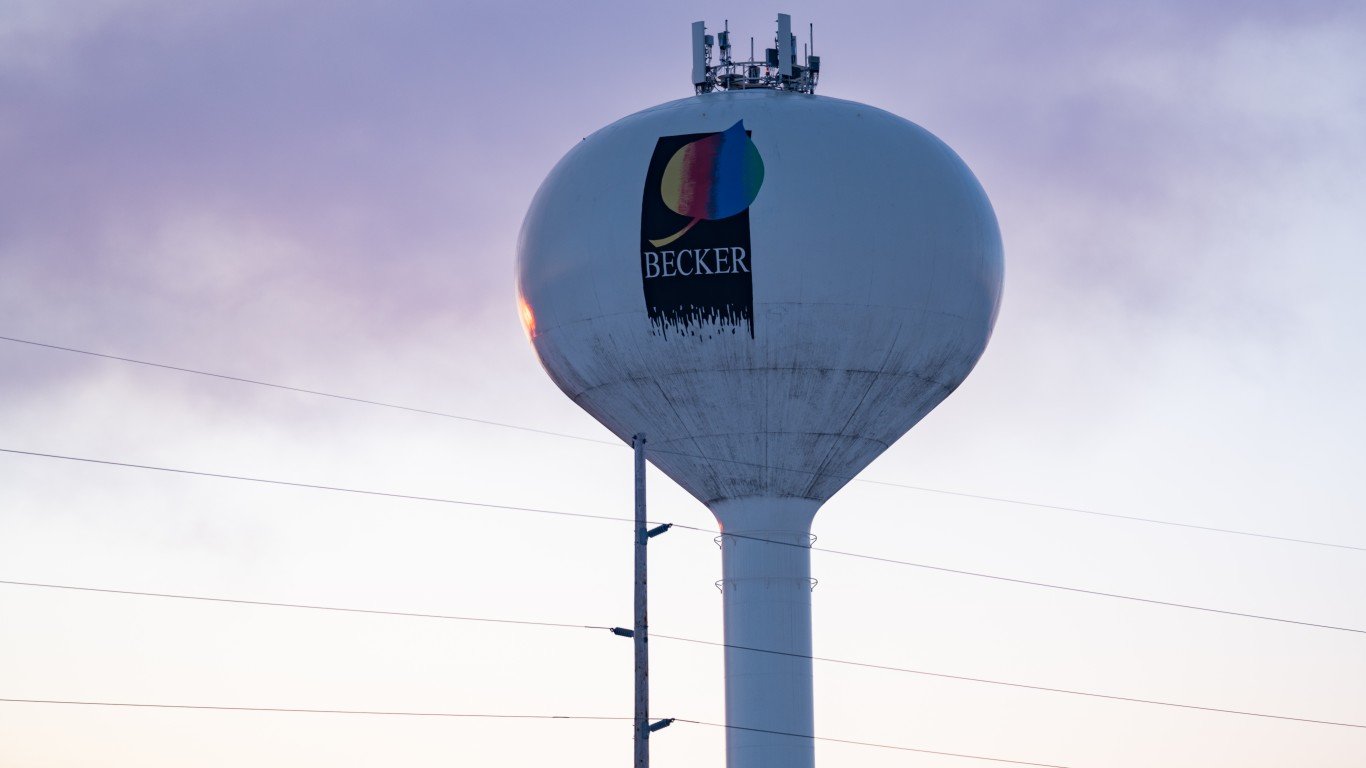
42. Becker, Minnesota
> Gini index: 0.293
> Avg. household income, top 20%: $174,595 — 3,422nd highest of 7,632 towns
> Avg. household income, bottom 20%: $31,135 — 695th highest of 7,632 towns
> Share of all income in Becker that went to top 20%: 35.1% — 16th lowest of 7,632 towns
> Share of all income in Becker that went to bottom 20%: 6.3% — 276th highest of 7,632 towns (tied)
> Median household income: $93,498 — 1,263rd highest of 7,696 towns
[in-text-ad-2]

41. Hidden Valley, Indiana
> Gini index: 0.292
> Avg. household income, top 20%: $191,329 — 2,777th highest of 7,632 towns
> Avg. household income, bottom 20%: $37,923 — 318th highest of 7,632 towns
> Share of all income in Hidden Valley that went to top 20%: 35.7% — 32nd lowest of 7,632 towns
> Share of all income in Hidden Valley that went to bottom 20%: 7.1% — 81st highest of 7,632 towns
> Median household income: $107,000 — 834th highest of 7,696 towns
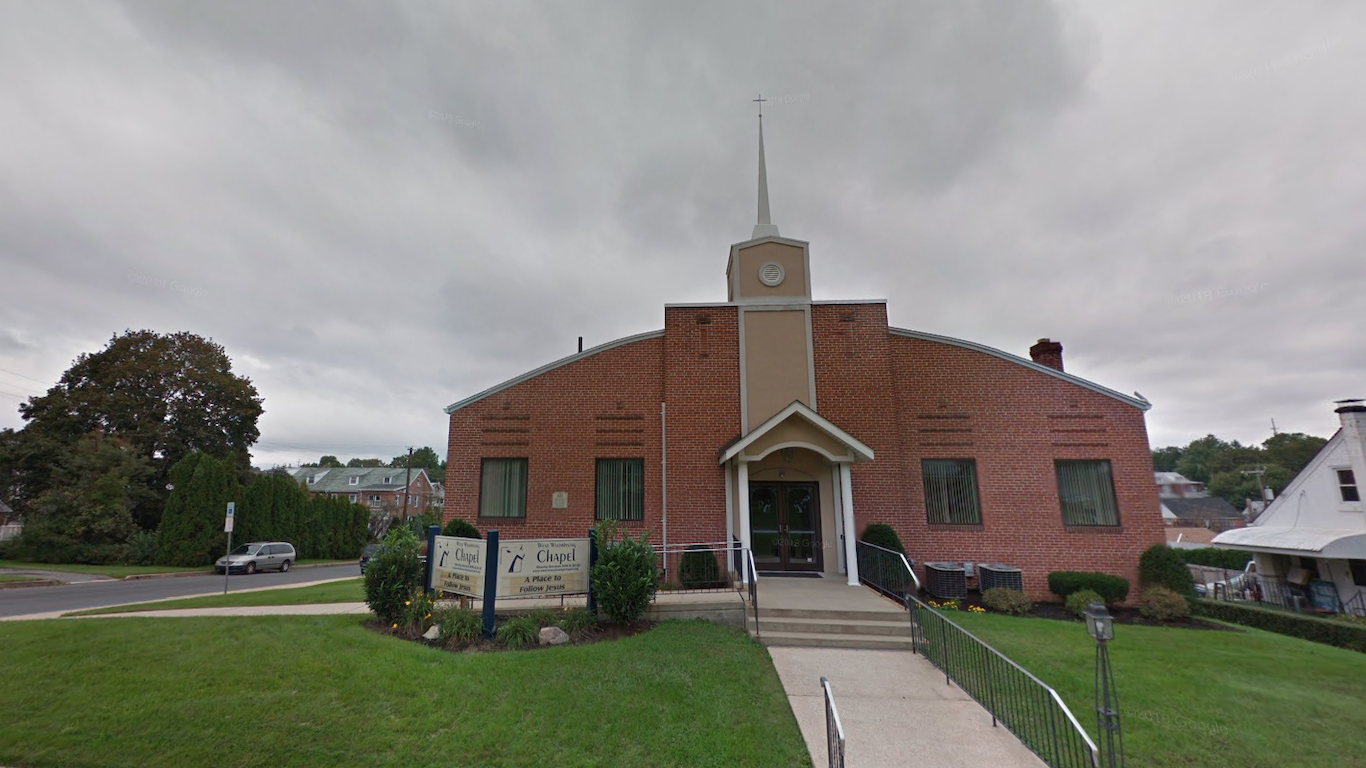
40. West Wyomissing, Pennsylvania
> Gini index: 0.29
> Avg. household income, top 20%: $134,350 — 1,960th lowest of 7,632 towns
> Avg. household income, bottom 20%: $26,970 — 1,074th highest of 7,632 towns
> Share of all income in West Wyomissing that went to top 20%: 35.8% — 36th lowest of 7,632 towns (tied)
> Share of all income in West Wyomissing that went to bottom 20%: 7.2% — 69th highest of 7,632 towns
> Median household income: $74,063 — 2,350th highest of 7,696 towns (tied)
[in-text-ad]

39. Lake Holiday, Illinois
> Gini index: 0.289
> Avg. household income, top 20%: $158,079 — 3,440th lowest of 7,632 towns
> Avg. household income, bottom 20%: $31,212 — 691st highest of 7,632 towns
> Share of all income in Lake Holiday that went to top 20%: 35.4% — 23rd lowest of 7,632 towns
> Share of all income in Lake Holiday that went to bottom 20%: 7.0% — 89th highest of 7,632 towns (tied)
> Median household income: $85,648 — 1,629th highest of 7,696 towns
[recirclink id=850383]

38. Schofield Barracks, Hawaii
> Gini index: 0.288
> Avg. household income, top 20%: $119,337 — 1,010th lowest of 7,632 towns
> Avg. household income, bottom 20%: $24,510 — 1,418th highest of 7,632 towns
> Share of all income in Schofield Barracks that went to top 20%: 36.3% — 51st lowest of 7,632 towns
> Share of all income in Schofield Barracks that went to bottom 20%: 7.4% — 46th highest of 7,632 towns
> Median household income: $60,966 — 3,518th highest of 7,696 towns

37. Volo, Illinois
> Gini index: 0.288
> Avg. household income, top 20%: $192,806 — 2,728th highest of 7,632 towns
> Avg. household income, bottom 20%: $40,796 — 238th highest of 7,632 towns
> Share of all income in Volo that went to top 20%: 36.8% — 89th lowest of 7,632 towns
> Share of all income in Volo that went to bottom 20%: 7.8% — 31st highest of 7,632 towns
> Median household income: $92,500 — 1,303rd highest of 7,696 towns
[in-text-ad-2]
36. Verona, Virginia
> Gini index: 0.288
> Avg. household income, top 20%: $99,211 — 240th lowest of 7,632 towns
> Avg. household income, bottom 20%: $19,029 — 2,524th highest of 7,632 towns
> Share of all income in Verona that went to top 20%: 35.6% — 30th lowest of 7,632 towns
> Share of all income in Verona that went to bottom 20%: 6.8% — 110th highest of 7,632 towns (tied)
> Median household income: $49,828 — 2,773rd lowest of 7,696 towns

35. Redwood, Texas
> Gini index: 0.287
> Avg. household income, top 20%: $114,141 — 754th lowest of 7,632 towns
> Avg. household income, bottom 20%: $26,740 — 1,106th highest of 7,632 towns
> Share of all income in Redwood that went to top 20%: 37.7% — 169th lowest of 7,632 towns (tied)
> Share of all income in Redwood that went to bottom 20%: 8.8% — 4th highest of 7,632 towns
> Median household income: $51,455 — 2,989th lowest of 7,696 towns
[in-text-ad]

34. McGuire, New Jersey
> Gini index: 0.287
> Avg. household income, top 20%: $144,643 — 2,621st lowest of 7,632 towns
> Avg. household income, bottom 20%: $33,246 — 548th highest of 7,632 towns
> Share of all income in McGuire that went to top 20%: 36.4% — 58th lowest of 7,632 towns (tied)
> Share of all income in McGuire that went to bottom 20%: 8.4% — 10th highest of 7,632 towns (tied)
> Median household income: $71,827 — 2,537th highest of 7,696 towns (tied)
[recirclink id=920281]
33. Long Lake, Illinois
> Gini index: 0.286
> Avg. household income, top 20%: $156,085 — 3,326th lowest of 7,632 towns
> Avg. household income, bottom 20%: $32,608 — 598th highest of 7,632 towns
> Share of all income in Long Lake that went to top 20%: 34.5% — 8th lowest of 7,632 towns
> Share of all income in Long Lake that went to bottom 20%: 7.2% — 65th highest of 7,632 towns (tied)
> Median household income: $87,895 — 1,510th highest of 7,696 towns

32. Heron Bay, Georgia
> Gini index: 0.286
> Avg. household income, top 20%: $229,461 — 1,808th highest of 7,632 towns
> Avg. household income, bottom 20%: $49,615 — 86th highest of 7,632 towns
> Share of all income in Heron Bay that went to top 20%: 36.7% — 73rd lowest of 7,632 towns
> Share of all income in Heron Bay that went to bottom 20%: 7.9% — 24th highest of 7,632 towns
> Median household income: $109,091 — 767th highest of 7,696 towns
[in-text-ad-2]
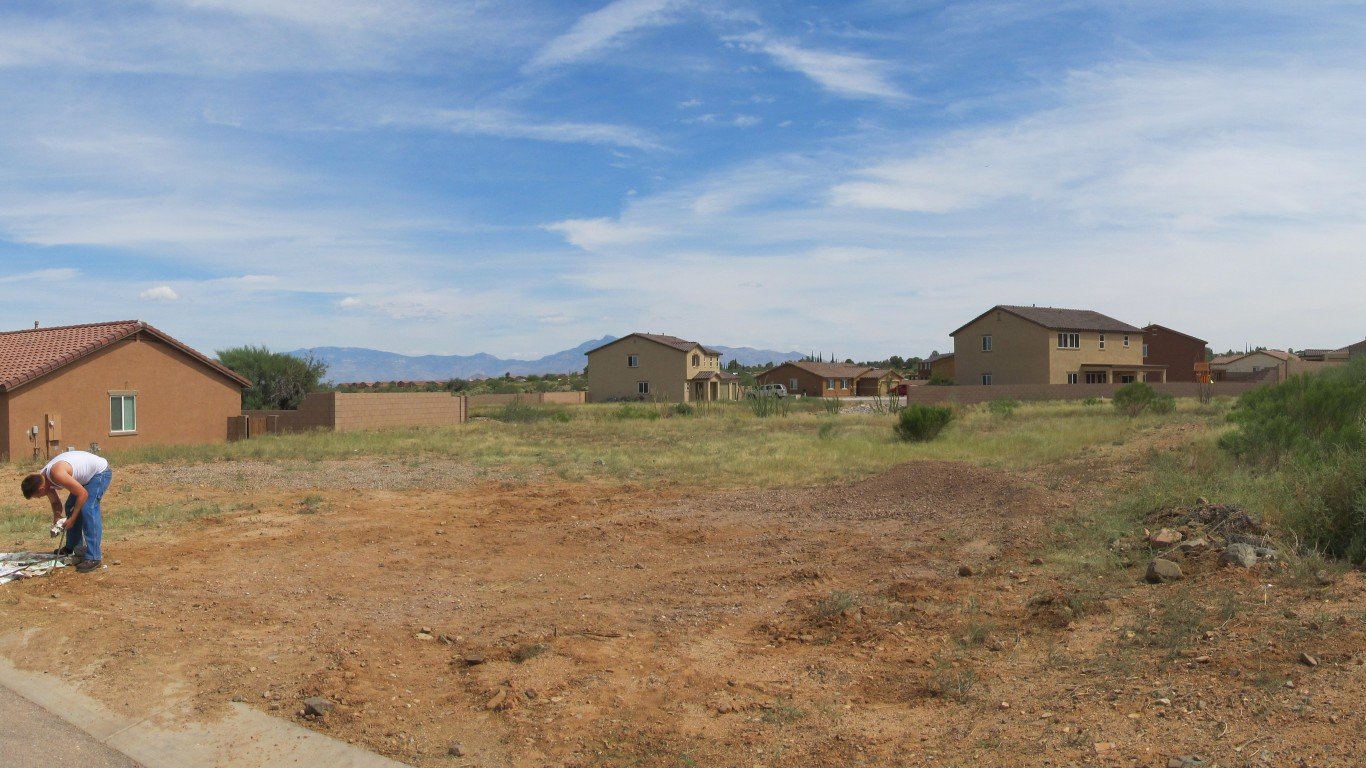
31. Corona de Tucson, Arizona
> Gini index: 0.285
> Avg. household income, top 20%: $189,754 — 2,839th highest of 7,632 towns
> Avg. household income, bottom 20%: $40,867 — 236th highest of 7,632 towns
> Share of all income in Corona de Tucson that went to top 20%: 36.4% — 56th lowest of 7,632 towns (tied)
> Share of all income in Corona de Tucson that went to bottom 20%: 7.8% — 28th highest of 7,632 towns
> Median household income: $97,287 — 1,120th highest of 7,696 towns
30. Camp Pendleton North, California
> Gini index: 0.285
> Avg. household income, top 20%: $113,061 — 704th lowest of 7,632 towns
> Avg. household income, bottom 20%: $27,523 — 1,024th highest of 7,632 towns
> Share of all income in Camp Pendleton North that went to top 20%: 37.2% — 115th lowest of 7,632 towns
> Share of all income in Camp Pendleton North that went to bottom 20%: 9.1% — 2nd highest of 7,632 towns
> Median household income: $54,214 — 3,370th lowest of 7,696 towns
[in-text-ad]

29. Lincoln, North Dakota
> Gini index: 0.284
> Avg. household income, top 20%: $163,652 — 3,723rd lowest of 7,632 towns
> Avg. household income, bottom 20%: $32,453 — 604th highest of 7,632 towns
> Share of all income in Lincoln that went to top 20%: 34.3% — 7th lowest of 7,632 towns
> Share of all income in Lincoln that went to bottom 20%: 6.8% — 116th highest of 7,632 towns (tied)
> Median household income: $90,231 — 1,411th highest of 7,696 towns
[recirclink id=970377]
28. Malmstrom, Montana
> Gini index: 0.283
> Avg. household income, top 20%: $108,280 — 513th lowest of 7,632 towns
> Avg. household income, bottom 20%: $24,592 — 1,409th highest of 7,632 towns
> Share of all income in Malmstrom that went to top 20%: 37.5% — 148th lowest of 7,632 towns (tied)
> Share of all income in Malmstrom that went to bottom 20%: 8.5% — 8th highest of 7,632 towns
> Median household income: $51,410 — 2,984th lowest of 7,696 towns

27. Waikele, Hawaii
> Gini index: 0.283
> Avg. household income, top 20%: $202,699 — 2,437th highest of 7,632 towns
> Avg. household income, bottom 20%: $44,613 — 155th highest of 7,632 towns
> Share of all income in Waikele that went to top 20%: 35.9% — 39th lowest of 7,632 towns
> Share of all income in Waikele that went to bottom 20%: 7.9% — 26th highest of 7,632 towns
> Median household income: $107,578 — 814th highest of 7,696 towns
[in-text-ad-2]

26. Calcium, New York
> Gini index: 0.283
> Avg. household income, top 20%: $108,451 — 521st lowest of 7,632 towns
> Avg. household income, bottom 20%: $23,571 — 1,584th highest of 7,632 towns (tied)
> Share of all income in Calcium that went to top 20%: 37.1% — 108th lowest of 7,632 towns
> Share of all income in Calcium that went to bottom 20%: 8.1% — 17th highest of 7,632 towns
> Median household income: $53,289 — 3,238th lowest of 7,696 towns
25. Fort Irwin, California
> Gini index: 0.283
> Avg. household income, top 20%: $111,004 — 617th lowest of 7,632 towns
> Avg. household income, bottom 20%: $25,333 — 1,304th highest of 7,632 towns
> Share of all income in Fort Irwin that went to top 20%: 36.7% — 81st lowest of 7,632 towns
> Share of all income in Fort Irwin that went to bottom 20%: 8.4% — 9th highest of 7,632 towns
> Median household income: $54,787 — 3,450th lowest of 7,696 towns
[in-text-ad]
24. Odenville, Alabama
> Gini index: 0.282
> Avg. household income, top 20%: $139,902 — 2,325th lowest of 7,632 towns
> Avg. household income, bottom 20%: $28,246 — 946th highest of 7,632 towns
> Share of all income in Odenville that went to top 20%: 34.6% — 9th lowest of 7,632 towns
> Share of all income in Odenville that went to bottom 20%: 7.0% — 89th highest of 7,632 towns (tied)
> Median household income: $82,582 — 1,790th highest of 7,696 towns
[recirclink id=887395]
23. Harrisville, Utah
> Gini index: 0.282
> Avg. household income, top 20%: $153,081 — 3,146th lowest of 7,632 towns
> Avg. household income, bottom 20%: $36,828 — 358th highest of 7,632 towns
> Share of all income in Harrisville that went to top 20%: 36.4% — 60th lowest of 7,632 towns
> Share of all income in Harrisville that went to bottom 20%: 8.8% — 5th highest of 7,632 towns
> Median household income: $74,342 — 2,326th highest of 7,696 towns

22. Hallam, Pennsylvania
> Gini index: 0.281
> Avg. household income, top 20%: $113,943 — 743rd lowest of 7,632 towns
> Avg. household income, bottom 20%: $24,975 — 1,351st highest of 7,632 towns (tied)
> Share of all income in Hallam that went to top 20%: 35.6% — 29th lowest of 7,632 towns
> Share of all income in Hallam that went to bottom 20%: 7.8% — 29th highest of 7,632 towns (tied)
> Median household income: $60,471 — 3,571st highest of 7,696 towns
[in-text-ad-2]

21. Shannon Hills, Arkansas
> Gini index: 0.281
> Avg. household income, top 20%: $136,882 — 2,109th lowest of 7,632 towns
> Avg. household income, bottom 20%: $29,343 — 858th highest of 7,632 towns
> Share of all income in Shannon Hills that went to top 20%: 35.7% — 34th lowest of 7,632 towns
> Share of all income in Shannon Hills that went to bottom 20%: 7.7% — 36th highest of 7,632 towns
> Median household income: $69,461 — 2,737th highest of 7,696 towns

20. Fort Campbell North, Kentucky
> Gini index: 0.281
> Avg. household income, top 20%: $81,260 — 33rd lowest of 7,632 towns
> Avg. household income, bottom 20%: $17,507 — 2,971st highest of 7,632 towns (tied)
> Share of all income in Fort Campbell North that went to top 20%: 36.2% — 49th lowest of 7,632 towns
> Share of all income in Fort Campbell North that went to bottom 20%: 7.8% — 29th highest of 7,632 towns (tied)
> Median household income: $39,917 — 1,281st lowest of 7,696 towns
[in-text-ad]

19. Huntingtown, Maryland
> Gini index: 0.281
> Avg. household income, top 20%: $265,275 — 1,269th highest of 7,632 towns
> Avg. household income, bottom 20%: $59,633 — 34th highest of 7,632 towns
> Share of all income in Huntingtown that went to top 20%: 35.3% — 22nd lowest of 7,632 towns
> Share of all income in Huntingtown that went to bottom 20%: 7.9% — 22nd highest of 7,632 towns (tied)
> Median household income: $139,821 — 293rd highest of 7,696 towns
[recirclink id=848904]

18. Fort Rucker, Alabama
> Gini index: 0.28
> Avg. household income, top 20%: $121,531 — 1,136th lowest of 7,632 towns
> Avg. household income, bottom 20%: $24,677 — 1,390th highest of 7,632 towns
> Share of all income in Fort Rucker that went to top 20%: 34.8% — 13th lowest of 7,632 towns
> Share of all income in Fort Rucker that went to bottom 20%: 7.1% — 82nd highest of 7,632 towns (tied)
> Median household income: $70,024 — 2,688th highest of 7,696 towns

17. Bangor Base, Washington
> Gini index: 0.28
> Avg. household income, top 20%: $100,175 — 259th lowest of 7,632 towns
> Avg. household income, bottom 20%: $16,309 — 3,353rd highest of 7,632 towns (tied)
> Share of all income in Bangor Base that went to top 20%: 33.4% — 4th lowest of 7,632 towns
> Share of all income in Bangor Base that went to bottom 20%: 5.4% — 767th highest of 7,632 towns (tied)
> Median household income: $57,134 — 3,753rd lowest of 7,696 towns
[in-text-ad-2]

16. Bethel Manor, Virginia
> Gini index: 0.28
> Avg. household income, top 20%: $123,256 — 1,230th lowest of 7,632 towns
> Avg. household income, bottom 20%: $24,932 — 1,360th highest of 7,632 towns
> Share of all income in Bethel Manor that went to top 20%: 35.2% — 17th lowest of 7,632 towns
> Share of all income in Bethel Manor that went to bottom 20%: 7.1% — 74th highest of 7,632 towns (tied)
> Median household income: $65,387 — 3,070th highest of 7,696 towns

15. Brices Creek, North Carolina
> Gini index: 0.28
> Avg. household income, top 20%: $202,011 — 2,454th highest of 7,632 towns
> Avg. household income, bottom 20%: $41,493 — 215th highest of 7,632 towns
> Share of all income in Brices Creek that went to top 20%: 36.0% — 41st lowest of 7,632 towns (tied)
> Share of all income in Brices Creek that went to bottom 20%: 7.4% — 51st highest of 7,632 towns
> Median household income: $102,171 — 973rd highest of 7,696 towns
[in-text-ad]

14. Poolesville, Maryland
> Gini index: 0.28
> Avg. household income, top 20%: $314,859 — 759th highest of 7,632 towns
> Avg. household income, bottom 20%: $64,474 — 21st highest of 7,632 towns
> Share of all income in Poolesville that went to top 20%: 34.7% — 10th lowest of 7,632 towns (tied)
> Share of all income in Poolesville that went to bottom 20%: 7.1% — 76th highest of 7,632 towns (tied)
> Median household income: $180,524 — 99th highest of 7,696 towns
[recirclink id=850383]

13. Barnhart, Missouri
> Gini index: 0.279
> Avg. household income, top 20%: $163,731 — 3,727th lowest of 7,632 towns
> Avg. household income, bottom 20%: $36,442 — 373rd highest of 7,632 towns
> Share of all income in Barnhart that went to top 20%: 36.5% — 64th lowest of 7,632 towns (tied)
> Share of all income in Barnhart that went to bottom 20%: 8.1% — 16th highest of 7,632 towns
> Median household income: $81,922 — 1,837th highest of 7,696 towns
12. Cavalero, Washington
> Gini index: 0.278
> Avg. household income, top 20%: $221,670 — 1,956th highest of 7,632 towns
> Avg. household income, bottom 20%: $46,729 — 119th highest of 7,632 towns
> Share of all income in Cavalero that went to top 20%: 35.8% — 36th lowest of 7,632 towns (tied)
> Share of all income in Cavalero that went to bottom 20%: 7.5% — 41st highest of 7,632 towns
> Median household income: $112,768 — 690th highest of 7,696 towns
[in-text-ad-2]
11. Country Lake Estates, New Jersey
> Gini index: 0.278
> Avg. household income, top 20%: $150,653 — 3,013th lowest of 7,632 towns
> Avg. household income, bottom 20%: $30,845 — 715th highest of 7,632 towns
> Share of all income in Country Lake Estates that went to top 20%: 35.0% — 14th lowest of 7,632 towns
> Share of all income in Country Lake Estates that went to bottom 20%: 7.2% — 71st highest of 7,632 towns
> Median household income: $87,549 — 1,526th highest of 7,696 towns

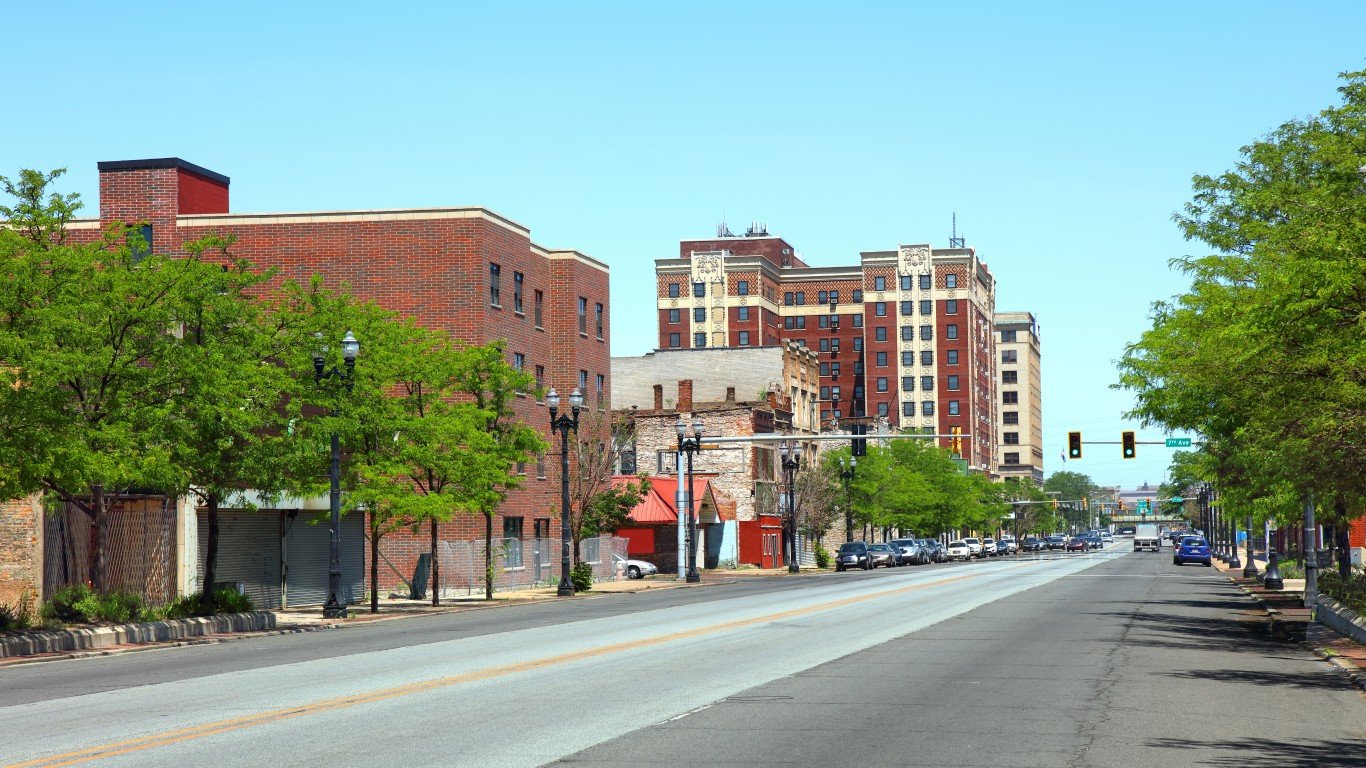
10. Hebron, Kentucky
> Gini index: 0.273
> Avg. household income, top 20%: $175,621 — 3,378th highest of 7,632 towns
> Avg. household income, bottom 20%: $42,446 — 199th highest of 7,632 towns
> Share of all income in Hebron that went to top 20%: 35.3% — 21st lowest of 7,632 towns
> Share of all income in Hebron that went to bottom 20%: 8.5% — 7th highest of 7,632 towns
> Median household income: $89,602 — 1,437th highest of 7,696 towns
[in-text-ad]

9. Iroquois Point, Hawaii
> Gini index: 0.272
> Avg. household income, top 20%: $171,101 — 3,563rd highest of 7,632 towns
> Avg. household income, bottom 20%: $40,019 — 257th highest of 7,632 towns
> Share of all income in Iroquois Point that went to top 20%: 35.2% — 18th lowest of 7,632 towns
> Share of all income in Iroquois Point that went to bottom 20%: 8.2% — 14th highest of 7,632 towns
> Median household income: $91,250 — 1,358th highest of 7,696 towns (tied)
[recirclink id=920281]
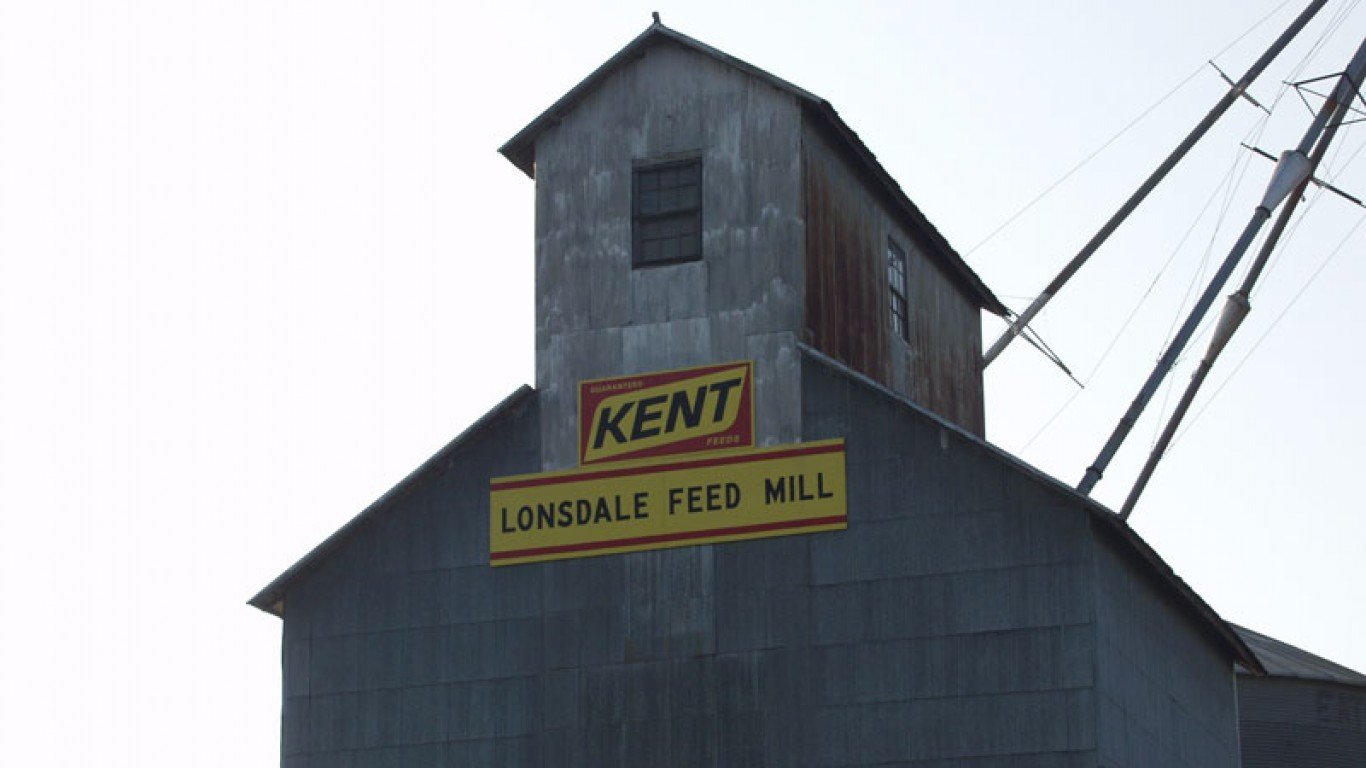
8. Lonsdale, Minnesota
> Gini index: 0.267
> Avg. household income, top 20%: $144,835 — 2,631st lowest of 7,632 towns
> Avg. household income, bottom 20%: $30,307 — 768th highest of 7,632 towns
> Share of all income in Lonsdale that went to top 20%: 33.1% — 3rd lowest of 7,632 towns
> Share of all income in Lonsdale that went to bottom 20%: 6.9% — 98th highest of 7,632 towns (tied)
> Median household income: $90,509 — 1,398th highest of 7,696 towns

7. Springdale, Maryland
> Gini index: 0.266
> Avg. household income, top 20%: $217,424 — 2,051st highest of 7,632 towns
> Avg. household income, bottom 20%: $52,452 — 64th highest of 7,632 towns
> Share of all income in Springdale that went to top 20%: 34.7% — 10th lowest of 7,632 towns (tied)
> Share of all income in Springdale that went to bottom 20%: 8.4% — 10th highest of 7,632 towns (tied)
> Median household income: $121,850 — 529th highest of 7,696 towns
[in-text-ad-2]

6. Margaret, Alabama
> Gini index: 0.263
> Avg. household income, top 20%: $130,525 — 1,692nd lowest of 7,632 towns
> Avg. household income, bottom 20%: $32,213 — 628th highest of 7,632 towns (tied)
> Share of all income in Margaret that went to top 20%: 34.8% — 12th lowest of 7,632 towns
> Share of all income in Margaret that went to bottom 20%: 8.6% — 6th highest of 7,632 towns
> Median household income: $72,200 — 2,511th highest of 7,696 towns
5. Harrisburg, South Dakota
> Gini index: 0.259
> Avg. household income, top 20%: $146,946 — 2,769th lowest of 7,632 towns
> Avg. household income, bottom 20%: $34,215 — 499th highest of 7,632 towns (tied)
> Share of all income in Harrisburg that went to top 20%: 34.1% — 6th lowest of 7,632 towns
> Share of all income in Harrisburg that went to bottom 20%: 7.9% — 21st highest of 7,632 towns
> Median household income: $81,359 — 1,864th highest of 7,696 towns
[in-text-ad]
4. Bondurant, Iowa
> Gini index: 0.258
> Avg. household income, top 20%: $162,479 — 3,674th lowest of 7,632 towns
> Avg. household income, bottom 20%: $37,441 — 336th highest of 7,632 towns
> Share of all income in Bondurant that went to top 20%: 33.5% — 5th lowest of 7,632 towns
> Share of all income in Bondurant that went to bottom 20%: 7.7% — 33rd highest of 7,632 towns
> Median household income: $97,786 — 1,104th highest of 7,696 towns
[recirclink id=970377]

3. Snowmass Village, Colorado
> Gini index: 0.246
> Avg. household income, top 20%: N/A
> Avg. household income, bottom 20%: N/A
> Share of all income in Snowmass Village that went to top 20%: N/A
> Share of all income in Snowmass Village that went to bottom 20%: N/A
> Median household income: $70,634 — 2,635th highest of 7,696 towns

2. Stansbury Park, Utah
> Gini index: 0.238
> Avg. household income, top 20%: $172,037 — 3,540th highest of 7,632 towns
> Avg. household income, bottom 20%: $46,968 — 113th highest of 7,632 towns
> Share of all income in Stansbury Park that went to top 20%: 32.9% — 2nd lowest of 7,632 towns
> Share of all income in Stansbury Park that went to bottom 20%: 9.0% — 3rd highest of 7,632 towns
> Median household income: $101,122 — 1,006th highest of 7,696 towns
[in-text-ad-2]
1. Elko New Market, Minnesota
> Gini index: 0.212
> Avg. household income, top 20%: $220,043 — 1,995th highest of 7,632 towns
> Avg. household income, bottom 20%: $74,667 — 7th highest of 7,632 towns
> Share of all income in Elko New Market that went to top 20%: 32.5% — the lowest of 7,632 towns
> Share of all income in Elko New Market that went to bottom 20%: 11.0% — the highest of 7,632 towns
> Median household income: $123,294 — 507th highest of 7,696 towns
Methodology
To determine the towns with the smallest income gaps in the nation, 24/7 Wall St. reviewed five-year estimates of the Gini Index of income inequality from the U.S. Census Bureau’s 2019 American Community Survey.
The Gini Index of income inequality summarizes income dispersion in an area on a scale from 0 to 1. A value of 0 indicates perfect equality — everyone in the area receives an equal share of income. A value of 1 indicates perfect inequality — only one recipient receives all the income.
We used census “place” geographies — a category that includes 29,573 incorporated legal entities and census-designated statistical entities. Of those, 29,320 had boundaries that fell within one of the 50 states or the District of Columbia.
We defined towns based on population thresholds — having at least 1,000 people and less than 25,000 people — and 13,332 of the places fell within these thresholds.
Towns were excluded if the Gini Index was not available in the 2019 ACS, if there were fewer than 1,000 housing units, or if the sampling error associated with a town’s data was deemed too high.
The sampling error was defined as too high if the coefficient of variation — a statistical assessment of how reliable an estimate is — for a town’s Gini Index was above 15% and greater than two standard deviations above the mean CV for all towns’ Gini Indices. We similarly excluded towns that had a sampling error too high for their population, using the same definition.
The remaining 7,698 places were ranked based on their Gini Index. To break ties, we used the share of aggregate household income earned by the top 20% of households.
Additional information on average household income by quintile, share of aggregate household income by quintile, and median household income are also five-year estimates from the 2019 ACS.
Contact [email protected] for any questions or corrections.