
The United States has some of the highest levels of income and wealth inequality in the world. U.S. Federal Reserve data shows that the wealthiest 10% of Americans control $93.8 trillion, more than double the $40.3 trillion in the hands of the remaining 90% of Americans.
The income and wealth divide only appears to be growing wider. A January 2020 report published by the Pew Research Center found that over the last four decades, income growth for the top 5% of families by earnings has far outpaced income growth for families in the lower income strata.
Using data from the U.S. Census Bureau’s 2019 American Community Survey, 24/7 Wall St. identified the metro area with the widest income gap in each state. Metropolitan areas are ranked by their Gini coefficient, a measure of income inequality based on the distribution of income across a population on a 0 to 1 scale — 0 representing perfect equality and 1 representing the highest possible level of inequality. Four states — Delaware, New Hampshire, Rhode Island, and Vermont — have only one metro area. As a result, these areas rank as having the worst income inequality in the state by default only.
Though each metro area on this list has the highest degree of income inequality in its state, Gini scores vary considerably — from as low as 0.416 up to 0.541. Nationwide, the Gini coefficient stands at 0.481.
Causes behind rising inequality in the United States are complex and varied. A report published by the National Bureau of Economic Research ties the rising disparity to a range of economic factors, including globalization, technological advancement, a stagnant minimum wage, and the decline of labor unions.
Click here to see the metro area with the widest income gap in every state
Click here to read our detailed methodology

Alabama: Auburn-Opelika
> Gini index: 0.525 (Alabama: 0.474)
> Avg. household income, top 20%: $213,783 (Alabama: $180,469)
> Avg. household income, bottom 20%: $8,129 (Alabama: $10,916)
> Share of all income in Auburn-Opelika that went to top 20%: 54.8% (Alabama: 50.5%)
> Share of all income in Auburn-Opelika that went to bottom 20%: 2.1% (Alabama: 3.1%)
> Median household income: $53,712 (Alabama: $51,734)
[in-text-ad]

Alaska: Anchorage
> Gini index: 0.437 (Alaska: 0.438)
> Avg. household income, top 20%: $249,480 (Alaska: $234,221)
> Avg. household income, bottom 20%: $19,971 (Alaska: $18,408)
> Share of all income in Anchorage that went to top 20%: 47.5% (Alaska: 47.5%)
> Share of all income in Anchorage that went to bottom 20%: 3.8% (Alaska: 3.7%)
> Median household income: $80,676 (Alaska: $75,463)
[recirclink id=887395]

Arizona: Flagstaff
> Gini index: 0.483 (Arizona: 0.459)
> Avg. household income, top 20%: $206,645 (Arizona: $209,819)
> Avg. household income, bottom 20%: $9,935 (Arizona: $14,754)
> Share of all income in Flagstaff that went to top 20%: 50.9% (Arizona: 49.7%)
> Share of all income in Flagstaff that went to bottom 20%: 2.5% (Arizona: 3.5%)
> Median household income: $58,085 (Arizona: $62,055)

Arkansas: Jonesboro
> Gini index: 0.489 (Arkansas: 0.475)
> Avg. household income, top 20%: $175,155 (Arkansas: $173,941)
> Avg. household income, bottom 20%: $11,427 (Arkansas: $11,555)
> Share of all income in Jonesboro that went to top 20%: 52.2% (Arkansas: 51.0%)
> Share of all income in Jonesboro that went to bottom 20%: 3.4% (Arkansas: 3.4%)
> Median household income: $44,998 (Arkansas: $48,952)
[in-text-ad-2]

California: Chico
> Gini index: 0.521 (California: 0.487)
> Avg. household income, top 20%: $253,472 (California: $295,369)
> Avg. household income, bottom 20%: $12,420 (California: $16,981)
> Share of all income in Chico that went to top 20%: 55.3% (California: 52.0%)
> Share of all income in Chico that went to bottom 20%: 2.7% (California: 3.0%)
> Median household income: $62,563 (California: $80,440)

Colorado: Boulder
> Gini index: 0.496 (Colorado: 0.455)
> Avg. household income, top 20%: $333,016 (Colorado: $255,114)
> Avg. household income, bottom 20%: $17,144 (Colorado: $18,417)
> Share of all income in Boulder that went to top 20%: 52.9% (Colorado: 49.3%)
> Share of all income in Boulder that went to bottom 20%: 2.7% (Colorado: 3.6%)
> Median household income: $88,535 (Colorado: $77,127)
[in-text-ad]

Connecticut: Bridgeport-Stamford-Norwalk
> Gini index: 0.541 (Connecticut: 0.502)
> Avg. household income, top 20%: $459,737 (Connecticut: $306,153)
> Avg. household income, bottom 20%: $19,234 (Connecticut: $16,037)
> Share of all income in Bridgeport-Stamford-Norwalk that went to top 20%: 57.6% (Connecticut: 53.4%)
> Share of all income in Bridgeport-Stamford-Norwalk that went to bottom 20%: 2.4% (Connecticut: 2.8%)
> Median household income: $97,053 (Connecticut: $78,833)
[recirclink id=848904]

Delaware: Dover*
> Gini index: 0.416 (Delaware: 0.451)
> Avg. household income, top 20%: $162,096 (Delaware: $224,894)
> Avg. household income, bottom 20%: $13,115 (Delaware: $15,945)
> Share of all income in Dover that went to top 20%: 45.2% (Delaware: 48.7%)
> Share of all income in Dover that went to bottom 20%: 3.7% (Delaware: 3.5%)
> Median household income: $58,001 (Delaware: $70,176)
*Because Dover is the only eligible metro in Delaware, it is the metro with the widest income gaps by default.

Florida: Naples-Marco Island
> Gini index: 0.538 (Florida: 0.481)
> Avg. household income, top 20%: $351,019 (Florida: $217,456)
> Avg. household income, bottom 20%: $17,462 (Florida: $14,026)
> Share of all income in Naples-Marco Island that went to top 20%: 57.7% (Florida: 51.8%)
> Share of all income in Naples-Marco Island that went to bottom 20%: 2.9% (Florida: 3.3%)
> Median household income: $76,025 (Florida: $59,227)
[in-text-ad-2]

Georgia: Athens-Clarke County
> Gini index: 0.521 (Georgia: 0.479)
> Avg. household income, top 20%: $213,996 (Georgia: $222,399)
> Avg. household income, bottom 20%: $10,452 (Georgia: $13,668)
> Share of all income in Athens-Clarke County that went to top 20%: 55.2% (Georgia: 51.4%)
> Share of all income in Athens-Clarke County that went to bottom 20%: 2.7% (Georgia: 3.2%)
> Median household income: $50,962 (Georgia: $61,980)

Hawaii: Urban Honolulu
> Gini index: 0.435 (Hawaii: 0.440)
> Avg. household income, top 20%: $264,062 (Hawaii: $252,492)
> Avg. household income, bottom 20%: $20,262 (Hawaii: $18,445)
> Share of all income in Urban Honolulu that went to top 20%: 47.3% (Hawaii: 47.5%)
> Share of all income in Urban Honolulu that went to bottom 20%: 3.6% (Hawaii: 3.5%)
> Median household income: $87,470 (Hawaii: $83,102)
[in-text-ad]

Idaho: Twin Falls
> Gini index: 0.453 (Idaho: 0.434)
> Avg. household income, top 20%: $182,069 (Idaho: $188,036)
> Avg. household income, bottom 20%: $14,248 (Idaho: $16,199)
> Share of all income in Twin Falls that went to top 20%: 49.4% (Idaho: 47.6%)
> Share of all income in Twin Falls that went to bottom 20%: 3.9% (Idaho: 4.1%)
> Median household income: $56,667 (Idaho: $60,999)
[recirclink id=488561]

Illinois: Carbondale-Marion
> Gini index: 0.484 (Illinois: 0.480)
> Avg. household income, top 20%: $170,596 (Illinois: $245,173)
> Avg. household income, bottom 20%: $9,571 (Illinois: $14,667)
> Share of all income in Carbondale-Marion that went to top 20%: 51.1% (Illinois: 51.2%)
> Share of all income in Carbondale-Marion that went to bottom 20%: 2.9% (Illinois: 3.1%)
> Median household income: $46,882 (Illinois: $69,187)

Indiana: Indianapolis-Carmel-Anderson
> Gini index: 0.479 (Indiana: 0.458)
> Avg. household income, top 20%: $230,062 (Indiana: $193,279)
> Avg. household income, bottom 20%: $14,604 (Indiana: $13,987)
> Share of all income in Indianapolis-Carmel-Anderson that went to top 20%: 51.5% (Indiana: 49.5%)
> Share of all income in Indianapolis-Carmel-Anderson that went to bottom 20%: 3.3% (Indiana: 3.6%)
> Median household income: $62,502 (Indiana: $57,603)
[in-text-ad-2]

Iowa: Iowa City
> Gini index: 0.516 (Iowa: 0.442)
> Avg. household income, top 20%: $263,386 (Iowa: $192,979)
> Avg. household income, bottom 20%: $12,732 (Iowa: $15,270)
> Share of all income in Iowa City that went to top 20%: 54.9% (Iowa: 48.1%)
> Share of all income in Iowa City that went to bottom 20%: 2.7% (Iowa: 3.8%)
> Median household income: $63,761 (Iowa: $61,691)
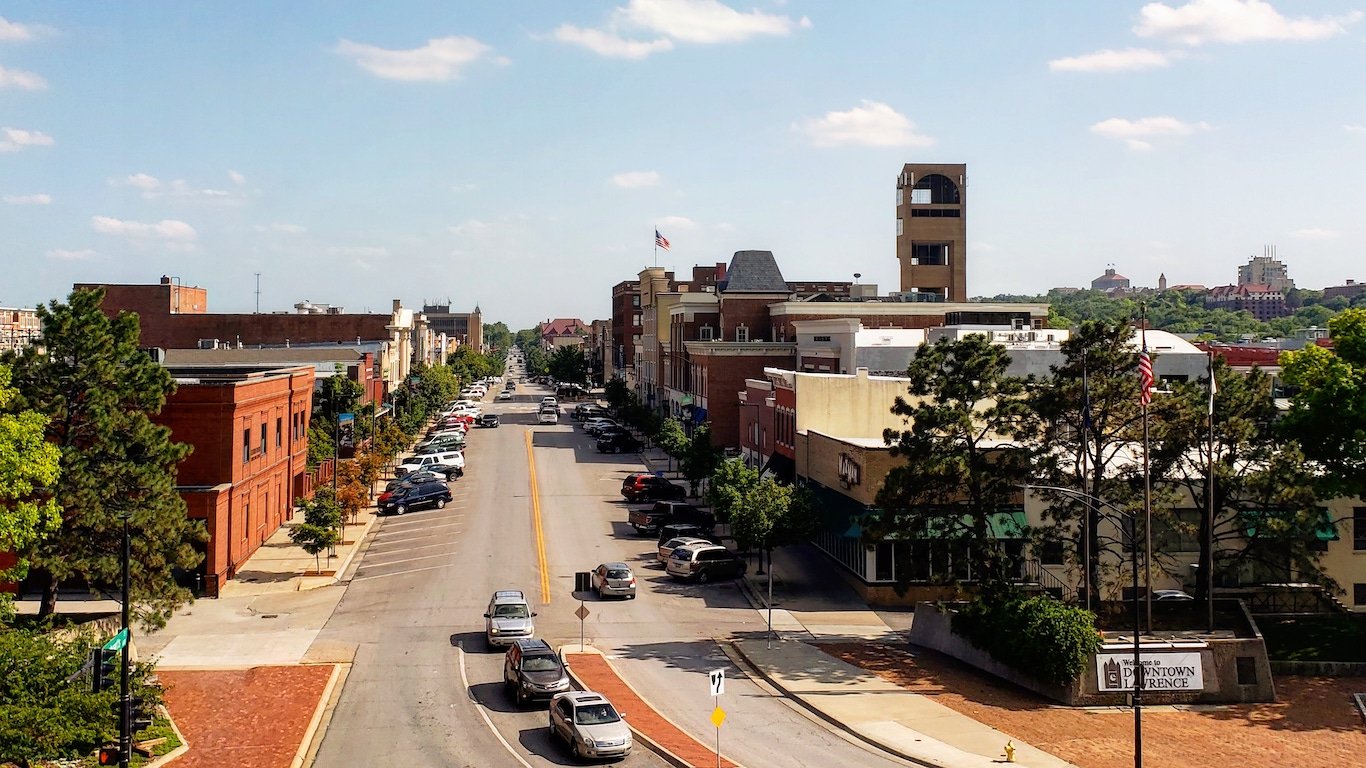
Kansas: Lawrence
> Gini index: 0.456 (Kansas: 0.450)
> Avg. household income, top 20%: $208,648 (Kansas: $200,932)
> Avg. household income, bottom 20%: $14,672 (Kansas: $15,090)
> Share of all income in Lawrence that went to top 20%: 49.6% (Kansas: 48.8%)
> Share of all income in Lawrence that went to bottom 20%: 3.5% (Kansas: 3.7%)
> Median household income: $64,233 (Kansas: $62,087)
[in-text-ad]
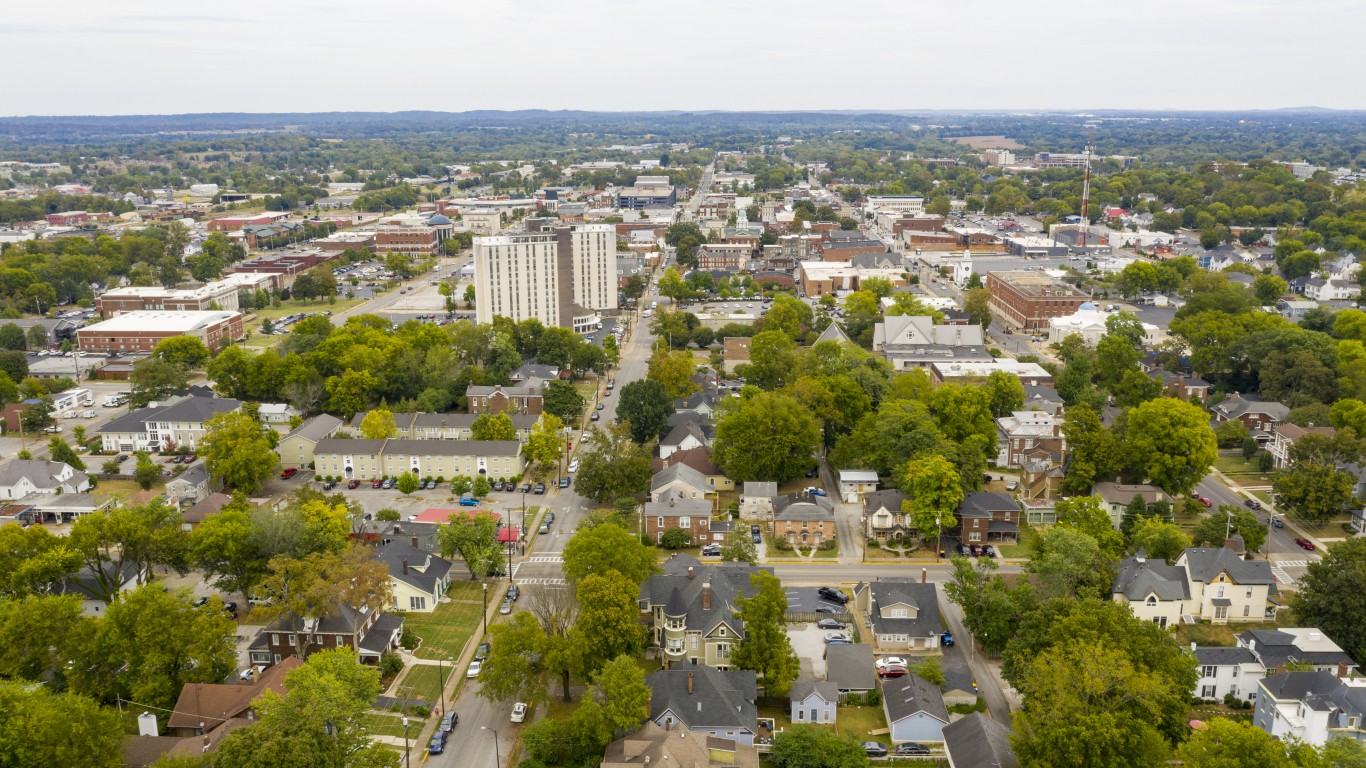
Kentucky: Bowling Green
> Gini index: 0.479 (Kentucky: 0.476)
> Avg. household income, top 20%: $183,689 (Kentucky: $183,549)
> Avg. household income, bottom 20%: $11,685 (Kentucky: $11,367)
> Share of all income in Bowling Green that went to top 20%: 51.5% (Kentucky: 50.8%)
> Share of all income in Bowling Green that went to bottom 20%: 3.3% (Kentucky: 3.2%)
> Median household income: $51,198 (Kentucky: $52,295)
[recirclink id=920281]

Louisiana: Monroe
> Gini index: 0.535 (Louisiana: 0.498)
> Avg. household income, top 20%: $172,389 (Louisiana: $190,038)
> Avg. household income, bottom 20%: $6,765 (Louisiana: $9,426)
> Share of all income in Monroe that went to top 20%: 56.1% (Louisiana: 52.3%)
> Share of all income in Monroe that went to bottom 20%: 2.2% (Louisiana: 2.6%)
> Median household income: $40,136 (Louisiana: $51,073)

Maine: Bangor
> Gini index: 0.444 (Maine: 0.449)
> Avg. household income, top 20%: $168,055 (Maine: $190,606)
> Avg. household income, bottom 20%: $14,589 (Maine: $14,674)
> Share of all income in Bangor that went to top 20%: 48.6% (Maine: 48.7%)
> Share of all income in Bangor that went to bottom 20%: 4.2% (Maine: 3.8%)
> Median household income: $50,449 (Maine: $58,924)
[in-text-ad-2]

Maryland: Salisbury
> Gini index: 0.468 (Maryland: 0.456)
> Avg. household income, top 20%: $213,995 (Maryland: $280,115)
> Avg. household income, bottom 20%: $15,670 (Maryland: $18,902)
> Share of all income in Salisbury that went to top 20%: 50.4% (Maryland: 49.1%)
> Share of all income in Salisbury that went to bottom 20%: 3.7% (Maryland: 3.3%)
> Median household income: $61,283 (Maryland: $86,738)

Massachusetts: Boston-Cambridge-Newton
> Gini index: 0.478 (Massachusetts: 0.480)
> Avg. household income, top 20%: $327,971 (Massachusetts: $299,188)
> Avg. household income, bottom 20%: $18,142 (Massachusetts: $16,450)
> Share of all income in Boston-Cambridge-Newton that went to top 20%: 50.8% (Massachusetts: 50.9%)
> Share of all income in Boston-Cambridge-Newton that went to bottom 20%: 2.8% (Massachusetts: 2.8%)
> Median household income: $94,430 (Massachusetts: $85,843)
[in-text-ad]
Michigan: Niles
> Gini index: 0.488 (Michigan: 0.463)
> Avg. household income, top 20%: $199,521 (Michigan: $201,676)
> Avg. household income, bottom 20%: $12,743 (Michigan: $13,976)
> Share of all income in Niles that went to top 20%: 52.2% (Michigan: 50.0%)
> Share of all income in Niles that went to bottom 20%: 3.3% (Michigan: 3.5%)
> Median household income: $50,153 (Michigan: $59,584)
[recirclink id=970377]

Minnesota: Minneapolis-St. Paul-Bloomington
> Gini index: 0.440 (Minnesota: 0.443)
> Avg. household income, top 20%: $259,977 (Minnesota: $233,949)
> Avg. household income, bottom 20%: $20,504 (Minnesota: $18,156)
> Share of all income in Minneapolis-St. Paul-Bloomington that went to top 20%: 47.9% (Minnesota: 48.2%)
> Share of all income in Minneapolis-St. Paul-Bloomington that went to bottom 20%: 3.8% (Minnesota: 3.7%)
> Median household income: $83,698 (Minnesota: $74,593)

Mississippi: Jackson
> Gini index: 0.478 (Mississippi: 0.490)
> Avg. household income, top 20%: $190,444 (Mississippi: $169,318)
> Avg. household income, bottom 20%: $12,199 (Mississippi: $9,715)
> Share of all income in Jackson that went to top 20%: 51.4% (Mississippi: 52.0%)
> Share of all income in Jackson that went to bottom 20%: 3.3% (Mississippi: 3.0%)
> Median household income: $52,426 (Mississippi: $45,792)
[in-text-ad-2]

Missouri: Springfield
> Gini index: 0.472 (Missouri: 0.463)
> Avg. household income, top 20%: $167,020 (Missouri: $194,185)
> Avg. household income, bottom 20%: $11,545 (Missouri: $13,294)
> Share of all income in Springfield that went to top 20%: 50.7% (Missouri: 49.9%)
> Share of all income in Springfield that went to bottom 20%: 3.5% (Missouri: 3.4%)
> Median household income: $47,034 (Missouri: $57,409)

Montana: Billings
> Gini index: 0.476 (Montana: 0.460)
> Avg. household income, top 20%: $224,041 (Montana: $191,819)
> Avg. household income, bottom 20%: $15,585 (Montana: $13,899)
> Share of all income in Billings that went to top 20%: 51.6% (Montana: 49.6%)
> Share of all income in Billings that went to bottom 20%: 3.6% (Montana: 3.6%)
> Median household income: $60,962 (Montana: $57,153)
[in-text-ad]

Nebraska: Lincoln
> Gini index: 0.458 (Nebraska: 0.440)
> Avg. household income, top 20%: $212,021 (Nebraska: $197,997)
> Avg. household income, bottom 20%: $16,107 (Nebraska: $15,965)
> Share of all income in Lincoln that went to top 20%: 50.0% (Nebraska: 48.0%)
> Share of all income in Lincoln that went to bottom 20%: 3.8% (Nebraska: 3.9%)
> Median household income: $61,539 (Nebraska: $63,229)
[recirclink id=887395]

Nevada: Las Vegas-Henderson-Paradise
> Gini index: 0.475 (Nevada: 0.471)
> Avg. household income, top 20%: $219,127 (Nevada: $220,208)
> Avg. household income, bottom 20%: $13,760 (Nevada: $14,425)
> Share of all income in Las Vegas-Henderson-Paradise that went to top 20%: 51.0% (Nevada: 50.7%)
> Share of all income in Las Vegas-Henderson-Paradise that went to bottom 20%: 3.2% (Nevada: 3.3%)
> Median household income: $62,107 (Nevada: $63,276)

New Hampshire: Manchester-Nashua*
> Gini index: 0.421 (New Hampshire: 0.441)
> Avg. household income, top 20%: $241,381 (New Hampshire: $241,891)
> Avg. household income, bottom 20%: $20,976 (New Hampshire: $19,002)
> Share of all income in Manchester-Nashua that went to top 20%: 46.0% (New Hampshire: 48.0%)
> Share of all income in Manchester-Nashua that went to bottom 20%: 4.0% (New Hampshire: 3.8%)
> Median household income: $83,626 (New Hampshire: $77,933)
*Because Manchester-Nashua is the only eligible metro in New Hampshire, it is the metro with the widest income gaps by default.
[in-text-ad-2]

New Jersey: Vineland-Bridgeton
> Gini index: 0.509 (New Jersey: 0.478)
> Avg. household income, top 20%: $221,977 (New Jersey: $305,190)
> Avg. household income, bottom 20%: $11,949 (New Jersey: $18,249)
> Share of all income in Vineland-Bridgeton that went to top 20%: 53.6% (New Jersey: 51.2%)
> Share of all income in Vineland-Bridgeton that went to bottom 20%: 2.9% (New Jersey: 3.1%)
> Median household income: $54,587 (New Jersey: $85,751)

New Mexico: Santa Fe
> Gini index: 0.491 (New Mexico: 0.477)
> Avg. household income, top 20%: $231,843 (New Mexico: $181,940)
> Avg. household income, bottom 20%: $13,528 (New Mexico: $10,976)
> Share of all income in Santa Fe that went to top 20%: 52.6% (New Mexico: 50.8%)
> Share of all income in Santa Fe that went to bottom 20%: 3.1% (New Mexico: 3.1%)
> Median household income: $61,298 (New Mexico: $51,945)
[in-text-ad]

New York: Ithaca
> Gini index: 0.539 (New York: 0.515)
> Avg. household income, top 20%: $264,640 (New York: $291,906)
> Avg. household income, bottom 20%: $9,613 (New York: $13,372)
> Share of all income in Ithaca that went to top 20%: 57.2% (New York: 54.4%)
> Share of all income in Ithaca that went to bottom 20%: 2.1% (New York: 2.5%)
> Median household income: $58,626 (New York: $72,108)
[recirclink id=848904]

North Carolina: Greenville
> Gini index: 0.481 (North Carolina: 0.474)
> Avg. household income, top 20%: $185,849 (North Carolina: $204,129)
> Avg. household income, bottom 20%: $10,937 (North Carolina: $13,301)
> Share of all income in Greenville that went to top 20%: 51.3% (North Carolina: 51.0%)
> Share of all income in Greenville that went to bottom 20%: 3.0% (North Carolina: 3.3%)
> Median household income: $53,401 (North Carolina: $57,341)

North Dakota: Fargo
> Gini index: 0.461 (North Dakota: 0.456)
> Avg. household income, top 20%: $209,479 (North Dakota: $209,985)
> Avg. household income, bottom 20%: $14,307 (North Dakota: $15,064)
> Share of all income in Fargo that went to top 20%: 49.8% (North Dakota: 49.1%)
> Share of all income in Fargo that went to bottom 20%: 3.4% (North Dakota: 3.5%)
> Median household income: $62,820 (North Dakota: $64,577)
[in-text-ad-2]

Ohio: Akron
> Gini index: 0.484 (Ohio: 0.465)
> Avg. household income, top 20%: $210,348 (Ohio: $199,074)
> Avg. household income, bottom 20%: $13,279 (Ohio: $13,601)
> Share of all income in Akron that went to top 20%: 52.1% (Ohio: 50.1%)
> Share of all income in Akron that went to bottom 20%: 3.3% (Ohio: 3.4%)
> Median household income: $57,158 (Ohio: $58,642)

Oklahoma: Tulsa
> Gini index: 0.479 (Oklahoma: 0.474)
> Avg. household income, top 20%: $208,920 (Oklahoma: $192,061)
> Avg. household income, bottom 20%: $13,632 (Oklahoma: $12,507)
> Share of all income in Tulsa that went to top 20%: 51.5% (Oklahoma: 50.8%)
> Share of all income in Tulsa that went to bottom 20%: 3.4% (Oklahoma: 3.3%)
> Median household income: $57,859 (Oklahoma: $54,449)
[in-text-ad]

Oregon: Eugene-Springfield
> Gini index: 0.467 (Oregon: 0.450)
> Avg. household income, top 20%: $193,236 (Oregon: $215,026)
> Avg. household income, bottom 20%: $13,181 (Oregon: $15,597)
> Share of all income in Eugene-Springfield that went to top 20%: 50.1% (Oregon: 48.6%)
> Share of all income in Eugene-Springfield that went to bottom 20%: 3.4% (Oregon: 3.5%)
> Median household income: $57,325 (Oregon: $67,058)
[recirclink id=488174]

Pennsylvania: Philadelphia-Camden-Wilmington
> Gini index: 0.487 (Pennsylvania: 0.475)
> Avg. household income, top 20%: $271,306 (Pennsylvania: $223,499)
> Avg. household income, bottom 20%: $14,969 (Pennsylvania: $14,295)
> Share of all income in Philadelphia-Camden-Wilmington that went to top 20%: 51.8% (Pennsylvania: 50.9%)
> Share of all income in Philadelphia-Camden-Wilmington that went to bottom 20%: 2.9% (Pennsylvania: 3.3%)
> Median household income: $74,533 (Pennsylvania: $63,463)

Rhode Island: Providence-Warwick*
> Gini index: 0.463 (Rhode Island: 0.463)
> Avg. household income, top 20%: $227,003 (Rhode Island: $228,951)
> Avg. household income, bottom 20%: $14,162 (Rhode Island: $14,829)
> Share of all income in Providence-Warwick that went to top 20%: 49.3% (Rhode Island: 49.5%)
> Share of all income in Providence-Warwick that went to bottom 20%: 3.1% (Rhode Island: 3.2%)
> Median household income: $70,967 (Rhode Island: $71,169)
*Because Providence-Warwick is the only eligible metro in Rhode Island, it is the metro with the widest income gaps by default.
[in-text-ad-2]

South Carolina: Hilton Head Island-Bluffton
> Gini index: 0.486 (South Carolina: 0.475)
> Avg. household income, top 20%: $274,582 (South Carolina: $198,951)
> Avg. household income, bottom 20%: $18,573 (South Carolina: $12,334)
> Share of all income in Hilton Head Island-Bluffton that went to top 20%: 52.9% (South Carolina: 50.9%)
> Share of all income in Hilton Head Island-Bluffton that went to bottom 20%: 3.6% (South Carolina: 3.2%)
> Median household income: $71,252 (South Carolina: $56,227)

South Dakota: Rapid City
> Gini index: 0.447 (South Dakota: 0.436)
> Avg. household income, top 20%: $182,162 (South Dakota: $184,714)
> Avg. household income, bottom 20%: $14,192 (South Dakota: $15,519)
> Share of all income in Rapid City that went to top 20%: 48.0% (South Dakota: 47.6%)
> Share of all income in Rapid City that went to bottom 20%: 3.7% (South Dakota: 4.0%)
> Median household income: $58,361 (South Dakota: $59,533)
[in-text-ad]

Tennessee: Memphis
> Gini index: 0.493 (Tennessee: 0.475)
> Avg. household income, top 20%: $207,086 (Tennessee: $199,456)
> Avg. household income, bottom 20%: $11,723 (Tennessee: $13,144)
> Share of all income in Memphis that went to top 20%: 52.7% (Tennessee: 51.1%)
> Share of all income in Memphis that went to bottom 20%: 3.0% (Tennessee: 3.4%)
> Median household income: $54,859 (Tennessee: $56,071)
[recirclink id=920281]

Texas: College Station-Bryan
> Gini index: 0.491 (Texas: 0.475)
> Avg. household income, top 20%: $196,734 (Texas: $228,924)
> Avg. household income, bottom 20%: $9,502 (Texas: $14,556)
> Share of all income in College Station-Bryan that went to top 20%: 51.7% (Texas: 51.0%)
> Share of all income in College Station-Bryan that went to bottom 20%: 2.5% (Texas: 3.3%)
> Median household income: $55,670 (Texas: $64,034)

Utah: St. George
> Gini index: 0.457 (Utah: 0.427)
> Avg. household income, top 20%: $223,981 (Utah: $227,022)
> Avg. household income, bottom 20%: $19,168 (Utah: $20,124)
> Share of all income in St. George that went to top 20%: 50.4% (Utah: 47.1%)
> Share of all income in St. George that went to bottom 20%: 4.3% (Utah: 4.2%)
> Median household income: $63,595 (Utah: $75,780)
[in-text-ad-2]

Vermont: Burlington-South Burlington*
> Gini index: 0.431 (Vermont: 0.447)
> Avg. household income, top 20%: $218,013 (Vermont: $200,816)
> Avg. household income, bottom 20%: $16,508 (Vermont: $15,054)
> Share of all income in Burlington-South Burlington that went to top 20%: 46.8% (Vermont: 48.4%)
> Share of all income in Burlington-South Burlington that went to bottom 20%: 3.5% (Vermont: 3.6%)
> Median household income: $74,909 (Vermont: $63,001)
*Because Burlington-South Burlington is the only eligible metro in Vermont, it is the metro with the widest income gaps by default.

Virginia: Charlottesville
> Gini index: 0.477 (Virginia: 0.469)
> Avg. household income, top 20%: $267,029 (Virginia: $265,171)
> Avg. household income, bottom 20%: $15,795 (Virginia: $17,138)
> Share of all income in Charlottesville that went to top 20%: 51.0% (Virginia: 50.5%)
> Share of all income in Charlottesville that went to bottom 20%: 3.0% (Virginia: 3.3%)
> Median household income: $75,907 (Virginia: $76,456)
[in-text-ad]

Washington: Wenatchee
> Gini index: 0.464 (Washington: 0.458)
> Avg. household income, top 20%: $217,396 (Washington: $262,118)
> Avg. household income, bottom 20%: $16,952 (Washington: $18,576)
> Share of all income in Wenatchee that went to top 20%: 50.7% (Washington: 49.6%)
> Share of all income in Wenatchee that went to bottom 20%: 4.0% (Washington: 3.5%)
> Median household income: $60,532 (Washington: $78,687)
[recirclink id=970377]

West Virginia: Morgantown
> Gini index: 0.488 (West Virginia: 0.464)
> Avg. household income, top 20%: $206,309 (West Virginia: $163,240)
> Avg. household income, bottom 20%: $11,157 (West Virginia: $10,649)
> Share of all income in Morgantown that went to top 20%: 51.1% (West Virginia: 49.6%)
> Share of all income in Morgantown that went to bottom 20%: 2.8% (West Virginia: 3.2%)
> Median household income: $56,395 (West Virginia: $48,850)

Wisconsin: Milwaukee-Waukesha
> Gini index: 0.465 (Wisconsin: 0.439)
> Avg. household income, top 20%: $220,431 (Wisconsin: $197,977)
> Avg. household income, bottom 20%: $14,589 (Wisconsin: $16,034)
> Share of all income in Milwaukee-Waukesha that went to top 20%: 49.9% (Wisconsin: 47.8%)
> Share of all income in Milwaukee-Waukesha that went to bottom 20%: 3.3% (Wisconsin: 3.9%)
> Median household income: $65,845 (Wisconsin: $64,168)
[in-text-ad-2]

Wyoming: Cheyenne
> Gini index: 0.483 (Wyoming: 0.435)
> Avg. household income, top 20%: $248,185 (Wyoming: $196,029)
> Avg. household income, bottom 20%: $14,492 (Wyoming: $15,528)
> Share of all income in Cheyenne that went to top 20%: 51.9% (Wyoming: 47.2%)
> Share of all income in Cheyenne that went to bottom 20%: 3.0% (Wyoming: 3.7%)
> Median household income: $70,567 (Wyoming: $65,003)
To determine the metro with the widest income gaps in every state, 24/7 Wall St. reviewed one-year estimates of the Gini Index of income inequality from the U.S. Census Bureau’s 2019 American Community Survey.
The Gini Index of income inequality summarizes income dispersion in an area on a scale from 0 to 1. A value of 0 indicates perfect equality — everyone in the area receives an equal share of the income. A value of 1 indicates perfect inequality — only one recipient receives all the income.
We used the 384 metropolitan statistical areas as delineated by the United States Office of Management and Budget and used by the Census Bureau as our definition of metros.
Metros were ranked within their state based on their Gini Index. To break ties, we used the share of aggregate household income earned by the top 20% of households. Since many metros cross state lines, the metro was assigned to the state of its first-listed principal city. Thus, the Washington-Arlington-Alexandria, DC-VA-MD-WV metro area was excluded as it is principally in the District of Columbia.
Additional information on average household income by quintile, share of aggregate household income by quintile, and median household income are also one-year estimates from the 2019 ACS.
Contact [email protected] for any questions or corrections.