The United States has some of the highest levels of income and wealth inequality in the world. U.S. Federal Reserve data shows that the wealthiest 10% of Americans control $93.8 trillion, more than double the $40.3 trillion in the hands of the remaining 90% of Americans.
The income and wealth divide only appears to be growing wider. A January 2020 report published by the Pew Research Center found that over the last four decades, income growth for the top 5% of families by earnings has far outpaced income growth for families in lower income strata.
Income inequality varies considerably across the country, and in some U.S. counties, the problem is far more pronounced.
Using data from the U.S. Census Bureau’s 2019 American Community Survey, 24/7 Wall St. identified the 50 U.S. counties with the widest income gaps. Counties and county equivalents are ranked by their Gini coefficient, a measure of income inequality based on the distribution of income across a population on a 0 to 1 scale — 0 representing perfect equality and 1 representing the highest possible level of inequality.
Among the counties on this list, Gini scores are as high as 0.707 — well above the national Gini coefficient of 0.482. The places on this list are overwhelmingly concentrated in the South — including nine counties in Mississippi and eight parishes in Louisiana.
Causes behind rising inequality are complex and varied. A report published by the National Bureau of Economic Research ties the rising disparity to a range of economic factors, including globalization, technological advancement, a stagnant minimum wage, and the decline of labor unions.
Click here to see America’s counties with the widest income gaps
Click here to read our detailed methodology

50. Suffolk County, Massachusetts
> Gini index: 0.533
> Avg. household income, top 20%: $287,203 — 74th highest of 3,009 counties
> Avg. household income, bottom 20%: $9,630 — 539th lowest of 3,009 counties
> Share of all income in Suffolk County that went to top 20%: 55.1% — 78th highest of 3,009 counties (tied)
> Share of all income in Suffolk County that went to bottom 20%: 1.9% — 20th lowest of 3,009 counties (tied)
> Median household income: $69,669 — 315th highest of 3,009 counties
[in-text-ad]

49. Monroe County, Georgia
> Gini index: 0.533
> Avg. household income, top 20%: $240,620 — 180th highest of 3,009 counties
> Avg. household income, bottom 20%: $8,918 — 389th lowest of 3,009 counties (tied)
> Share of all income in Monroe County that went to top 20%: 55.8% — 62nd highest of 3,009 counties
> Share of all income in Monroe County that went to bottom 20%: 2.1% — 43rd lowest of 3,009 counties (tied)
> Median household income: $54,754 — 1,167th highest of 3,009 counties (tied)
[recirclink id=887395]

48. Claiborne Parish, Louisiana
> Gini index: 0.533
> Avg. household income, top 20%: $126,205 — 247th lowest of 3,009 counties
> Avg. household income, bottom 20%: $7,447 — 191st lowest of 3,009 counties
> Share of all income in Claiborne Parish that went to top 20%: 57.5% — 23rd highest of 3,009 counties (tied)
> Share of all income in Claiborne Parish that went to bottom 20%: 3.4% — 845th lowest of 3,009 counties (tied)
> Median household income: $26,776 — 18th lowest of 3,009 counties

47. Breathitt County, Kentucky
> Gini index: 0.534
> Avg. household income, top 20%: $128,844 — 308th lowest of 3,009 counties
> Avg. household income, bottom 20%: $6,297 — 78th lowest of 3,009 counties
> Share of all income in Breathitt County that went to top 20%: 55.7% — 64th highest of 3,009 counties
> Share of all income in Breathitt County that went to bottom 20%: 2.7% — 201st lowest of 3,009 counties (tied)
> Median household income: $27,344 — 24th lowest of 3,009 counties
[in-text-ad-2]

46. Scott County, Mississippi
> Gini index: 0.534
> Avg. household income, top 20%: $167,964 — 1,190th highest of 3,009 counties
> Avg. household income, bottom 20%: $8,281 — 289th lowest of 3,009 counties
> Share of all income in Scott County that went to top 20%: 56.3% — 47th highest of 3,009 counties
> Share of all income in Scott County that went to bottom 20%: 2.8% — 226th lowest of 3,009 counties (tied)
> Median household income: $34,943 — 157th lowest of 3,009 counties

45. Yazoo County, Mississippi
> Gini index: 0.535
> Avg. household income, top 20%: $150,877 — 1,115th lowest of 3,009 counties
> Avg. household income, bottom 20%: $6,686 — 114th lowest of 3,009 counties
> Share of all income in Yazoo County that went to top 20%: 56.2% — 50th highest of 3,009 counties
> Share of all income in Yazoo County that went to bottom 20%: 2.5% — 116th lowest of 3,009 counties (tied)
> Median household income: $33,279 — 111th lowest of 3,009 counties
[in-text-ad]

44. Sierra County, New Mexico
> Gini index: 0.535
> Avg. household income, top 20%: $142,898 — 757th lowest of 3,009 counties
> Avg. household income, bottom 20%: $8,592 — 331st lowest of 3,009 counties
> Share of all income in Sierra County that went to top 20%: 57.7% — 20th highest of 3,009 counties
> Share of all income in Sierra County that went to bottom 20%: 3.5% — 959th lowest of 3,009 counties (tied)
> Median household income: $29,755 — 46th lowest of 3,009 counties
[recirclink id=848904]

43. Aransas County, Texas
> Gini index: 0.535
> Avg. household income, top 20%: $215,878 — 338th highest of 3,009 counties
> Avg. household income, bottom 20%: $10,905 — 909th lowest of 3,009 counties
> Share of all income in Aransas County that went to top 20%: 56.9% — 31st highest of 3,009 counties
> Share of all income in Aransas County that went to bottom 20%: 2.9% — 286th lowest of 3,009 counties (tied)
> Median household income: $45,137 — 833rd lowest of 3,009 counties

42. Caldwell Parish, Louisiana
> Gini index: 0.535
> Avg. household income, top 20%: $171,937 — 1,061st highest of 3,009 counties
> Avg. household income, bottom 20%: $7,973 — 236th lowest of 3,009 counties
> Share of all income in Caldwell Parish that went to top 20%: 56.3% — 48th highest of 3,009 counties
> Share of all income in Caldwell Parish that went to bottom 20%: 2.6% — 153rd lowest of 3,009 counties (tied)
> Median household income: $37,691 — 273rd lowest of 3,009 counties
[in-text-ad-2]

41. Washington County, Mississippi
> Gini index: 0.536
> Avg. household income, top 20%: $141,569 — 707th lowest of 3,009 counties (tied)
> Avg. household income, bottom 20%: $6,676 — 112th lowest of 3,009 counties
> Share of all income in Washington County that went to top 20%: 56.8% — 33rd highest of 3,009 counties
> Share of all income in Washington County that went to bottom 20%: 2.7% — 189th lowest of 3,009 counties (tied)
> Median household income: $29,705 — 44th lowest of 3,009 counties

40. Pike County, Alabama
> Gini index: 0.537
> Avg. household income, top 20%: $161,586 — 1,434th highest of 3,009 counties
> Avg. household income, bottom 20%: $5,345 — 32nd lowest of 3,009 counties
> Share of all income in Pike County that went to top 20%: 55.9% — 57th highest of 3,009 counties
> Share of all income in Pike County that went to bottom 20%: 1.9% — 20th lowest of 3,009 counties (tied)
> Median household income: $37,446 — 260th lowest of 3,009 counties
[in-text-ad]

39. Wayne County, Kentucky
> Gini index: 0.537
> Avg. household income, top 20%: $158,149 — 1,447th lowest of 3,009 counties
> Avg. household income, bottom 20%: $8,574 — 324th lowest of 3,009 counties
> Share of all income in Wayne County that went to top 20%: 57.0% — 30th highest of 3,009 counties
> Share of all income in Wayne County that went to bottom 20%: 3.1% — 454th lowest of 3,009 counties (tied)
> Median household income: $34,914 — 155th lowest of 3,009 counties
[recirclink id=488561]

38. Oktibbeha County, Mississippi
> Gini index: 0.537
> Avg. household income, top 20%: $163,979 — 1,333rd highest of 3,009 counties
> Avg. household income, bottom 20%: $4,137 — 13th lowest of 3,009 counties
> Share of all income in Oktibbeha County that went to top 20%: 54.8% — 102nd highest of 3,009 counties
> Share of all income in Oktibbeha County that went to bottom 20%: 1.4% — 5th lowest of 3,009 counties (tied)
> Median household income: $40,453 — 449th lowest of 3,009 counties

37. Charlottesville city, Virginia
> Gini index: 0.538
> Avg. household income, top 20%: $261,631 — 128th highest of 3,009 counties
> Avg. household income, bottom 20%: $8,034 — 244th lowest of 3,009 counties
> Share of all income in Charlottesville city that went to top 20%: 56.1% — 51st highest of 3,009 counties
> Share of all income in Charlottesville city that went to bottom 20%: 1.7% — 15th lowest of 3,009 counties
> Median household income: $59,471 — 779th highest of 3,009 counties
[in-text-ad-2]

36. Lincoln Parish, Louisiana
> Gini index: 0.538
> Avg. household income, top 20%: $163,589 — 1,348th highest of 3,009 counties
> Avg. household income, bottom 20%: $5,518 — 42nd lowest of 3,009 counties
> Share of all income in Lincoln Parish that went to top 20%: 56.3% — 49th highest of 3,009 counties
> Share of all income in Lincoln Parish that went to bottom 20%: 1.9% — 27th lowest of 3,009 counties
> Median household income: $35,467 — 173rd lowest of 3,009 counties

35. Eastland County, Texas
> Gini index: 0.538
> Avg. household income, top 20%: $175,349 — 971st highest of 3,009 counties
> Avg. household income, bottom 20%: $8,763 — 364th lowest of 3,009 counties
> Share of all income in Eastland County that went to top 20%: 57.3% — 27th highest of 3,009 counties
> Share of all income in Eastland County that went to bottom 20%: 2.9% — 275th lowest of 3,009 counties (tied)
> Median household income: $37,276 — 248th lowest of 3,009 counties
[in-text-ad]

34. Toombs County, Georgia
> Gini index: 0.54
> Avg. household income, top 20%: $183,991 — 777th highest of 3,009 counties
> Avg. household income, bottom 20%: $8,487 — 313th lowest of 3,009 counties
> Share of all income in Toombs County that went to top 20%: 56.8% — 34th highest of 3,009 counties
> Share of all income in Toombs County that went to bottom 20%: 2.6% — 159th lowest of 3,009 counties (tied)
> Median household income: $40,175 — 427th lowest of 3,009 counties
[recirclink id=920281]

33. Westchester County, New York
> Gini index: 0.54
> Avg. household income, top 20%: $441,877 — 6th highest of 3,009 counties
> Avg. household income, bottom 20%: $17,711 — 358th highest of 3,009 counties (tied)
> Share of all income in Westchester County that went to top 20%: 57.2% — 28th highest of 3,009 counties
> Share of all income in Westchester County that went to bottom 20%: 2.3% — 76th lowest of 3,009 counties (tied)
> Median household income: $96,610 — 52nd highest of 3,009 counties

32. Humphreys County, Mississippi
> Gini index: 0.541
> Avg. household income, top 20%: $139,772 — 649th lowest of 3,009 counties
> Avg. household income, bottom 20%: $6,904 — 127th lowest of 3,009 counties
> Share of all income in Humphreys County that went to top 20%: 58.1% — 17th highest of 3,009 counties (tied)
> Share of all income in Humphreys County that went to bottom 20%: 2.9% — 283rd lowest of 3,009 counties (tied)
> Median household income: $28,962 — 35th lowest of 3,009 counties
[in-text-ad-2]

31. Fulton County, Georgia
> Gini index: 0.541
> Avg. household income, top 20%: $326,898 — 36th highest of 3,009 counties
> Avg. household income, bottom 20%: $13,583 — 1,216th highest of 3,009 counties (tied)
> Share of all income in Fulton County that went to top 20%: 57.5% — 22nd highest of 3,009 counties
> Share of all income in Fulton County that went to bottom 20%: 2.4% — 90th lowest of 3,009 counties (tied)
> Median household income: $69,673 — 314th highest of 3,009 counties

30. Lake County, Tennessee
> Gini index: 0.542
> Avg. household income, top 20%: $156,183 — 1,365th lowest of 3,009 counties
> Avg. household income, bottom 20%: $7,090 — 147th lowest of 3,009 counties
> Share of all income in Lake County that went to top 20%: 56.0% — 53rd highest of 3,009 counties
> Share of all income in Lake County that went to bottom 20%: 2.5% — 133rd lowest of 3,009 counties (tied)
> Median household income: $35,191 — 163rd lowest of 3,009 counties
[in-text-ad]

29. Fairfield County, Connecticut
> Gini index: 0.542
> Avg. household income, top 20%: $447,369 — 5th highest of 3,009 counties
> Avg. household income, bottom 20%: $18,985 — 238th highest of 3,009 counties
> Share of all income in Fairfield County that went to top 20%: 57.7% — 21st highest of 3,009 counties
> Share of all income in Fairfield County that went to bottom 20%: 2.5% — 104th lowest of 3,009 counties (tied)
> Median household income: $95,645 — 55th highest of 3,009 counties
[recirclink id=970377]

28. Carlisle County, Kentucky
> Gini index: 0.543
> Avg. household income, top 20%: $213,137 — 367th highest of 3,009 counties
> Avg. household income, bottom 20%: $11,661 — 1,155th lowest of 3,009 counties (tied)
> Share of all income in Carlisle County that went to top 20%: 57.3% — 26th highest of 3,009 counties
> Share of all income in Carlisle County that went to bottom 20%: 3.1% — 501st lowest of 3,009 counties (tied)
> Median household income: $45,109 — 826th lowest of 3,009 counties

27. Pointe Coupee Parish, Louisiana
> Gini index: 0.544
> Avg. household income, top 20%: $188,381 — 692nd highest of 3,009 counties
> Avg. household income, bottom 20%: $6,584 — 100th lowest of 3,009 counties
> Share of all income in Pointe Coupee Parish that went to top 20%: 56.5% — 43rd highest of 3,009 counties
> Share of all income in Pointe Coupee Parish that went to bottom 20%: 2.0% — 31st lowest of 3,009 counties
> Median household income: $41,480 — 519th lowest of 3,009 counties
[in-text-ad-2]

26. Radford city, Virginia
> Gini index: 0.544
> Avg. household income, top 20%: $161,025 — 1,452nd highest of 3,009 counties
> Avg. household income, bottom 20%: $6,005 — 62nd lowest of 3,009 counties
> Share of all income in Radford city that went to top 20%: 56.5% — 40th highest of 3,009 counties
> Share of all income in Radford city that went to bottom 20%: 2.1% — 49th lowest of 3,009 counties (tied)
> Median household income: $36,297 — 206th lowest of 3,009 counties
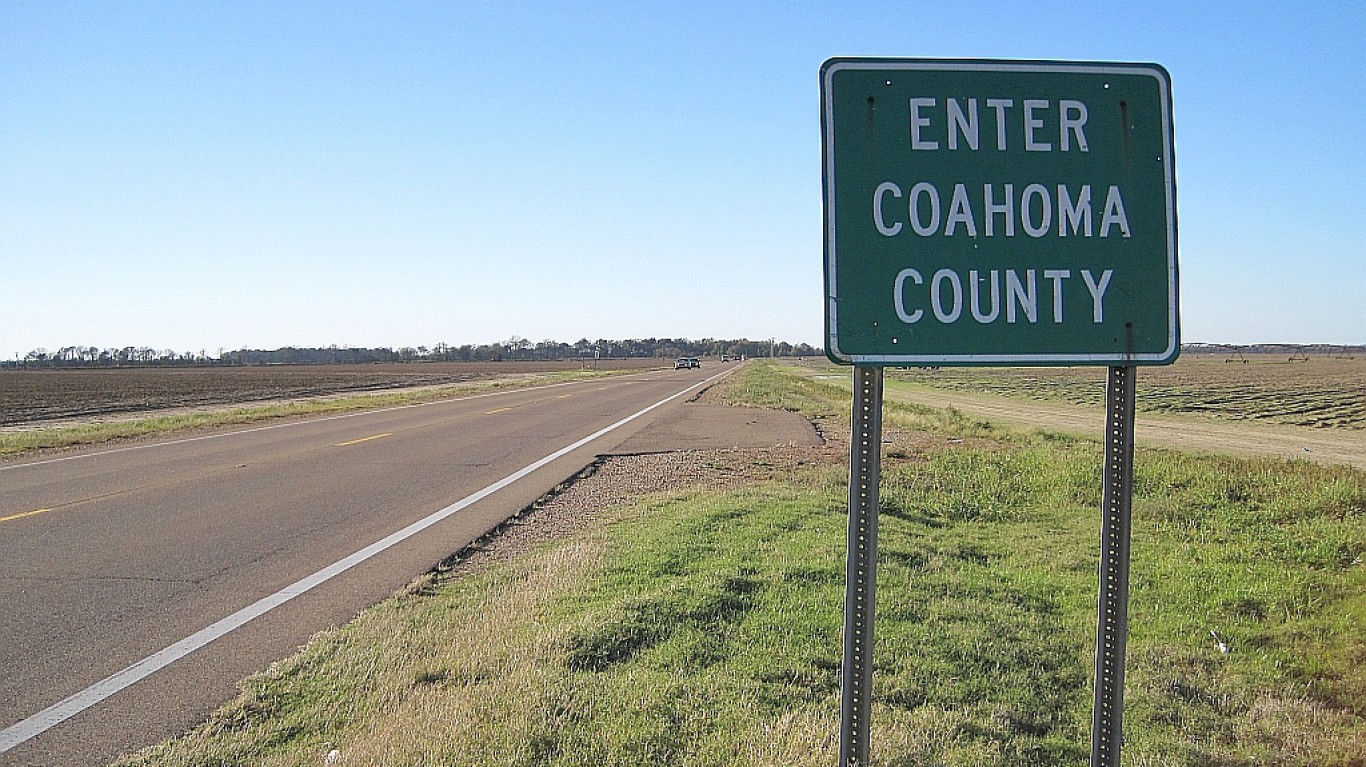
25. Coahoma County, Mississippi
> Gini index: 0.544
> Avg. household income, top 20%: $137,828 — 583rd lowest of 3,009 counties
> Avg. household income, bottom 20%: $6,354 — 84th lowest of 3,009 counties
> Share of all income in Coahoma County that went to top 20%: 57.1% — 29th highest of 3,009 counties
> Share of all income in Coahoma County that went to bottom 20%: 2.6% — 169th lowest of 3,009 counties (tied)
> Median household income: $29,121 — 38th lowest of 3,009 counties
[in-text-ad]

24. Richmond city, Virginia
> Gini index: 0.545
> Avg. household income, top 20%: $218,676 — 307th highest of 3,009 counties
> Avg. household income, bottom 20%: $8,497 — 314th lowest of 3,009 counties
> Share of all income in Richmond city that went to top 20%: 57.4% — 25th highest of 3,009 counties
> Share of all income in Richmond city that went to bottom 20%: 2.2% — 66th lowest of 3,009 counties (tied)
> Median household income: $47,250 — 1,021st lowest of 3,009 counties
[recirclink id=887395]

23. Todd County, South Dakota
> Gini index: 0.547
> Avg. household income, top 20%: $103,269 — 21st lowest of 3,009 counties
> Avg. household income, bottom 20%: $1,950 — 2nd lowest of 3,009 counties
> Share of all income in Todd County that went to top 20%: 55.8% — 61st highest of 3,009 counties
> Share of all income in Todd County that went to bottom 20%: 1.0% — 3rd lowest of 3,009 counties
> Median household income: $24,331 — 7th lowest of 3,009 counties

22. Brooks County, Georgia
> Gini index: 0.548
> Avg. household income, top 20%: $172,386 — 1,042nd highest of 3,009 counties
> Avg. household income, bottom 20%: $5,582 — 45th lowest of 3,009 counties
> Share of all income in Brooks County that went to top 20%: 56.9% — 32nd highest of 3,009 counties
> Share of all income in Brooks County that went to bottom 20%: 1.8% — 19th lowest of 3,009 counties
> Median household income: $38,285 — 311th lowest of 3,009 counties
[in-text-ad-2]

21. Natchitoches Parish, Louisiana
> Gini index: 0.548
> Avg. household income, top 20%: $135,943 — 512th lowest of 3,009 counties
> Avg. household income, bottom 20%: $4,424 — 17th lowest of 3,009 counties
> Share of all income in Natchitoches Parish that went to top 20%: 57.5% — 23rd highest of 3,009 counties (tied)
> Share of all income in Natchitoches Parish that went to bottom 20%: 1.9% — 25th lowest of 3,009 counties
> Median household income: $28,567 — 33rd lowest of 3,009 counties

20. Monroe County, Alabama
> Gini index: 0.549
> Avg. household income, top 20%: $136,293 — 525th lowest of 3,009 counties
> Avg. household income, bottom 20%: $2,790 — 4th lowest of 3,009 counties
> Share of all income in Monroe County that went to top 20%: 56.0% — 52nd highest of 3,009 counties
> Share of all income in Monroe County that went to bottom 20%: 1.1% — 4th lowest of 3,009 counties
> Median household income: $30,441 — 61st lowest of 3,009 counties
[in-text-ad]

19. Marengo County, Alabama
> Gini index: 0.549
> Avg. household income, top 20%: $154,774 — 1,300th lowest of 3,009 counties
> Avg. household income, bottom 20%: $5,256 — 30th lowest of 3,009 counties
> Share of all income in Marengo County that went to top 20%: 56.7% — 36th highest of 3,009 counties
> Share of all income in Marengo County that went to bottom 20%: 1.9% — 28th lowest of 3,009 counties (tied)
> Median household income: $33,241 — 110th lowest of 3,009 counties
[recirclink id=848904]

18. Roger Mills County, Oklahoma
> Gini index: 0.553
> Avg. household income, top 20%: $230,873 — 226th highest of 3,009 counties
> Avg. household income, bottom 20%: $9,190 — 441st lowest of 3,009 counties
> Share of all income in Roger Mills County that went to top 20%: 57.9% — 19th highest of 3,009 counties
> Share of all income in Roger Mills County that went to bottom 20%: 2.3% — 82nd lowest of 3,009 counties
> Median household income: $51,302 — 1,448th lowest of 3,009 counties
17. Red River Parish, Louisiana
> Gini index: 0.553
> Avg. household income, top 20%: $169,890 — 1,131st highest of 3,009 counties
> Avg. household income, bottom 20%: $6,989 — 139th lowest of 3,009 counties
> Share of all income in Red River Parish that went to top 20%: 58.2% — 16th highest of 3,009 counties
> Share of all income in Red River Parish that went to bottom 20%: 2.4% — 90th lowest of 3,009 counties (tied)
> Median household income: $33,816 — 123rd lowest of 3,009 counties
[in-text-ad-2]

16. Walthall County, Mississippi
> Gini index: 0.554
> Avg. household income, top 20%: $147,566 — 960th lowest of 3,009 counties
> Avg. household income, bottom 20%: $5,081 — 24th lowest of 3,009 counties
> Share of all income in Walthall County that went to top 20%: 58.2% — 15th highest of 3,009 counties
> Share of all income in Walthall County that went to bottom 20%: 2.0% — 35th lowest of 3,009 counties (tied)
> Median household income: $30,961 — 67th lowest of 3,009 counties

15. Crisp County, Georgia
> Gini index: 0.554
> Avg. household income, top 20%: $166,315 — 1,249th highest of 3,009 counties
> Avg. household income, bottom 20%: $6,923 — 132nd lowest of 3,009 counties
> Share of all income in Crisp County that went to top 20%: 58.5% — 13th highest of 3,009 counties
> Share of all income in Crisp County that went to bottom 20%: 2.4% — 97th lowest of 3,009 counties (tied)
> Median household income: $36,042 — 193rd lowest of 3,009 counties
[in-text-ad]
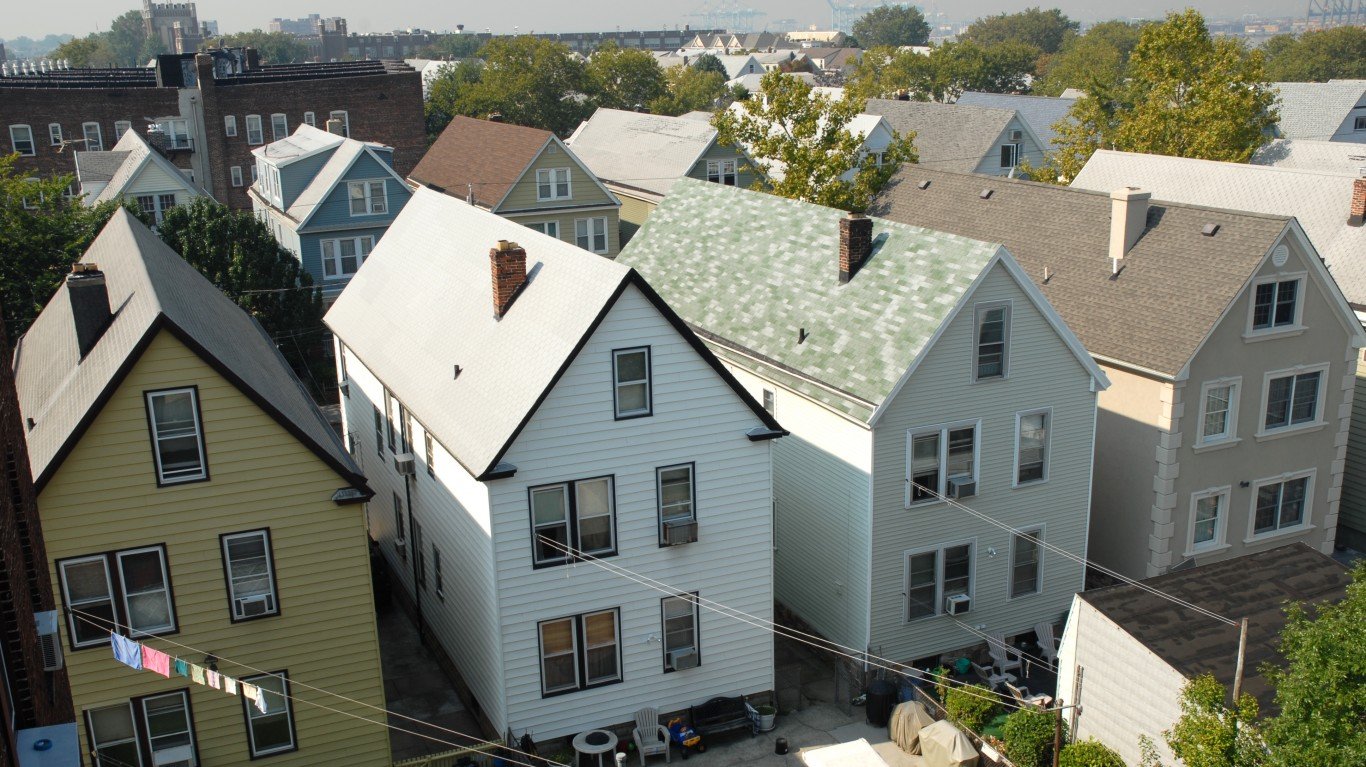
14. Essex County, New Jersey
> Gini index: 0.555
> Avg. household income, top 20%: $301,665 — 61st highest of 3,009 counties
> Avg. household income, bottom 20%: $10,817 — 879th lowest of 3,009 counties
> Share of all income in Essex County that went to top 20%: 58.4% — 14th highest of 3,009 counties
> Share of all income in Essex County that went to bottom 20%: 2.1% — 47th lowest of 3,009 counties (tied)
> Median household income: $61,510 — 638th highest of 3,009 counties
[recirclink id=488174]

13. Gallatin County, Illinois
> Gini index: 0.555
> Avg. household income, top 20%: $207,704 — 419th highest of 3,009 counties
> Avg. household income, bottom 20%: $8,788 — 369th lowest of 3,009 counties
> Share of all income in Gallatin County that went to top 20%: 58.1% — 17th highest of 3,009 counties (tied)
> Share of all income in Gallatin County that went to bottom 20%: 2.5% — 108th lowest of 3,009 counties (tied)
> Median household income: $44,076 — 733rd lowest of 3,009 counties

12. Hancock County, Tennessee
> Gini index: 0.559
> Avg. household income, top 20%: $164,573 — 1,312th highest of 3,009 counties
> Avg. household income, bottom 20%: $7,385 — 183rd lowest of 3,009 counties
> Share of all income in Hancock County that went to top 20%: 58.9% — 12th highest of 3,009 counties
> Share of all income in Hancock County that went to bottom 20%: 2.6% — 171st lowest of 3,009 counties (tied)
> Median household income: $30,136 — 54th lowest of 3,009 counties
[in-text-ad-2]

11. Greene County, Georgia
> Gini index: 0.56
> Avg. household income, top 20%: $265,664 — 117th highest of 3,009 counties
> Avg. household income, bottom 20%: $11,529 — 1,119th lowest of 3,009 counties
> Share of all income in Greene County that went to top 20%: 59.3% — 11th highest of 3,009 counties
> Share of all income in Greene County that went to bottom 20%: 2.6% — 149th lowest of 3,009 counties (tied)
> Median household income: $52,129 — 1,477th highest of 3,009 counties

10. Zapata County, Texas
> Gini index: 0.564
> Avg. household income, top 20%: $180,721 — 829th highest of 3,009 counties
> Avg. household income, bottom 20%: $7,151 — 157th lowest of 3,009 counties
> Share of all income in Zapata County that went to top 20%: 59.7% — 8th highest of 3,009 counties
> Share of all income in Zapata County that went to bottom 20%: 2.4% — 86th lowest of 3,009 counties
> Median household income: $33,952 — 129th lowest of 3,009 counties
[in-text-ad]

9. Orleans Parish, Louisiana
> Gini index: 0.57
> Avg. household income, top 20%: $214,081 — 355th highest of 3,009 counties
> Avg. household income, bottom 20%: $6,684 — 113th lowest of 3,009 counties
> Share of all income in Orleans Parish that went to top 20%: 59.5% — 9th highest of 3,009 counties
> Share of all income in Orleans Parish that went to bottom 20%: 1.9% — 23rd lowest of 3,009 counties (tied)
> Median household income: $41,604 — 530th lowest of 3,009 counties
[recirclink id=920281]

8. Holmes County, Mississippi
> Gini index: 0.575
> Avg. household income, top 20%: $111,403 — 66th lowest of 3,009 counties
> Avg. household income, bottom 20%: $2,775 — 3rd lowest of 3,009 counties
> Share of all income in Holmes County that went to top 20%: 59.5% — 10th highest of 3,009 counties
> Share of all income in Holmes County that went to bottom 20%: 1.5% — 8th lowest of 3,009 counties
> Median household income: $21,504 — the lowest of 3,009 counties

7. Lafayette County, Arkansas
> Gini index: 0.581
> Avg. household income, top 20%: $184,443 — 772nd highest of 3,009 counties
> Avg. household income, bottom 20%: $5,381 — 36th lowest of 3,009 counties
> Share of all income in Lafayette County that went to top 20%: 60.7% — 6th highest of 3,009 counties
> Share of all income in Lafayette County that went to bottom 20%: 2.0% — 30th lowest of 3,009 counties
> Median household income: $32,397 — 96th lowest of 3,009 counties
[in-text-ad-2]

6. Leflore County, Mississippi
> Gini index: 0.586
> Avg. household income, top 20%: $145,056 — 846th lowest of 3,009 counties
> Avg. household income, bottom 20%: $3,341 — 6th lowest of 3,009 counties
> Share of all income in Leflore County that went to top 20%: 60.1% — 7th highest of 3,009 counties
> Share of all income in Leflore County that went to bottom 20%: 1.4% — 5th lowest of 3,009 counties (tied)
> Median household income: $26,735 — 16th lowest of 3,009 counties

5. New York County, New York
> Gini index: 0.596
> Avg. household income, top 20%: $496,681 — the highest of 3,009 counties
> Avg. household income, bottom 20%: $11,339 — 1,057th lowest of 3,009 counties
> Share of all income in New York County that went to top 20%: 62.3% — 5th highest of 3,009 counties
> Share of all income in New York County that went to bottom 20%: 1.4% — 7th lowest of 3,009 counties
> Median household income: $86,553 — 104th highest of 3,009 counties
[in-text-ad]

4. Dickenson County, Virginia
> Gini index: 0.6
> Avg. household income, top 20%: $180,311 — 843rd highest of 3,009 counties
> Avg. household income, bottom 20%: $6,226 — 76th lowest of 3,009 counties
> Share of all income in Dickenson County that went to top 20%: 62.5% — 4th highest of 3,009 counties
> Share of all income in Dickenson County that went to bottom 20%: 2.2% — 58th lowest of 3,009 counties (tied)
> Median household income: $29,932 — 50th lowest of 3,009 counties
[recirclink id=970377]
[Need Manual Image]
3. 
> Gini index: 0.601
> Avg. household income, top 20%: $205,517 — 436th highest of 3,009 counties
> Avg. household income, bottom 20%: $7,732 — 217th lowest of 3,009 counties (tied)
> Share of all income in Seminole County that went to top 20%: 63.0% — 3rd highest of 3,009 counties
> Share of all income in Seminole County that went to bottom 20%: 2.4% — 87th lowest of 3,009 counties (tied)
> Median household income: $33,357 — 112th lowest of 3,009 counties

2. Perry County, Tennessee
> Gini index: 0.608
> Avg. household income, top 20%: $229,032 — 234th highest of 3,009 counties
> Avg. household income, bottom 20%: $7,154 — 158th lowest of 3,009 counties
> Share of all income in Perry County that went to top 20%: 63.4% — 2nd highest of 3,009 counties
> Share of all income in Perry County that went to bottom 20%: 2.0% — 32nd lowest of 3,009 counties
> Median household income: $41,034 — 490th lowest of 3,009 counties
[in-text-ad-2]

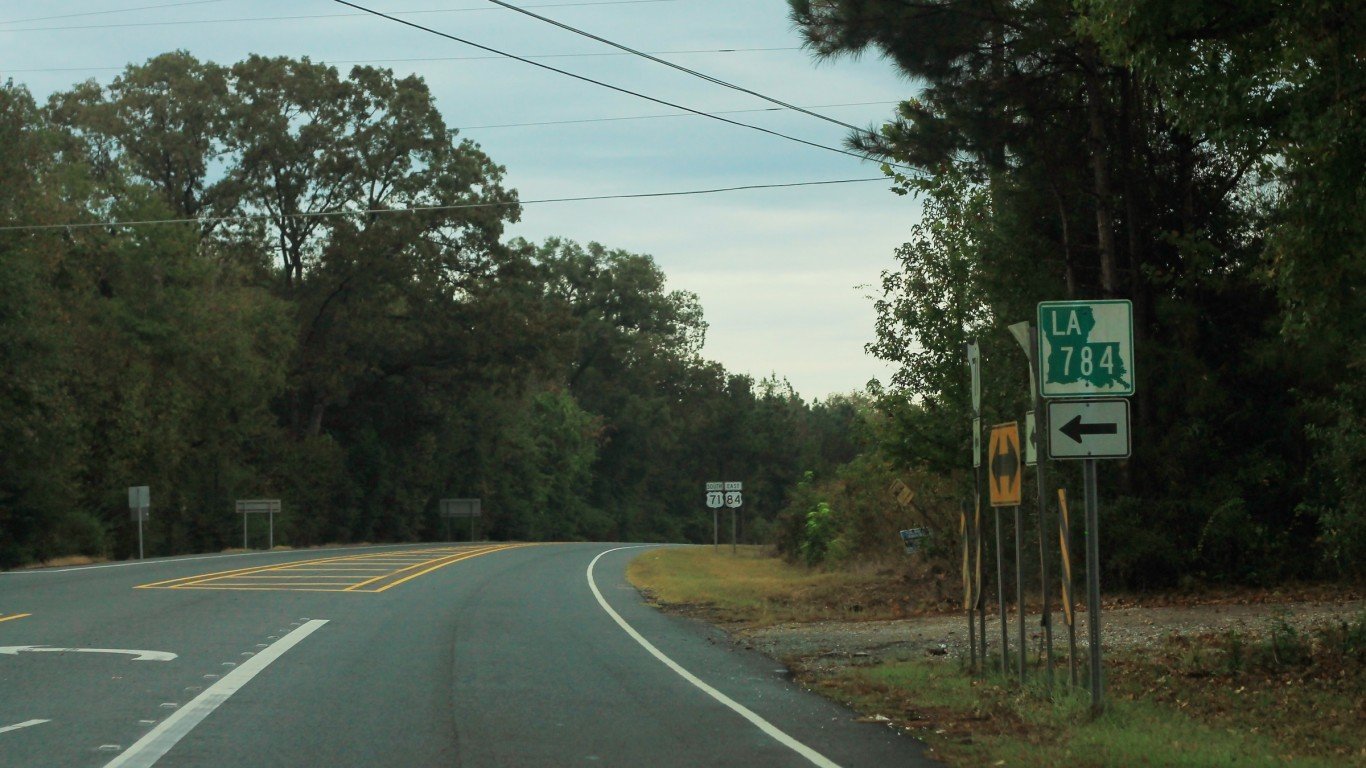
1. East Carroll Parish, Louisiana
> Gini index: 0.707
> Avg. household income, top 20%: $213,036 — 368th highest of 3,009 counties
> Avg. household income, bottom 20%: $2,806 — 5th lowest of 3,009 counties
> Share of all income in East Carroll Parish that went to top 20%: 72.5% — the highest of 3,009 counties
> Share of all income in East Carroll Parish that went to bottom 20%: 1.0% — 2nd lowest of 3,009 counties
> Median household income: $22,346 — 3rd lowest of 3,009 counties
To determine the counties with the widest income gaps in the nation, 24/7 Wall St. reviewed five-year estimates of the Gini Index of income inequality from the U.S. Census Bureau’s 2019 American Community Survey.
The Gini Index of income inequality summarizes income dispersion in an area on a scale from 0 to 1. A value of 0 indicates perfect equality — everyone in the area receives an equal share of income. A value of 1 indicates perfect inequality — only one recipient receives all the income.
Of the 3,220 counties or county equivalents, 3,142 had boundaries that fell within one of the 50 states or the District of Columbia.
Counties were excluded if the Gini Index was not available in the 2019 ACS, if there were fewer than 1,000 housing units, or if the sampling error associated with a county’s data was deemed too high.
The sampling error was defined as too high if the coefficient of variation — a statistical assessment of how reliable an estimate is — for a county’s Gini Index was above 15% and greater than two standard deviations above the mean CV for all counties’ Gini Indices. We similarly excluded counties that had a sampling error too high for their population, using the same definition.
The remaining 3,009 places were ranked based on their Gini Index. To break ties, we used the share of aggregate household income earned by the top 20% of households.
Additional information on average household income by quintile, share of aggregate household income by quintile, and median household income are also five-year estimates from the 2019 ACS.
Contact [email protected] for any questions or corrections.