
Each day, at dinner tables and social gatherings across the country, millions of adults enjoy alcohol responsibly. Moderate drinking — defined as two standard drinks per day for men and one standard drink for women — carries relatively little risk, and may even have some health benefits. However, beyond this threshold, alcohol can only be detrimental.
Excessive drinking — along with tobacco use, inadequate exercise, and poor nutrition — is one of four main risk factors for preventable disease identified by the CDC. In addition to short-term consequences, such as impaired judgement and motor skills, excessive alcohol consumption is associated with liver disease, certain cancers, increased risk of a heart attack or stroke, and poor mental health. Here is a look at 23 ways a drinking habit can harm you.
Each year, alcohol misuse is directly linked to diseases and accidents that kill an estimated 95,000 Americans. Excessive drinking also costs the economy hundreds of billions of dollars annually, mostly in lost productivity.
Using data from County Health Rankings & Roadmaps, a joint program between the Robert Wood Johnson Foundation and the University of Wisconsin Population Health Institute, 24/7 Tempo identified America’s drunkest states.
States are ranked on the share of adults who either binge drink or drink heavily. CHR defines binge drinking as consumption of more than four drinks in a single occasion for women and more than five drinks for men. Heavy drinking is defined as more than one drink a day on average for women and more than two drinks a day for men.
Depending on the state, excessive drinking rates range from as low as 11.1% all the way up to 27.1%. All five states with the highest excessive drinking rates are in the Midwest, while four out of the five states with the lowest excessive drinking rates are in the South. Nationwide, 19.2% of adults drink excessively.
It is important to note that alcohol affects everyone differently, and as a general rule, drinking less is better than drinking more. Additionally, the vast majority of Americans who drink excessively — about 90% of them — do not have a severe alcohol use disorder, a chronic disease commonly referred to as alcoholism.
Click here to see America’s drunkest states
Click here to read our detailed methodology

50. Utah
> Adults binge or heavy drinking: 11.1%
> Driving deaths involving alcohol: 21.0% (6th lowest)
> Median household income: $75,780 (11th highest)
> Adults reporting poor or fair health: 14.8% (13th lowest)
[in-text-ad]

49. West Virginia
> Adults binge or heavy drinking: 14.4%
> Driving deaths involving alcohol: 25.2% (11th lowest)
> Median household income: $48,850 (2nd lowest)
> Adults reporting poor or fair health: 23.6% (the highest)
[recirclink id=488456]

48. Mississippi
> Adults binge or heavy drinking: 14.8%
> Driving deaths involving alcohol: 19.6% (2nd lowest)
> Median household income: $45,792 (the lowest)
> Adults reporting poor or fair health: 22.1% (3rd highest)

47. Alabama
> Adults binge or heavy drinking: 14.9%
> Driving deaths involving alcohol: 26.9% (19th lowest)
> Median household income: $51,734 (5th lowest)
> Adults reporting poor or fair health: 21.4% (6th highest)
[in-text-ad-2]

46. Oklahoma
> Adults binge or heavy drinking: 14.9%
> Driving deaths involving alcohol: 26.5% (17th lowest)
> Median household income: $54,449 (8th lowest)
> Adults reporting poor or fair health: 20.9% (8th highest)

45. Maryland
> Adults binge or heavy drinking: 15.4%
> Driving deaths involving alcohol: 28.8% (23rd lowest)
> Median household income: $86,738 (the highest)
> Adults reporting poor or fair health: 15.2% (16th lowest)
[in-text-ad]

44. New Jersey
> Adults binge or heavy drinking: 16.0%
> Driving deaths involving alcohol: 21.9% (7th lowest)
> Median household income: $85,751 (3rd highest)
> Adults reporting poor or fair health: 15.5% (19th lowest)
[recirclink id=885553]

43. New Mexico
> Adults binge or heavy drinking: 16.7%
> Driving deaths involving alcohol: 29.8% (23rd highest)
> Median household income: $51,945 (6th lowest)
> Adults reporting poor or fair health: 20.3% (9th highest)

42. Georgia
> Adults binge or heavy drinking: 16.8%
> Driving deaths involving alcohol: 20.3% (4th lowest)
> Median household income: $61,980 (22nd lowest)
> Adults reporting poor or fair health: 18.4% (15th highest)
[in-text-ad-2]

41. Idaho
> Adults binge or heavy drinking: 17.1%
> Driving deaths involving alcohol: 31.4% (19th highest)
> Median household income: $60,999 (20th lowest)
> Adults reporting poor or fair health: 15.1% (15th lowest)

40. Washington
> Adults binge or heavy drinking: 17.1%
> Driving deaths involving alcohol: 32.5% (12th highest)
> Median household income: $78,687 (7th highest)
> Adults reporting poor or fair health: 15.0% (14th lowest)
[in-text-ad]

39. Tennessee
> Adults binge or heavy drinking: 17.1%
> Driving deaths involving alcohol: 24.6% (9th lowest)
> Median household income: $56,071 (9th lowest)
> Adults reporting poor or fair health: 21.2% (7th highest)
[recirclink id=935217]

38. Kentucky
> Adults binge or heavy drinking: 17.2%
> Driving deaths involving alcohol: 25.5% (12th lowest)
> Median household income: $52,295 (7th lowest)
> Adults reporting poor or fair health: 21.8% (4th highest)

37. Arkansas
> Adults binge or heavy drinking: 17.3%
> Driving deaths involving alcohol: 26.2% (15th lowest)
> Median household income: $48,952 (3rd lowest)
> Adults reporting poor or fair health: 23.3% (2nd highest)
[in-text-ad-2]

36. North Carolina
> Adults binge or heavy drinking: 17.6%
> Driving deaths involving alcohol: 27.6% (21st lowest)
> Median household income: $57,341 (12th lowest)
> Adults reporting poor or fair health: 18.0% (19th highest)

35. Alaska
> Adults binge or heavy drinking: 17.6%
> Driving deaths involving alcohol: 37.9% (4th highest)
> Median household income: $75,463 (12th highest)
> Adults reporting poor or fair health: 15.6% (20th lowest)
[in-text-ad]

34. Virginia
> Adults binge or heavy drinking: 17.7%
> Driving deaths involving alcohol: 29.8% (24th highest)
> Median household income: $76,456 (10th highest)
> Adults reporting poor or fair health: 16.6% (25th highest)
[recirclink id=939663]

33. South Carolina
> Adults binge or heavy drinking: 17.8%
> Driving deaths involving alcohol: 31.8% (15th highest)
> Median household income: $56,227 (10th lowest)
> Adults reporting poor or fair health: 17.8% (20th highest)

32. Nevada
> Adults binge or heavy drinking: 17.9%
> Driving deaths involving alcohol: 29.1% (24th lowest)
> Median household income: $63,276 (24th highest)
> Adults reporting poor or fair health: 19.1% (12th highest)
[in-text-ad-2]

31. Arizona
> Adults binge or heavy drinking: 18.1%
> Driving deaths involving alcohol: 24.7% (10th lowest)
> Median household income: $62,055 (23rd lowest)
> Adults reporting poor or fair health: 18.6% (14th highest)

30. California
> Adults binge or heavy drinking: 18.1%
> Driving deaths involving alcohol: 28.7% (22nd lowest)
> Median household income: $80,440 (5th highest)
> Adults reporting poor or fair health: 17.6% (22nd highest)
[in-text-ad]

29. Kansas
> Adults binge or heavy drinking: 18.2%
> Driving deaths involving alcohol: 19.9% (3rd lowest)
> Median household income: $62,087 (24th lowest)
> Adults reporting poor or fair health: 16.3% (24th lowest)
[recirclink id=952318]

28. Ohio
> Adults binge or heavy drinking: 18.5%
> Driving deaths involving alcohol: 32.2% (14th highest)
> Median household income: $58,642 (15th lowest)
> Adults reporting poor or fair health: 17.8% (21st highest)

27. Indiana
> Adults binge or heavy drinking: 18.6%
> Driving deaths involving alcohol: 18.8% (the lowest)
> Median household income: $57,603 (14th lowest)
> Adults reporting poor or fair health: 18.2% (17th highest)
[in-text-ad-2]

26. Texas
> Adults binge or heavy drinking: 19.0%
> Driving deaths involving alcohol: 25.7% (13th lowest)
> Median household income: $64,034 (22nd highest)
> Adults reporting poor or fair health: 18.7% (13th highest)

25. New York
> Adults binge or heavy drinking: 19.2%
> Driving deaths involving alcohol: 20.6% (5th lowest)
> Median household income: $72,108 (14th highest)
> Adults reporting poor or fair health: 16.3% (22nd lowest)
[in-text-ad]

24. Oregon
> Adults binge or heavy drinking: 19.5%
> Driving deaths involving alcohol: 31.5% (18th highest)
> Median household income: $67,058 (18th highest)
> Adults reporting poor or fair health: 18.2% (18th highest)
[recirclink id=488094]

23. Rhode Island
> Adults binge or heavy drinking: 19.7%
> Driving deaths involving alcohol: 41.6% (3rd highest)
> Median household income: $71,169 (15th highest)
> Adults reporting poor or fair health: 16.5% (25th lowest)

22. Louisiana
> Adults binge or heavy drinking: 19.7%
> Driving deaths involving alcohol: 32.3% (13th highest)
> Median household income: $51,073 (4th lowest)
> Adults reporting poor or fair health: 21.4% (5th highest)
[in-text-ad-2]

21. Florida
> Adults binge or heavy drinking: 19.7%
> Driving deaths involving alcohol: 22.3% (8th lowest)
> Median household income: $59,227 (17th lowest)
> Adults reporting poor or fair health: 19.5% (10th highest)

20. Delaware
> Adults binge or heavy drinking: 19.8%
> Driving deaths involving alcohol: 26.0% (14th lowest)
> Median household income: $70,176 (16th highest)
> Adults reporting poor or fair health: 16.3% (23rd lowest)
[in-text-ad]

19. Wyoming
> Adults binge or heavy drinking: 20.1%
> Driving deaths involving alcohol: 32.8% (10th highest)
> Median household income: $65,003 (19th highest)
> Adults reporting poor or fair health: 15.3% (17th lowest)
[recirclink id=885553]

18. Pennsylvania
> Adults binge or heavy drinking: 20.2%
> Driving deaths involving alcohol: 26.2% (16th lowest)
> Median household income: $63,463 (23rd highest)
> Adults reporting poor or fair health: 17.6% (23rd highest)

17. New Hampshire
> Adults binge or heavy drinking: 20.2%
> Driving deaths involving alcohol: 31.5% (17th highest)
> Median household income: $77,933 (8th highest)
> Adults reporting poor or fair health: 12.8% (2nd lowest)
[in-text-ad-2]

16. Vermont
> Adults binge or heavy drinking: 20.5%
> Driving deaths involving alcohol: 34.3% (8th highest)
> Median household income: $63,001 (25th lowest)
> Adults reporting poor or fair health: 12.8% (the lowest)

15. Connecticut
> Adults binge or heavy drinking: 20.5%
> Driving deaths involving alcohol: 31.5% (16th highest)
> Median household income: $78,833 (6th highest)
> Adults reporting poor or fair health: 13.0% (4th lowest)
[in-text-ad]
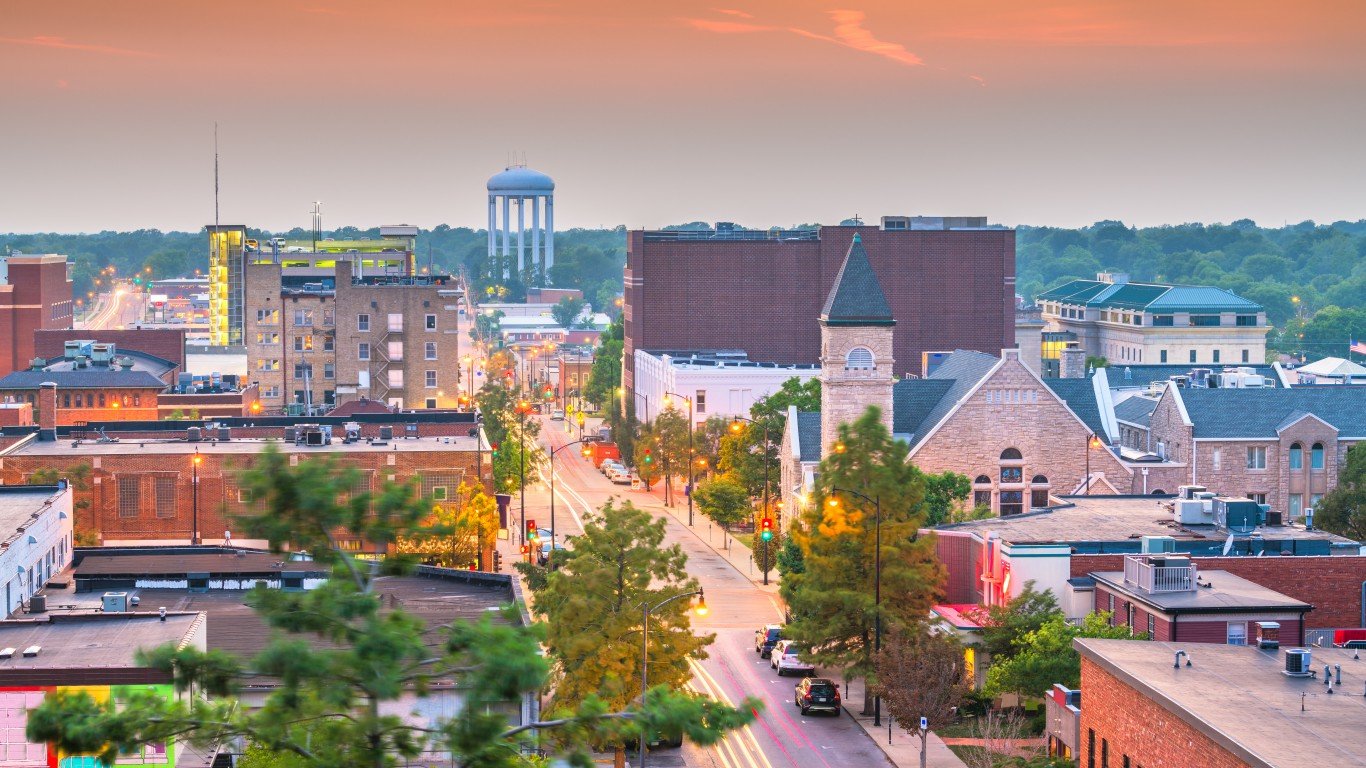
14. Missouri
> Adults binge or heavy drinking: 20.5%
> Driving deaths involving alcohol: 27.1% (20th lowest)
> Median household income: $57,409 (13th lowest)
> Adults reporting poor or fair health: 19.5% (11th highest)
[recirclink id=935217]
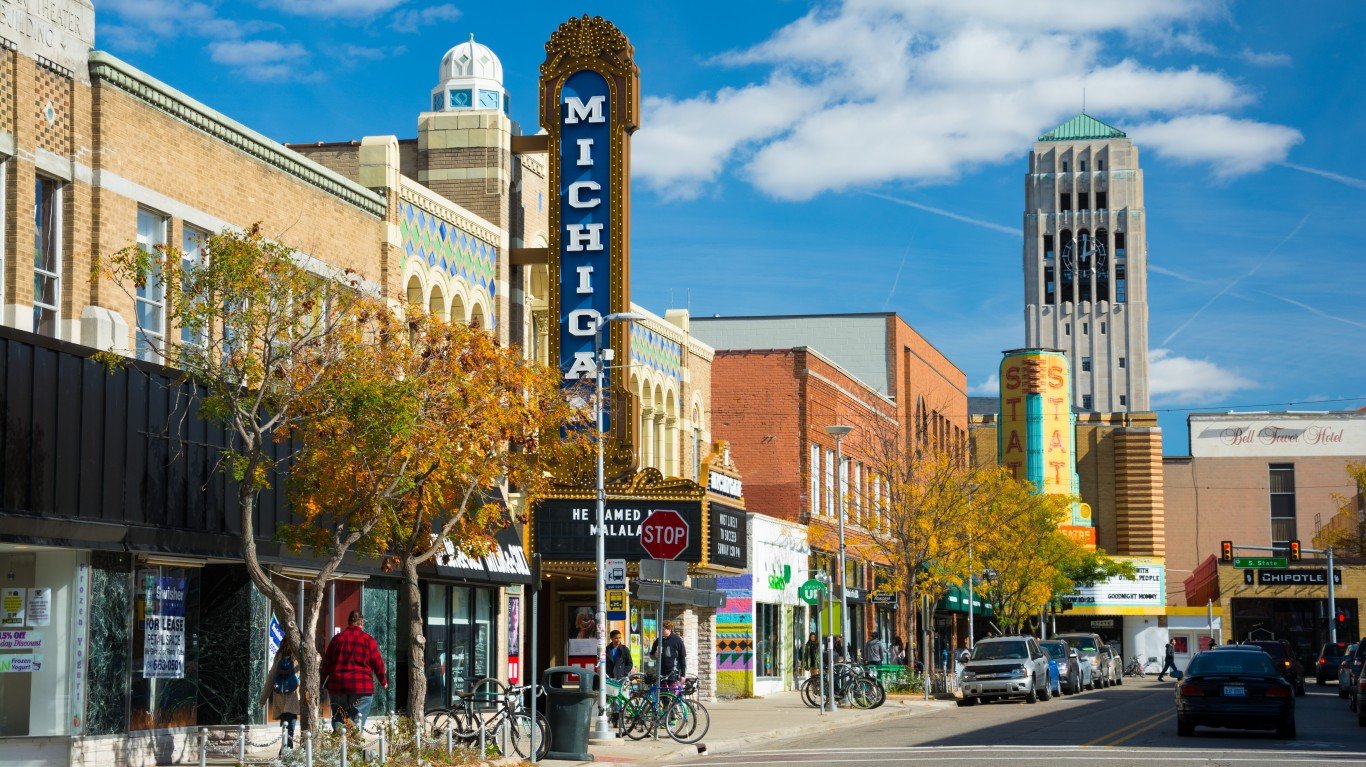
13. Michigan
> Adults binge or heavy drinking: 20.9%
> Driving deaths involving alcohol: 29.3% (25th lowest)
> Median household income: $59,584 (19th lowest)
> Adults reporting poor or fair health: 18.3% (16th highest)
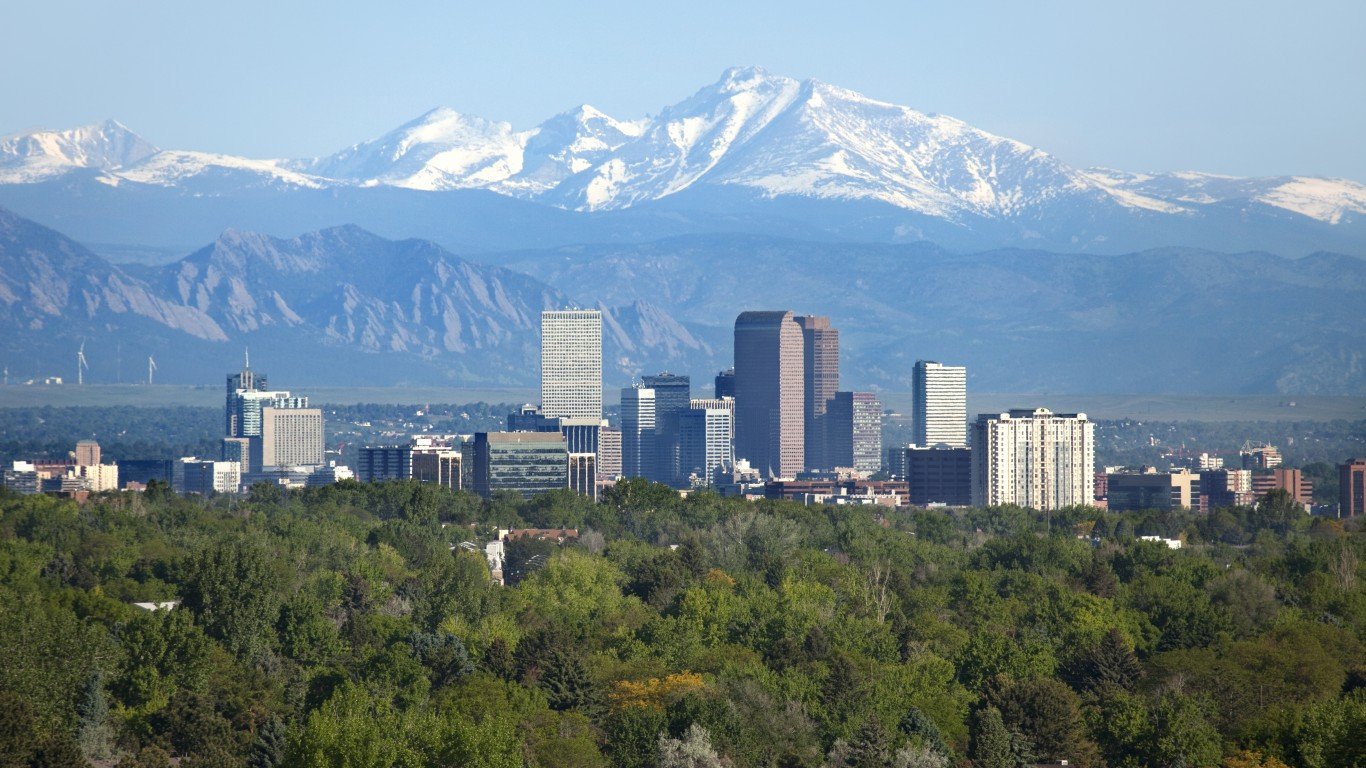
12. Colorado
> Adults binge or heavy drinking: 21.3%
> Driving deaths involving alcohol: 33.7% (9th highest)
> Median household income: $77,127 (9th highest)
> Adults reporting poor or fair health: 13.8% (9th lowest)
[in-text-ad-2]

11. Illinois
> Adults binge or heavy drinking: 21.5%
> Driving deaths involving alcohol: 31.1% (21st highest)
> Median household income: $69,187 (17th highest)
> Adults reporting poor or fair health: 15.9% (21st lowest)

10. Montana
> Adults binge or heavy drinking: 21.9%
> Driving deaths involving alcohol: 44.8% (the highest)
> Median household income: $57,153 (11th lowest)
> Adults reporting poor or fair health: 14.1% (11th lowest)
[in-text-ad]

9. Maine
> Adults binge or heavy drinking: 22.0%
> Driving deaths involving alcohol: 35.4% (7th highest)
> Median household income: $58,924 (16th lowest)
> Adults reporting poor or fair health: 17.1% (24th highest)
[recirclink id=939663]

8. Hawaii
> Adults binge or heavy drinking: 23.0%
> Driving deaths involving alcohol: 31.2% (20th highest)
> Median household income: $83,102 (4th highest)
> Adults reporting poor or fair health: 15.4% (18th lowest)

7. Minnesota
> Adults binge or heavy drinking: 23.2%
> Driving deaths involving alcohol: 29.7% (25th highest)
> Median household income: $74,593 (13th highest)
> Adults reporting poor or fair health: 12.9% (3rd lowest)
[in-text-ad-2]

6. Massachusetts
> Adults binge or heavy drinking: 23.5%
> Driving deaths involving alcohol: 30.2% (22nd highest)
> Median household income: $85,843 (2nd highest)
> Adults reporting poor or fair health: 13.5% (7th lowest)

5. Nebraska
> Adults binge or heavy drinking: 23.7%
> Driving deaths involving alcohol: 32.7% (11th highest)
> Median household income: $63,229 (25th highest)
> Adults reporting poor or fair health: 13.8% (10th lowest)
[in-text-ad]

4. North Dakota
> Adults binge or heavy drinking: 23.7%
> Driving deaths involving alcohol: 42.3% (2nd highest)
> Median household income: $64,577 (20th highest)
> Adults reporting poor or fair health: 13.6% (8th lowest)
[recirclink id=952318]
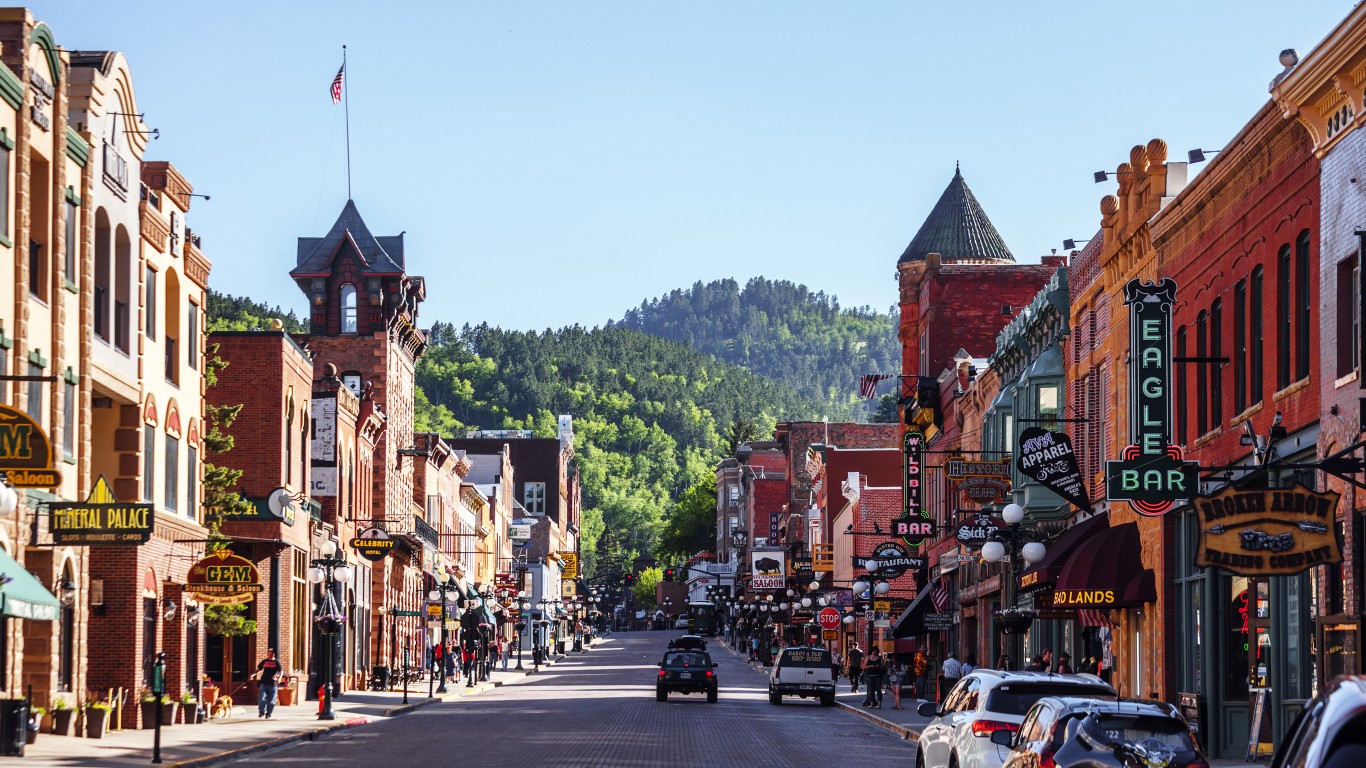
3. South Dakota
> Adults binge or heavy drinking: 24.3%
> Driving deaths involving alcohol: 35.5% (6th highest)
> Median household income: $59,533 (18th lowest)
> Adults reporting poor or fair health: 13.4% (5th lowest)

2. Iowa
> Adults binge or heavy drinking: 25.8%
> Driving deaths involving alcohol: 26.8% (18th lowest)
> Median household income: $61,691 (21st lowest)
> Adults reporting poor or fair health: 13.5% (6th lowest)
[in-text-ad-2]
1. Wisconsin
> Adults binge or heavy drinking: 27.1%
> Driving deaths involving alcohol: 35.7% (5th highest)
> Median household income: $64,168 (21st highest)
> Adults reporting poor or fair health: 14.8% (12th lowest)
To determine America’s drunkest states, 24/7 Tempo reviewed rates of excessive drinking from the Robert Wood Johnson Foundation and the University of Wisconsin Population Health Institute joint program’s 2021 County Health Rankings & Roadmaps report.
The rate of excessive drinking is defined as the share of adults who report either binge drinking or heavy drinking in the past 30 days. Binge drinking is defined as a woman consuming more than four drinks or a man consuming more than five drinks in a single occasion. Heavy drinking is defined as a woman consuming more than one drink per day on average or a man consuming more than two drinks per day on average.
While the CHR report is from 2021, excessive drinking rate figures published in the report are from 2018.
States were ranked based on the excessive drinking rate. Additional information on the share of driving deaths with alcohol involvement, and the share of adults who report fair or poor health are also from the 2021 CHR. Median household income data are one-year estimates from the U.S. Census Bureau’s 2019 American Community Survey.
Contact [email protected] for any questions or corrections.