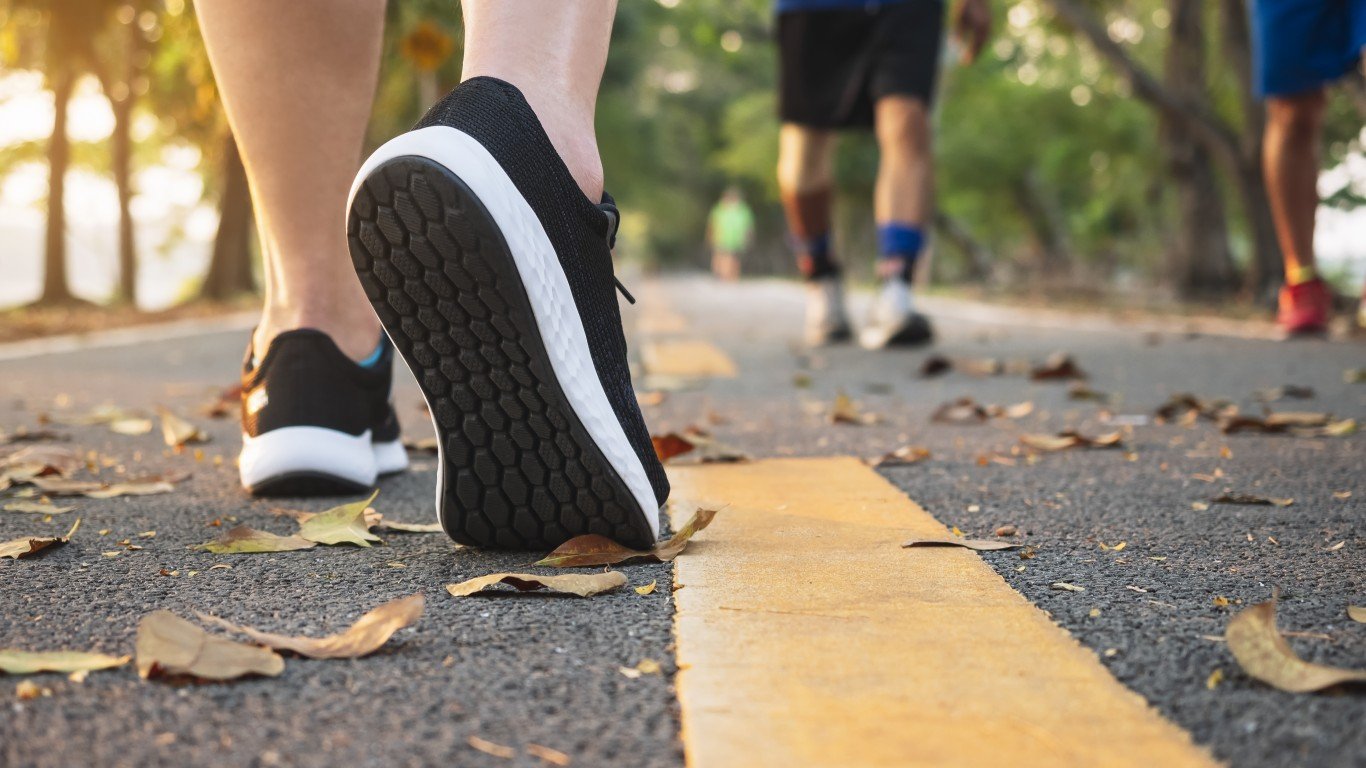
Exercise is one of the most effective ways for people to improve their overall health. Regular exercise has been shown to reduce the risk of depression, weight gain, and certain chronic diseases, while improving cognitive function, sleep quality, and physical balance — among many other benefits.
Still, according to the Centers for Disease Control and Prevention, about half of all American adults are not getting enough exercise — and over 55 million American adults, or 22.7% of the 20 and older population, lead completely sedentary lifestyles. Physical inactivity leads to about one in every 10 premature deaths in the U.S. and costs the health care system an estimated $117 billion annually, according to the CDC.
Using data from County Health Rankings & Roadmaps, a Robert Wood Johnson Foundation and University of Wisconsin Population Health Institute joint program, 24/7 Tempo identified America’s laziest states. States are ranked on the share of adults 20 and older who report no leisure-time physical activity.
Depending on the state, inactivity rates range from less than 15% to over 30%. States with the most physically active populations tend to be concentrated in the West, while those with the largest shares of adults who never exercise are in the South.
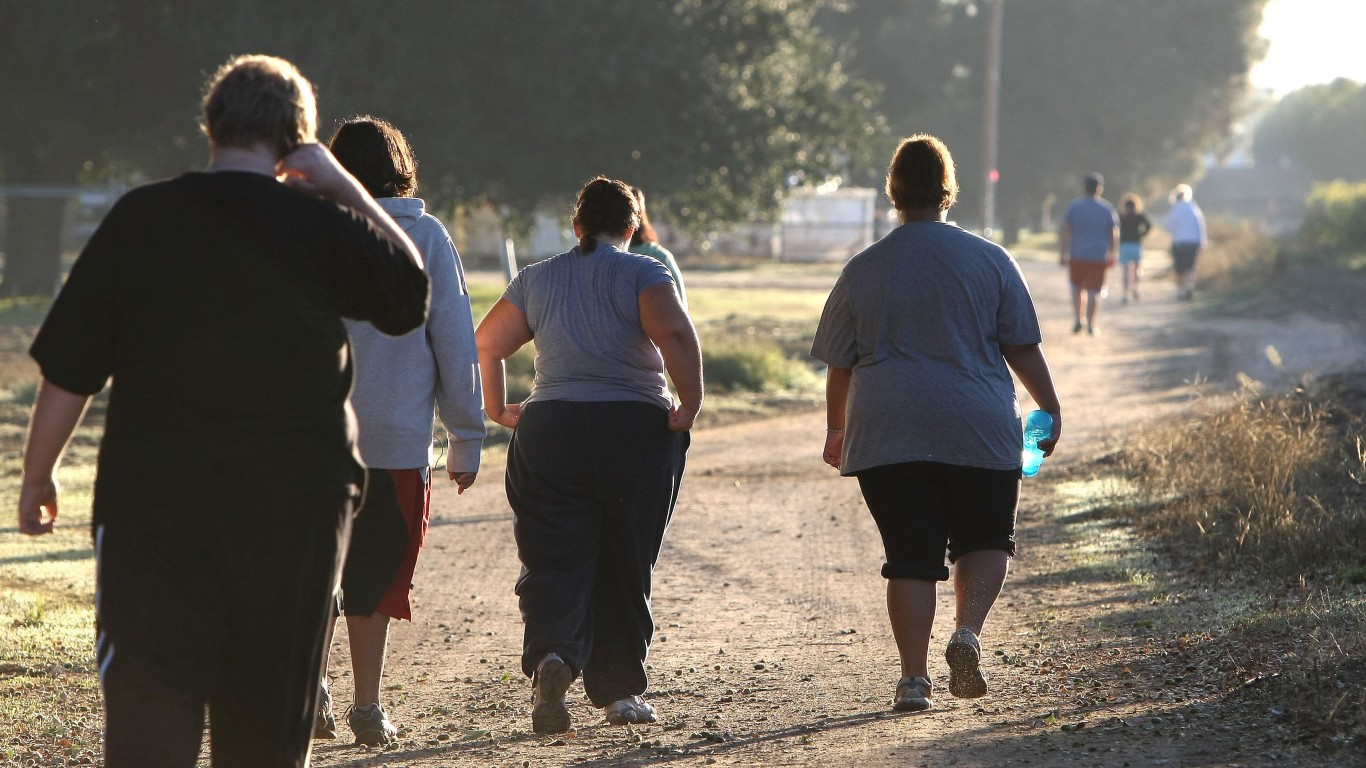
Given the benefits associated with regular exercise, it is perhaps not surprising that overall health outcomes are often better in states where larger shares of the population are physically active. For example, in most states where adults are less likely to exercise regularly, both the obesity rate and the share of adults who report being in fair or poor health are higher than the respective national averages of 29.7% and 16.5%. Here is a look at the most obese states in America.
Meanwhile, in states where exercise is more common, residents are generally less likely to be obese or in fair or poor health than the typical American.
Click here to see America’s laziest states
Click here to read our detailed methodology

50. Colorado
> Adults who don’t exercise: 14.8%
> Pop. with access to places for physical activity: 90.5% (12th highest)
> Adult obesity rate: 22.4% (the lowest)
> Adults with diabetes: 6.6% (the lowest)
> Adults reporting poor or fair health: 13.8% (9th lowest)
> Physically unhealthy days per month: 3.3 (7th lowest)
[in-text-ad]

49. Washington
> Adults who don’t exercise: 16.4%
> Pop. with access to places for physical activity: 86.2% (18th highest)
> Adult obesity rate: 28.6% (17th lowest)
> Adults with diabetes: 9.3% (11th lowest — tied)
> Adults reporting poor or fair health: 15.0% (14th lowest)
> Physically unhealthy days per month: 3.7 (25th lowest)
[recirclink id=937287]
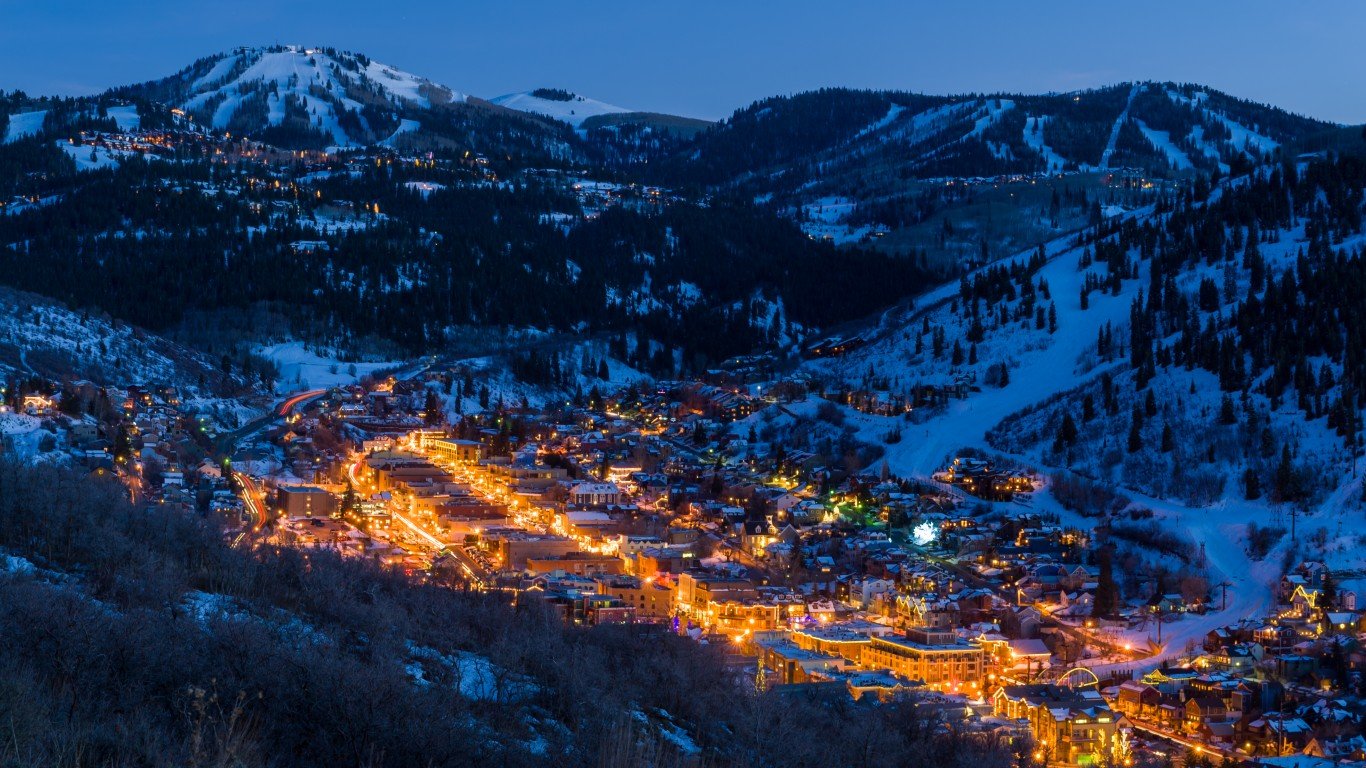
48. Utah
> Adults who don’t exercise: 16.7%
> Pop. with access to places for physical activity: 85.7% (19th highest)
> Adult obesity rate: 27.0% (7th lowest — tied)
> Adults with diabetes: 7.5% (2nd lowest)
> Adults reporting poor or fair health: 14.8% (13th lowest)
> Physically unhealthy days per month: 3.5 (13th lowest)

47. Oregon
> Adults who don’t exercise: 17.3%
> Pop. with access to places for physical activity: 87.9% (15th highest)
> Adult obesity rate: 29.3% (21st lowest)
> Adults with diabetes: 9.7% (18th lowest)
> Adults reporting poor or fair health: 18.2% (18th highest)
> Physically unhealthy days per month: 4.7 (4th highest)
[in-text-ad-2]

46. California
> Adults who don’t exercise: 17.7%
> Pop. with access to places for physical activity: 93.1% (7th highest)
> Adult obesity rate: 24.3% (2nd lowest)
> Adults with diabetes: 8.8% (6th lowest — tied)
> Adults reporting poor or fair health: 17.6% (22nd highest)
> Physically unhealthy days per month: 3.9 (24th highest)

45. Vermont
> Adults who don’t exercise: 18.4%
> Pop. with access to places for physical activity: 75.8% (17th lowest)
> Adult obesity rate: 27.0% (7th lowest — tied)
> Adults with diabetes: 8.8% (6th lowest — tied)
> Adults reporting poor or fair health: 12.8% (the lowest)
> Physically unhealthy days per month: 3.7 (20th lowest)
[in-text-ad]

44. New Mexico
> Adults who don’t exercise: 19.0%
> Pop. with access to places for physical activity: 76.9% (20th lowest)
> Adult obesity rate: 27.3% (13th lowest)
> Adults with diabetes: 9.5% (14th lowest — tied)
> Adults reporting poor or fair health: 20.3% (9th highest)
> Physically unhealthy days per month: 4.3 (11th highest)
[recirclink id=938898]

43. Alaska
> Adults who don’t exercise: 19.3%
> Pop. with access to places for physical activity: 100.0% (the highest)
> Adult obesity rate: 31.9% (22nd highest)
> Adults with diabetes: 8.3% (3rd lowest)
> Adults reporting poor or fair health: 15.6% (20th lowest)
> Physically unhealthy days per month: 4.1 (17th highest)

42. Minnesota
> Adults who don’t exercise: 19.6%
> Pop. with access to places for physical activity: 86.9% (16th highest)
> Adult obesity rate: 29.0% (18th lowest)
> Adults with diabetes: 8.5% (4th lowest)
> Adults reporting poor or fair health: 12.9% (3rd lowest)
> Physically unhealthy days per month: 3.1 (3rd lowest)
[in-text-ad-2]

41. Hawaii
> Adults who don’t exercise: 19.6%
> Pop. with access to places for physical activity: 92.5% (10th highest)
> Adult obesity rate: 24.6% (3rd lowest)
> Adults with diabetes: 11.1% (16th highest — tied)
> Adults reporting poor or fair health: 15.4% (18th lowest)
> Physically unhealthy days per month: 3.2 (6th lowest)

40. Connecticut
> Adults who don’t exercise: 19.9%
> Pop. with access to places for physical activity: 94.0% (5th highest)
> Adult obesity rate: 26.3% (5th lowest)
> Adults with diabetes: 9.2% (10th lowest)
> Adults reporting poor or fair health: 13.0% (4th lowest)
> Physically unhealthy days per month: 3.3 (8th lowest)
[in-text-ad]

39. Massachusetts
> Adults who don’t exercise: 20.0%
> Pop. with access to places for physical activity: 94.5% (4th highest)
> Adult obesity rate: 25.0% (4th lowest)
> Adults with diabetes: 8.7% (5th lowest)
> Adults reporting poor or fair health: 13.5% (7th lowest)
> Physically unhealthy days per month: 3.5 (11th lowest)
[recirclink id=945348]

38. Wisconsin
> Adults who don’t exercise: 20.3%
> Pop. with access to places for physical activity: 85.2% (21st highest)
> Adult obesity rate: 31.7% (23rd highest)
> Adults with diabetes: 9.5% (14th lowest — tied)
> Adults reporting poor or fair health: 14.8% (12th lowest)
> Physically unhealthy days per month: 3.7 (21st lowest)

37. Idaho
> Adults who don’t exercise: 20.4%
> Pop. with access to places for physical activity: 78.9% (21st lowest)
> Adult obesity rate: 29.0% (19th lowest)
> Adults with diabetes: 9.3% (11th lowest — tied)
> Adults reporting poor or fair health: 15.1% (15th lowest)
> Physically unhealthy days per month: 3.7 (24th lowest)
[in-text-ad-2]

36. Maine
> Adults who don’t exercise: 20.8%
> Pop. with access to places for physical activity: 70.0% (6th lowest)
> Adult obesity rate: 29.8% (23rd lowest)
> Adults with diabetes: 10.4% (24th highest)
> Adults reporting poor or fair health: 17.1% (24th highest)
> Physically unhealthy days per month: 4.2 (15th highest)

35. New Hampshire
> Adults who don’t exercise: 20.8%
> Pop. with access to places for physical activity: 88.2% (14th highest)
> Adult obesity rate: 28.6% (16th lowest)
> Adults with diabetes: 9.6% (16th lowest — tied)
> Adults reporting poor or fair health: 12.8% (2nd lowest)
> Physically unhealthy days per month: 3.5 (14th lowest)
[in-text-ad]

34. Arizona
> Adults who don’t exercise: 21.2%
> Pop. with access to places for physical activity: 85.1% (22nd highest)
> Adult obesity rate: 27.9% (14th lowest)
> Adults with diabetes: 9.6% (16th lowest — tied)
> Adults reporting poor or fair health: 18.6% (14th highest)
> Physically unhealthy days per month: 4.2 (14th highest)
[recirclink id=952318]

33. Illinois
> Adults who don’t exercise: 21.6%
> Pop. with access to places for physical activity: 90.8% (11th highest)
> Adult obesity rate: 29.7% (22nd lowest)
> Adults with diabetes: 9.9% (19th lowest — tied)
> Adults reporting poor or fair health: 15.9% (21st lowest)
> Physically unhealthy days per month: 3.6 (16th lowest)

32. Montana
> Adults who don’t exercise: 21.7%
> Pop. with access to places for physical activity: 75.2% (14th lowest)
> Adult obesity rate: 27.1% (11th lowest)
> Adults with diabetes: 8.9% (8th lowest)
> Adults reporting poor or fair health: 14.1% (11th lowest)
> Physically unhealthy days per month: 3.6 (19th lowest)
[in-text-ad-2]

31. Maryland
> Adults who don’t exercise: 21.9%
> Pop. with access to places for physical activity: 92.6% (9th highest)
> Adult obesity rate: 31.6% (24th highest)
> Adults with diabetes: 11.1% (16th highest — tied)
> Adults reporting poor or fair health: 15.2% (16th lowest)
> Physically unhealthy days per month: 3.4 (9th lowest)
30. South Dakota
> Adults who don’t exercise: 22.0%
> Pop. with access to places for physical activity: 73.5% (11th lowest)
> Adult obesity rate: 32.4% (19th highest)
> Adults with diabetes: 10.1% (23rd lowest — tied)
> Adults reporting poor or fair health: 13.4% (5th lowest)
> Physically unhealthy days per month: 3 (the lowest)
[in-text-ad]

29. Pennsylvania
> Adults who don’t exercise: 22.0%
> Pop. with access to places for physical activity: 84.4% (23rd highest)
> Adult obesity rate: 30.8% (25th lowest)
> Adults with diabetes: 11.0% (18th highest — tied)
> Adults reporting poor or fair health: 17.6% (23rd highest)
> Physically unhealthy days per month: 4 (20th highest)
[recirclink id=964573]

28. Virginia
> Adults who don’t exercise: 22.2%
> Pop. with access to places for physical activity: 82.4% (24th lowest)
> Adult obesity rate: 30.5% (24th lowest)
> Adults with diabetes: 10.7% (21st highest)
> Adults reporting poor or fair health: 16.6% (25th highest)
> Physically unhealthy days per month: 3.5 (12th lowest)

27. Nevada
> Adults who don’t exercise: 22.5%
> Pop. with access to places for physical activity: 93.0% (8th highest)
> Adult obesity rate: 27.1% (10th lowest)
> Adults with diabetes: 10.5% (22nd highest — tied)
> Adults reporting poor or fair health: 19.1% (12th highest)
> Physically unhealthy days per month: 4.2 (13th highest)
[in-text-ad-2]

26. Iowa
> Adults who don’t exercise: 22.6%
> Pop. with access to places for physical activity: 82.9% (25th lowest)
> Adult obesity rate: 34.3% (8th highest)
> Adults with diabetes: 9.9% (19th lowest — tied)
> Adults reporting poor or fair health: 13.5% (6th lowest)
> Physically unhealthy days per month: 3.1 (2nd lowest)

25. Nebraska
> Adults who don’t exercise: 22.7%
> Pop. with access to places for physical activity: 83.5% (25th highest)
> Adult obesity rate: 33.4% (13th highest)
> Adults with diabetes: 10.0% (22nd lowest)
> Adults reporting poor or fair health: 13.8% (10th lowest)
> Physically unhealthy days per month: 3.2 (5th lowest)
[in-text-ad]

24. Michigan
> Adults who don’t exercise: 23.1%
> Pop. with access to places for physical activity: 85.5% (20th highest)
> Adult obesity rate: 32.4% (17th highest — tied)
> Adults with diabetes: 11.0% (18th highest — tied)
> Adults reporting poor or fair health: 18.3% (16th highest)
> Physically unhealthy days per month: 4.3 (10th highest)
[recirclink id=937287]

23. North Dakota
> Adults who don’t exercise: 23.1%
> Pop. with access to places for physical activity: 74.0% (12th lowest)
> Adult obesity rate: 33.9% (10th highest — tied)
> Adults with diabetes: 9.4% (13th lowest)
> Adults reporting poor or fair health: 13.6% (8th lowest)
> Physically unhealthy days per month: 3.2 (4th lowest)
22. Wyoming
> Adults who don’t exercise: 23.1%
> Pop. with access to places for physical activity: 76.5% (18th lowest)
> Adult obesity rate: 29.2% (20th lowest)
> Adults with diabetes: 9.0% (9th lowest)
> Adults reporting poor or fair health: 15.3% (17th lowest)
> Physically unhealthy days per month: 3.5 (10th lowest)
[in-text-ad-2]

21. Texas
> Adults who don’t exercise: 23.2%
> Pop. with access to places for physical activity: 80.5% (23rd lowest)
> Adult obesity rate: 31.4% (25th highest)
> Adults with diabetes: 10.2% (25th highest)
> Adults reporting poor or fair health: 18.7% (13th highest)
> Physically unhealthy days per month: 3.8 (25th highest)

20. North Carolina
> Adults who don’t exercise: 23.3%
> Pop. with access to places for physical activity: 73.5% (10th lowest)
> Adult obesity rate: 32.3% (20th highest — tied)
> Adults with diabetes: 11.5% (14th highest)
> Adults reporting poor or fair health: 18.0% (19th highest)
> Physically unhealthy days per month: 3.6 (17th lowest)
[in-text-ad]

19. New York
> Adults who don’t exercise: 23.4%
> Pop. with access to places for physical activity: 93.2% (6th highest)
> Adult obesity rate: 26.4% (6th lowest)
> Adults with diabetes: 10.1% (23rd lowest — tied)
> Adults reporting poor or fair health: 16.3% (22nd lowest)
> Physically unhealthy days per month: 3.6 (15th lowest)
[recirclink id=938898]

18. Rhode Island
> Adults who don’t exercise: 23.5%
> Pop. with access to places for physical activity: 94.9% (2nd highest)
> Adult obesity rate: 28.5% (15th lowest)
> Adults with diabetes: 10.1% (23rd lowest — tied)
> Adults reporting poor or fair health: 16.5% (25th lowest)
> Physically unhealthy days per month: 3.9 (23rd highest)

17. Kansas
> Adults who don’t exercise: 23.9%
> Pop. with access to places for physical activity: 80.1% (22nd lowest)
> Adult obesity rate: 33.0% (15th highest)
> Adults with diabetes: 10.5% (22nd highest — tied)
> Adults reporting poor or fair health: 16.3% (24th lowest)
> Physically unhealthy days per month: 3.6 (18th lowest)
[in-text-ad-2]

16. Missouri
> Adults who don’t exercise: 25.5%
> Pop. with access to places for physical activity: 76.7% (19th lowest)
> Adult obesity rate: 32.5% (16th highest)
> Adults with diabetes: 11.4% (15th highest)
> Adults reporting poor or fair health: 19.5% (11th highest)
> Physically unhealthy days per month: 4.2 (12th highest)

15. Florida
> Adults who don’t exercise: 25.8%
> Pop. with access to places for physical activity: 88.7% (13th highest)
> Adult obesity rate: 27.2% (12th lowest)
> Adults with diabetes: 10.8% (20th highest)
> Adults reporting poor or fair health: 19.5% (10th highest)
> Physically unhealthy days per month: 4 (18th highest)
[in-text-ad]

14. South Carolina
> Adults who don’t exercise: 26.0%
> Pop. with access to places for physical activity: 68.3% (5th lowest)
> Adult obesity rate: 34.0% (9th highest)
> Adults with diabetes: 13.3% (5th highest)
> Adults reporting poor or fair health: 17.8% (20th highest)
> Physically unhealthy days per month: 4 (19th highest)
[recirclink id=945348]

13. Ohio
> Adults who don’t exercise: 26.1%
> Pop. with access to places for physical activity: 83.9% (24th highest)
> Adult obesity rate: 33.5% (12th highest)
> Adults with diabetes: 12.2% (10th highest)
> Adults reporting poor or fair health: 17.8% (21st highest)
> Physically unhealthy days per month: 4.1 (16th highest)

12. Georgia
> Adults who don’t exercise: 26.4%
> Pop. with access to places for physical activity: 75.5% (16th lowest)
> Adult obesity rate: 32.3% (20th highest — tied)
> Adults with diabetes: 12.0% (12th highest)
> Adults reporting poor or fair health: 18.4% (15th highest)
> Physically unhealthy days per month: 3.9 (22nd highest)
[in-text-ad-2]

11. New Jersey
> Adults who don’t exercise: 26.6%
> Pop. with access to places for physical activity: 94.7% (3rd highest)
> Adult obesity rate: 27.0% (7th lowest — tied)
> Adults with diabetes: 9.9% (19th lowest — tied)
> Adults reporting poor or fair health: 15.5% (19th lowest)
> Physically unhealthy days per month: 3.7 (23rd lowest)

10. Indiana
> Adults who don’t exercise: 26.7%
> Pop. with access to places for physical activity: 75.2% (15th lowest)
> Adult obesity rate: 33.9% (10th highest — tied)
> Adults with diabetes: 12.1% (11th highest)
> Adults reporting poor or fair health: 18.2% (17th highest)
> Physically unhealthy days per month: 4 (21st highest)
[in-text-ad]

9. Tennessee
> Adults who don’t exercise: 27.2%
> Pop. with access to places for physical activity: 70.2% (7th lowest)
> Adult obesity rate: 33.3% (14th highest)
> Adults with diabetes: 12.5% (8th highest)
> Adults reporting poor or fair health: 21.2% (7th highest)
> Physically unhealthy days per month: 4.7 (3rd highest)
[recirclink id=952318]

8. Delaware
> Adults who don’t exercise: 27.3%
> Pop. with access to places for physical activity: 86.5% (17th highest)
> Adult obesity rate: 32.4% (17th highest — tied)
> Adults with diabetes: 11.8% (13th highest)
> Adults reporting poor or fair health: 16.3% (23rd lowest)
> Physically unhealthy days per month: 3.7 (22nd lowest)

7. Oklahoma
> Adults who don’t exercise: 27.8%
> Pop. with access to places for physical activity: 71.3% (9th lowest)
> Adult obesity rate: 34.5% (7th highest)
> Adults with diabetes: 12.3% (9th highest)
> Adults reporting poor or fair health: 20.9% (8th highest)
> Physically unhealthy days per month: 4.5 (6th highest)
[in-text-ad-2]

6. Louisiana
> Adults who don’t exercise: 28.0%
> Pop. with access to places for physical activity: 75.0% (13th lowest)
> Adult obesity rate: 36.3% (3rd highest)
> Adults with diabetes: 13.0% (6th highest)
> Adults reporting poor or fair health: 21.4% (5th highest)
> Physically unhealthy days per month: 4.3 (9th highest)

5. West Virginia
> Adults who don’t exercise: 28.0%
> Pop. with access to places for physical activity: 59.4% (2nd lowest)
> Adult obesity rate: 37.8% (2nd highest)
> Adults with diabetes: 15.1% (the highest)
> Adults reporting poor or fair health: 23.6% (the highest)
> Physically unhealthy days per month: 5.3 (the highest)
[in-text-ad]

4. Kentucky
> Adults who don’t exercise: 28.7%
> Pop. with access to places for physical activity: 71.1% (8th lowest)
> Adult obesity rate: 34.6% (6th highest)
> Adults with diabetes: 12.7% (7th highest)
> Adults reporting poor or fair health: 21.8% (4th highest)
> Physically unhealthy days per month: 4.6 (5th highest)
[recirclink id=964573]

3. Alabama
> Adults who don’t exercise: 29.3%
> Pop. with access to places for physical activity: 61.1% (3rd lowest)
> Adult obesity rate: 36.1% (4th highest)
> Adults with diabetes: 14.5% (3rd highest)
> Adults reporting poor or fair health: 21.4% (6th highest)
> Physically unhealthy days per month: 4.4 (8th highest)

2. Mississippi
> Adults who don’t exercise: 30.4%
> Pop. with access to places for physical activity: 54.5% (the lowest)
> Adult obesity rate: 39.1% (the highest)
> Adults with diabetes: 14.6% (2nd highest)
> Adults reporting poor or fair health: 22.1% (3rd highest)
> Physically unhealthy days per month: 4.5 (7th highest)
[in-text-ad-2]

1. Arkansas
> Adults who don’t exercise: 30.4%
> Pop. with access to places for physical activity: 63.5% (4th lowest)
> Adult obesity rate: 35.0% (5th highest)
> Adults with diabetes: 13.5% (4th highest)
> Adults reporting poor or fair health: 23.3% (2nd highest)
> Physically unhealthy days per month: 4.8 (2nd highest)
Methodology
To determine America’s laziest states, 24/7 Tempo reviewed adult physical inactivity rates from the Robert Wood Johnson Foundation and the University of Wisconsin Population Health Institute joint program’s 2021 County Health Rankings & Roadmaps report.
The physical inactivity rate is defined as the share of adults 20 years and older who report no leisure-time physical activity. While the CHR report is from 2021, physical inactivity figures published in the report are from 2017.
States were ranked based on the adult physical inactivity rate. Additional information on the share of the population with adequate access to locations for physical activity, the share of adults 20 years and older who report a body mass index of 30 kg/m2 or higher (considered obese), the share of adults 20 years and older with diagnosed diabetes, the share of adults reporting poor or fair health, and the average number of physically unhealthy days reported in the past 30 days also came from the 2021 CHR.
Contact [email protected] for any questions or corrections.