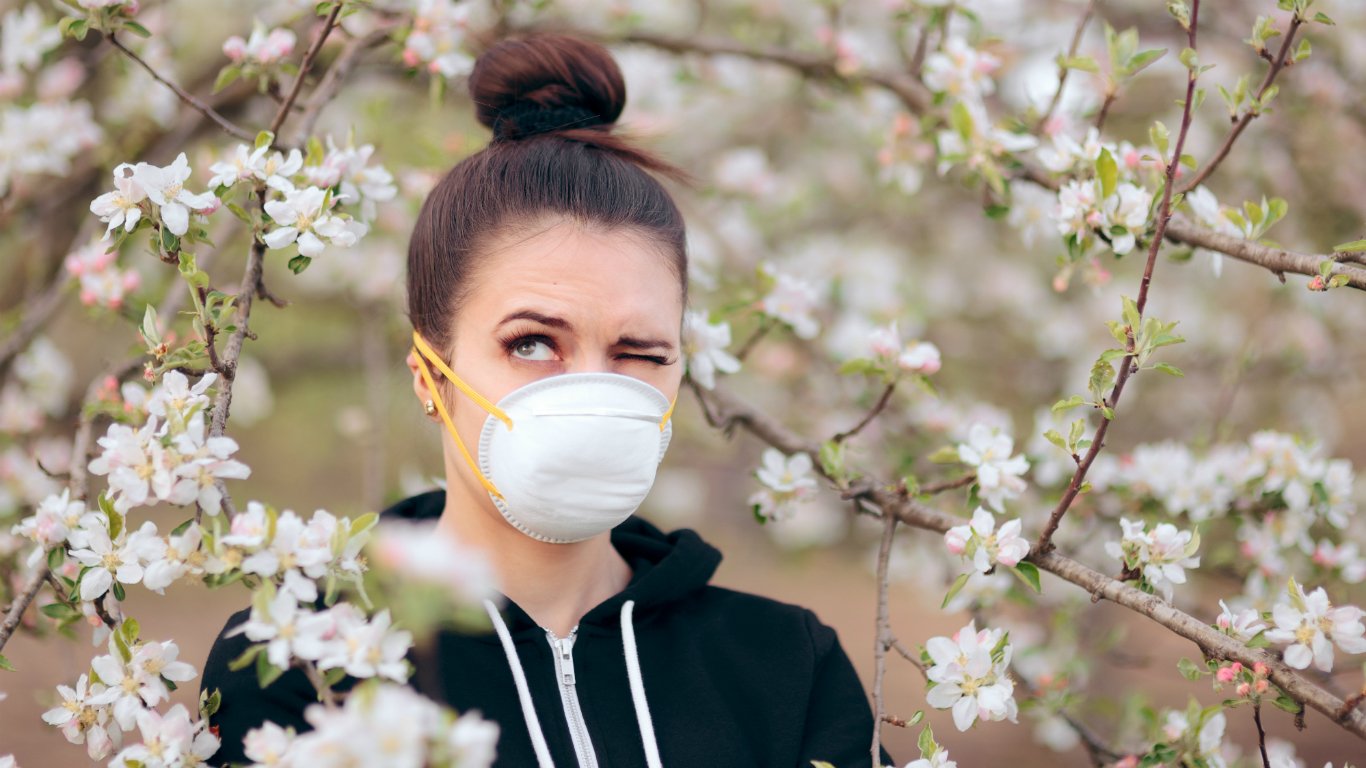
Most of us have experienced the symptoms. The sneezing, stuffy or runny nose, watery eyes, and persistent itchiness caused by seasonal allergies.
While most people can be thankful that they’ve been spared serious and potentially fatal allergic reactions to certain foods, drugs, or insect stings, allergies caused by the life cycles of plants and mold generate plenty of misery on their own for people worldwide.
One of the most common allergic reactions is allergic rhinitis, commonly known as hay fever. More than 24 million Americans suffer each year from inflammations caused by pollen from trees, grasses, and weeds that waft through the air during various seasons. Children are particularly susceptible, and for those with asthma, hay fever can keep them indoors during peak allergy season.(These are health problems that are more common in the fall and winter.)
Trees begin spewing pollen in the spring and, in some cases, well into summer. Fall allergy season is the domain of weeds that begin their annual bombardment in September and attack allergy sufferers until the weather drifts into winter. The most common and source of fall allergies is ragweed — a term used to describe a broad category of flowering plants native to tropical and subtropical regions of the Western Hemisphere. (They’ve become invasive species in other parts of the world.)
Click here to see the worst cities for fall allergies
Climate change makes the effects of allergens even worse: Pollen from ragweed and other grasses increases as global warming ramps up CO2 levels in the atmosphere, so allergists track temperature rises. (These are the cities emitting the most carbon dioxide in the world.)
To identify the worst cities for those who have fall allergies, 24/7 Wall St. reviewed the Asthma and Allergy Foundation of America’s 2021 Allergy Capitals report, which analyzed data for 2020 from the 100 largest metropolitan statistical areas in the 48 contiguous states. The factors considered for each MSA were seasonal pollen counts for both spring and fall, use of over-the-counter allergy medications, and number of allergy specialists. (Population statistics are 1-year estimates from the U.S. Census Bureau’s 2019 American Community Survey.).
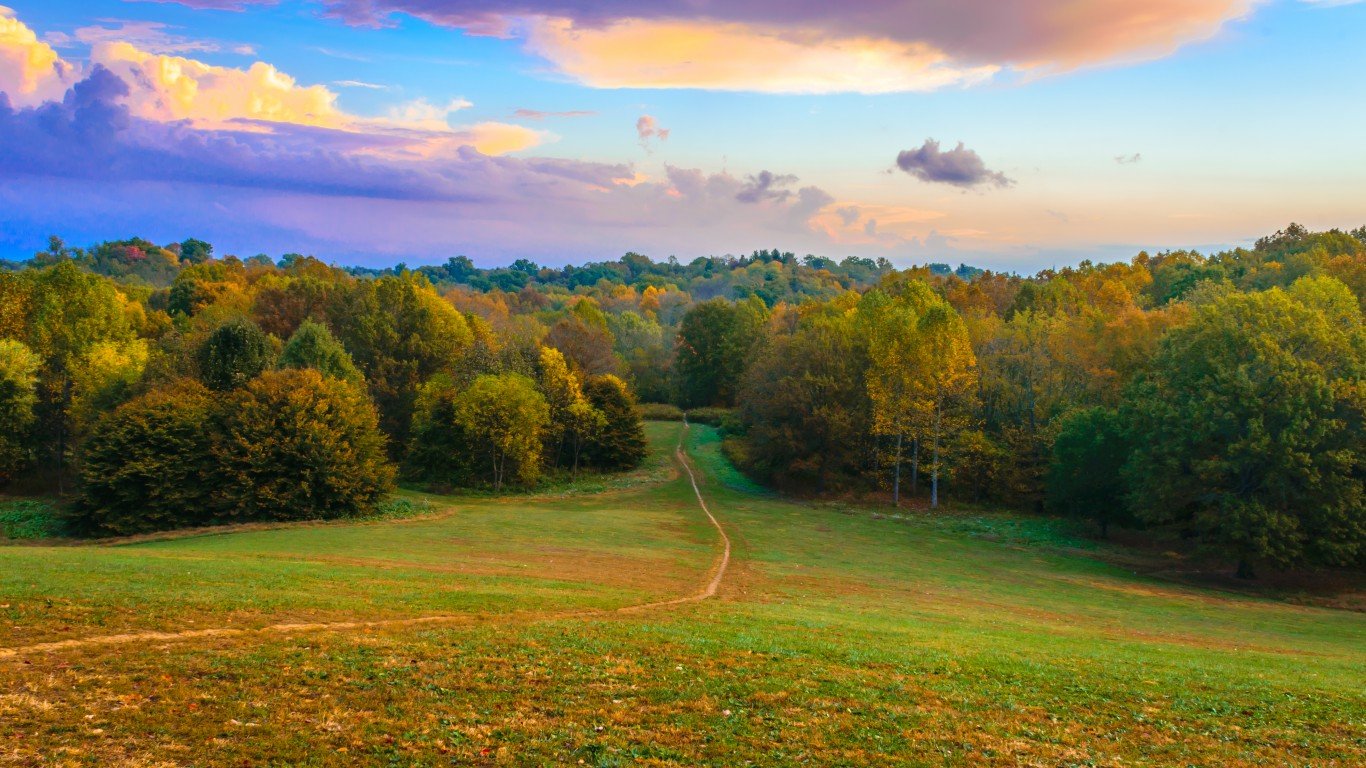
20. Louisville, Kentucky
> Population: 1,266,389
> Average fall temperature increase since 1970: 2.7°F
[in-text-ad]
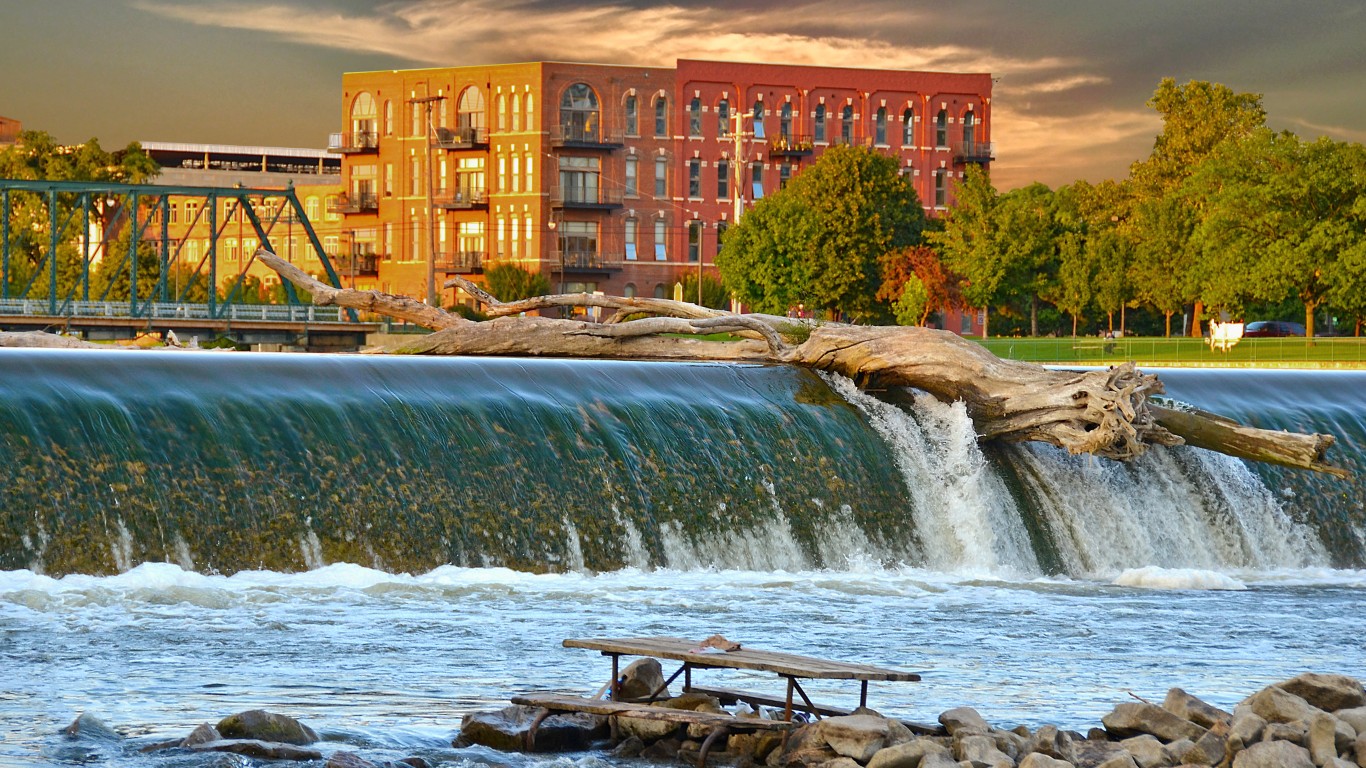
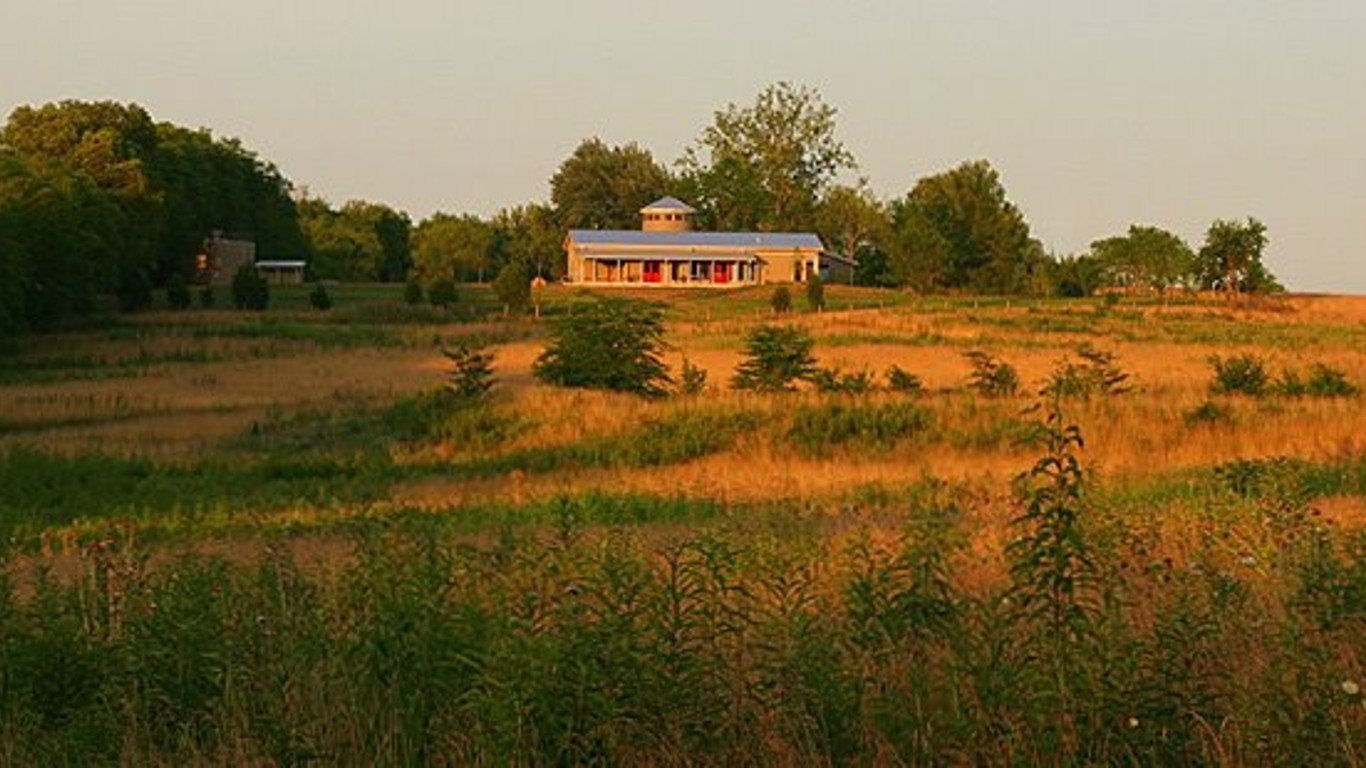
19. Grand Rapids, Michigan
> Population: 1,077,370
> Average fall temperature increase since 1970: Not available
[recirclink id=951928]
18. Memphis, Tennessee
> Population: 1,344,910
> Average fall temperature increase since 1970: 1.8°F
17. Syracuse, New York
> Population: 648,593
> Average fall temperature increase since 1970: Not available
[in-text-ad-2]
16. Riverside, California
> Population: 4,650,631
> Average fall temperature increase since 1970: 5.4°F
15. Virginia Beach, Virginia
> Population: 1,765,031
> Average fall temperature increase since 1970: 1.1°F
[in-text-ad]
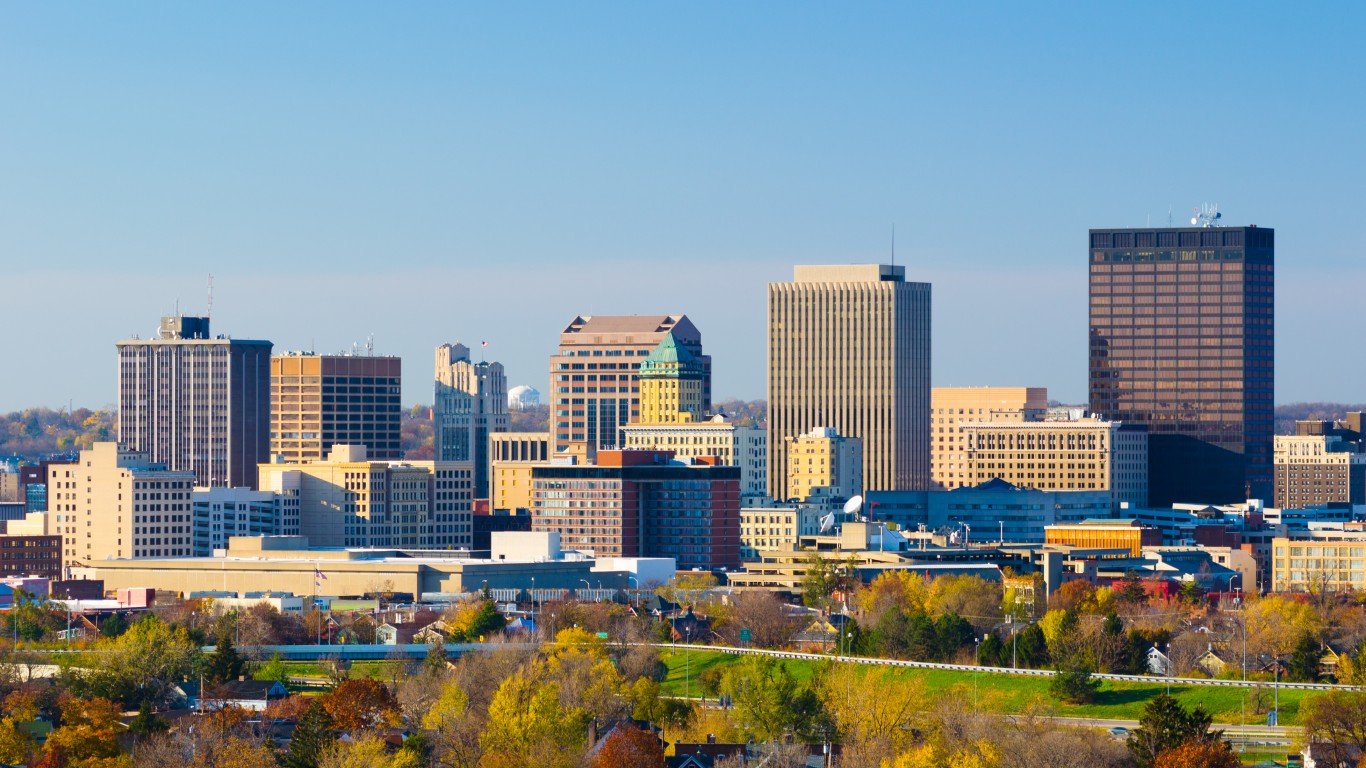
14. Dayton, Ohio
> Population: 807,611
> Average fall temperature increase since 1970: 1.5°F
[recirclink id=838810]
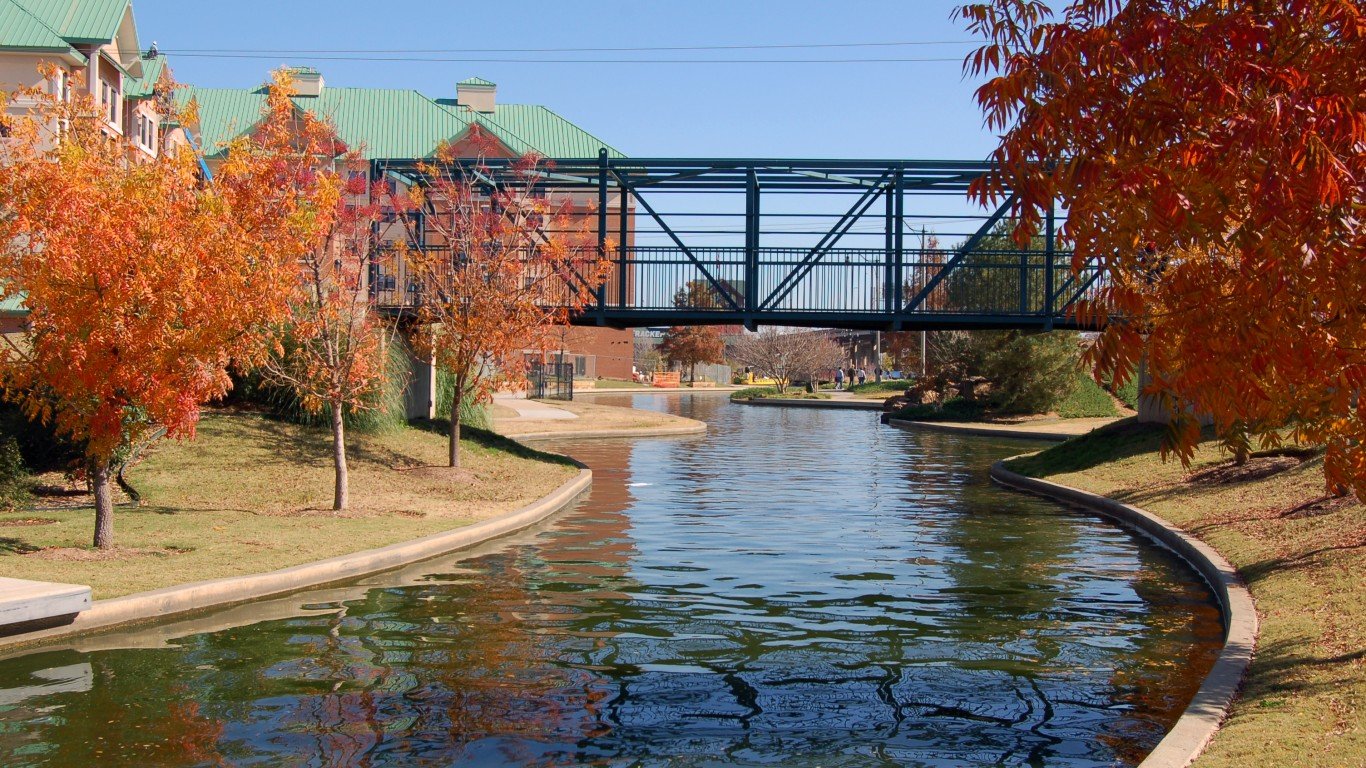
13. Oklahoma City, Oklahoma
> Population: 1,408,950
> Average fall temperature increase since 1970: 1.6°F
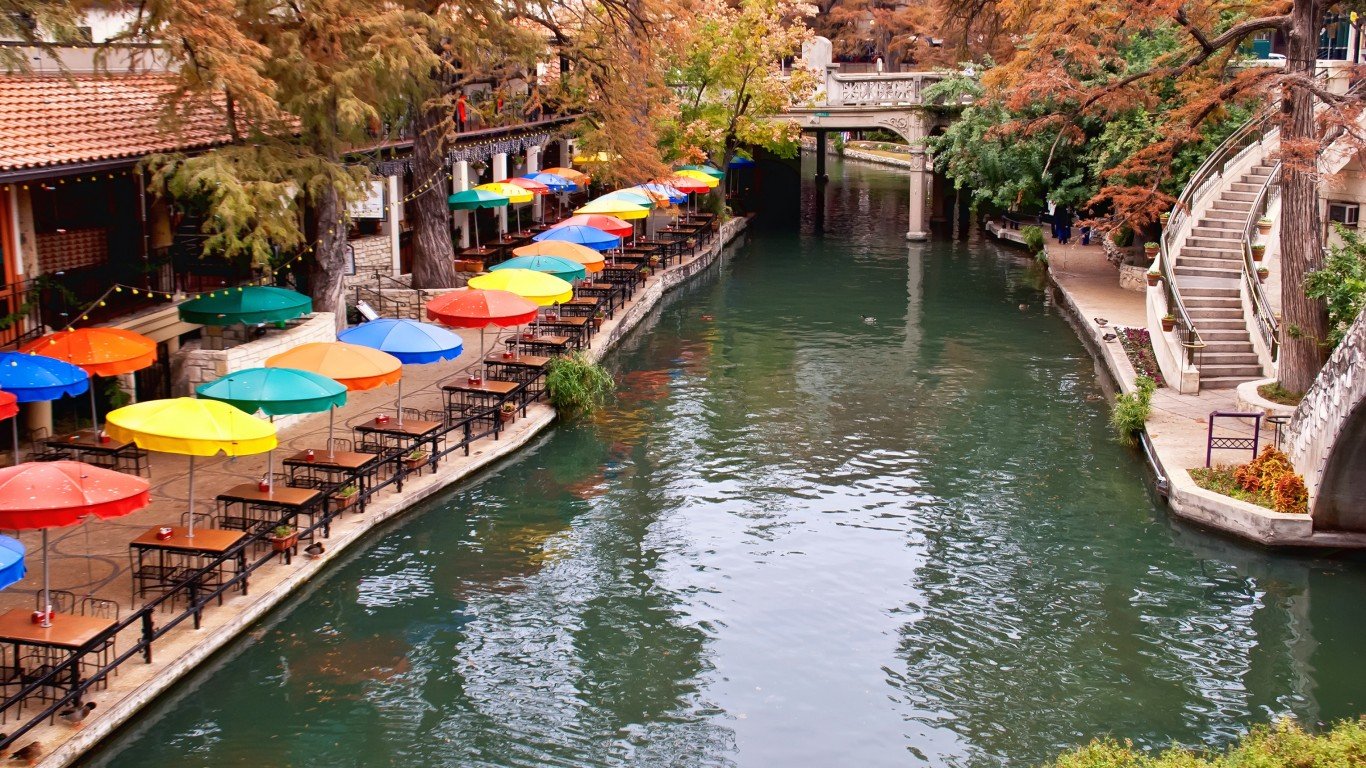
12. San Antonio, Texas
> Population: 2,550,960
> Average fall temperature increase since 1970: 2.7°F
[in-text-ad-2]
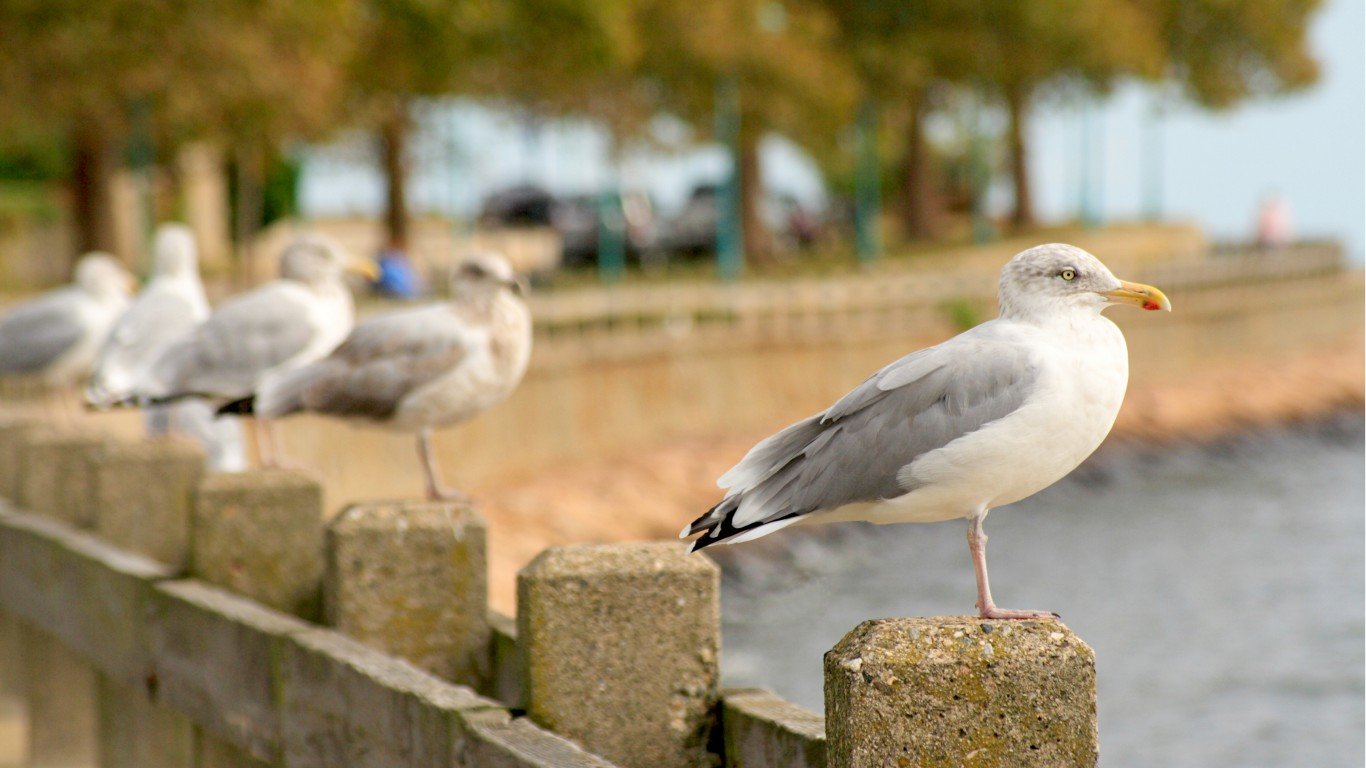
11. Bridgeport, Connecticut
> Population: 943,332
> Average fall temperature increase since 1970: 1.9°F
10. Albany, New York
> Population: 880,381
> Average fall temperature increase since 1970: 3°F
[in-text-ad]
9. New Haven, Connecticut
> Population: 854,757
> Average fall temperature increase since 1970: 1.9°F
[recirclink id=827400]
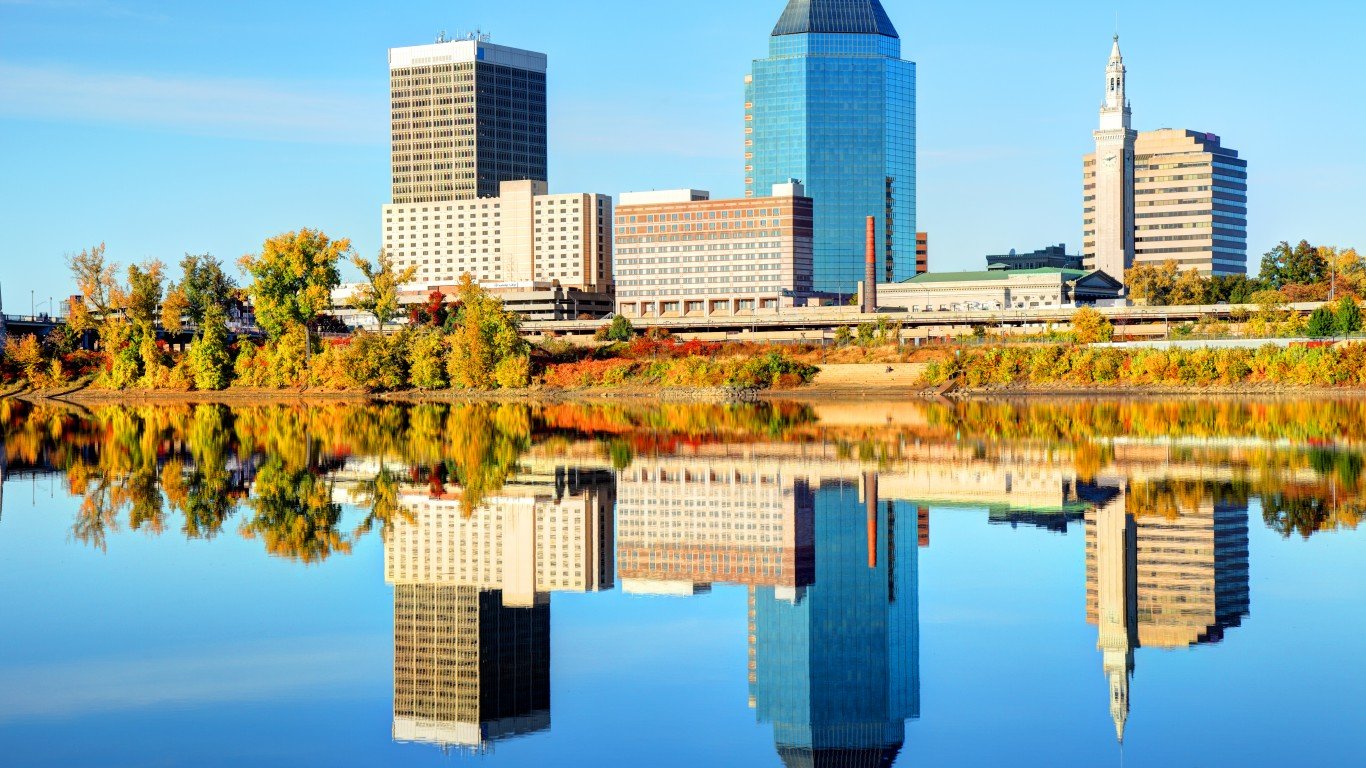
8. Springfield, Massachusetts
> Population: 697,382
> Average fall temperature increase since 1970: 2.3°F
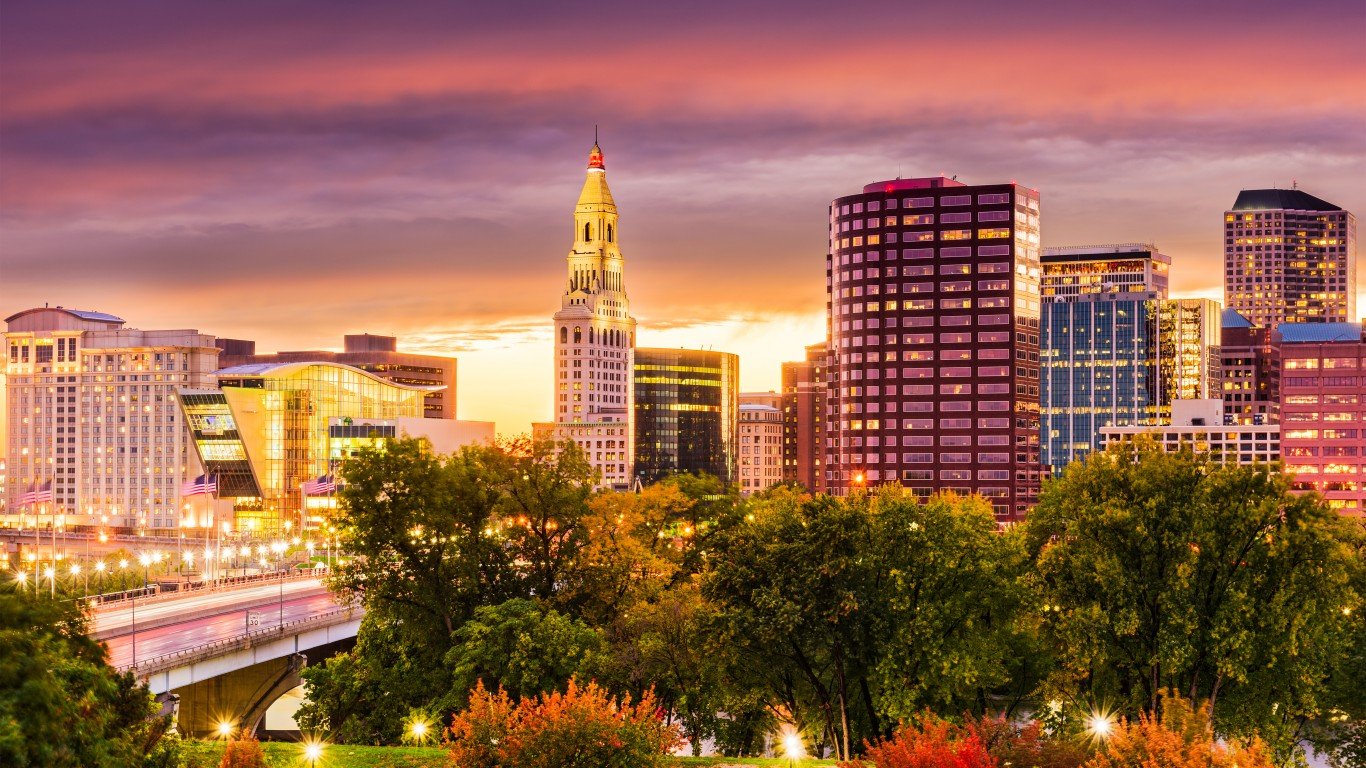
7. Hartford, Connecticut
> Population: 1,204,877
> Average fall temperature increase since 1970: 2.3°F
[in-text-ad-2]
6. Buffalo, New York
> Population: 1,127,983
> Average fall temperature increase since 1970: 2.3°F
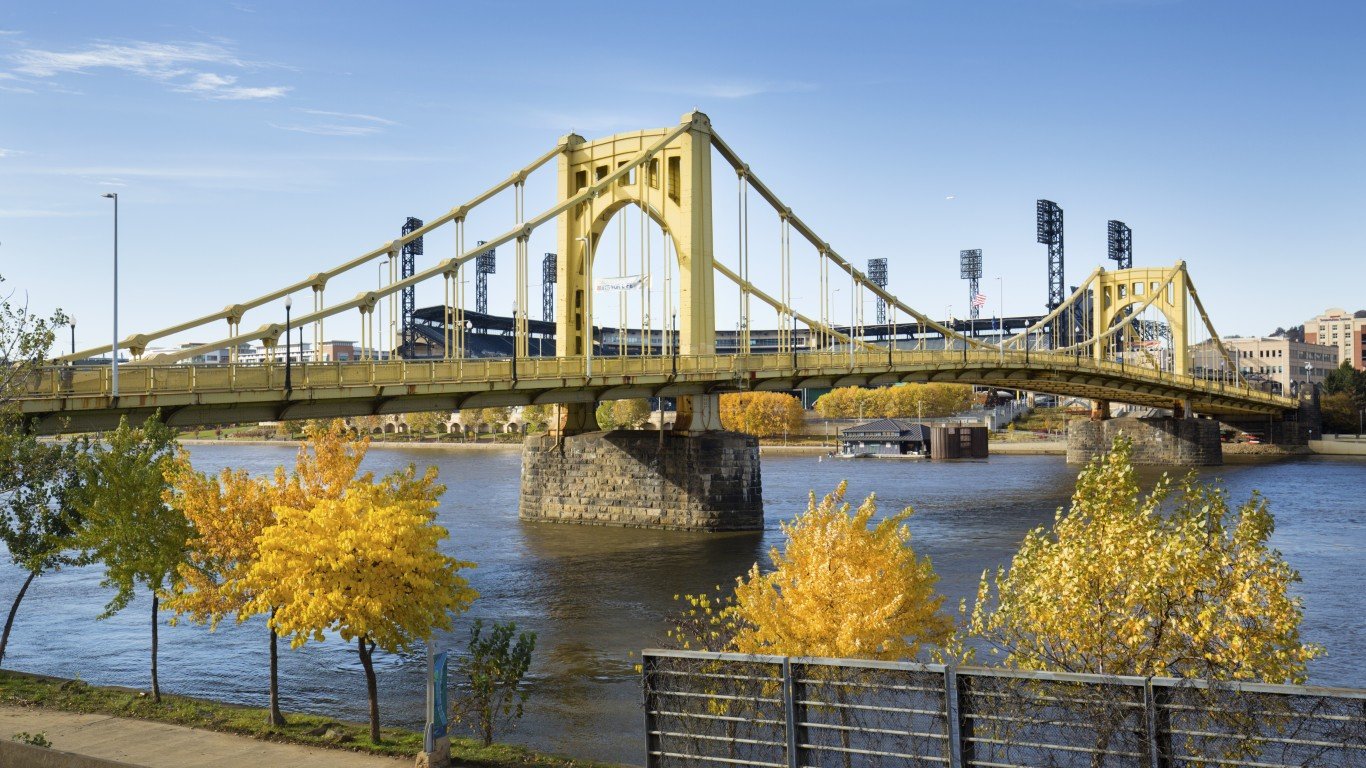
5. Pittsburgh, Pennsylvania
> Population: 2,317,600
> Average fall temperature increase since 1970: 2.0°F
[in-text-ad]
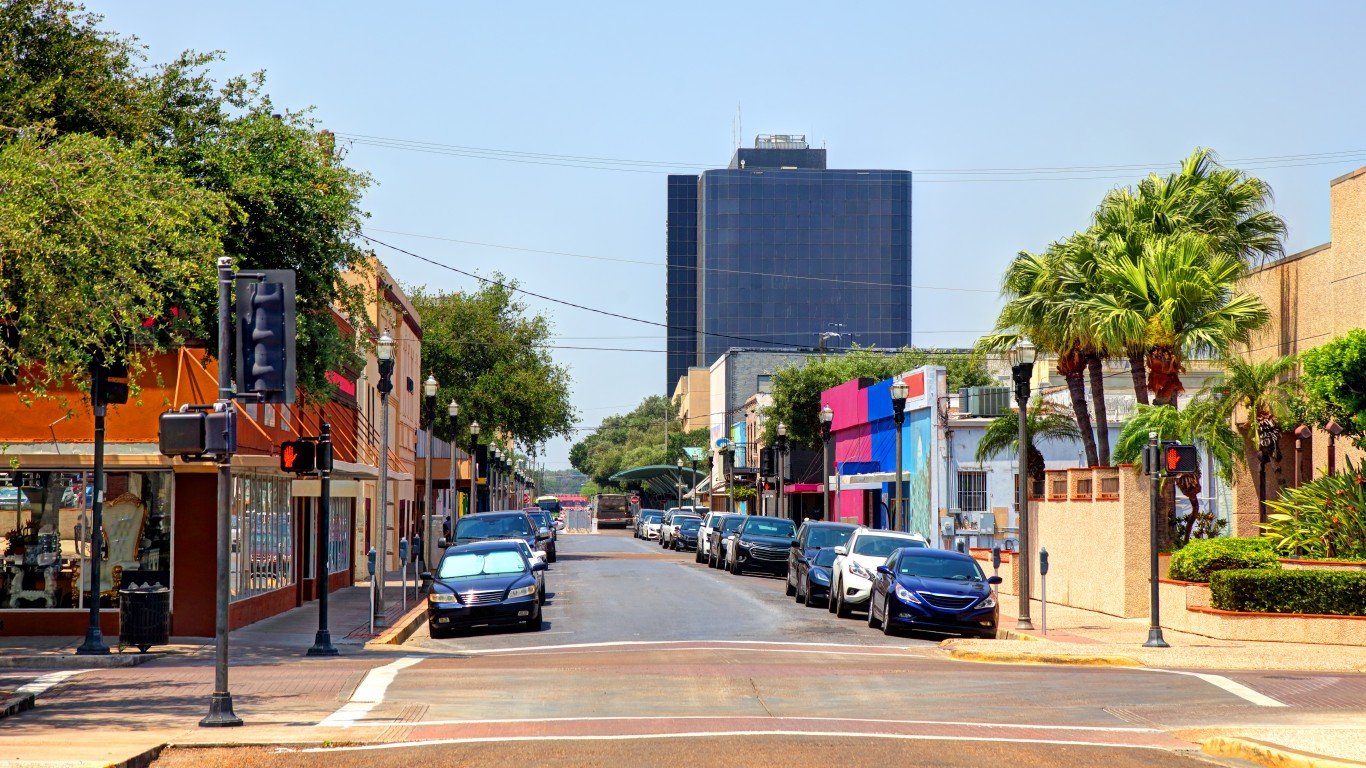
4. McAllen, Texas
> Population: 868,707
> Average fall temperature increase since 1970: 3.7°F
[recirclink id=965171]
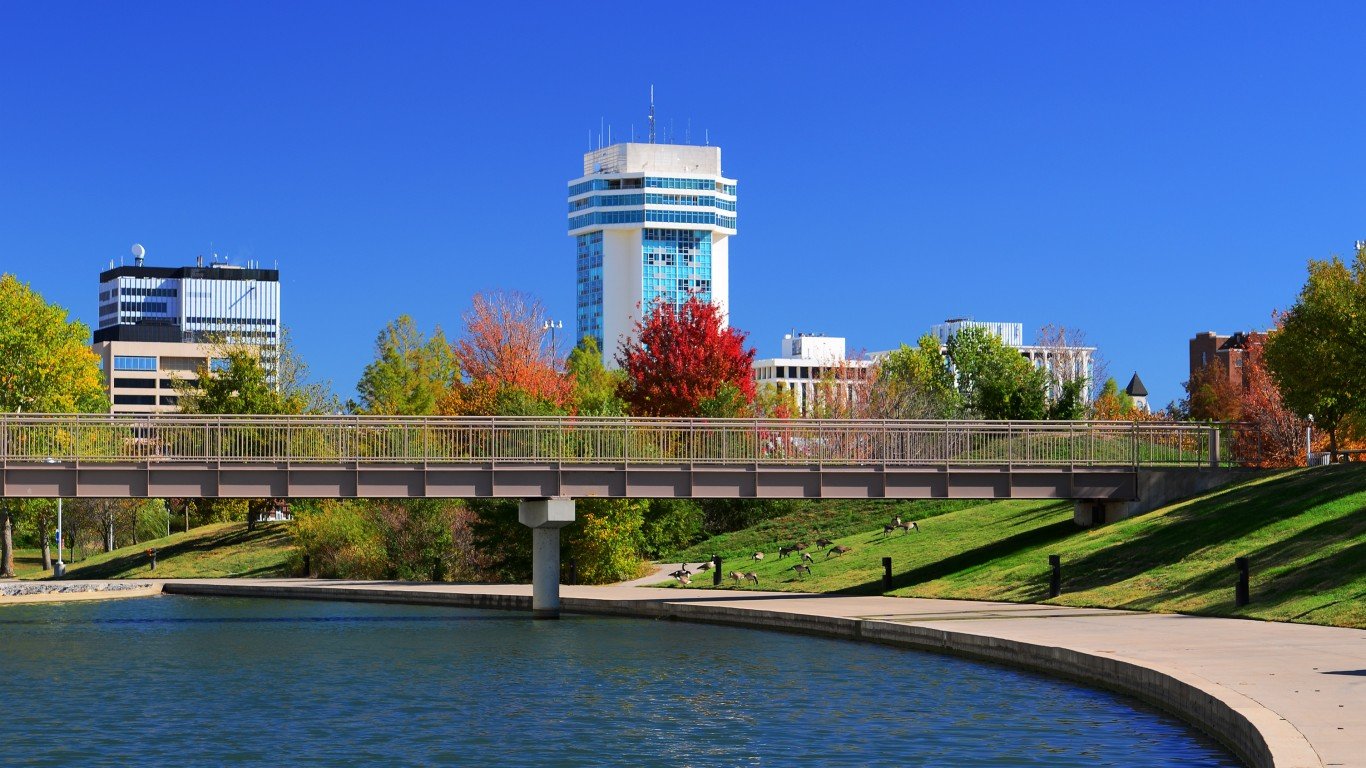
3. Wichita, Kansas
> Population: 640,218
> Average fall temperature increase since 1970: 2.8°F
2. Richmond, Virginia
> Population: 1,290,866
> Average fall temperature increase since 1970: 1.9°F
[in-text-ad-2]
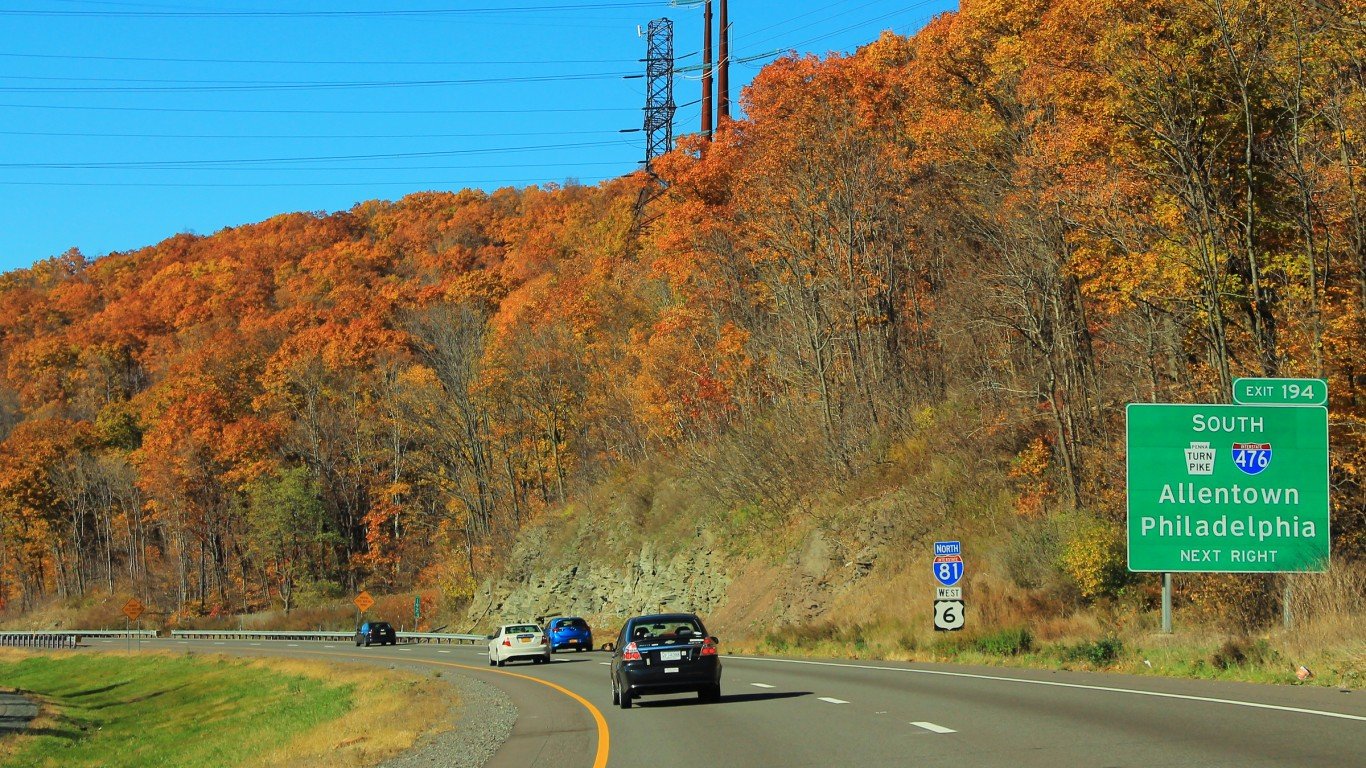
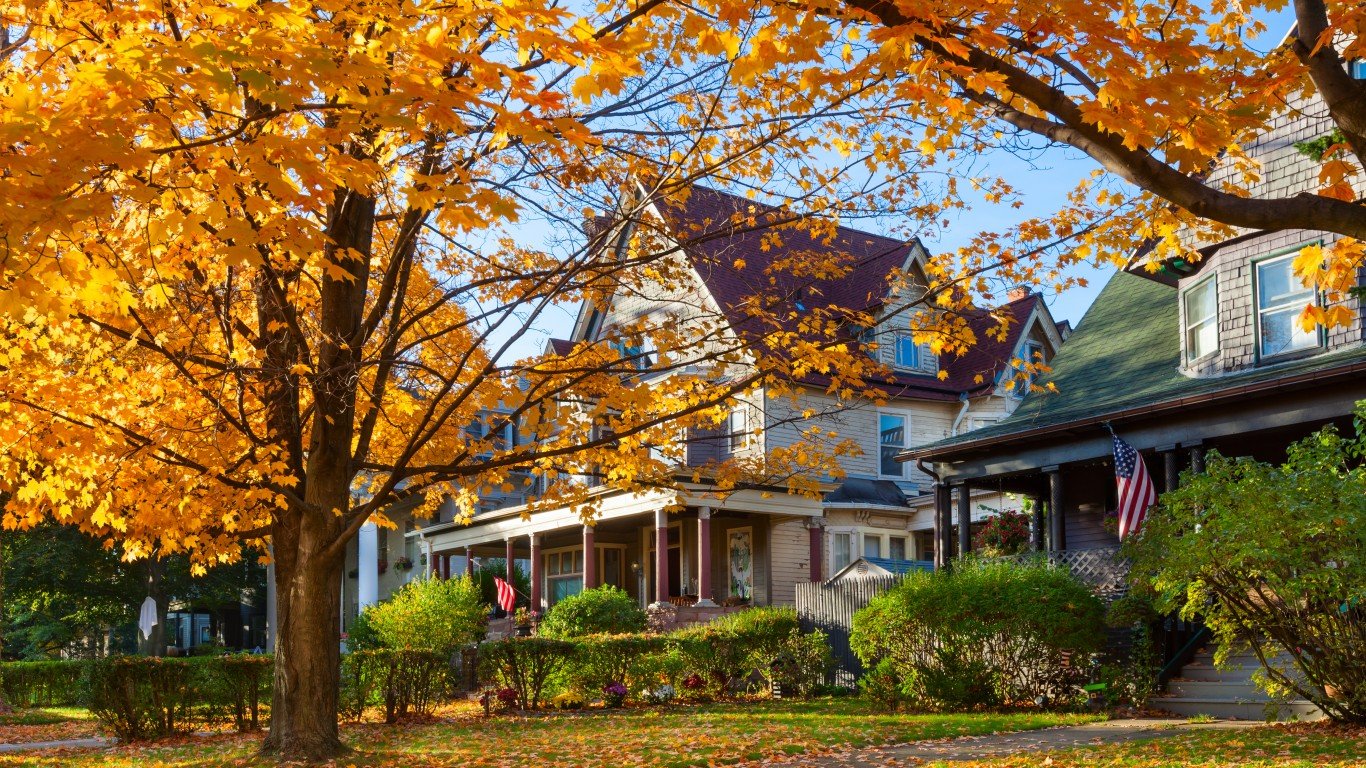
1. Scranton, Pennsylvania
> Population: 553,885
> Average fall temperature increase since 1970: 2.6°F
Contact [email protected] for any questions or corrections.