
Each year, alcohol misuse is directly linked to diseases and accidents that kill an estimated 95,000 Americans. Excessive drinking also costs the economy hundreds of billions of dollars annually, mostly in lost productivity.
Excessive drinking — along with tobacco use, not enough exercise, and poor nutrition — is one of four main risk factors for preventable disease identified by the CDC. In addition to short-term consequences, such as impaired judgement and motor skills, excessive alcohol consumption is associated with liver disease, certain cancers, increased risk of a heart attack or stroke, and poor mental health. Here is a look at 23 ways a drinking habit can harm you.
Still, each day, millions of American adults enjoy alcohol responsibly. Moderate drinking — defined as two standard drinks per day for men and one standard drink for women — carries relatively little risk, and may even have some health benefits.
Using data from County Health Rankings & Roadmaps, a joint program between the Robert Wood Johnson Foundation and the University of Wisconsin Population Health Institute, 24/7 Tempo identified the county or county equivalent with the lowest excessive drinking rate in each state.
Excessive drinking can be either binge drinking or heavy drinking. CHR defines binge drinking as consumption of more than four drinks for women and more than five drinks for men in a single occasion. Heavy drinking is defined as more than one drink a day on average for women and more than two drinks a day for men.
Though each of the counties on this list has the lowest excessive drinking rate in its respective state, the share of adults who report excessive drinking in these areas varies considerably — from as low as 6.5% to over 23%. Nationwide, the excessive drinking rate is 19.2%
It is important to note that alcohol affects everyone differently, and as a general rule, drinking less is better than drinking more. Additionally, the vast majority of Americans who drink excessively — about 90% of them — do not have a severe alcohol use disorder, a chronic disease commonly referred to as alcoholism.
Click here to see the least drunk county in every state
Click here to see our detailed methodology

Alabama: Greene County
> Adults binge or heavy drinking: 10.4% (Alabama: 14.9%)
> Driving deaths involving alcohol: 31.8% (Alabama: 26.9%)
> Median household income: $24,145 (Alabama: $50,536)
> Adults reporting poor or fair health: 34.5% (Alabama: 21.4%)
[in-text-ad]

Alaska: Aleutians East Borough
> Adults binge or heavy drinking: 14.9% (Alaska: 17.6%)
> Driving deaths involving alcohol: N/A (Alaska: 37.9%)
> Median household income: $69,250 (Alaska: $77,640)
> Adults reporting poor or fair health: 20.9% (Alaska: 15.6%)
[recirclink id=885553]

Arizona: Apache County
> Adults binge or heavy drinking: 15.2% (Arizona: 18.1%)
> Driving deaths involving alcohol: 33.5% (Arizona: 24.7%)
> Median household income: $32,508 (Arizona: $58,945)
> Adults reporting poor or fair health: 31.2% (Arizona: 18.6%)

Arkansas: Phillips County
> Adults binge or heavy drinking: 12.4% (Arkansas: 17.3%)
> Driving deaths involving alcohol: 15.8% (Arkansas: 26.2%)
> Median household income: $29,320 (Arkansas: $47,597)
> Adults reporting poor or fair health: 33.3% (Arkansas: 23.3%)
[in-text-ad-2]

California: Santa Clara County
> Adults binge or heavy drinking: 16.9% (California: 18.1%)
> Driving deaths involving alcohol: 26.2% (California: 28.7%)
> Median household income: $124,055 (California: $75,235)
> Adults reporting poor or fair health: 14.3% (California: 17.6%)

Colorado: Costilla County
> Adults binge or heavy drinking: 15.9% (Colorado: 21.3%)
> Driving deaths involving alcohol: 12.5% (Colorado: 33.7%)
> Median household income: $30,965 (Colorado: $72,331)
> Adults reporting poor or fair health: 27.4% (Colorado: 13.8%)
[in-text-ad]
Connecticut: Windham County
> Adults binge or heavy drinking: 18.7% (Connecticut: 20.5%)
> Driving deaths involving alcohol: 25.0% (Connecticut: 31.5%)
> Median household income: $66,550 (Connecticut: $78,444)
> Adults reporting poor or fair health: 15.5% (Connecticut: 13.0%)
[recirclink id=935217]

Delaware: New Castle County
> Adults binge or heavy drinking: 19.2% (Delaware: 19.8%)
> Driving deaths involving alcohol: 25.4% (Delaware: 26.0%)
> Median household income: $73,892 (Delaware: $68,287)
> Adults reporting poor or fair health: 16.6% (Delaware: 16.3%)
Florida: Taylor County
> Adults binge or heavy drinking: 16.2% (Florida: 19.7%)
> Driving deaths involving alcohol: 32.4% (Florida: 22.3%)
> Median household income: $40,306 (Florida: $55,660)
> Adults reporting poor or fair health: 27.8% (Florida: 19.5%)
[in-text-ad-2]
Georgia: Dougherty County
> Adults binge or heavy drinking: 12.4% (Georgia: 16.8%)
> Driving deaths involving alcohol: 5.7% (Georgia: 20.3%)
> Median household income: $39,584 (Georgia: $58,700)
> Adults reporting poor or fair health: 26.6% (Georgia: 18.4%)

Hawaii: Honolulu County
> Adults binge or heavy drinking: 21.5% (Hawaii: 23.0%)
> Driving deaths involving alcohol: 24.5% (Hawaii: 31.2%)
> Median household income: $85,857 (Hawaii: $81,275)
> Adults reporting poor or fair health: 17.0% (Hawaii: 15.4%)
[in-text-ad]
Idaho: Madison County
> Adults binge or heavy drinking: 14.1% (Idaho: 17.1%)
> Driving deaths involving alcohol: 0.0% reported (Idaho: 31.4%)
> Median household income: $39,160 (Idaho: $55,785)
> Adults reporting poor or fair health: 19.7% (Idaho: 15.1%)
[recirclink id=939663]

Illinois: Alexander County
> Adults binge or heavy drinking: 17.5% (Illinois: 21.5%)
> Driving deaths involving alcohol: 20.0% (Illinois: 31.1%)
> Median household income: $36,806 (Illinois: $65,886)
> Adults reporting poor or fair health: 26.0% (Illinois: 15.9%)

Indiana: Grant County
> Adults binge or heavy drinking: 15.4% (Indiana: 18.6%)
> Driving deaths involving alcohol: 22.9% (Indiana: 18.8%)
> Median household income: $44,356 (Indiana: $56,303)
> Adults reporting poor or fair health: 21.4% (Indiana: 18.2%)
[in-text-ad-2]
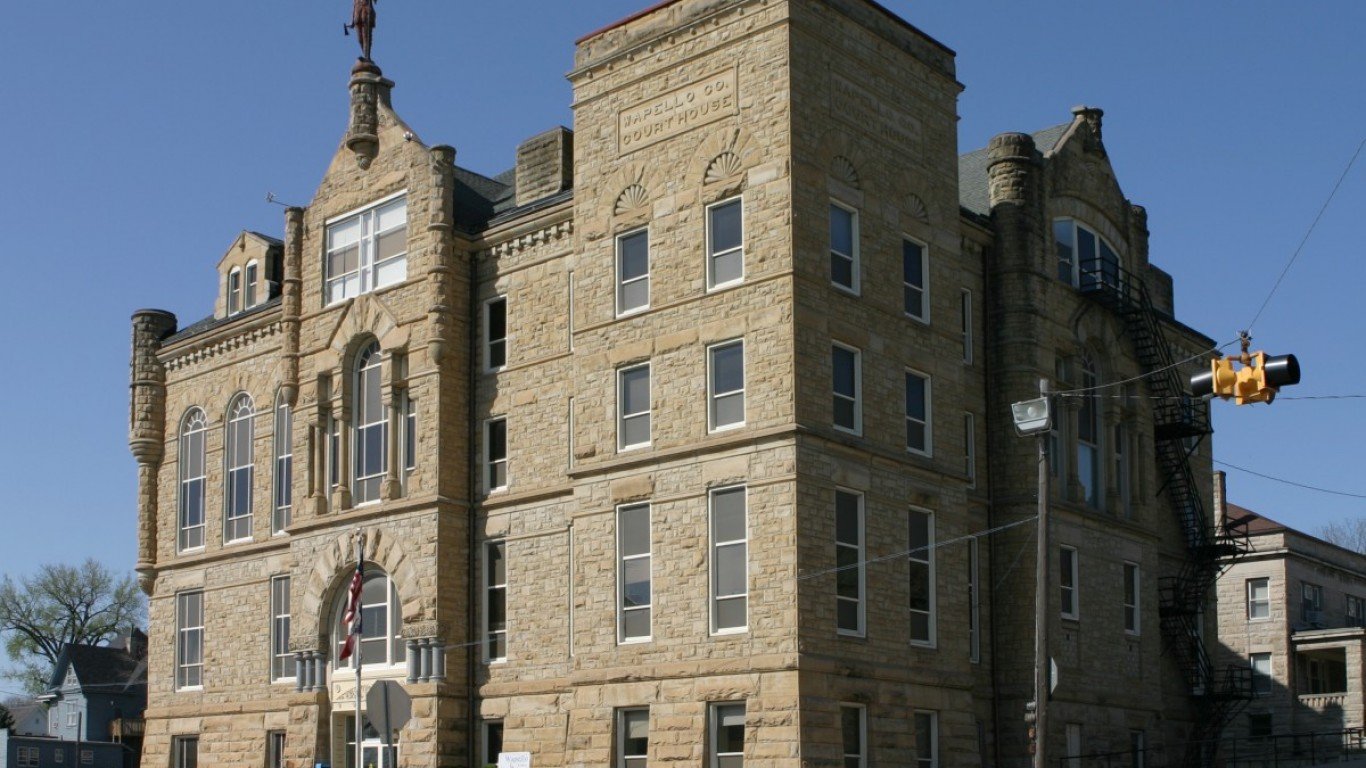
Iowa: Wapello County
> Adults binge or heavy drinking: 20.6% (Iowa: 25.8%)
> Driving deaths involving alcohol: 19.0% (Iowa: 26.8%)
> Median household income: $46,246 (Iowa: $60,523)
> Adults reporting poor or fair health: 17.2% (Iowa: 13.5%)
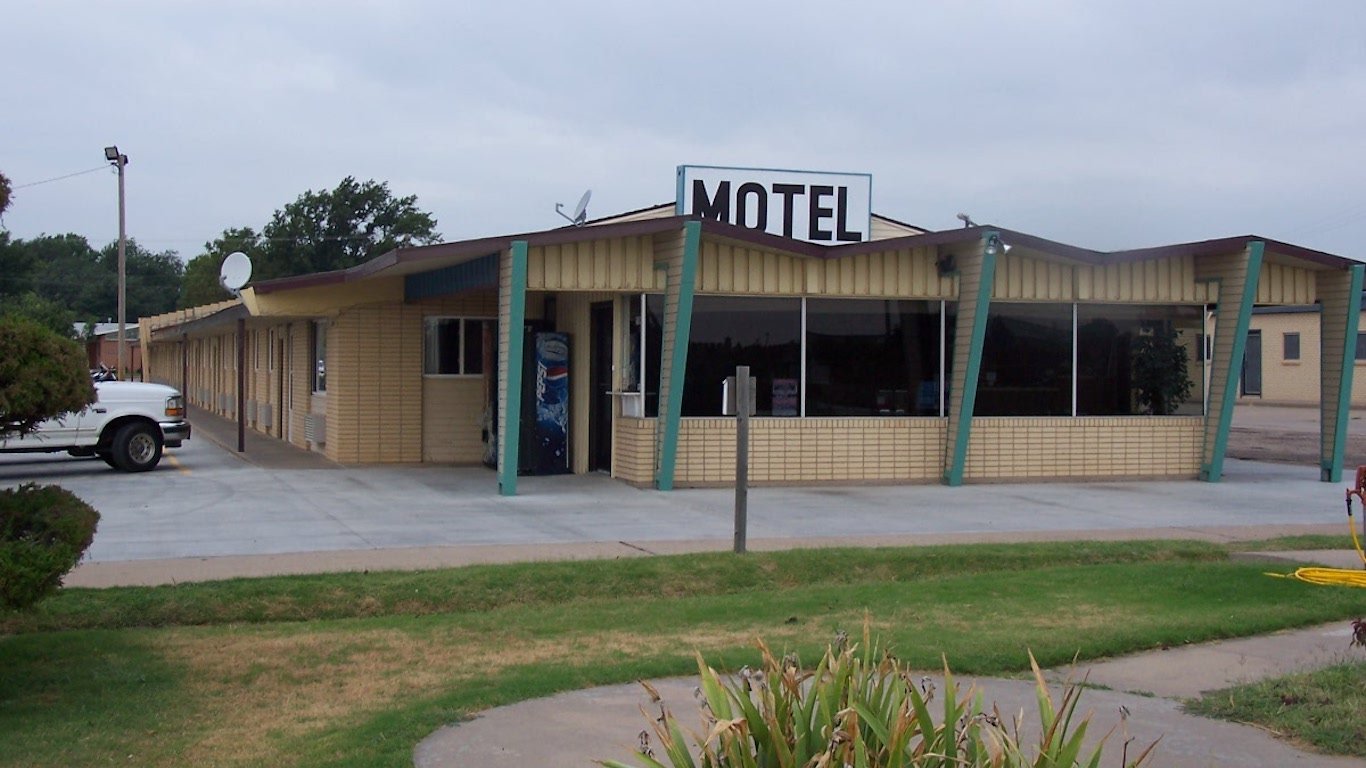
Kansas: Seward County
> Adults binge or heavy drinking: 14.9% (Kansas: 18.2%)
> Driving deaths involving alcohol: 38.1% (Kansas: 19.9%)
> Median household income: $49,291 (Kansas: $59,597)
> Adults reporting poor or fair health: 27.8% (Kansas: 16.3%)
[in-text-ad]
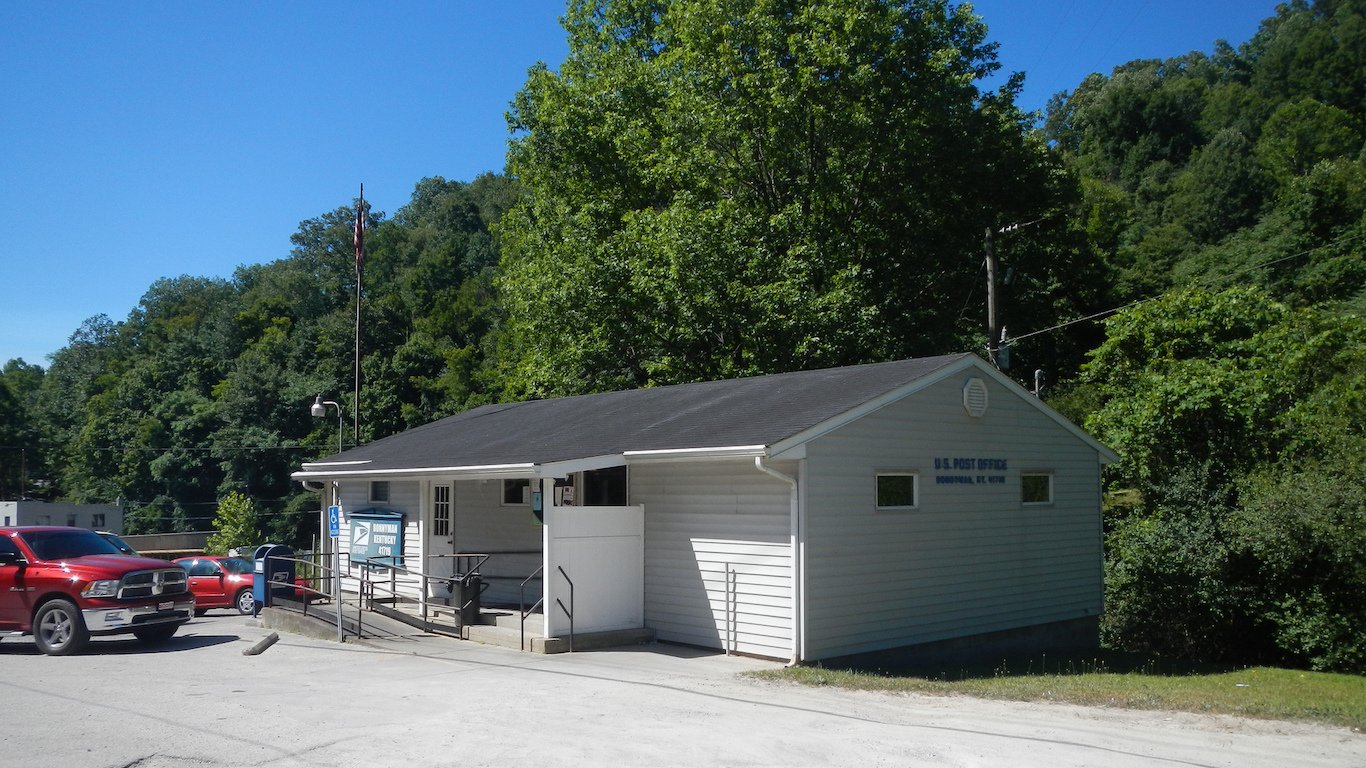
Kentucky: Perry County
> Adults binge or heavy drinking: 11.9% (Kentucky: 17.2%)
> Driving deaths involving alcohol: 37.5% (Kentucky: 25.5%)
> Median household income: $33,640 (Kentucky: $50,589)
> Adults reporting poor or fair health: 29.6% (Kentucky: 21.8%)
[recirclink id=952318]

Louisiana: East Carroll Parish
> Adults binge or heavy drinking: 14.1% (Louisiana: 19.7%)
> Driving deaths involving alcohol: 0.0% reported (Louisiana: 32.3%)
> Median household income: $22,346 (Louisiana: $49,469)
> Adults reporting poor or fair health: 40.5% (Louisiana: 21.4%)

Maine: Aroostook County
> Adults binge or heavy drinking: 16.4% (Maine: 22.0%)
> Driving deaths involving alcohol: 29.5% (Maine: 35.4%)
> Median household income: $41,123 (Maine: $57,918)
> Adults reporting poor or fair health: 21.7% (Maine: 17.1%)
[in-text-ad-2]

Maryland: Prince George’s County
> Adults binge or heavy drinking: 12.8% (Maryland: 15.4%)
> Driving deaths involving alcohol: 32.0% (Maryland: 28.8%)
> Median household income: $84,920 (Maryland: $84,805)
> Adults reporting poor or fair health: 18.0% (Maryland: 15.2%)

Massachusetts: Worcester County
> Adults binge or heavy drinking: 22.1% (Massachusetts: 23.5%)
> Driving deaths involving alcohol: 35.6% (Massachusetts: 30.2%)
> Median household income: $74,679 (Massachusetts: $81,215)
> Adults reporting poor or fair health: 14.7% (Massachusetts: 13.5%)
[in-text-ad]
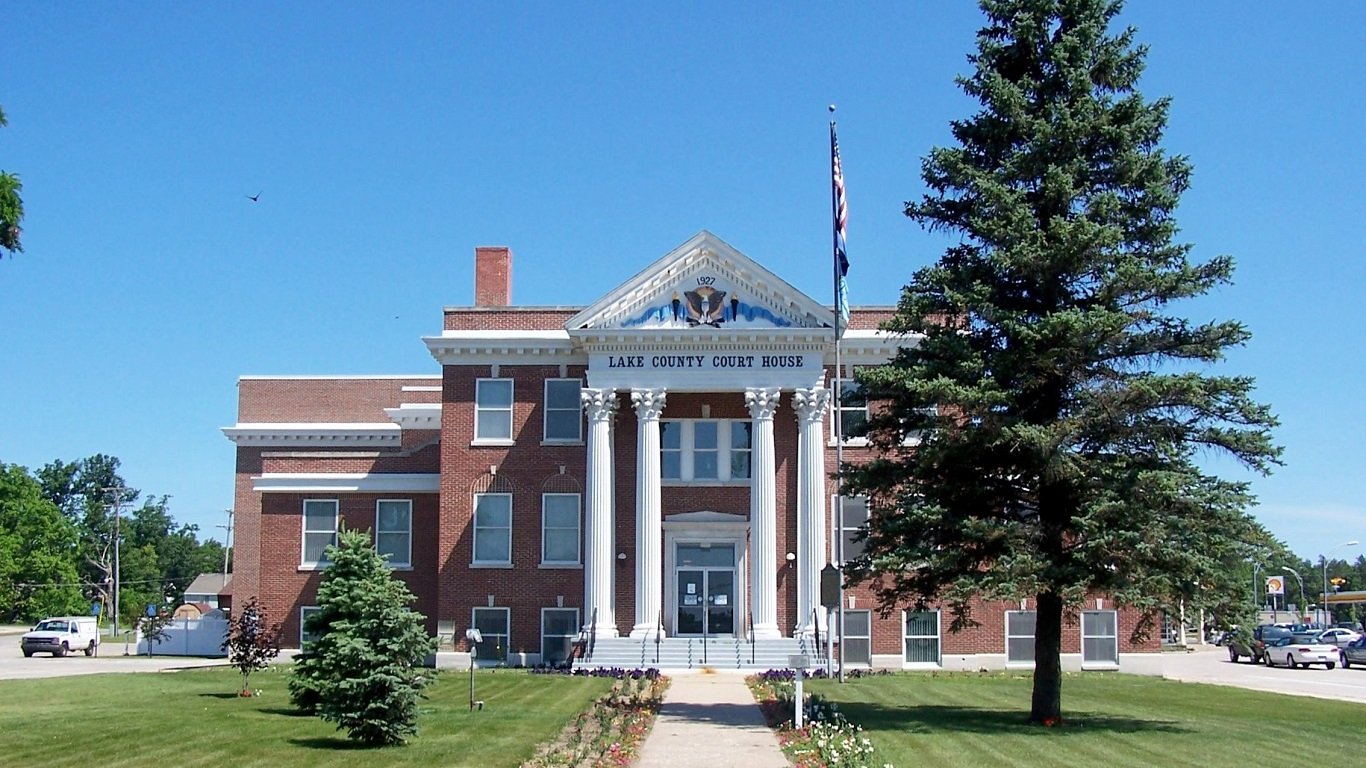
Michigan: Lake County
> Adults binge or heavy drinking: 18.5% (Michigan: 20.9%)
> Driving deaths involving alcohol: 30.0% (Michigan: 29.3%)
> Median household income: $37,320 (Michigan: $57,144)
> Adults reporting poor or fair health: 25.7% (Michigan: 18.3%)
[recirclink id=885553]

Minnesota: Nobles County
> Adults binge or heavy drinking: 19.4% (Minnesota: 23.2%)
> Driving deaths involving alcohol: 36.4% (Minnesota: 29.7%)
> Median household income: $55,304 (Minnesota: $71,306)
> Adults reporting poor or fair health: 18.9% (Minnesota: 12.9%)

Mississippi: Holmes County
> Adults binge or heavy drinking: 9.5% (Mississippi: 14.8%)
> Driving deaths involving alcohol: 38.9% (Mississippi: 19.6%)
> Median household income: $21,504 (Mississippi: $45,081)
> Adults reporting poor or fair health: 37.0% (Mississippi: 22.1%)
[in-text-ad-2]

Missouri: Pemiscot County
> Adults binge or heavy drinking: 15.1% (Missouri: 20.5%)
> Driving deaths involving alcohol: 21.4% (Missouri: 27.1%)
> Median household income: $33,859 (Missouri: $55,461)
> Adults reporting poor or fair health: 30.5% (Missouri: 19.5%)

Montana: Big Horn County
> Adults binge or heavy drinking: 19.3% (Montana: 21.9%)
> Driving deaths involving alcohol: 70.8% (Montana: 44.8%)
> Median household income: $49,859 (Montana: $54,970)
> Adults reporting poor or fair health: 25.5% (Montana: 14.1%)
[in-text-ad]

Nebraska: Dakota County
> Adults binge or heavy drinking: 18.2% (Nebraska: 23.7%)
> Driving deaths involving alcohol: 20.0% (Nebraska: 32.7%)
> Median household income: $59,231 (Nebraska: $61,439)
> Adults reporting poor or fair health: 20.8% (Nebraska: 13.8%)
[recirclink id=935217]

Nevada: Clark County
> Adults binge or heavy drinking: 17.4% (Nevada: 17.9%)
> Driving deaths involving alcohol: 28.3% (Nevada: 29.1%)
> Median household income: $59,340 (Nevada: $60,365)
> Adults reporting poor or fair health: 21.6% (Nevada: 19.1%)

New Hampshire: Hillsborough County
> Adults binge or heavy drinking: 19.1% (New Hampshire: 20.2%)
> Driving deaths involving alcohol: 34.4% (New Hampshire: 31.5%)
> Median household income: $81,460 (New Hampshire: $76,768)
> Adults reporting poor or fair health: 12.2% (New Hampshire: 12.8%)
[in-text-ad-2]

New Jersey: Middlesex County
> Adults binge or heavy drinking: 15.9% (New Jersey: 16.0%)
> Driving deaths involving alcohol: 24.9% (New Jersey: 21.9%)
> Median household income: $89,533 (New Jersey: $82,545)
> Adults reporting poor or fair health: 15.1% (New Jersey: 15.5%)

New Mexico: McKinley County
> Adults binge or heavy drinking: 14.4% (New Mexico: 16.7%)
> Driving deaths involving alcohol: 33.1% (New Mexico: 29.8%)
> Median household income: $33,834 (New Mexico: $49,754)
> Adults reporting poor or fair health: 31.3% (New Mexico: 20.3%)
[in-text-ad]

New York: Queens County
> Adults binge or heavy drinking: 16.1% (New York: 19.2%)
> Driving deaths involving alcohol: 16.7% (New York: 20.6%)
> Median household income: $68,666 (New York: $68,486)
> Adults reporting poor or fair health: 18.6% (New York: 16.3%)
[recirclink id=939663]

North Carolina: Hertford County
> Adults binge or heavy drinking: 13.9% (North Carolina: 17.6%)
> Driving deaths involving alcohol: 44.4% (North Carolina: 27.6%)
> Median household income: $41,028 (North Carolina: $54,602)
> Adults reporting poor or fair health: 26.9% (North Carolina: 18.0%)
North Dakota: Sioux County
> Adults binge or heavy drinking: 18.5% (North Dakota: 23.7%)
> Driving deaths involving alcohol: 45.5% (North Dakota: 42.3%)
> Median household income: $38,939 (North Dakota: $64,894)
> Adults reporting poor or fair health: 33.9% (North Dakota: 13.6%)
[in-text-ad-2]
Ohio: Lawrence County
> Adults binge or heavy drinking: 15.3% (Ohio: 18.5%)
> Driving deaths involving alcohol: 13.6% (Ohio: 32.2%)
> Median household income: $45,118 (Ohio: $56,602)
> Adults reporting poor or fair health: 22.7% (Ohio: 17.8%)

Oklahoma: Adair County
> Adults binge or heavy drinking: 13.0% (Oklahoma: 14.9%)
> Driving deaths involving alcohol: 30.0% (Oklahoma: 26.5%)
> Median household income: $34,695 (Oklahoma: $52,919)
> Adults reporting poor or fair health: 33.4% (Oklahoma: 20.9%)
[in-text-ad]

Oregon: Marion County
> Adults binge or heavy drinking: 17.4% (Oregon: 19.5%)
> Driving deaths involving alcohol: 40.1% (Oregon: 31.5%)
> Median household income: $59,625 (Oregon: $62,818)
> Adults reporting poor or fair health: 20.6% (Oregon: 18.2%)
[recirclink id=952318]

Pennsylvania: Lancaster County
> Adults binge or heavy drinking: 17.4% (Pennsylvania: 20.2%)
> Driving deaths involving alcohol: 24.7% (Pennsylvania: 26.2%)
> Median household income: $66,056 (Pennsylvania: $61,744)
> Adults reporting poor or fair health: 17.8% (Pennsylvania: 17.6%)

Rhode Island: Providence County
> Adults binge or heavy drinking: 18.6% (Rhode Island: 19.7%)
> Driving deaths involving alcohol: 38.7% (Rhode Island: 41.6%)
> Median household income: $58,974 (Rhode Island: $67,167)
> Adults reporting poor or fair health: 19.5% (Rhode Island: 16.5%)
[in-text-ad-2]
South Carolina: Orangeburg County
> Adults binge or heavy drinking: 13.4% (South Carolina: 17.8%)
> Driving deaths involving alcohol: 31.4% (South Carolina: 31.8%)
> Median household income: $37,955 (South Carolina: $53,199)
> Adults reporting poor or fair health: 23.8% (South Carolina: 17.8%)

South Dakota: Mellette County
> Adults binge or heavy drinking: 16.9% (South Dakota: 24.3%)
> Driving deaths involving alcohol: 50.0% (South Dakota: 35.5%)
> Median household income: $30,650 (South Dakota: $58,275)
> Adults reporting poor or fair health: 29.8% (South Dakota: 13.4%)
[in-text-ad]

Tennessee: Haywood County
> Adults binge or heavy drinking: 12.9% (Tennessee: 17.1%)
> Driving deaths involving alcohol: 18.8% (Tennessee: 24.6%)
> Median household income: $37,905 (Tennessee: $53,320)
> Adults reporting poor or fair health: 28.7% (Tennessee: 21.2%)
[recirclink id=885553]

Texas: Starr County
> Adults binge or heavy drinking: 13.8% (Texas: 19.0%)
> Driving deaths involving alcohol: 56.3% (Texas: 25.7%)
> Median household income: $30,387 (Texas: $61,874)
> Adults reporting poor or fair health: 41.0% (Texas: 18.7%)

Utah: Utah County
> Adults binge or heavy drinking: 6.5% (Utah: 11.1%)
> Driving deaths involving alcohol: 16.8% (Utah: 21.0%)
> Median household income: $74,665 (Utah: $71,621)
> Adults reporting poor or fair health: 13.2% (Utah: 14.8%)
[in-text-ad-2]

Vermont: Franklin County
> Adults binge or heavy drinking: 19.2% (Vermont: 20.5%)
> Driving deaths involving alcohol: 53.1% (Vermont: 34.3%)
> Median household income: $65,485 (Vermont: $61,973)
> Adults reporting poor or fair health: 14.1% (Vermont: 12.8%)

Virginia: Emporia city
> Adults binge or heavy drinking: 12.6% (Virginia: 17.7%)
> Driving deaths involving alcohol: 50.0% (Virginia: 29.8%)
> Median household income: $27,063 (Virginia: $74,222)
> Adults reporting poor or fair health: 31.5% (Virginia: 16.6%)
[in-text-ad]

Washington: Adams County
> Adults binge or heavy drinking: 15.2% (Washington: 17.1%)
> Driving deaths involving alcohol: 15.0% (Washington: 32.5%)
> Median household income: $48,294 (Washington: $73,775)
> Adults reporting poor or fair health: 28.7% (Washington: 15.0%)
[recirclink id=935217]
West Virginia: McDowell County
> Adults binge or heavy drinking: 12.3% (West Virginia: 14.4%)
> Driving deaths involving alcohol: 35.7% (West Virginia: 25.2%)
> Median household income: $27,682 (West Virginia: $46,711)
> Adults reporting poor or fair health: 36.5% (West Virginia: 23.6%)

Wisconsin: Milwaukee County
> Adults binge or heavy drinking: 23.5% (Wisconsin: 27.1%)
> Driving deaths involving alcohol: 30.0% (Wisconsin: 35.7%)
> Median household income: $50,606 (Wisconsin: $61,747)
> Adults reporting poor or fair health: 19.7% (Wisconsin: 14.8%)
[in-text-ad-2]
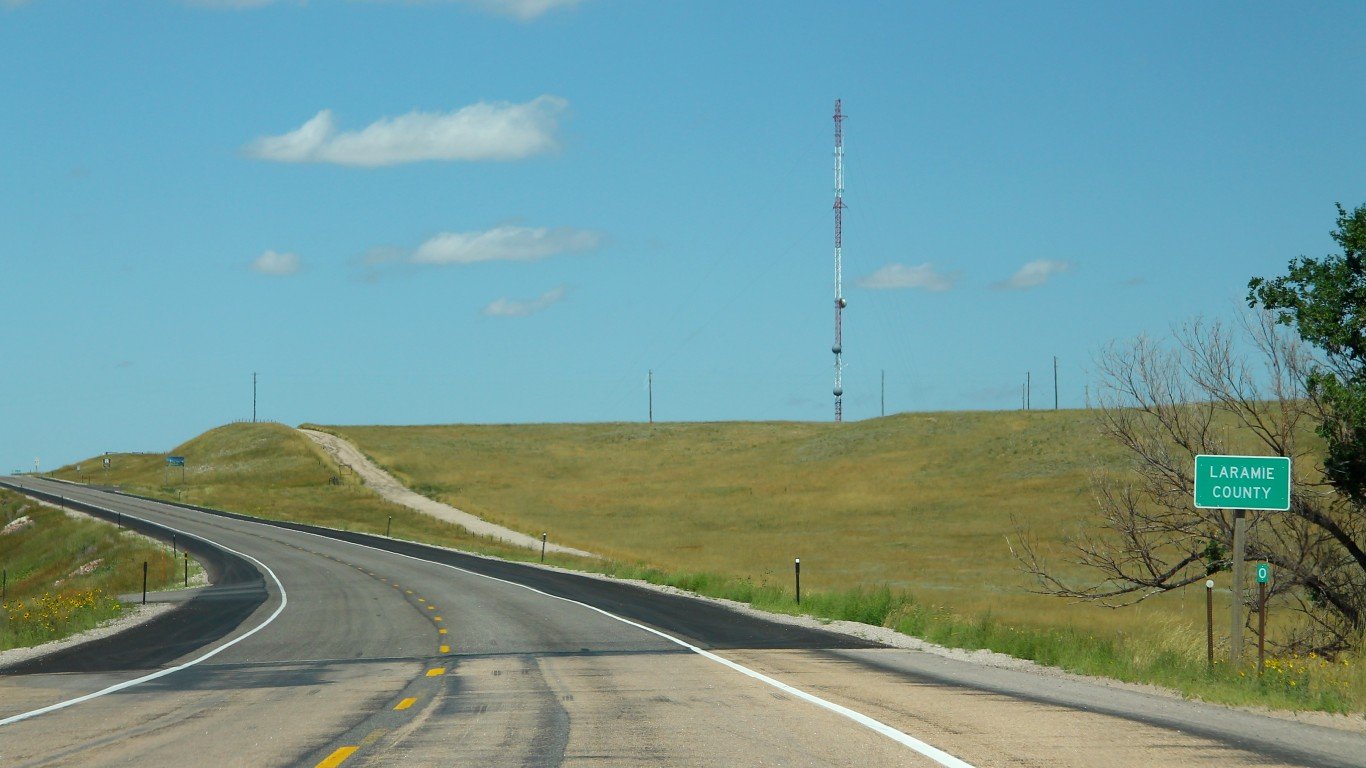
Wyoming: Laramie County
> Adults binge or heavy drinking: 17.9% (Wyoming: 20.1%)
> Driving deaths involving alcohol: 34.3% (Wyoming: 32.8%)
> Median household income: $66,910 (Wyoming: $64,049)
> Adults reporting poor or fair health: 15.4% (Wyoming: 15.3%)
Methodology
To determine the least drunk county in every state, 24/7 Tempo reviewed rates of excessive drinking from the Robert Wood Johnson Foundation and the University of Wisconsin Population Health Institute joint program’s 2021 County Health Rankings & Roadmaps report.
The rate of excessive drinking is defined as the share of adults who report either binge drinking or heavy drinking in the past 30 days. Binge drinking is defined as a woman consuming more than four drinks or a man consuming more than five drinks in a single occasion. Heavy drinking is defined as a woman consuming more than one drink per day on average or a man consuming more than two drinks per day on average.
While the CHR report is from 2021, excessive drinking rate figures published in the report are from 2018.
Of the 3,220 counties or county equivalents, 3,141 had boundaries that fell within one of the 50 states, while the rest were in the District of Columbia or Puerto Rico. Counties with a 2019 five-year population estimate from the U.S. Census Bureau of less than 1,000 were excluded.
The remaining 3,105 places were ranked within their state based on the excessive drinking rate. Additional information on the share of driving deaths with alcohol involvement, and the share of adults who report fair or poor health are also from the 2021 CHR. Median household income data are five-year estimates from the U.S. Census Bureau’s 2019 American Community Survey.
Contact [email protected] for any questions or corrections.