California has seen a recent dip in crime. Based on FBI statistics, the Center on Juvenile and Criminal Justice reports that the Golden State’s overall crime rate decreased by 6% in 2020 from the previous year — to its lowest point in more than 50 years.
Longer term, too, the state’s crime rate has been on a downward trajectory. Since 2000, property crime and violent crime dropped by 32% and 29% respectively. Unfortunately, California did experience a 31% rise in homicides last year — but CJCJ notes that the murder rate remains at a relatively low level. (These are 25 cities where murders are on the rise.)
Those are the overall numbers. As with any state as large as California, there are bound to be pockets where rates of violent crime and property crime exceed those of the state as whole. (The FBI defines violent crime as murder and nonnegligent manslaughter, rаpe, robbery, and aggravated assault. Property crime offenses include burglary, larceny-theft, motor vehicle theft, and arson.)
To determine the 25 most dangerous cities in California, 24/7 Wall St. reviewed data on violent crimes from the FBI’s Crime Data Explorer. Cities and towns with a population of at least 2,500 were ranked based on the number of violent crimes reported in 2020 per 100,000 residents. Data on population and property crimes also came from the FBI. Supplemental data on median household income and poverty rate came from the U.S. Census Bureau’s 2019 American Community Survey and are five-year estimates.
Click here to see the 25 most dangerous cities in California
Two Southern California communities, both in San Bernardino County, ranked as the most dangerous in the state. Topping the list is Needles, a town of fewer than 5,000 people situated in the Mojave Desert on the Arizona border. Number two is San Bernardino itself, with a population of more than 200,000. The Northern California metropolis of Oakland, a city of 438,000, placed third.
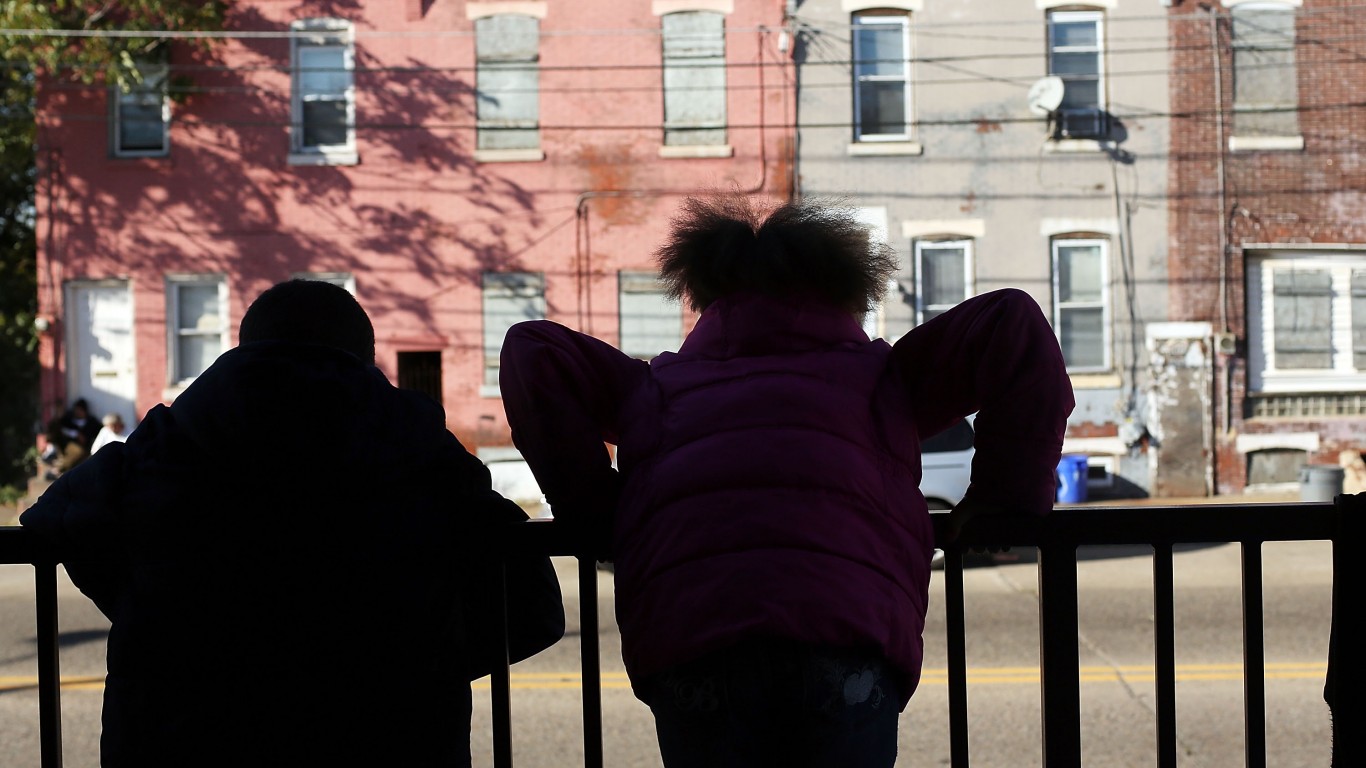
High rates of crime are often associated with poverty, but it is worth noting that only four of the cities on this list have poverty rates exceeding the national average of 11.4% — and while Needles has a poverty rate of 7.2%, the rates in San Bernardino and Oakland hover around 1%, according to the Census Bureau. (See the city where most people live below the poverty line in every state.)

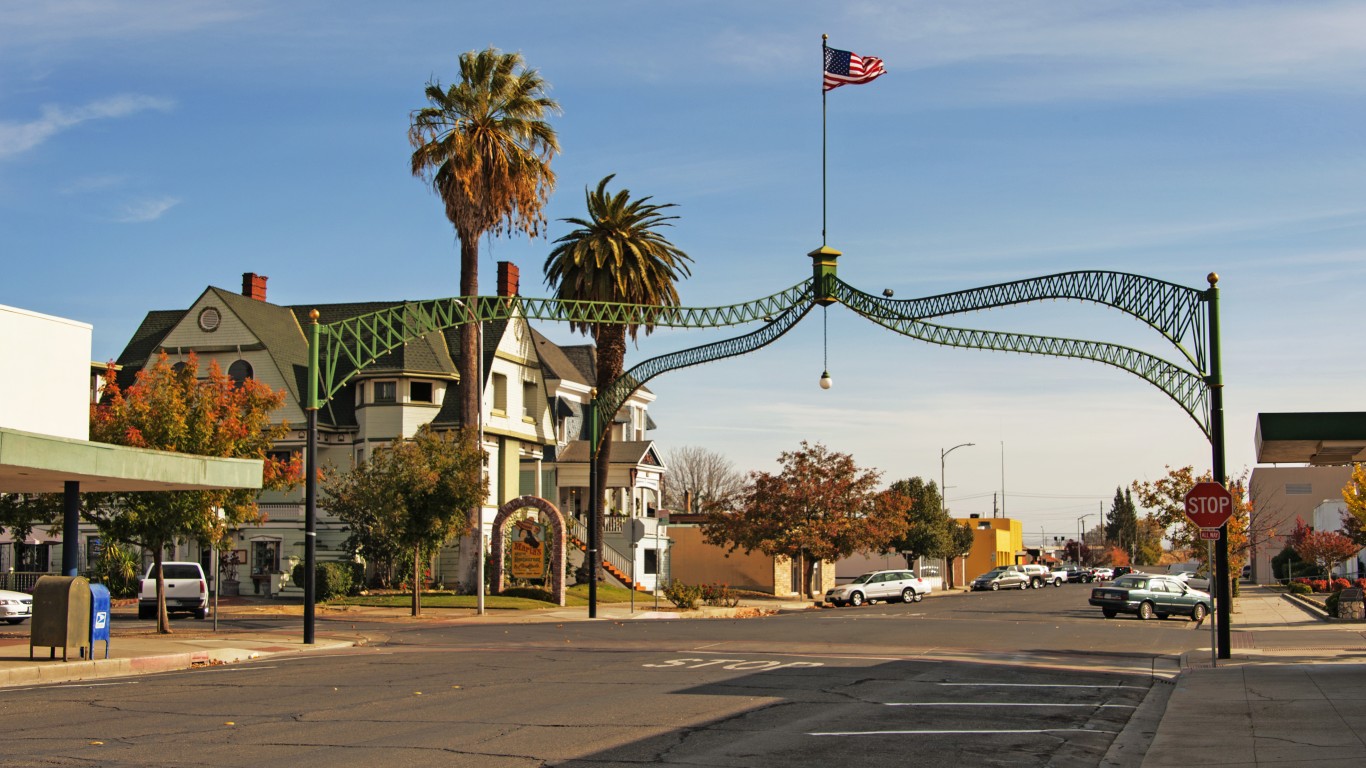
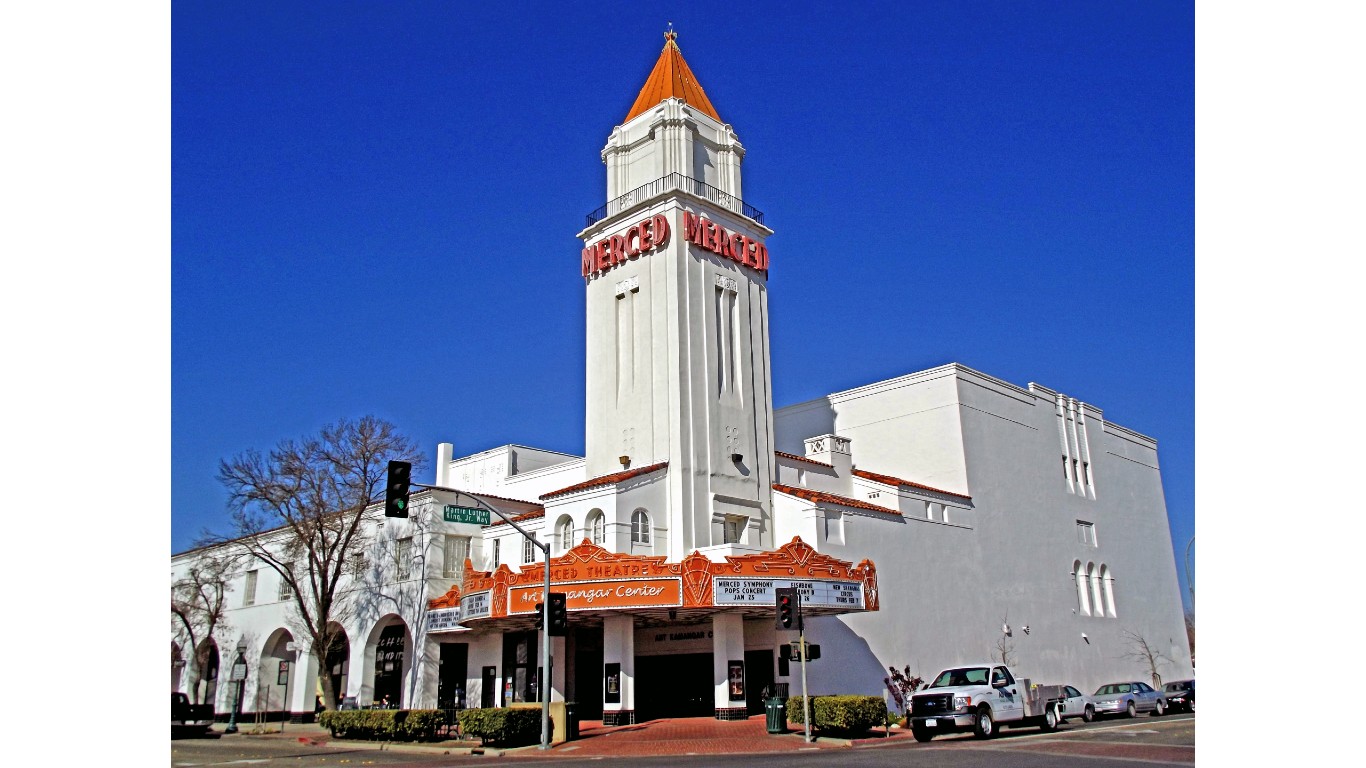
25. Merced
> Violent crimes in 2020: 798.1 per 100,000 (672 total)
> Property crimes in 2020: 2,314.8 per 100,000 (1,949 total)
> Median household income: $45,232
> Poverty rate: 3.2%
> Population: 84,197
[in-text-ad]
24. Adelanto
> Violent crimes in 2020: 798.1 per 100,000 (274 total)
> Property crimes in 2020: 885.5 per 100,000 (304 total)
> Median household income: $45,380
> Poverty rate: 5%
> Population: 34,330
[recirclink id=806643]
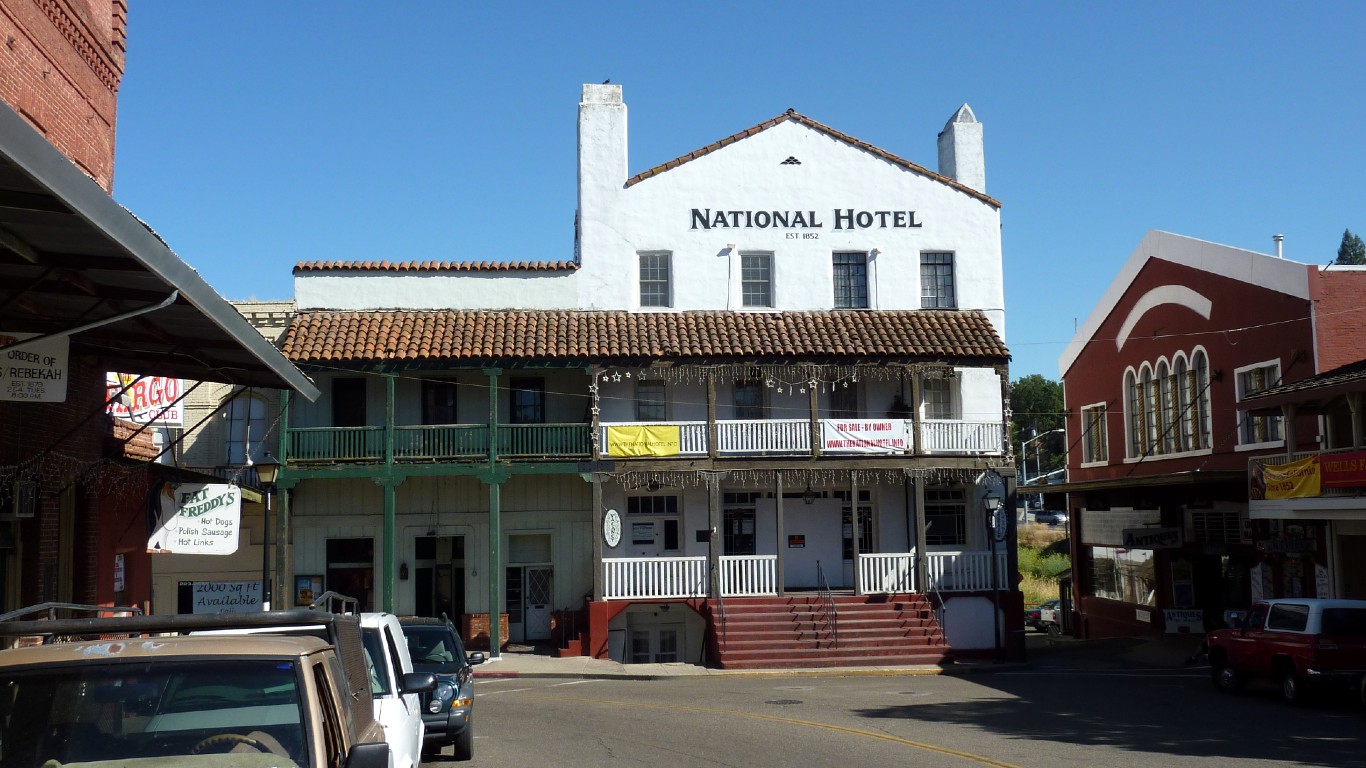
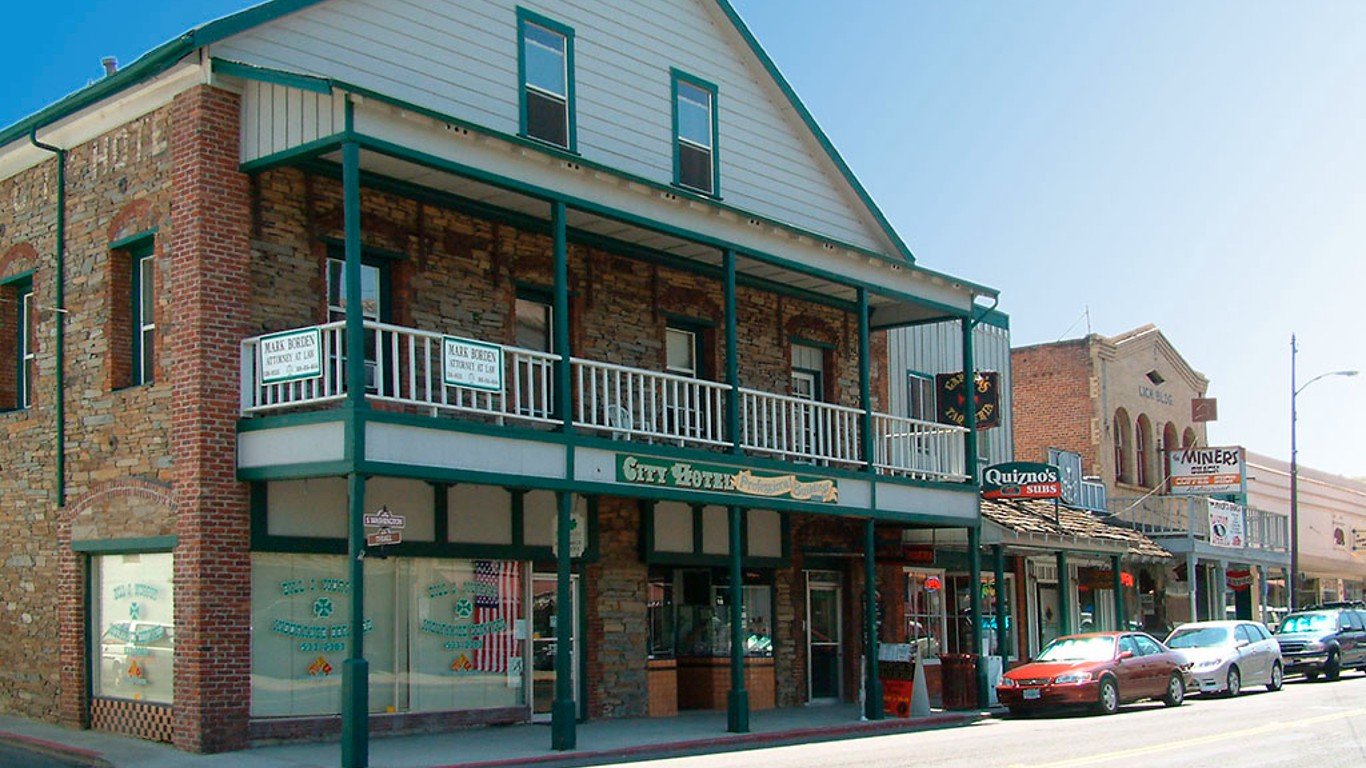
23. Jackson
> Violent crimes in 2020: 802.3 per 100,000 (39 total)
> Property crimes in 2020: 2,921.2 per 100,000 (142 total)
> Median household income: $53,462
> Poverty rate: 15%
> Population: 4,861
22. Sonora
> Violent crimes in 2020: 802.5 per 100,000 (39 total)
> Property crimes in 2020: 5,205.8 per 100,000 (253 total)
> Median household income: $42,446
> Poverty rate: 7.3%
> Population: 4,860
[in-text-ad-2]

21. Signal Hill
> Violent crimes in 2020: 819.7 per 100,000 (94 total)
> Property crimes in 2020: 6,435.9 per 100,000 (738 total)
> Median household income: $75,508
> Poverty rate: 6.9%
> Population: 11,467

20. Clearlake
> Violent crimes in 2020: 831.8 per 100,000 (127 total)
> Property crimes in 2020: 2,502 per 100,000 (382 total)
> Median household income: $31,551
> Poverty rate: 7.2%
> Population: 15,268
[in-text-ad]

19. Willits
> Violent crimes in 2020: 839 per 100,000 (41 total)
> Property crimes in 2020: 1,923.5 per 100,000 (94 total)
> Median household income: $35,204
> Poverty rate: 15.1%
> Population: 4,887
[recirclink id=966311]
18. Emeryville
> Violent crimes in 2020: 867.9 per 100,000 (107 total)
> Property crimes in 2020: 11,753.7 per 100,000 (1,449 total)
> Median household income: $102,725
> Poverty rate: 2.8%
> Population: 12,328
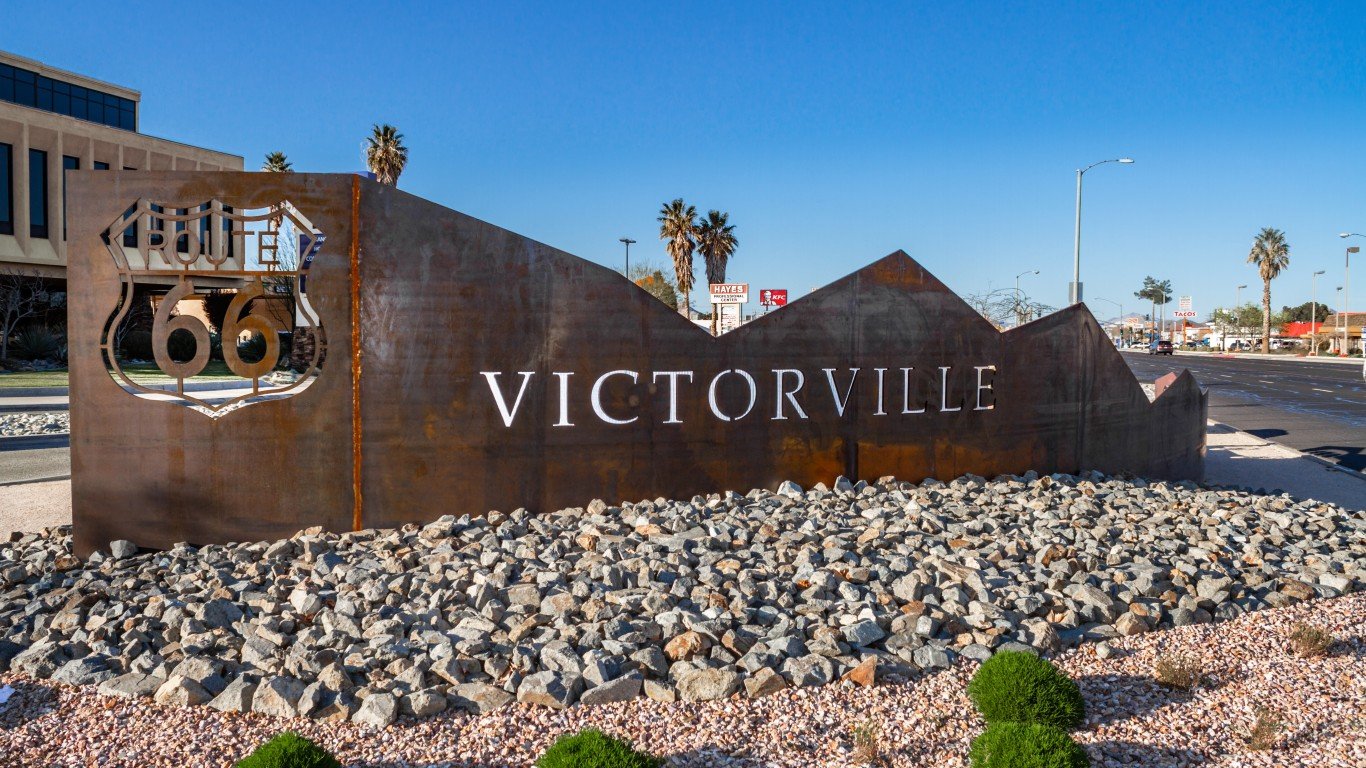
17. Victorville
> Violent crimes in 2020: 880.7 per 100,000 (1,084 total)
> Property crimes in 2020: 1,590.8 per 100,000 (1,958 total)
> Median household income: $53,957
> Poverty rate: 4%
> Population: 123,085
[in-text-ad-2]

16. Susanville
> Violent crimes in 2020: 949.8 per 100,000 (140 total)
> Property crimes in 2020: 1,417.9 per 100,000 (209 total)
> Median household income: $52,488
> Poverty rate: 5.1%
> Population: 14,740

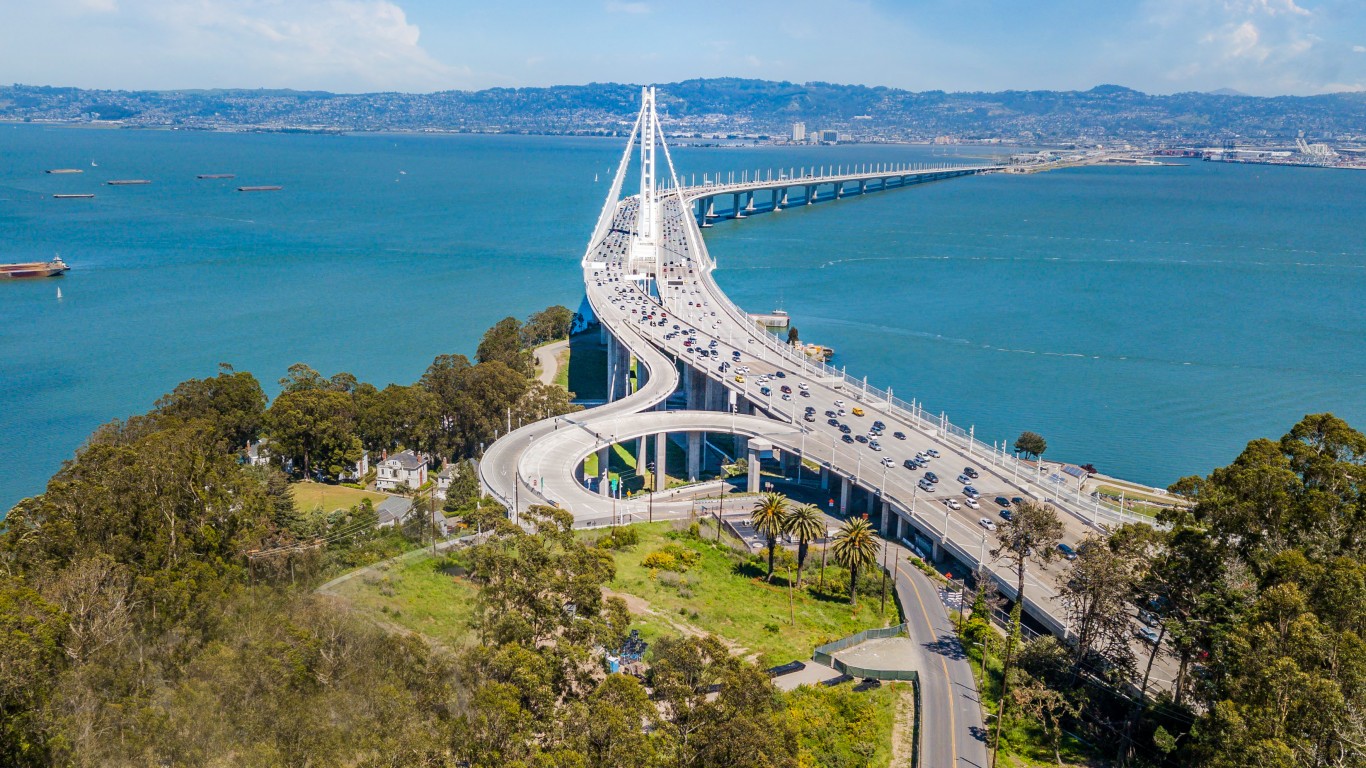
15. Richmond
> Violent crimes in 2020: 964.4 per 100,000 (1,074 total)
> Property crimes in 2020: 3,303.5 per 100,000 (3,679 total)
> Median household income: $68,472
> Poverty rate: 3%
> Population: 111,367
[in-text-ad]

14. Red Bluff
> Violent crimes in 2020: 987 per 100,000 (144 total)
> Property crimes in 2020: 4,366 per 100,000 (637 total)
> Median household income: $31,450
> Poverty rate: 5.5%
> Population: 14,590
[recirclink id=866927]

13. Vallejo
> Violent crimes in 2020: 990.8 per 100,000 (1,212 total)
> Property crimes in 2020: 3,333.7 per 100,000 (4,078 total)
> Median household income: $69,405
> Poverty rate: 2.1%
> Population: 122,326
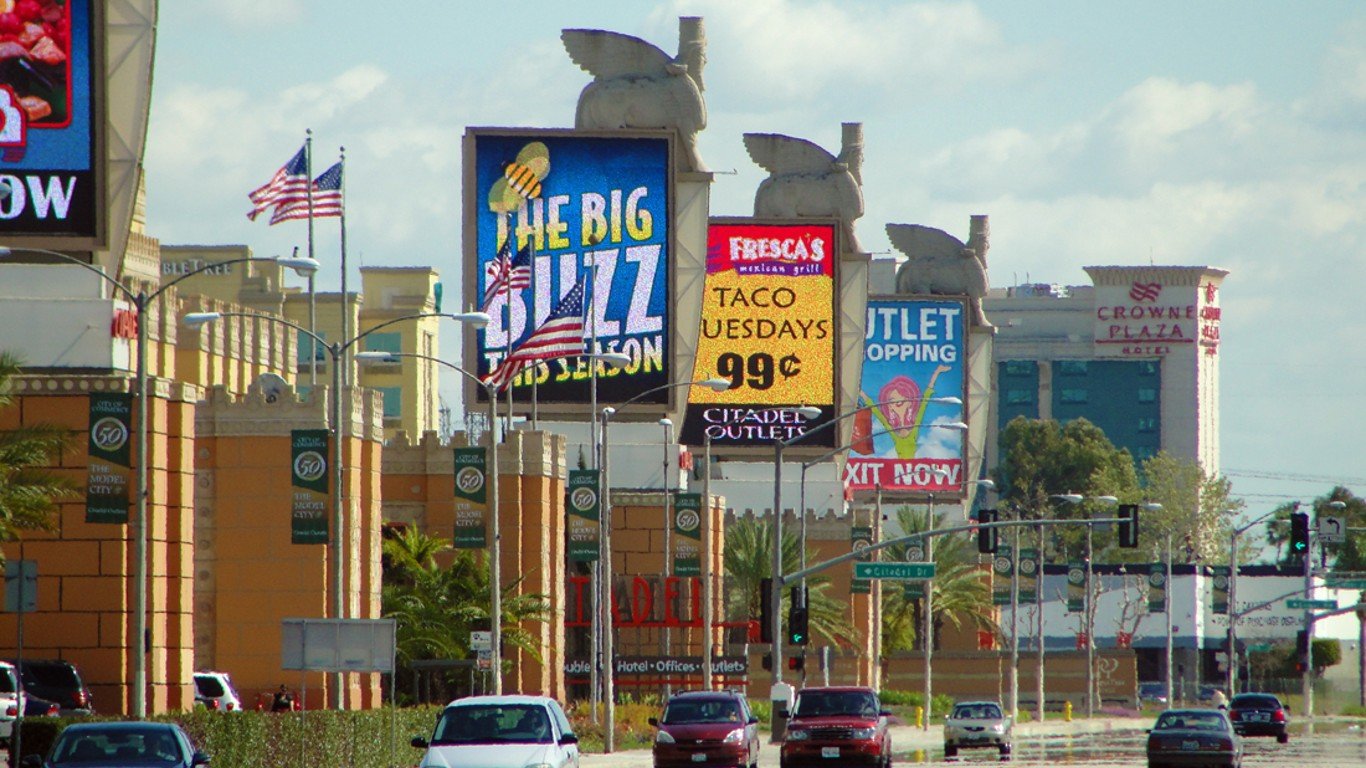
12. Commerce
> Violent crimes in 2020: 1,075.9 per 100,000 (136 total)
> Property crimes in 2020: 8,456.6 per 100,000 (1,069 total)
> Median household income: $47,518
> Poverty rate: 5.9%
> Population: 12,641
[in-text-ad-2]
11. Marysville
> Violent crimes in 2020: 1,126.3 per 100,000 (141 total)
> Property crimes in 2020: 3,698.4 per 100,000 (463 total)
> Median household income: $44,839
> Poverty rate: 8.4%
> Population: 12,519

10. Barstow
> Violent crimes in 2020: 1,143.9 per 100,000 (275 total)
> Property crimes in 2020: 3,860.1 per 100,000 (928 total)
> Median household income: $40,633
> Poverty rate: 6.8%
> Population: 24,041
[in-text-ad]

9. Crescent City
> Violent crimes in 2020: 1,148.2 per 100,000 (77 total)
> Property crimes in 2020: 4,160.5 per 100,000 (279 total)
> Median household income: $32,137
> Poverty rate: 4.3%
> Population: 6,706
[recirclink id=847995]
8. Huron
> Violent crimes in 2020: 1,157.6 per 100,000 (85 total)
> Property crimes in 2020: 980.5 per 100,000 (72 total)
> Median household income: $25,060
> Poverty rate: 16.8%
> Population: 7,343

7. Big Bear Lake
> Violent crimes in 2020: 1,168.7 per 100,000 (62 total)
> Property crimes in 2020: 1,715.4 per 100,000 (91 total)
> Median household income: $51,060
> Poverty rate: 7.8%
> Population: 5,305
[in-text-ad-2]

6. Compton
> Violent crimes in 2020: 1,177.9 per 100,000 (1,125 total)
> Property crimes in 2020: 2,354.7 per 100,000 (2,249 total)
> Median household income: $52,883
> Poverty rate: 2.4%
> Population: 95,513

5. Stockton
> Violent crimes in 2020: 1,277.2 per 100,000 (4,023 total)
> Property crimes in 2020: 2,981.4 per 100,000 (9,391 total)
> Median household income: $54,614
> Poverty rate: 1.2%
> Population: 314,981
[in-text-ad]
4. Dos Palos
> Violent crimes in 2020: 1,287.1 per 100,000 (72 total)
> Property crimes in 2020: 1,769.8 per 100,000 (99 total)
> Median household income: $56,716
> Poverty rate: 14.1%
> Population: 5,594
[recirclink id=886163]

3. Oakland
> Violent crimes in 2020: 1,290.9 per 100,000 (5,653 total)
> Property crimes in 2020: 5,165.7 per 100,000 (22,622 total)
> Median household income: $73,692
> Poverty rate: 1.3%
> Population: 437,923
2. San Bernardino
> Violent crimes in 2020: 1,401.8 per 100,000 (3,033 total)
> Property crimes in 2020: 2,800.4 per 100,000 (6,059 total)
> Median household income: $45,834
> Poverty rate: 1.2%
> Population: 216,365
[in-text-ad-2]
1. Needles
> Violent crimes in 2020: 1,602.6 per 100,000 (80 total)
> Property crimes in 2020: 2,163.5 per 100,000 (108 total)
> Median household income: $33,717
> Poverty rate: 7.2%
> Population: 4,992
Contact [email protected] for any questions or corrections.