Georgia’s overall crime rate dropped between 2019 and 2020, slipping from a total of 209,002 incidents in 2019 to 163,682 last year, according to the Georgia Bureau of Investigation.
However, while the number of property crimes declined from 182,423 to 136,523 in that period, the number of violent crimes rose from 26,579 to 27,159. (The FBI defines property crime as offenses including burglary, larceny-theft, motor vehicle theft, and arson. Violent crime includes murder and nonnegligent manslaughter, rаpe, robbery, and aggravated assault.)
Georgia’s numbers track those of the nation as a whole. That is, violent crime up, property crime down. In 2020, the FBI reports, violent offenses across the country climbed 5.6% from 2019, while property crime dropped 7.8%.
In Georgia, as in any state, some cities are more prone to violent crime than others. To determine Georgia’s 25 most dangerous cities, 24/7 Wall St. reviewed data on violent crimes from the FBI’s Crime Data Explorer. Cities and towns with a population of at least 2,500 were ranked based on the number of violent crimes reported in 2020 per 100,000 residents. Data on population and property crimes also came from the FBI. Supplemental data on median household income and poverty rate came from the U.S. Census Bureau’s 2019 American Community Survey and are five-year estimates. (Nationwide, these are America’s 50 most dangerous cities.)
Click here to see the most dangerous cities in Georgia
Atlanta, the state capital, saw a hike in homicides between 2019 and 2020 from 605 to 943 — but it didn’t even make the list. Rather, College Park, a small city of roughly 15,000 on Atlanta’s outskirts, grabbed the top spot. Perhaps its small population skewed the results, which totaled 267 for violent crimes and 934 for property offenses. That factored to ratios of 1,756.1 and 6,143.1 per 100,000 residents, respectively.
No. 2 is Albany, a city of 72,000 in the southwest part of the state. Its violent crime total reached 1,234 for a ratio of 1,724.3 per 100,000 residents. Property crimes reached 3,148, equating to 4,398.7 per 100,000 residents. (These are the American towns with the most robberies.)

25. Millen
> Violent crimes in 2020: 586.1 per 100,000 (16 total)
> Property crimes in 2020: 2,820.5 per 100,000 (77 total)
> Median household income: $26,120
> Poverty rate: 7.5%
> Population: 2,730
[in-text-ad]
24. Ocilla
> Violent crimes in 2020: 611.9 per 100,000 (23 total)
> Property crimes in 2020: 2,793.3 per 100,000 (105 total)
> Median household income: $21,239
> Poverty rate: 11.6%
> Population: 3,759
[recirclink id=806643]

23. Warner Robins
> Violent crimes in 2020: 630.5 per 100,000 (495 total)
> Property crimes in 2020: 4,017.4 per 100,000 (3,154 total)
> Median household income: $51,779
> Poverty rate: 2.6%
> Population: 78,508
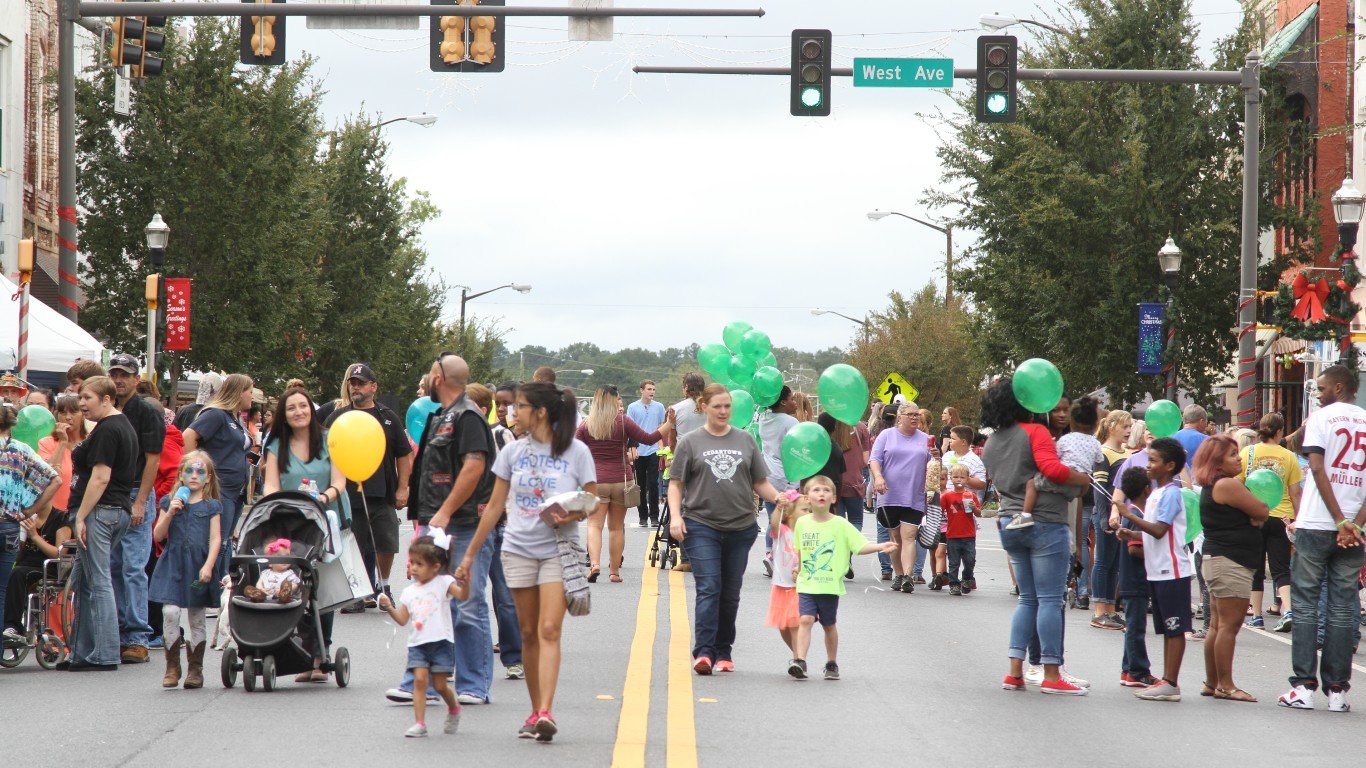
22. Cedartown
> Violent crimes in 2020: 638.7 per 100,000 (64 total)
> Property crimes in 2020: 3,562.9 per 100,000 (357 total)
> Median household income: $32,564
> Poverty rate: 15.8%
> Population: 10,020
[in-text-ad-2]

21. Snellville
> Violent crimes in 2020: 675.5 per 100,000 (137 total)
> Property crimes in 2020: 2,169.4 per 100,000 (440 total)
> Median household income: $74,535
> Poverty rate: 5.8%
> Population: 20,282

20. Cordele
> Violent crimes in 2020: 688.9 per 100,000 (72 total)
> Property crimes in 2020: 5,042.6 per 100,000 (527 total)
> Median household income: $21,350
> Poverty rate: 14.5%
> Population: 10,451
[in-text-ad]
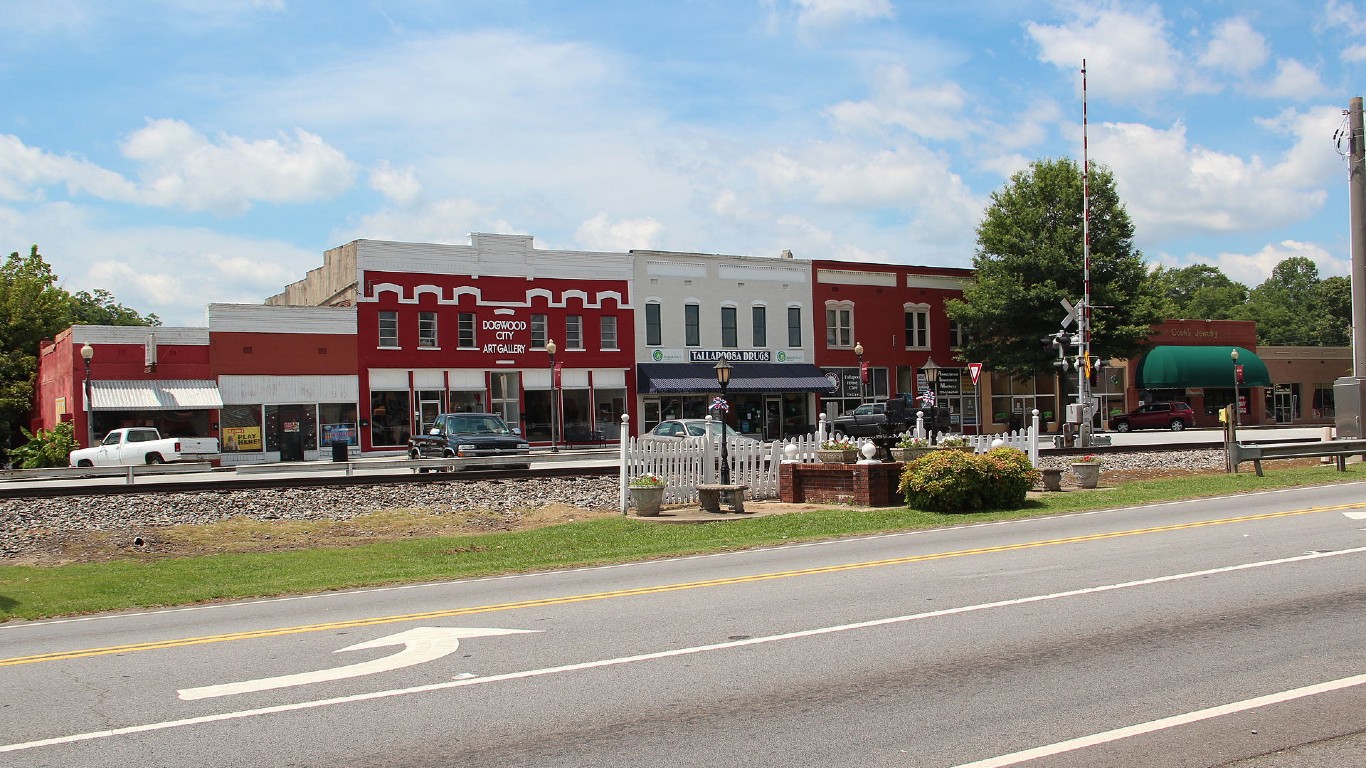
19. Tallapoosa
> Violent crimes in 2020: 721.9 per 100,000 (23 total)
> Property crimes in 2020: 2,040.2 per 100,000 (65 total)
> Median household income: $49,211
> Poverty rate: 19%
> Population: 3,186
[recirclink id=993233]
18. Blakely
> Violent crimes in 2020: 729.9 per 100,000 (33 total)
> Property crimes in 2020: 4,136.3 per 100,000 (187 total)
> Median household income: $22,276
> Poverty rate: 6.1%
> Population: 4,521

17. Monroe
> Violent crimes in 2020: 748.5 per 100,000 (103 total)
> Property crimes in 2020: 3,727.9 per 100,000 (513 total)
> Median household income: $31,740
> Poverty rate: 12.9%
> Population: 13,761
[in-text-ad-2]

16. Milledgeville
> Violent crimes in 2020: 752 per 100,000 (141 total)
> Property crimes in 2020: 3,541.1 per 100,000 (664 total)
> Median household income: $28,632
> Poverty rate: 7.2%
> Population: 18,751
15. Bainbridge
> Violent crimes in 2020: 766.3 per 100,000 (92 total)
> Property crimes in 2020: 3,714.8 per 100,000 (446 total)
> Median household income: $37,985
> Poverty rate: 8.1%
> Population: 12,006
[in-text-ad]
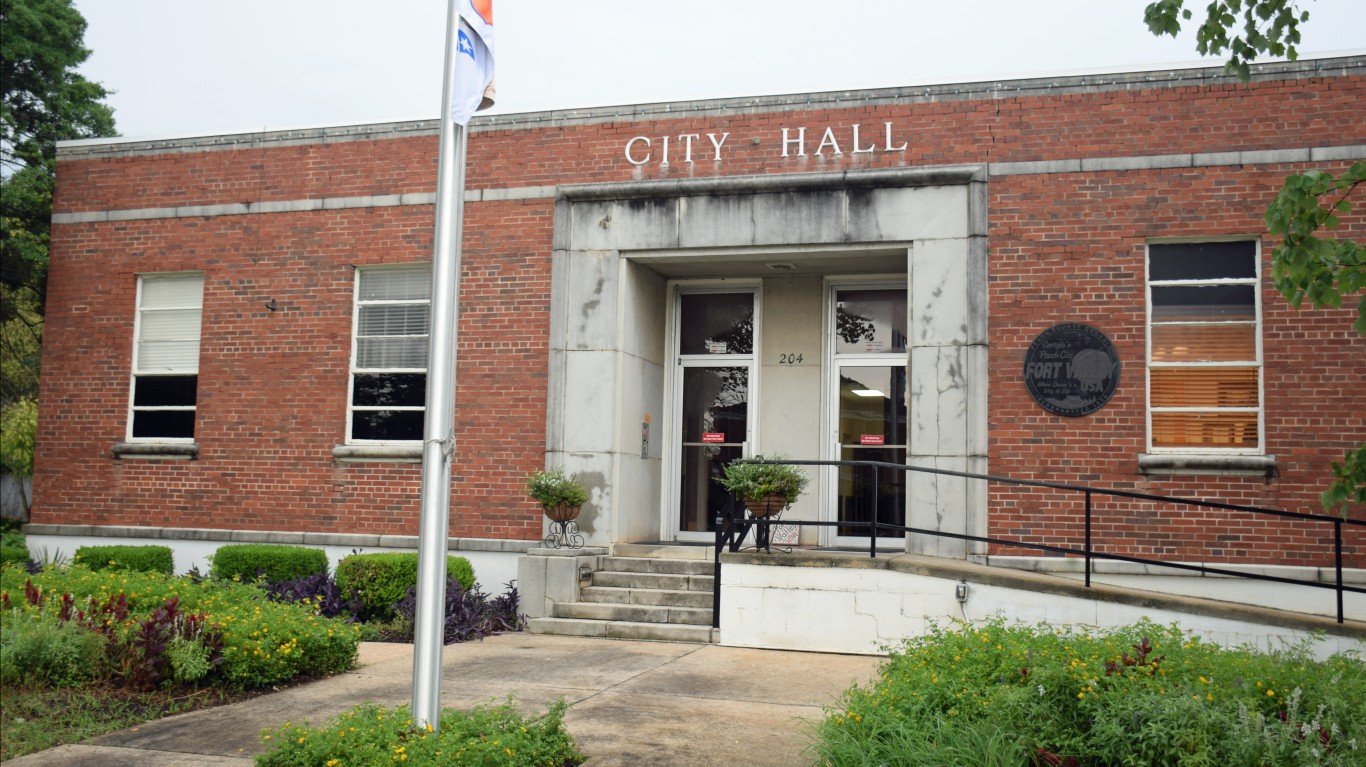
14. Fort Valley
> Violent crimes in 2020: 822.3 per 100,000 (73 total)
> Property crimes in 2020: 2,613.5 per 100,000 (232 total)
> Median household income: $22,613
> Poverty rate: 7.5%
> Population: 8,877
[recirclink id=866927]
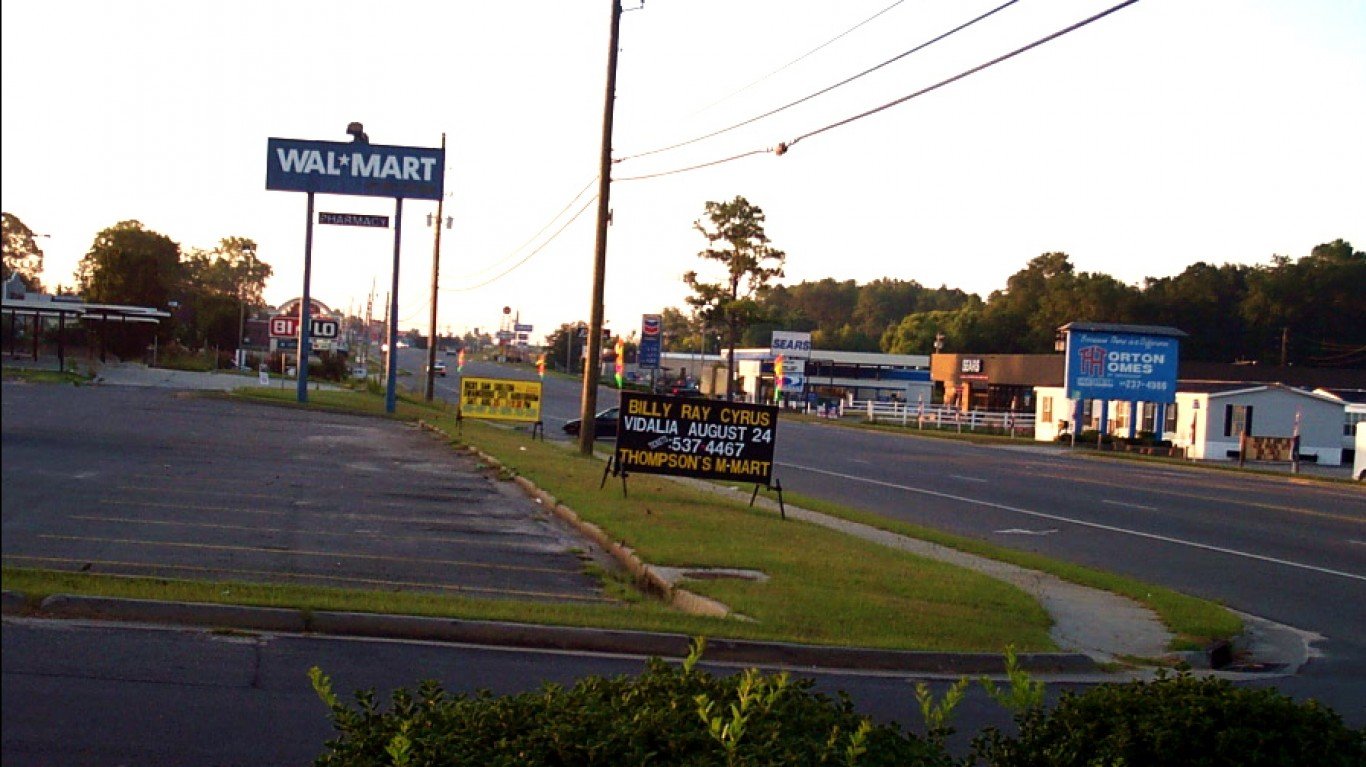
13. Vidalia
> Violent crimes in 2020: 846.3 per 100,000 (88 total)
> Property crimes in 2020: 1,529.1 per 100,000 (159 total)
> Median household income: $40,621
> Poverty rate: 8.6%
> Population: 10,398
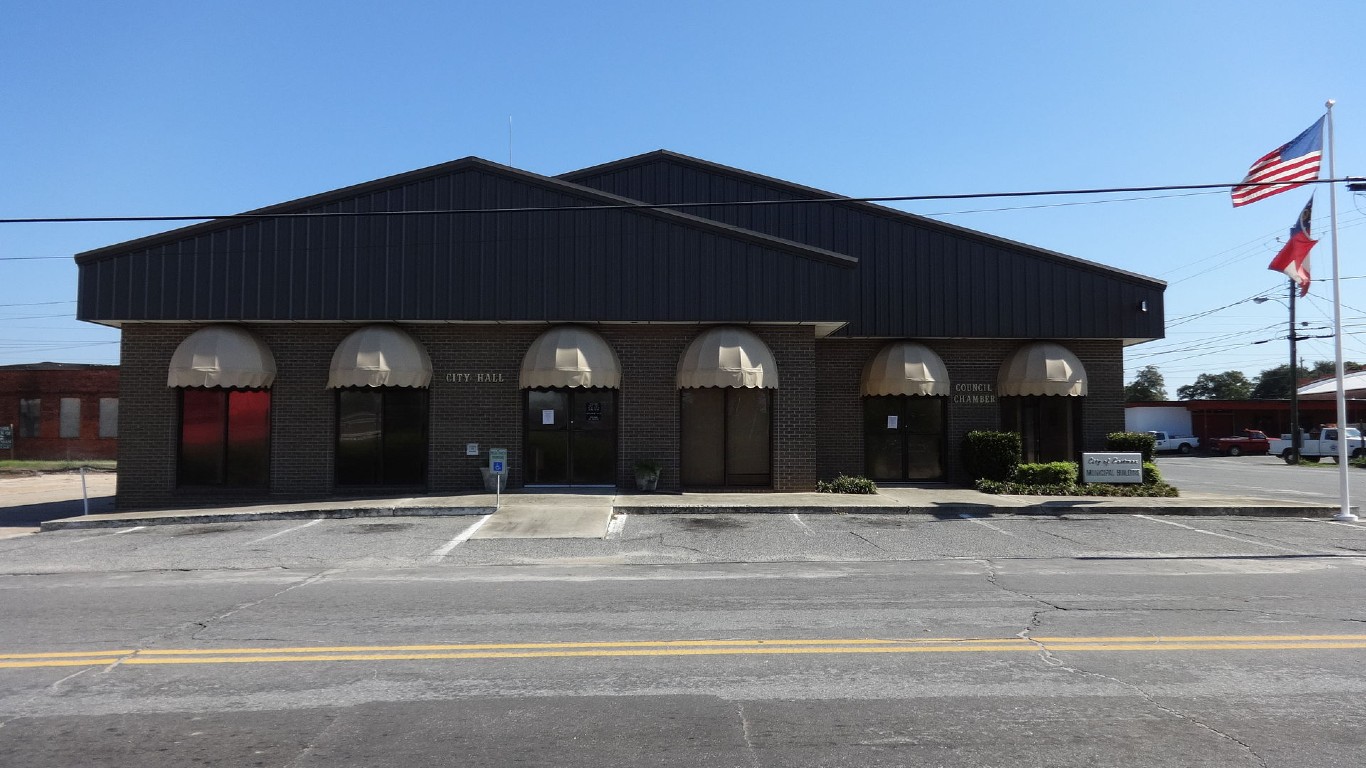
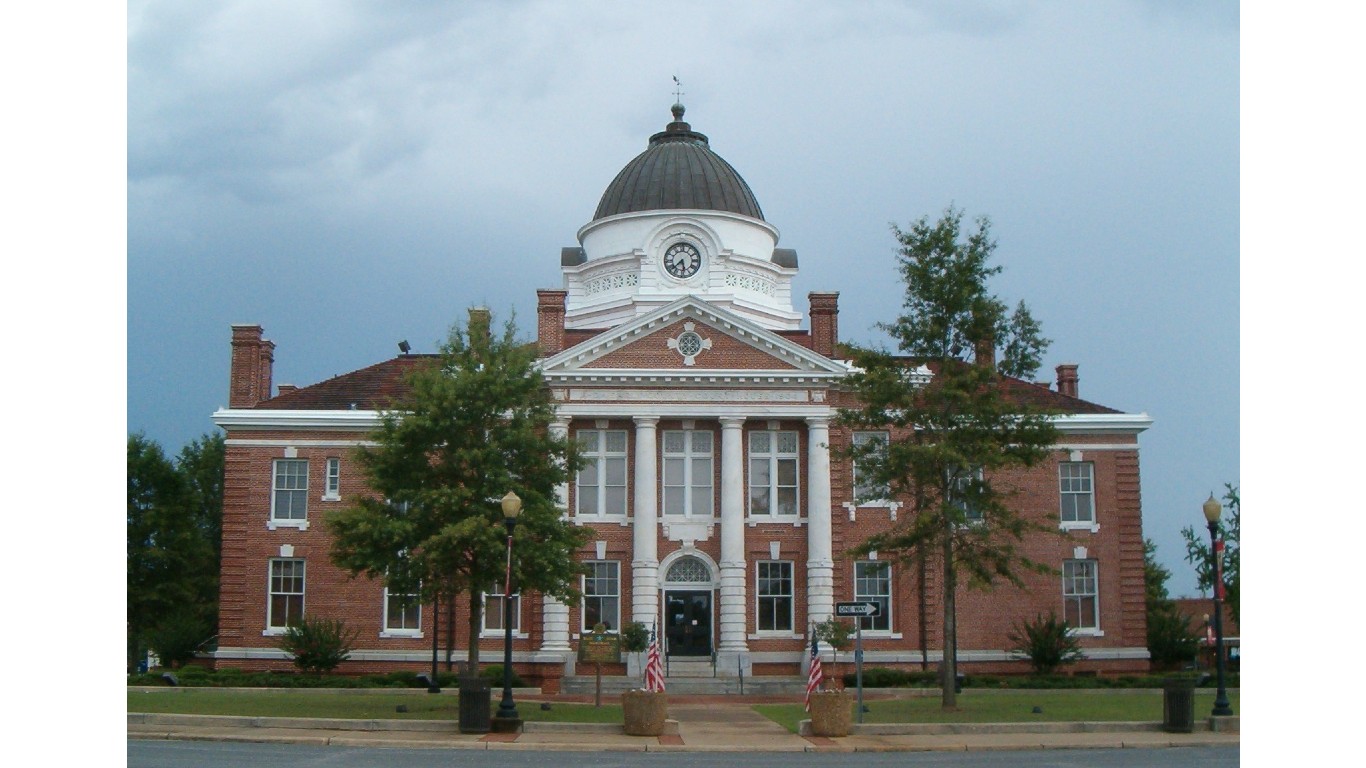
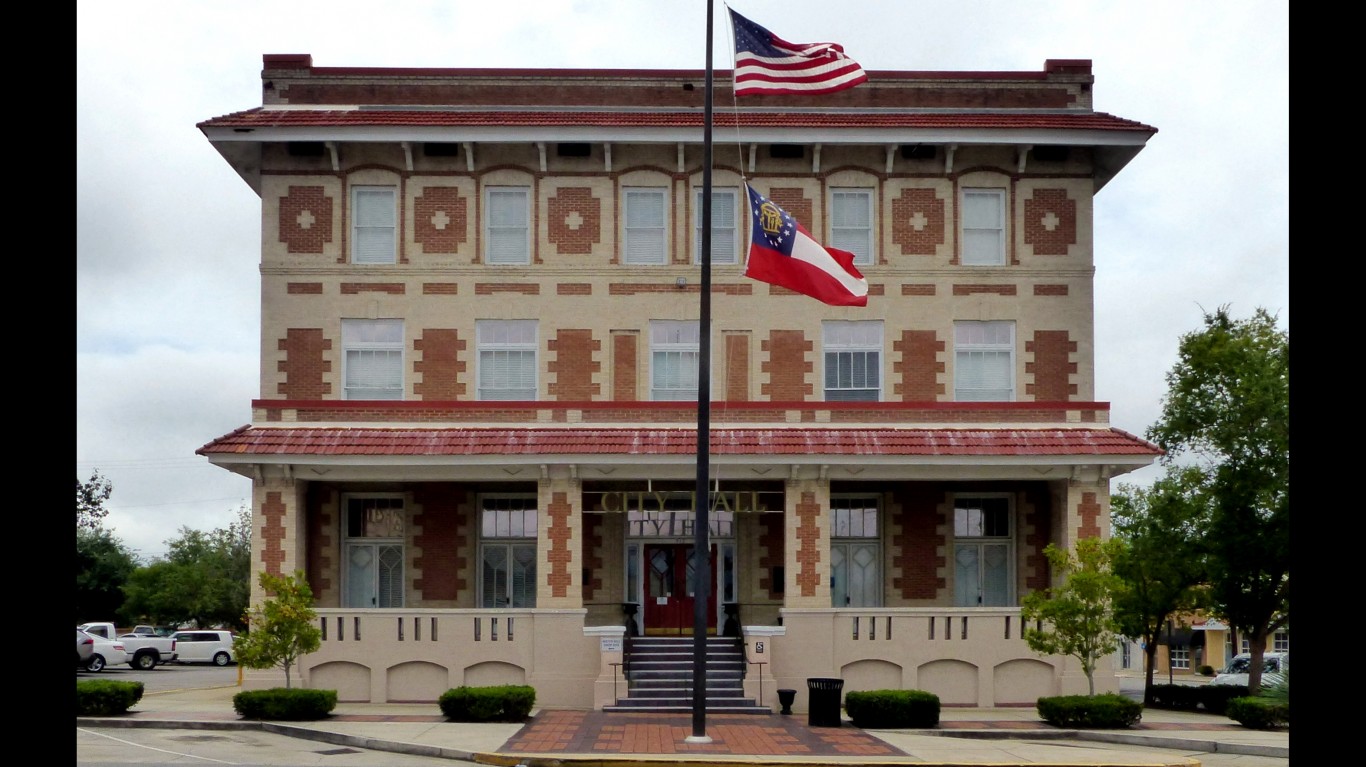
12. Eastman
> Violent crimes in 2020: 916.7 per 100,000 (46 total)
> Property crimes in 2020: 3,925.9 per 100,000 (197 total)
> Median household income: $35,595
> Poverty rate: 12.7%
> Population: 5,018
[in-text-ad-2]
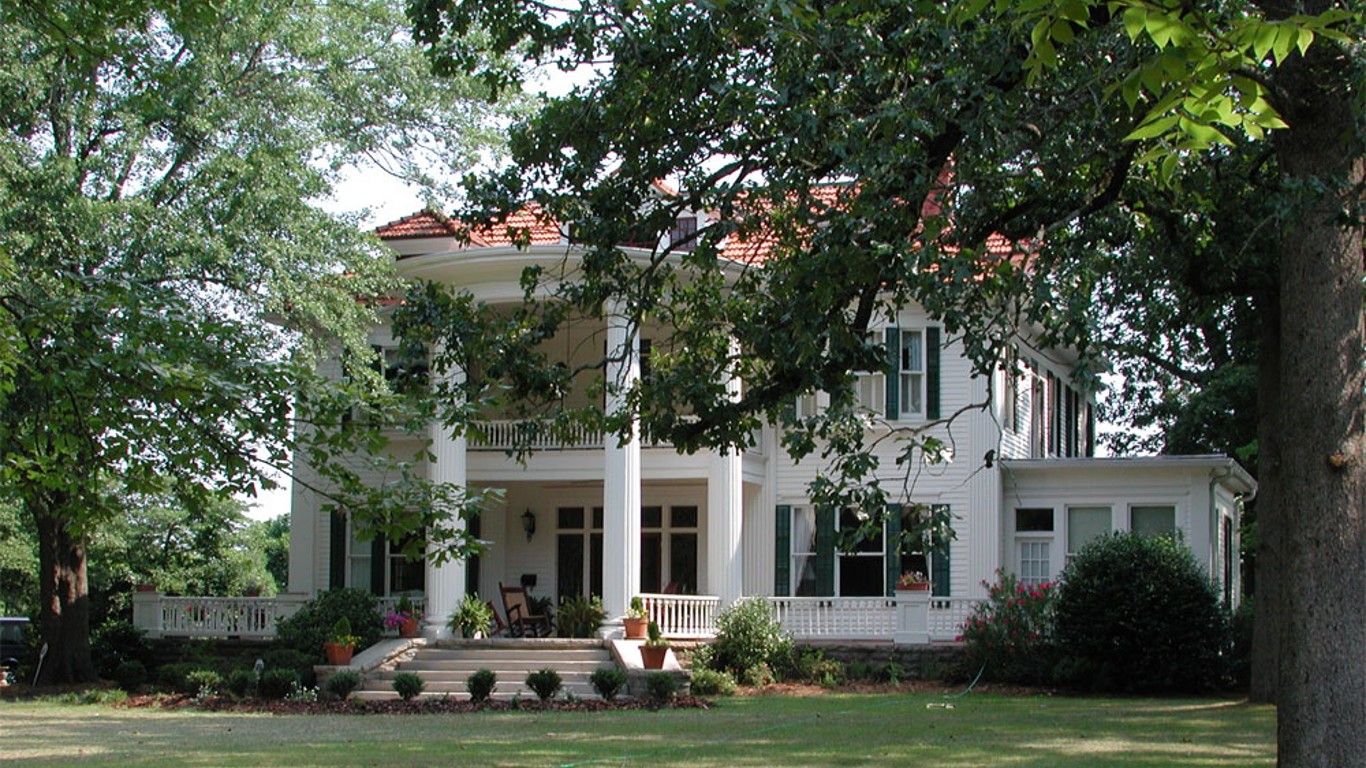
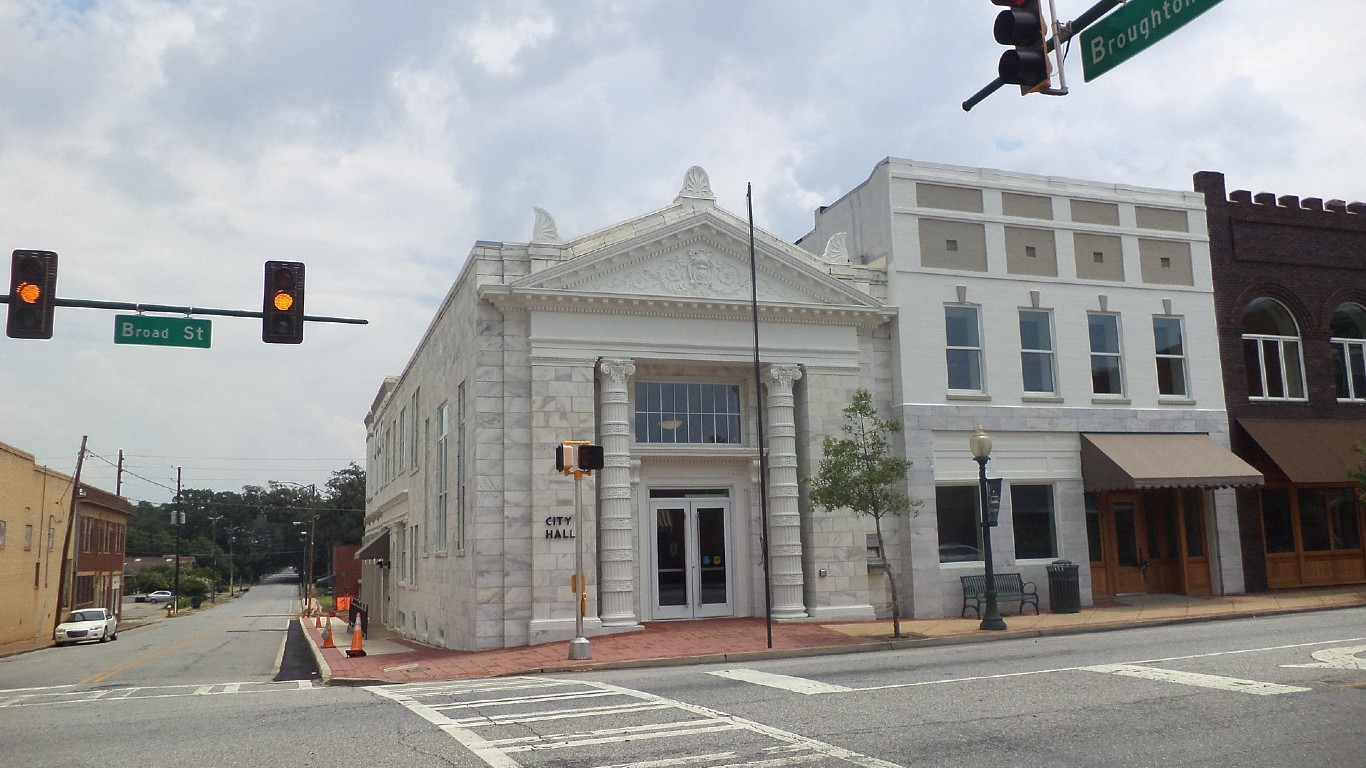
11. Elberton
> Violent crimes in 2020: 952.8 per 100,000 (41 total)
> Property crimes in 2020: 3,648.6 per 100,000 (157 total)
> Median household income: $33,895
> Poverty rate: 12.9%
> Population: 4,303
10. Waycross
> Violent crimes in 2020: 965.4 per 100,000 (129 total)
> Property crimes in 2020: 5,672.4 per 100,000 (758 total)
> Median household income: $27,381
> Poverty rate: 5.5%
> Population: 13,363
[in-text-ad]

9. Forest Park
> Violent crimes in 2020: 1,004.9 per 100,000 (203 total)
> Property crimes in 2020: 4,341.2 per 100,000 (877 total)
> Median household income: $36,792
> Poverty rate: 4.5%
> Population: 20,202
[recirclink id=847995]

8. South Fulton
> Violent crimes in 2020: 1,027.2 per 100,000 (1,034 total)
> Property crimes in 2020: 2,676.4 per 100,000 (2,694 total)
> Median household income: $65,919
> Poverty rate: 3.3%
> Population: 100,658
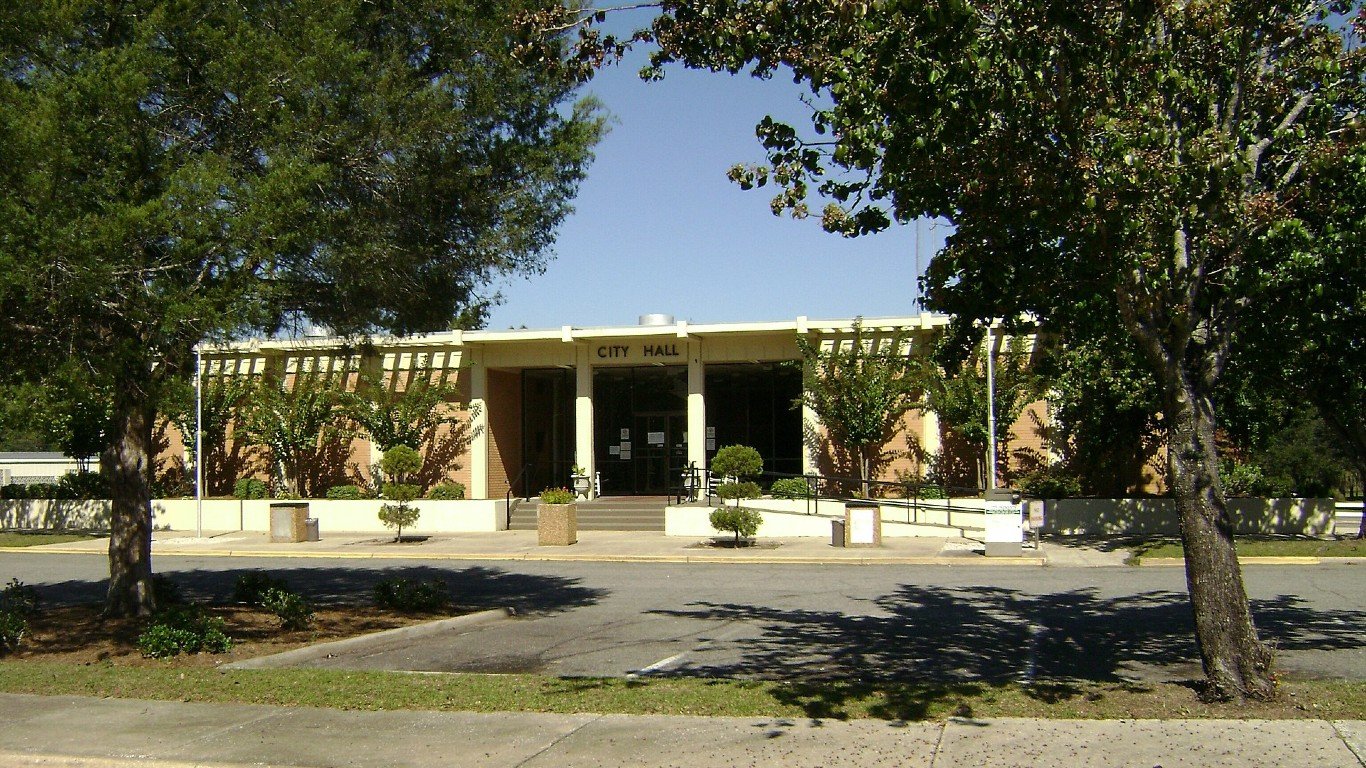
7. Nashville
> Violent crimes in 2020: 1,053.9 per 100,000 (51 total)
> Property crimes in 2020: 4,732.4 per 100,000 (229 total)
> Median household income: $35,530
> Poverty rate: 14.5%
> Population: 4,839
[in-text-ad-2]
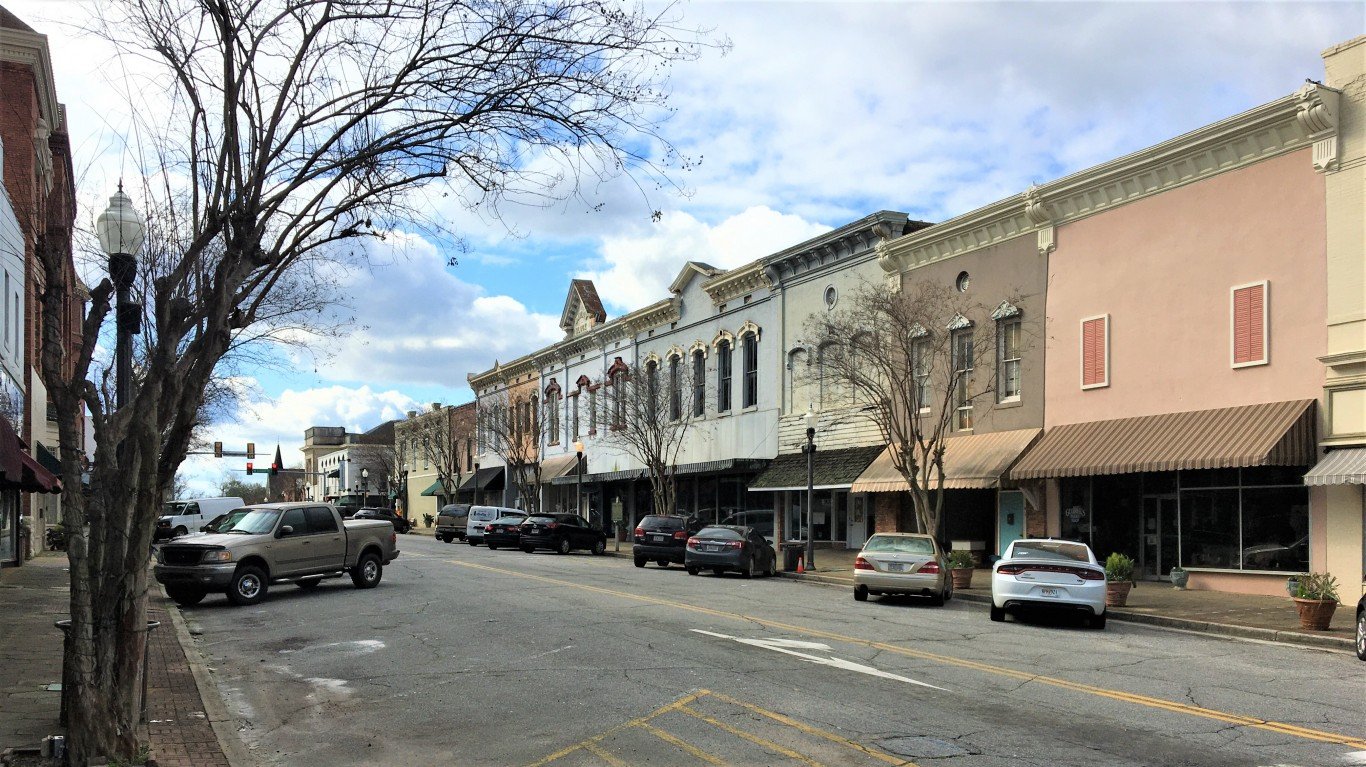
6. Americus
> Violent crimes in 2020: 1,079.8 per 100,000 (161 total)
> Property crimes in 2020: 5,231.4 per 100,000 (780 total)
> Median household income: $33,347
> Poverty rate: 5.3%
> Population: 14,910
5. Griffin
> Violent crimes in 2020: 1,132.9 per 100,000 (258 total)
> Property crimes in 2020: 4,786.4 per 100,000 (1,090 total)
> Median household income: $36,890
> Poverty rate: 4.2%
> Population: 22,773
[in-text-ad]

4. Newnan
> Violent crimes in 2020: 1,247.1 per 100,000 (532 total)
> Property crimes in 2020: 1,962.1 per 100,000 (837 total)
> Median household income: $63,606
> Poverty rate: 5.2%
> Population: 42,658
[recirclink id=886163]
3. Garden City
> Violent crimes in 2020: 1,376.8 per 100,000 (120 total)
> Property crimes in 2020: 4,612.2 per 100,000 (402 total)
> Median household income: $46,772
> Poverty rate: 6.3%
> Population: 8,716
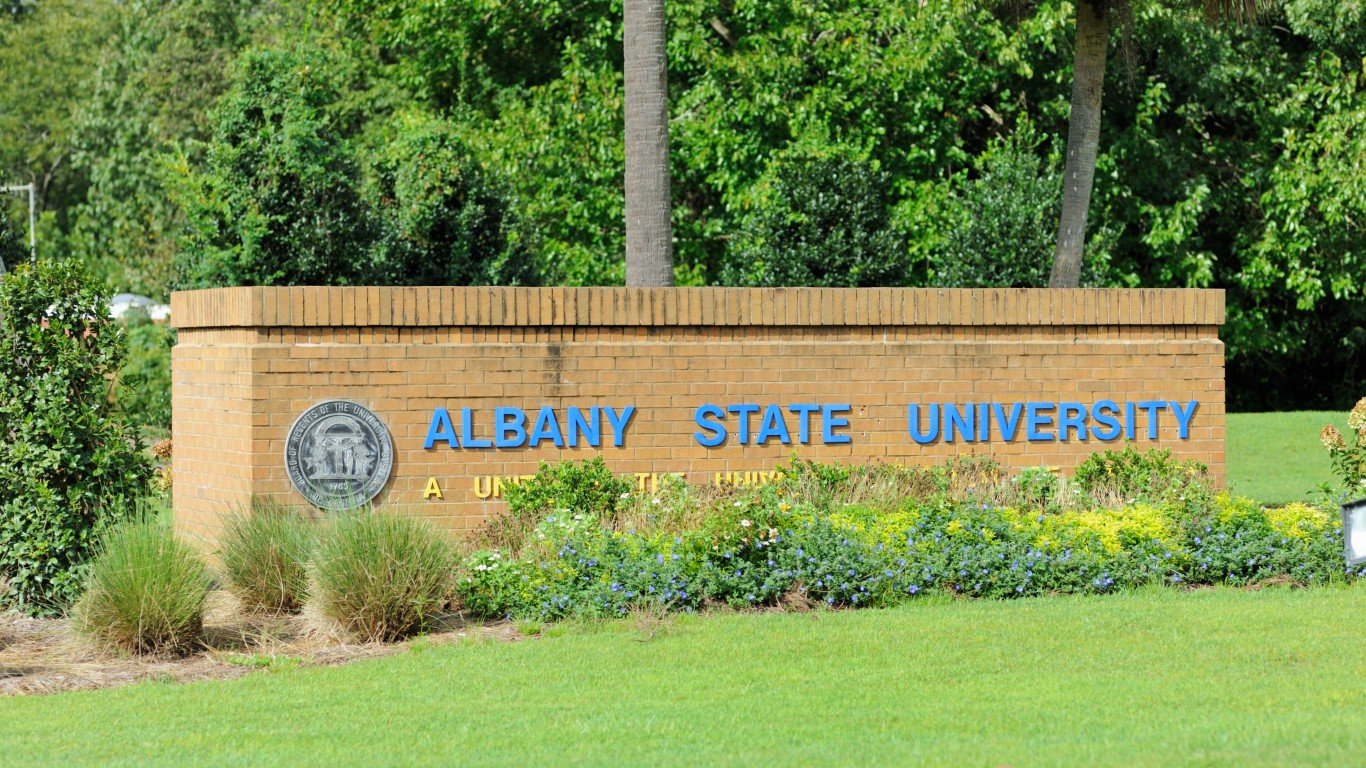
2. Albany
> Violent crimes in 2020: 1,724.3 per 100,000 (1,234 total)
> Property crimes in 2020: 4,398.7 per 100,000 (3,148 total)
> Median household income: $36,615
> Poverty rate: 4%
> Population: 71,567
[in-text-ad-2]
1. College Park
> Violent crimes in 2020: 1,756.1 per 100,000 (267 total)
> Property crimes in 2020: 6,143.1 per 100,000 (934 total)
> Median household income: $35,470
> Poverty rate: 5.6%
> Population: 15,204
Contact [email protected] for any questions or corrections.