
The United States has some of the highest levels of income and wealth inequality in the world. U.S. Federal Reserve data shows that the wealthiest 10% of Americans control $93.8 trillion, more than double the $40.3 trillion in the hands of the remaining 90% of Americans.
The income and wealth divide only appears to be growing wider. A January 2020 report published by the Pew Research Center found that over the last four decades, income growth for the top 5% of families by earnings has far outpaced income growth for families in lower income strata.
In a nation as large as the U.S., varied levels of income inequality may be expected. While some parts have wide income gaps, other parts of the country are defined, at least in part, by their relative income equality.
Using data from the U.S. Census Bureau’s 2019 American Community Survey, 24/7 Wall St. identified the 50 U.S. ZIP codes with the smallest income gaps. ZIP codes are ranked by their Gini coefficient, a measure of income inequality based on the distribution of income across a population on a 0 to 1 scale — 0 representing perfect equality and 1 representing the highest possible level of inequality.
Among the ZIP codes on this list, Gini scores range from 0.308 down to 0.225 — well below the national Gini coefficient of 0.482. The places on this list span the country but tend to be concentrated in the South. Six ZIP codes on this list are located in Virginia alone.
Incomes are generally high in the places on this list. All but a handful of the 50 ZIP codes with the lowest income inequality have a higher median household income than the national median of $62,843.
Causes behind rising inequality are complex and varied. A report published by the National Bureau of Economic Research ties the rising disparity to a range of economic factors, including globalization, technological advancement, a stagnant minimum wage, and the decline of labor unions.
Click here to see America’s zip codes with the smallest income gaps
Click here to read our detailed methodology

50. 35043
> Location: Chelsea, Alabama
> Gini index: 0.308
> Avg. household income, top 20%: $191,172 — 6,763rd highest of 16,708 zip codes
> Avg. household income, bottom 20%: $32,972 — 735th highest of 16,708 zip codes
> Share of all income in 35043 that went to top 20%: 37.5% — 65th lowest of 16,708 zip codes
> Share of all income in 35043 that went to bottom 20%: 6.5% — 139th highest of 16,708 zip codes (tied)
> Median household income: $100,864 — 1,841st highest of 16,741 zip codes
[in-text-ad]

49. 33194
> Location: Miami, Florida
> Gini index: 0.308
> Avg. household income, top 20%: $226,951 — 4,284th highest of 16,708 zip codes
> Avg. household income, bottom 20%: $38,117 — 336th highest of 16,708 zip codes
> Share of all income in 33194 that went to top 20%: 37.1% — 47th lowest of 16,708 zip codes (tied)
> Share of all income in 33194 that went to bottom 20%: 6.2% — 228th highest of 16,708 zip codes (tied)
> Median household income: $118,125 — 935th highest of 16,741 zip codes
[recirclink id=887395]

48. 64029
> Location: Grain Valley, Missouri
> Gini index: 0.308
> Avg. household income, top 20%: $156,822 — 6,025th lowest of 16,708 zip codes
> Avg. household income, bottom 20%: $27,969 — 1,520th highest of 16,708 zip codes
> Share of all income in 64029 that went to top 20%: 37.7% — 86th lowest of 16,708 zip codes (tied)
> Share of all income in 64029 that went to bottom 20%: 6.7% — 87th highest of 16,708 zip codes
> Median household income: $78,320 — 4,215th highest of 16,741 zip codes

47. 20112
> Location: Buckhall, Virginia
> Gini index: 0.308
> Avg. household income, top 20%: $311,436 — 1,716th highest of 16,708 zip codes
> Avg. household income, bottom 20%: $56,920 — 25th highest of 16,708 zip codes
> Share of all income in 20112 that went to top 20%: 37.3% — 60th lowest of 16,708 zip codes
> Share of all income in 20112 that went to bottom 20%: 6.8% — 66th highest of 16,708 zip codes (tied)
> Median household income: $154,245 — 239th highest of 16,741 zip codes
[in-text-ad-2]
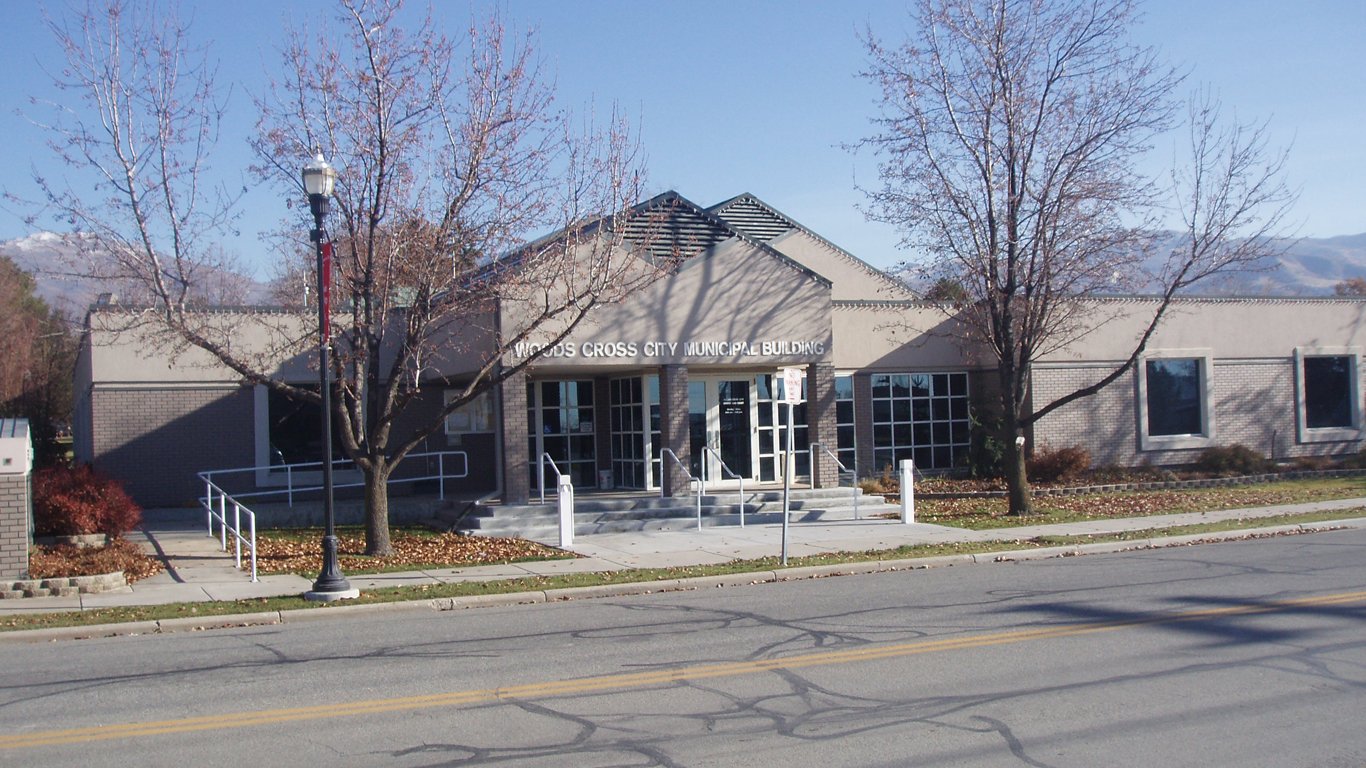
46. 84087
> Location: Woods Cross, Utah
> Gini index: 0.308
> Avg. household income, top 20%: $168,371 — 7,517th lowest of 16,708 zip codes
> Avg. household income, bottom 20%: $29,755 — 1,175th highest of 16,708 zip codes
> Share of all income in 84087 that went to top 20%: 36.9% — 40th lowest of 16,708 zip codes
> Share of all income in 84087 that went to bottom 20%: 6.5% — 122nd highest of 16,708 zip codes (tied)
> Median household income: $84,873 — 3,274th highest of 16,741 zip codes
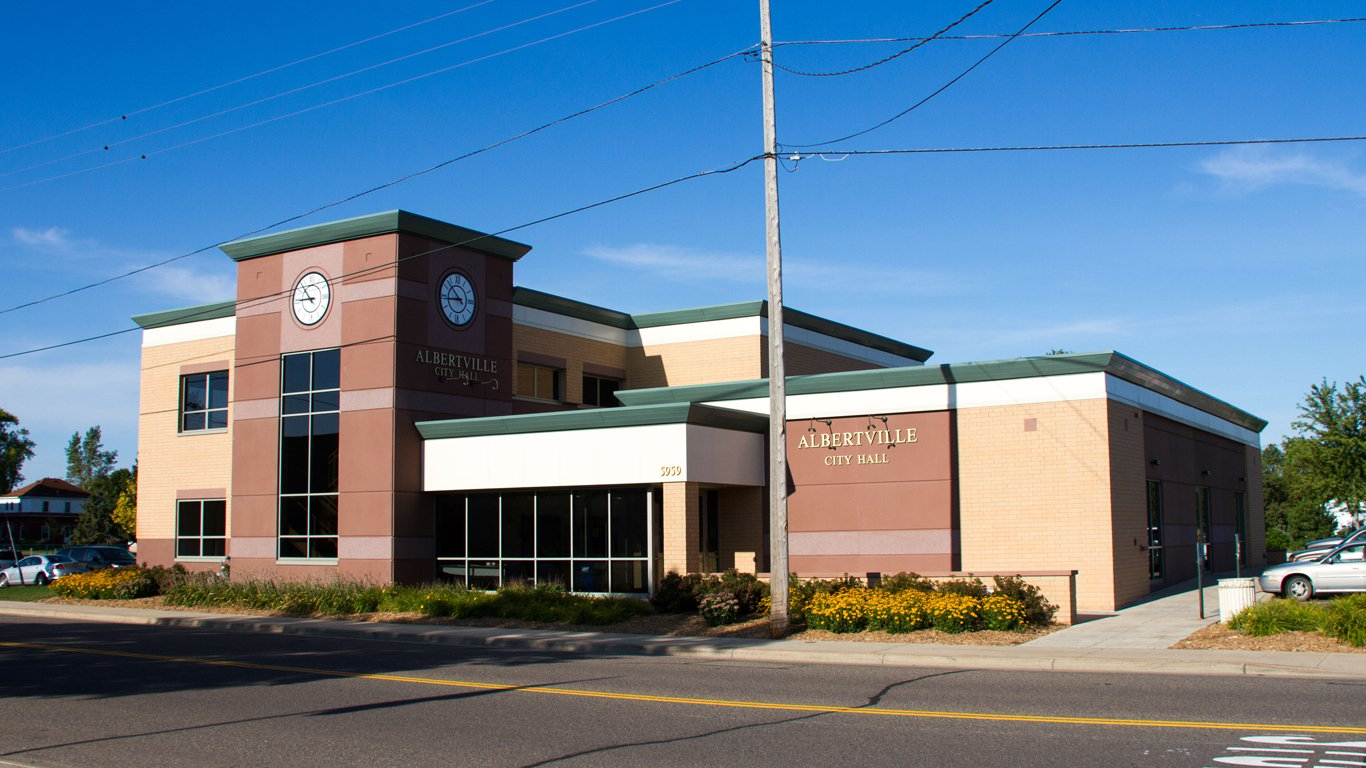
45. 55301
> Location: Albertville, Minnesota
> Gini index: 0.307
> Avg. household income, top 20%: $194,586 — 6,492nd highest of 16,708 zip codes
> Avg. household income, bottom 20%: $35,161 — 528th highest of 16,708 zip codes
> Share of all income in 55301 that went to top 20%: 36.9% — 38th lowest of 16,708 zip codes
> Share of all income in 55301 that went to bottom 20%: 6.7% — 101st highest of 16,708 zip codes
> Median household income: $96,286 — 2,144th highest of 16,741 zip codes
[in-text-ad]
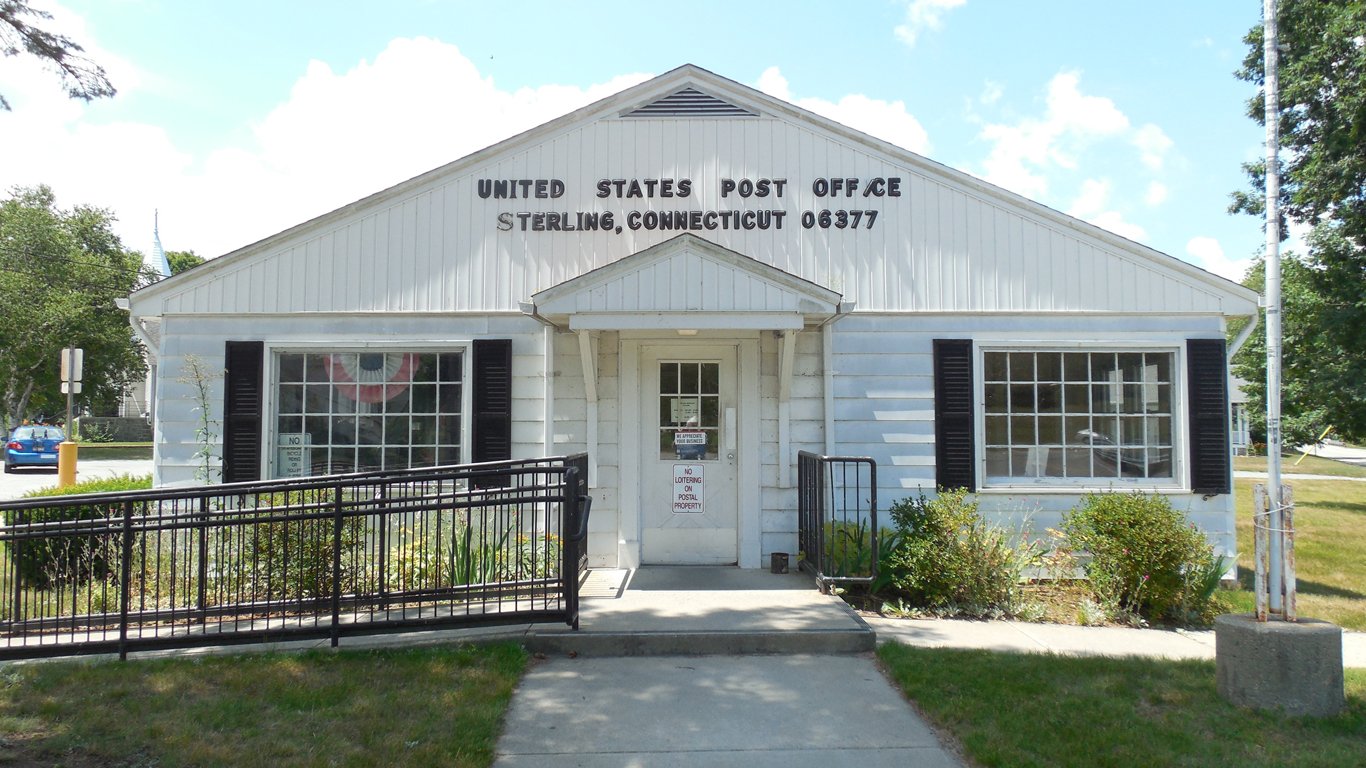
44. 06377
> Location: Sterling, Connecticut
> Gini index: 0.307
> Avg. household income, top 20%: $150,293 — 5,056th lowest of 16,708 zip codes
> Avg. household income, bottom 20%: $24,147 — 2,576th highest of 16,708 zip codes (tied)
> Share of all income in 06377 that went to top 20%: 35.8% — 12th lowest of 16,708 zip codes
> Share of all income in 06377 that went to bottom 20%: 5.8% — 484th highest of 16,708 zip codes (tied)
> Median household income: $83,102 — 3,479th highest of 16,741 zip codes
[recirclink id=848904]

43. 55376
> Location: St. Michael, Minnesota
> Gini index: 0.306
> Avg. household income, top 20%: $218,010 — 4,794th highest of 16,708 zip codes
> Avg. household income, bottom 20%: $35,062 — 537th highest of 16,708 zip codes (tied)
> Share of all income in 55376 that went to top 20%: 37.0% — 42nd lowest of 16,708 zip codes (tied)
> Share of all income in 55376 that went to bottom 20%: 5.9% — 355th highest of 16,708 zip codes (tied)
> Median household income: $114,409 — 1,063rd highest of 16,741 zip codes
42. 75181
> Location: Mesquite, Texas
> Gini index: 0.306
> Avg. household income, top 20%: $173,847 — 8,169th lowest of 16,708 zip codes (tied)
> Avg. household income, bottom 20%: $31,245 — 973rd highest of 16,708 zip codes
> Share of all income in 75181 that went to top 20%: 37.1% — 50th lowest of 16,708 zip codes (tied)
> Share of all income in 75181 that went to bottom 20%: 6.7% — 94th highest of 16,708 zip codes (tied)
> Median household income: $88,149 — 2,881st highest of 16,741 zip codes
[in-text-ad-2]

41. 04419
> Location: Carmel, Maine
> Gini index: 0.306
> Avg. household income, top 20%: $145,347 — 4,343rd lowest of 16,708 zip codes
> Avg. household income, bottom 20%: $23,993 — 2,640th highest of 16,708 zip codes
> Share of all income in 04419 that went to top 20%: 36.7% — 31st lowest of 16,708 zip codes (tied)
> Share of all income in 04419 that went to bottom 20%: 6.1% — 296th highest of 16,708 zip codes (tied)
> Median household income: $78,309 — 4,218th highest of 16,741 zip codes

40. 98205
> Location: Lake Stevens, Washington
> Gini index: 0.306
> Avg. household income, top 20%: $198,166 — 6,187th highest of 16,708 zip codes
> Avg. household income, bottom 20%: $35,551 — 512th highest of 16,708 zip codes
> Share of all income in 98205 that went to top 20%: 37.6% — 77th lowest of 16,708 zip codes (tied)
> Share of all income in 98205 that went to bottom 20%: 6.7% — 83rd highest of 16,708 zip codes (tied)
> Median household income: $96,233 — 2,150th highest of 16,741 zip codes
[in-text-ad]

39. 17520
> Location: East Petersburg, Pennsylvania
> Gini index: 0.303
> Avg. household income, top 20%: $157,522 — 6,113th lowest of 16,708 zip codes
> Avg. household income, bottom 20%: $24,800 — 2,349th highest of 16,708 zip codes (tied)
> Share of all income in 17520 that went to top 20%: 37.6% — 80th lowest of 16,708 zip codes (tied)
> Share of all income in 17520 that went to bottom 20%: 5.9% — 378th highest of 16,708 zip codes (tied)
> Median household income: $77,770 — 4,292nd highest of 16,741 zip codes
[recirclink id=488561]
38. 20769
> Location: Glenn Dale, Maryland
> Gini index: 0.303
> Avg. household income, top 20%: $293,485 — 2,065th highest of 16,708 zip codes
> Avg. household income, bottom 20%: $52,526 — 57th highest of 16,708 zip codes
> Share of all income in 20769 that went to top 20%: 36.8% — 33rd lowest of 16,708 zip codes
> Share of all income in 20769 that went to bottom 20%: 6.6% — 110th highest of 16,708 zip codes (tied)
> Median household income: $150,156 — 276th highest of 16,741 zip codes
37. 20136
> Location: Linton Hall, Virginia
> Gini index: 0.302
> Avg. household income, top 20%: $299,388 — 1,934th highest of 16,708 zip codes
> Avg. household income, bottom 20%: $56,916 — 26th highest of 16,708 zip codes
> Share of all income in 20136 that went to top 20%: 37.0% — 42nd lowest of 16,708 zip codes (tied)
> Share of all income in 20136 that went to bottom 20%: 7.0% — 43rd highest of 16,708 zip codes
> Median household income: $145,575 — 337th highest of 16,741 zip codes
[in-text-ad-2]
36. 03044
> Location: Fremont, New Hampshire
> Gini index: 0.302
> Avg. household income, top 20%: $215,806 — 4,921st highest of 16,708 zip codes
> Avg. household income, bottom 20%: $40,477 — 234th highest of 16,708 zip codes
> Share of all income in 03044 that went to top 20%: 37.2% — 52nd lowest of 16,708 zip codes (tied)
> Share of all income in 03044 that went to bottom 20%: 7.0% — 51st highest of 16,708 zip codes (tied)
> Median household income: $110,344 — 1,228th highest of 16,741 zip codes
35. 13637
> Location: Calcium, New York
> Gini index: 0.302
> Avg. household income, top 20%: $126,163 — 1,866th lowest of 16,708 zip codes
> Avg. household income, bottom 20%: $26,601 — 1,825th highest of 16,708 zip codes (tied)
> Share of all income in 13637 that went to top 20%: 38.7% — 201st lowest of 16,708 zip codes (tied)
> Share of all income in 13637 that went to bottom 20%: 8.2% — 10th highest of 16,708 zip codes
> Median household income: $55,046 — 7,011th lowest of 16,741 zip codes
[in-text-ad]
34. 27571
> Location: Rolesville, North Carolina
> Gini index: 0.301
> Avg. household income, top 20%: $213,626 — 5,087th highest of 16,708 zip codes
> Avg. household income, bottom 20%: $36,312 — 450th highest of 16,708 zip codes
> Share of all income in 27571 that went to top 20%: 35.9% — 13th lowest of 16,708 zip codes
> Share of all income in 27571 that went to bottom 20%: 6.1% — 277th highest of 16,708 zip codes (tied)
> Median household income: $118,558 — 921st highest of 16,741 zip codes
[recirclink id=920281]

33. 84315
> Location: Hooper, Utah
> Gini index: 0.301
> Avg. household income, top 20%: $200,644 — 5,999th highest of 16,708 zip codes
> Avg. household income, bottom 20%: $39,741 — 257th highest of 16,708 zip codes
> Share of all income in 84315 that went to top 20%: 37.7% — 89th lowest of 16,708 zip codes
> Share of all income in 84315 that went to bottom 20%: 7.5% — 22nd highest of 16,708 zip codes
> Median household income: $96,625 — 2,105th highest of 16,741 zip codes
32. 55046
> Location: Lonsdale, Minnesota
> Gini index: 0.301
> Avg. household income, top 20%: $163,377 — 6,877th lowest of 16,708 zip codes
> Avg. household income, bottom 20%: $28,711 — 1,377th highest of 16,708 zip codes
> Share of all income in 55046 that went to top 20%: 35.9% — 14th lowest of 16,708 zip codes
> Share of all income in 55046 that went to bottom 20%: 6.3% — 191st highest of 16,708 zip codes (tied)
> Median household income: $87,917 — 2,905th highest of 16,741 zip codes
[in-text-ad-2]
31. 20616
> Location: Bryans Road, Maryland
> Gini index: 0.301
> Avg. household income, top 20%: $189,591 — 6,909th highest of 16,708 zip codes
> Avg. household income, bottom 20%: $36,064 — 466th highest of 16,708 zip codes
> Share of all income in 20616 that went to top 20%: 36.5% — 24th lowest of 16,708 zip codes
> Share of all income in 20616 that went to bottom 20%: 6.9% — 56th highest of 16,708 zip codes
> Median household income: $97,375 — 2,057th highest of 16,741 zip codes

30. 18610
> Location: Sierra View, Pennsylvania
> Gini index: 0.3
> Avg. household income, top 20%: $135,650 — 2,955th lowest of 16,708 zip codes
> Avg. household income, bottom 20%: $27,152 — 1,688th highest of 16,708 zip codes
> Share of all income in 18610 that went to top 20%: 37.6% — 74th lowest of 16,708 zip codes (tied)
> Share of all income in 18610 that went to bottom 20%: 7.5% — 19th highest of 16,708 zip codes (tied)
> Median household income: $66,606 — 6,383rd highest of 16,741 zip codes
[in-text-ad]
29. 22656
> Location: Stephenson, Virginia
> Gini index: 0.299
> Avg. household income, top 20%: $169,174 — 7,620th lowest of 16,708 zip codes
> Avg. household income, bottom 20%: $27,641 — 1,591st highest of 16,708 zip codes
> Share of all income in 22656 that went to top 20%: 35.1% — 10th lowest of 16,708 zip codes
> Share of all income in 22656 that went to bottom 20%: 5.7% — 521st highest of 16,708 zip codes (tied)
> Median household income: $95,655 — 2,194th highest of 16,741 zip codes
[recirclink id=970377]
28. 23801
> Location: Fort Lee, Virginia
> Gini index: 0.299
> Avg. household income, top 20%: $146,194 — 4,464th lowest of 16,708 zip codes
> Avg. household income, bottom 20%: $27,971 — 1,519th highest of 16,708 zip codes
> Share of all income in 23801 that went to top 20%: 37.1% — 50th lowest of 16,708 zip codes (tied)
> Share of all income in 23801 that went to bottom 20%: 7.1% — 37th highest of 16,708 zip codes (tied)
> Median household income: $70,114 — 5,666th highest of 16,741 zip codes

27. 84045
> Location: Saratoga Springs, Utah
> Gini index: 0.299
> Avg. household income, top 20%: $208,148 — 5,444th highest of 16,708 zip codes
> Avg. household income, bottom 20%: $40,936 — 215th highest of 16,708 zip codes
> Share of all income in 84045 that went to top 20%: 37.2% — 56th lowest of 16,708 zip codes
> Share of all income in 84045 that went to bottom 20%: 7.3% — 25th highest of 16,708 zip codes
> Median household income: $103,287 — 1,662nd highest of 16,741 zip codes (tied)
[in-text-ad-2]

26. 55011
> Location: East Bethel, Minnesota
> Gini index: 0.298
> Avg. household income, top 20%: $195,670 — 6,397th highest of 16,708 zip codes
> Avg. household income, bottom 20%: $36,386 — 440th highest of 16,708 zip codes
> Share of all income in 55011 that went to top 20%: 36.3% — 20th lowest of 16,708 zip codes
> Share of all income in 55011 that went to bottom 20%: 6.8% — 80th highest of 16,708 zip codes (tied)
> Median household income: $104,438 — 1,590th highest of 16,741 zip codes

25. 17532
> Location: Holtwood, Pennsylvania
> Gini index: 0.297
> Avg. household income, top 20%: $144,869 — 4,280th lowest of 16,708 zip codes
> Avg. household income, bottom 20%: $27,075 — 1,708th highest of 16,708 zip codes
> Share of all income in 17532 that went to top 20%: 36.1% — 17th lowest of 16,708 zip codes
> Share of all income in 17532 that went to bottom 20%: 6.8% — 80th highest of 16,708 zip codes (tied)
> Median household income: $74,671 — 4,830th highest of 16,741 zip codes
[in-text-ad]

24. 95391
> Location: Mountain House, California
> Gini index: 0.297
> Avg. household income, top 20%: $280,198 — 2,387th highest of 16,708 zip codes
> Avg. household income, bottom 20%: $51,772 — 59th highest of 16,708 zip codes
> Share of all income in 95391 that went to top 20%: 36.8% — 37th lowest of 16,708 zip codes
> Share of all income in 95391 that went to bottom 20%: 6.8% — 66th highest of 16,708 zip codes (tied)
> Median household income: $138,500 — 423rd highest of 16,741 zip codes
[recirclink id=887395]

23. 22642
> Location: Apple Mountain Lake, Virginia
> Gini index: 0.296
> Avg. household income, top 20%: $178,187 — 8,060th highest of 16,708 zip codes
> Avg. household income, bottom 20%: $40,693 — 225th highest of 16,708 zip codes
> Share of all income in 22642 that went to top 20%: 36.9% — 41st lowest of 16,708 zip codes
> Share of all income in 22642 that went to bottom 20%: 8.4% — 7th highest of 16,708 zip codes
> Median household income: $82,177 — 3,629th highest of 16,741 zip codes

22. 50035
> Location: Bondurant, Iowa
> Gini index: 0.296
> Avg. household income, top 20%: $198,723 — 6,145th highest of 16,708 zip codes (tied)
> Avg. household income, bottom 20%: $40,908 — 218th highest of 16,708 zip codes
> Share of all income in 50035 that went to top 20%: 37.3% — 61st lowest of 16,708 zip codes
> Share of all income in 50035 that went to bottom 20%: 7.7% — 16th highest of 16,708 zip codes
> Median household income: $99,115 — 1,953rd highest of 16,741 zip codes
[in-text-ad-2]

21. 36250
> Location: Alexandria, Alabama
> Gini index: 0.295
> Avg. household income, top 20%: $135,995 — 3,004th lowest of 16,708 zip codes
> Avg. household income, bottom 20%: $25,270 — 2,216th highest of 16,708 zip codes
> Share of all income in 36250 that went to top 20%: 36.3% — 19th lowest of 16,708 zip codes
> Share of all income in 36250 that went to bottom 20%: 6.7% — 83rd highest of 16,708 zip codes (tied)
> Median household income: $70,813 — 5,523rd highest of 16,741 zip codes (tied)

20. 20764
> Location: Shady Side, Maryland
> Gini index: 0.293
> Avg. household income, top 20%: $194,767 — 6,476th highest of 16,708 zip codes
> Avg. household income, bottom 20%: $37,929 — 345th highest of 16,708 zip codes
> Share of all income in 20764 that went to top 20%: 36.8% — 35th lowest of 16,708 zip codes
> Share of all income in 20764 that went to bottom 20%: 7.2% — 32nd highest of 16,708 zip codes
> Median household income: $100,491 — 1,864th highest of 16,741 zip codes
[in-text-ad]

19. 95742
> Location: Rancho Cordova, California
> Gini index: 0.293
> Avg. household income, top 20%: $235,547 — 3,833rd highest of 16,708 zip codes
> Avg. household income, bottom 20%: $41,393 — 202nd highest of 16,708 zip codes
> Share of all income in 95742 that went to top 20%: 34.8% — 8th lowest of 16,708 zip codes
> Share of all income in 95742 that went to bottom 20%: 6.1% — 270th highest of 16,708 zip codes (tied)
> Median household income: $132,636 — 539th highest of 16,741 zip codes
[recirclink id=848904]
18. 49650
> Location: Hardwood Acres, Michigan
> Gini index: 0.291
> Avg. household income, top 20%: $140,899 — 3,708th lowest of 16,708 zip codes
> Avg. household income, bottom 20%: $24,054 — 2,613th highest of 16,708 zip codes
> Share of all income in 49650 that went to top 20%: 34.7% — 7th lowest of 16,708 zip codes
> Share of all income in 49650 that went to bottom 20%: 5.9% — 378th highest of 16,708 zip codes (tied)
> Median household income: $81,731 — 3,692nd highest of 16,741 zip codes

17. 23665
> Location: Bethel Manor, Virginia
> Gini index: 0.288
> Avg. household income, top 20%: $133,491 — 2,680th lowest of 16,708 zip codes
> Avg. household income, bottom 20%: $26,848 — 1,758th highest of 16,708 zip codes
> Share of all income in 23665 that went to top 20%: 36.0% — 16th lowest of 16,708 zip codes
> Share of all income in 23665 that went to bottom 20%: 7.3% — 27th highest of 16,708 zip codes
> Median household income: $66,350 — 6,438th highest of 16,741 zip codes
[in-text-ad-2]

16. 08641
> Location: McGuire, New Jersey
> Gini index: 0.287
> Avg. household income, top 20%: $139,745 — 3,547th lowest of 16,708 zip codes
> Avg. household income, bottom 20%: $31,981 — 874th highest of 16,708 zip codes
> Share of all income in 08641 that went to top 20%: 36.9% — 39th lowest of 16,708 zip codes
> Share of all income in 08641 that went to bottom 20%: 8.4% — 6th highest of 16,708 zip codes
> Median household income: $67,500 — 6,189th highest of 16,741 zip codes (tied)

15. 75054
> Location: Grand Prairie, Texas
> Gini index: 0.287
> Avg. household income, top 20%: $265,345 — 2,789th highest of 16,708 zip codes
> Avg. household income, bottom 20%: $54,768 — 39th highest of 16,708 zip codes
> Share of all income in 75054 that went to top 20%: 36.4% — 21st lowest of 16,708 zip codes
> Share of all income in 75054 that went to bottom 20%: 7.5% — 21st highest of 16,708 zip codes
> Median household income: $133,802 — 512th highest of 16,741 zip codes
[in-text-ad]
14. 32798
> Location: Zellwood, Florida
> Gini index: 0.286
> Avg. household income, top 20%: $103,751 — 423rd lowest of 16,708 zip codes
> Avg. household income, bottom 20%: $24,011 — 2,630th highest of 16,708 zip codes
> Share of all income in 32798 that went to top 20%: 36.7% — 29th lowest of 16,708 zip codes
> Share of all income in 32798 that went to bottom 20%: 8.5% — 5th highest of 16,708 zip codes
> Median household income: $48,086 — 4,452nd lowest of 16,741 zip codes
[recirclink id=488174]

13. 89179
> Location: Enterprise, Nevada
> Gini index: 0.283
> Avg. household income, top 20%: $190,261 — 6,850th highest of 16,708 zip codes
> Avg. household income, bottom 20%: $41,268 — 204th highest of 16,708 zip codes
> Share of all income in 89179 that went to top 20%: 36.5% — 25th lowest of 16,708 zip codes
> Share of all income in 89179 that went to bottom 20%: 7.9% — 13th highest of 16,708 zip codes
> Median household income: $99,662 — 1,918th highest of 16,741 zip codes

12. 92310
> Location: Fort Irwin, California
> Gini index: 0.283
> Avg. household income, top 20%: $111,004 — 711th lowest of 16,708 zip codes
> Avg. household income, bottom 20%: $25,333 — 2,196th highest of 16,708 zip codes (tied)
> Share of all income in 92310 that went to top 20%: 36.7% — 30th lowest of 16,708 zip codes
> Share of all income in 92310 that went to bottom 20%: 8.4% — 8th highest of 16,708 zip codes (tied)
> Median household income: $54,787 — 6,905th lowest of 16,741 zip codes
[in-text-ad-2]
11. 28543
> Location: Jacksonville, North Carolina
> Gini index: 0.282
> Avg. household income, top 20%: $78,557 — 26th lowest of 16,708 zip codes
> Avg. household income, bottom 20%: $18,212 — 5,792nd highest of 16,708 zip codes
> Share of all income in 28543 that went to top 20%: 36.2% — 18th lowest of 16,708 zip codes
> Share of all income in 28543 that went to bottom 20%: 8.4% — 8th highest of 16,708 zip codes (tied)
> Median household income: $39,229 — 1,856th lowest of 16,741 zip codes (tied)

10. 84005
> Location: Eagle Mountain, Utah
> Gini index: 0.281
> Avg. household income, top 20%: $165,265 — 7,114th lowest of 16,708 zip codes
> Avg. household income, bottom 20%: $36,373 — 441st highest of 16,708 zip codes
> Share of all income in 84005 that went to top 20%: 36.4% — 22nd lowest of 16,708 zip codes (tied)
> Share of all income in 84005 that went to bottom 20%: 8.0% — 11th highest of 16,708 zip codes
> Median household income: $82,721 — 3,550th highest of 16,741 zip codes
[in-text-ad]

9. 36362
> Location: Fort Rucker, Alabama
> Gini index: 0.28
> Avg. household income, top 20%: $121,531 — 1,446th lowest of 16,708 zip codes
> Avg. household income, bottom 20%: $24,677 — 2,389th highest of 16,708 zip codes
> Share of all income in 36362 that went to top 20%: 34.8% — 9th lowest of 16,708 zip codes
> Share of all income in 36362 that went to bottom 20%: 7.1% — 41st highest of 16,708 zip codes
> Median household income: $70,024 — 5,684th highest of 16,741 zip codes
[recirclink id=920281]

8. 98315
> Location: Bangor Base, Washington
> Gini index: 0.28
> Avg. household income, top 20%: $100,175 — 294th lowest of 16,708 zip codes
> Avg. household income, bottom 20%: $16,309 — 7,290th highest of 16,708 zip codes
> Share of all income in 98315 that went to top 20%: 33.4% — 3rd lowest of 16,708 zip codes
> Share of all income in 98315 that went to bottom 20%: 5.4% — 901st highest of 16,708 zip codes (tied)
> Median household income: $57,134 — 7,672nd lowest of 16,741 zip codes (tied)

7. 04076
> Location: Shapleigh, Maine
> Gini index: 0.279
> Avg. household income, top 20%: $124,028 — 1,645th lowest of 16,708 zip codes
> Avg. household income, bottom 20%: $24,455 — 2,466th highest of 16,708 zip codes (tied)
> Share of all income in 04076 that went to top 20%: 34.2% — 5th lowest of 16,708 zip codes
> Share of all income in 04076 that went to bottom 20%: 6.7% — 83rd highest of 16,708 zip codes (tied)
> Median household income: $72,955 — 5,123rd highest of 16,741 zip codes (tied)
[in-text-ad-2]

6. 89085
> Location: North Las Vegas, Nevada
> Gini index: 0.271
> Avg. household income, top 20%: $187,979 — 7,066th highest of 16,708 zip codes
> Avg. household income, bottom 20%: $39,730 — 258th highest of 16,708 zip codes
> Share of all income in 89085 that went to top 20%: 33.6% — 4th lowest of 16,708 zip codes
> Share of all income in 89085 that went to bottom 20%: 7.1% — 37th highest of 16,708 zip codes (tied)
> Median household income: $120,194 — 872nd highest of 16,741 zip codes

5. 43002
> Location: Columbus, Ohio
> Gini index: 0.267
> Avg. household income, top 20%: $148,295 — 4,745th lowest of 16,708 zip codes
> Avg. household income, bottom 20%: $38,326 — 322nd highest of 16,708 zip codes
> Share of all income in 43002 that went to top 20%: 35.9% — 15th lowest of 16,708 zip codes
> Share of all income in 43002 that went to bottom 20%: 9.3% — 3rd highest of 16,708 zip codes
> Median household income: $70,303 — 5,624th highest of 16,741 zip codes (tied)
[in-text-ad]

4. 80927
> Location: Colorado Springs, Colorado
> Gini index: 0.247
> Avg. household income, top 20%: $213,809 — 5,070th highest of 16,708 zip codes
> Avg. household income, bottom 20%: $61,637 — 8th highest of 16,708 zip codes
> Share of all income in 80927 that went to top 20%: 34.4% — 6th lowest of 16,708 zip codes
> Share of all income in 80927 that went to bottom 20%: 9.9% — 2nd highest of 16,708 zip codes
> Median household income: $108,136 — 1,363rd highest of 16,741 zip codes
[recirclink id=970377]

3. 81615
> Location: Snowmass Village, Colorado
> Gini index: 0.246
> Avg. household income, top 20%: N/A
> Avg. household income, bottom 20%: N/A
> Share of all income in 81615 that went to top 20%: N/A
> Share of all income in 81615 that went to bottom 20%: N/A
> Median household income: $70,634 — 5,560th highest of 16,741 zip codes

2. 31807
> Location: Ellerslie, Georgia
> Gini index: 0.242
> Avg. household income, top 20%: $152,066 — 5,318th lowest of 16,708 zip codes (tied)
> Avg. household income, bottom 20%: $40,333 — 239th highest of 16,708 zip codes
> Share of all income in 31807 that went to top 20%: 32.3% — the lowest of 16,708 zip codes
> Share of all income in 31807 that went to bottom 20%: 8.6% — 4th highest of 16,708 zip codes
> Median household income: $93,632 — 2,366th highest of 16,741 zip codes
[in-text-ad-2]

1. 85540
> Location: Morenci, Arizona
> Gini index: 0.225
> Avg. household income, top 20%: $139,213 — 3,445th lowest of 16,708 zip codes (tied)
> Avg. household income, bottom 20%: $43,941 — 153rd highest of 16,708 zip codes
> Share of all income in 85540 that went to top 20%: 33.1% — 2nd lowest of 16,708 zip codes
> Share of all income in 85540 that went to bottom 20%: 10.4% — the highest of 16,708 zip codes
> Median household income: $72,934 — 5,127th highest of 16,741 zip codes (tied)
To determine the ZIP codes with the smallest income gaps in the nation, 24/7 Wall St. reviewed five-year estimates of the Gini Index of income inequality from the U.S. Census Bureau’s 2019 American Community Survey.
The Gini Index of income inequality summarizes income dispersion in an area on a scale from 0 to 1. A value of 0 indicates perfect equality — everyone in the area receives an equal share of income. A value of 1 indicates perfect inequality — only one recipient receives all the income.
We used ZIP Code Tabulation Areas — a census geography type which defines areal representations of United States Postal Service ZIP codes (USPS ZIP codes do not define geographic boundaries but instead are a network of mail delivery routes in a service area). We refer to Census ZCTAs as ZIP codes.
Of the 33,120 ZIP codes the Census publishes data for, 32,989 had boundaries that fell within one of the 50 states or the District of Columbia.
ZIP codes were excluded if the Gini Index was not available in the 2019 ACS, if there were fewer than 1,000 housing units, or if the sampling error associated with a ZIP code’s data was deemed too high.
The sampling error was defined as too high if the coefficient of variation — a statistical assessment of how reliable an estimate is — for a ZIP code’s Gini Index was above 15% and greater than two standard deviations above the mean CV for all ZIP codes’ Gini Indices. We similarly excluded ZIP codes that had a sampling error too high for their population, using the same definition.
The remaining 16,742 places were ranked based on their Gini Index. To break ties, we used the share of aggregate household income earned by the top 20% of households.
Additional information on average household income by quintile, share of aggregate household income by quintile, and median household income are also five-year estimates from the 2019 ACS.
Contact [email protected] for any questions or corrections.