The United States has some of the highest levels of income and wealth inequality in the world. U.S. Federal Reserve data shows that the wealthiest 10% of Americans control $93.8 trillion, more than double the $40.3 trillion in the hands of the remaining 90% of Americans.
The income and wealth divide only appears to be growing wider. A January 2020 report published by the Pew Research Center found that over the last four decades, income growth for the top 5% of families by earnings has far outpaced income growth for families in the lower income strata.
While in a nation as large as the U.S. high levels of income inequality may be expected, there are small pockets of the country in which extreme wealth and extreme poverty exist side by side. Even at the ZIP code level, income inequality can be far more pronounced than it is on average nationwide.
Using data from the U.S. Census Bureau’s 2019 American Community Survey, 24/7 Wall St. identified the ZIP code with the widest income gap in each state. ZIP codes are ranked by their Gini coefficient, a measure of income inequality based on the distribution of income across a population on a 0 to 1 scale — 0 representing perfect equality and 1 representing the highest possible level of inequality.
Though each ZIP code on this list has the highest degree of income inequality in its state, Gini scores vary considerably — from 0.509 up to 0.740. Nationwide, the Gini coefficient stands at 0.482.
Causes behind rising inequality in the United States are complex and varied. A report published by the National Bureau of Economic Research ties the rising disparity to a range of economic factors, including globalization, technological advancement, a stagnant minimum wage, and the decline of labor unions.
Click here to see the zip code with the widest income gaps in every state
Click here to read our detailed methodology

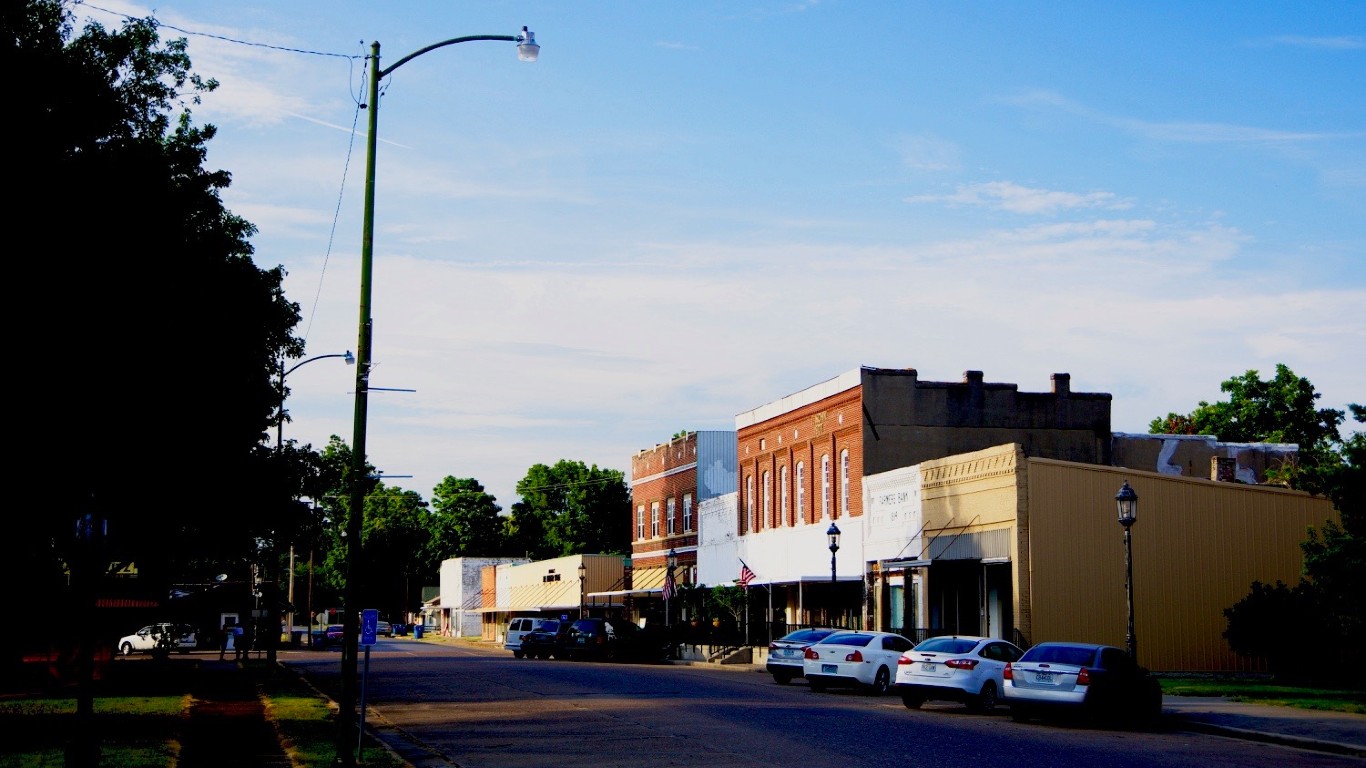
Alabama: 35203
> Location: Birmingham
> Gini index: 0.644 (Alabama: 0.479)
> Avg. household income, top 20%: $192,138 (Alabama: $177,811)
> Avg. household income, bottom 20%: $6,413 (Alabama: $10,538)
> Share of all income in 35203 that went to top 20%: 68.8% (Alabama: 50.9%)
> Share of all income in 35203 that went to bottom 20%: 2.3% (Alabama: 3.0%)
> Median household income: $17,248 (Alabama: $50,536)
[in-text-ad]
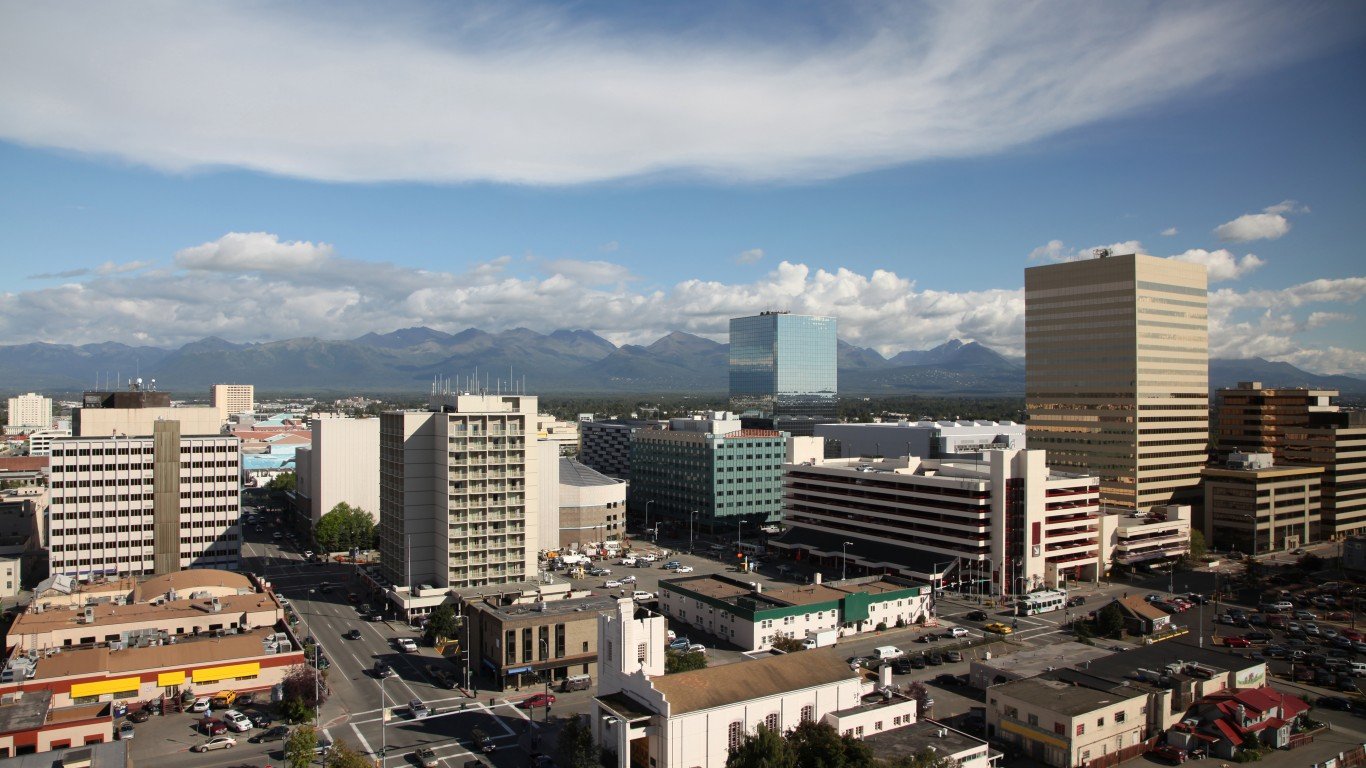
Alaska: 99501
> Location: Anchorage
> Gini index: 0.516 (Alaska: 0.428)
> Avg. household income, top 20%: $237,851 (Alaska: $230,147)
> Avg. household income, bottom 20%: $11,590 (Alaska: $18,977)
> Share of all income in 99501 that went to top 20%: 54.6% (Alaska: 46.7%)
> Share of all income in 99501 that went to bottom 20%: 2.7% (Alaska: 3.8%)
> Median household income: $58,149 (Alaska: $77,640)
[recirclink id=887395]

Arizona: 85147
> Location: Sacaton
> Gini index: 0.631 (Arizona: 0.466)
> Avg. household income, top 20%: $102,785 (Arizona: $202,970)
> Avg. household income, bottom 20%: $0 (Arizona: $13,587)
> Share of all income in 85147 that went to top 20%: 65.3% (Arizona: 50.3%)
> Share of all income in 85147 that went to bottom 20%: 0.0% reported (Arizona: 3.4%)
> Median household income: $17,963 (Arizona: $58,945)

Arkansas: 72202
> Location: Little Rock
> Gini index: 0.576 (Arkansas: 0.477)
> Avg. household income, top 20%: $195,276 (Arkansas: $170,176)
> Avg. household income, bottom 20%: $6,641 (Arkansas: $11,049)
> Share of all income in 72202 that went to top 20%: 59.4% (Arkansas: 51.1%)
> Share of all income in 72202 that went to bottom 20%: 2.0% (Arkansas: 3.3%)
> Median household income: $40,913 (Arkansas: $47,597)
[in-text-ad-2]

California: 90013
> Location: Los Angeles
> Gini index: 0.663 (California: 0.489)
> Avg. household income, top 20%: $222,365 (California: $278,638)
> Avg. household income, bottom 20%: $2,677 (California: $15,827)
> Share of all income in 90013 that went to top 20%: 67.8% (California: 52.1%)
> Share of all income in 90013 that went to bottom 20%: 0.8% (California: 3.0%)
> Median household income: $22,316 (California: $75,235)

Colorado: 80113
> Location: Englewood
> Gini index: 0.6 (Colorado: 0.457)
> Avg. household income, top 20%: $442,215 (Colorado: $239,479)
> Avg. household income, bottom 20%: $14,627 (Colorado: $17,187)
> Share of all income in 80113 that went to top 20%: 64.2% (Colorado: 49.4%)
> Share of all income in 80113 that went to bottom 20%: 2.1% (Colorado: 3.5%)
> Median household income: $68,091 (Colorado: $72,331)
[in-text-ad]

Connecticut: 06830
> Location: Greenwich
> Gini index: 0.616 (Connecticut: 0.496)
> Avg. household income, top 20%: $830,471 (Connecticut: $298,915)
> Avg. household income, bottom 20%: $18,347 (Connecticut: $16,569)
> Share of all income in 06830 that went to top 20%: 65.6% (Connecticut: 52.9%)
> Share of all income in 06830 that went to bottom 20%: 1.5% (Connecticut: 2.9%)
> Median household income: $119,838 (Connecticut: $78,444)
[recirclink id=848904]

Delaware: 19801
> Location: Wilmington
> Gini index: 0.552 (Delaware: 0.454)
> Avg. household income, top 20%: $133,178 (Delaware: $221,085)
> Avg. household income, bottom 20%: $2,567 (Delaware: $15,768)
> Share of all income in 19801 that went to top 20%: 56.2% (Delaware: 49.1%)
> Share of all income in 19801 that went to bottom 20%: 1.1% (Delaware: 3.5%)
> Median household income: $30,419 (Delaware: $68,287)

Florida: 32603
> Location: Gainesville
> Gini index: 0.732 (Florida: 0.486)
> Avg. household income, top 20%: $219,118 (Florida: $209,841)
> Avg. household income, bottom 20%: $84 (Florida: $13,086)
> Share of all income in 32603 that went to top 20%: 77.1% (Florida: 52.3%)
> Share of all income in 32603 that went to bottom 20%: 0.2% (Florida: 3.3%)
> Median household income: $20,660 (Florida: $55,660)
[in-text-ad-2]

Georgia: 31201
> Location: Macon-Bibb County
> Gini index: 0.615 (Georgia: 0.482)
> Avg. household income, top 20%: $143,771 (Georgia: $212,411)
> Avg. household income, bottom 20%: $3,026 (Georgia: $12,798)
> Share of all income in 31201 that went to top 20%: 65.4% (Georgia: 51.5%)
> Share of all income in 31201 that went to bottom 20%: 1.4% (Georgia: 3.1%)
> Median household income: $22,612 (Georgia: $58,700)

Hawaii: 96704
> Location: Captain Cook
> Gini index: 0.533 (Hawaii: 0.441)
> Avg. household income, top 20%: $239,309 (Hawaii: $247,294)
> Avg. household income, bottom 20%: $9,244 (Hawaii: $17,890)
> Share of all income in 96704 that went to top 20%: 55.3% (Hawaii: 47.7%)
> Share of all income in 96704 that went to bottom 20%: 2.1% (Hawaii: 3.5%)
> Median household income: $52,708 (Hawaii: $81,275)
[in-text-ad]

Idaho: 83702
> Location: Boise City
> Gini index: 0.556 (Idaho: 0.446)
> Avg. household income, top 20%: $316,497 (Idaho: $178,921)
> Avg. household income, bottom 20%: $11,481 (Idaho: $13,921)
> Share of all income in 83702 that went to top 20%: 58.1% (Idaho: 48.5%)
> Share of all income in 83702 that went to bottom 20%: 2.1% (Idaho: 3.8%)
> Median household income: $62,985 (Idaho: $55,785)
[recirclink id=850383]

Illinois: 60637
> Location: Chicago
> Gini index: 0.636 (Illinois: 0.482)
> Avg. household income, top 20%: $204,106 (Illinois: $237,616)
> Avg. household income, bottom 20%: $3,747 (Illinois: $14,052)
> Share of all income in 60637 that went to top 20%: 65.7% (Illinois: 51.4%)
> Share of all income in 60637 that went to bottom 20%: 1.2% (Illinois: 3.0%)
> Median household income: $28,965 (Illinois: $65,886)

Indiana: 47305
> Location: Muncie
> Gini index: 0.625 (Indiana: 0.453)
> Avg. household income, top 20%: $168,132 (Indiana: $183,445)
> Avg. household income, bottom 20%: $5,919 (Indiana: $13,570)
> Share of all income in 47305 that went to top 20%: 65.4% (Indiana: 48.9%)
> Share of all income in 47305 that went to bottom 20%: 2.3% (Indiana: 3.6%)
> Median household income: $25,982 (Indiana: $56,303)
[in-text-ad-2]

Iowa: 52246
> Location: Iowa City
> Gini index: 0.562 (Iowa: 0.442)
> Avg. household income, top 20%: $234,140 (Iowa: $187,874)
> Avg. household income, bottom 20%: $5,361 (Iowa: $14,836)
> Share of all income in 52246 that went to top 20%: 57.9% (Iowa: 47.9%)
> Share of all income in 52246 that went to bottom 20%: 1.3% (Iowa: 3.8%)
> Median household income: $50,313 (Iowa: $60,523)

Kansas: 66211
> Location: Leawood
> Gini index: 0.625 (Kansas: 0.456)
> Avg. household income, top 20%: $857,904 (Kansas: $197,458)
> Avg. household income, bottom 20%: $32,418 (Kansas: $14,449)
> Share of all income in 66211 that went to top 20%: 67.4% (Kansas: 49.4%)
> Share of all income in 66211 that went to bottom 20%: 2.5% (Kansas: 3.6%)
> Median household income: $117,951 (Kansas: $59,597)
[in-text-ad]

Kentucky: 40202
> Location: Louisville/Jefferson County
> Gini index: 0.674 (Kentucky: 0.479)
> Avg. household income, top 20%: $175,984 (Kentucky: $178,883)
> Avg. household income, bottom 20%: $4,099 (Kentucky: $10,912)
> Share of all income in 40202 that went to top 20%: 71.3% (Kentucky: 51.0%)
> Share of all income in 40202 that went to bottom 20%: 1.7% (Kentucky: 3.1%)
> Median household income: $19,628 (Kentucky: $50,589)
[recirclink id=920281]

Louisiana: 71254
> Location: Lake Providence
> Gini index: 0.74 (Louisiana: 0.495)
> Avg. household income, top 20%: $226,586 (Louisiana: $185,481)
> Avg. household income, bottom 20%: $2,355 (Louisiana: $9,757)
> Share of all income in 71254 that went to top 20%: 76.2% (Louisiana: 52.3%)
> Share of all income in 71254 that went to bottom 20%: 0.8% (Louisiana: 2.8%)
> Median household income: $19,544 (Louisiana: $49,469)
Maine: 04769
> Location: Presque Isle
> Gini index: 0.512 (Maine: 0.451)
> Avg. household income, top 20%: $164,561 (Maine: $185,447)
> Avg. household income, bottom 20%: $8,538 (Maine: $13,702)
> Share of all income in 04769 that went to top 20%: 53.9% (Maine: 48.7%)
> Share of all income in 04769 that went to bottom 20%: 2.8% (Maine: 3.6%)
> Median household income: $39,366 (Maine: $57,918)
[in-text-ad-2]
Maryland: 21673
> Location: Trappe
> Gini index: 0.62 (Maryland: 0.454)
> Avg. household income, top 20%: $496,212 (Maryland: $272,042)
> Avg. household income, bottom 20%: $18,629 (Maryland: $18,854)
> Share of all income in 21673 that went to top 20%: 67.0% (Maryland: 48.8%)
> Share of all income in 21673 that went to bottom 20%: 2.5% (Maryland: 3.4%)
> Median household income: $70,000 (Maryland: $84,805)

Massachusetts: 02111
> Location: Boston
> Gini index: 0.639 (Massachusetts: 0.483)
> Avg. household income, top 20%: $413,052 (Massachusetts: $284,857)
> Avg. household income, bottom 20%: $5,533 (Massachusetts: $15,520)
> Share of all income in 02111 that went to top 20%: 65.7% (Massachusetts: 51.1%)
> Share of all income in 02111 that went to bottom 20%: 0.9% (Massachusetts: 2.8%)
> Median household income: $53,596 (Massachusetts: $81,215)
[in-text-ad]

Michigan: 48208
> Location: Detroit
> Gini index: 0.614 (Michigan: 0.467)
> Avg. household income, top 20%: $130,913 (Michigan: $196,731)
> Avg. household income, bottom 20%: $2,273 (Michigan: $13,156)
> Share of all income in 48208 that went to top 20%: 64.5% (Michigan: 50.2%)
> Share of all income in 48208 that went to bottom 20%: 1.1% (Michigan: 3.4%)
> Median household income: $20,364 (Michigan: $57,144)
[recirclink id=970377]

Minnesota: 55356
> Location: Orono
> Gini index: 0.589 (Minnesota: 0.449)
> Avg. household income, top 20%: $762,990 (Minnesota: $228,793)
> Avg. household income, bottom 20%: $16,374 (Minnesota: $17,300)
> Share of all income in 55356 that went to top 20%: 62.6% (Minnesota: 48.7%)
> Share of all income in 55356 that went to bottom 20%: 1.3% (Minnesota: 3.7%)
> Median household income: $136,678 (Minnesota: $71,306)

Mississippi: 39095
> Location: Lexington
> Gini index: 0.612 (Mississippi: 0.481)
> Avg. household income, top 20%: $149,957 (Mississippi: $160,084)
> Avg. household income, bottom 20%: $2,459 (Mississippi: $9,367)
> Share of all income in 39095 that went to top 20%: 63.1% (Mississippi: 51.0%)
> Share of all income in 39095 that went to bottom 20%: 1.0% (Mississippi: 3.0%)
> Median household income: $26,250 (Mississippi: $45,081)
[in-text-ad-2]

Missouri: 63108
> Location: St. Louis
> Gini index: 0.612 (Missouri: 0.464)
> Avg. household income, top 20%: $284,821 (Missouri: $190,290)
> Avg. household income, bottom 20%: $4,756 (Missouri: $13,281)
> Share of all income in 63108 that went to top 20%: 63.7% (Missouri: 50.0%)
> Share of all income in 63108 that went to bottom 20%: 1.1% (Missouri: 3.5%)
> Median household income: $47,180 (Missouri: $55,461)

Montana: 59715
> Location: Bozeman
> Gini index: 0.53 (Montana: 0.459)
> Avg. household income, top 20%: $270,719 (Montana: $184,017)
> Avg. household income, bottom 20%: $13,181 (Montana: $13,337)
> Share of all income in 59715 that went to top 20%: 56.6% (Montana: 49.6%)
> Share of all income in 59715 that went to bottom 20%: 2.8% (Montana: 3.6%)
> Median household income: $58,591 (Montana: $54,970)
[in-text-ad]
 Nebraska: 68069
> Location: Waterloo
> Gini index: 0.593 (Nebraska: 0.444)
> Avg. household income, top 20%: $606,550 (Nebraska: $193,357)
> Avg. household income, bottom 20%: $23,439 (Nebraska: $15,168)
> Share of all income in 68069 that went to top 20%: 64.2% (Nebraska: 48.2%)
> Share of all income in 68069 that went to bottom 20%: 2.5% (Nebraska: 3.8%)
> Median household income: $94,348 (Nebraska: $61,439)
[recirclink id=887395]

Nevada: 89109
> Location: Winchester
> Gini index: 0.616 (Nevada: 0.462)
> Avg. household income, top 20%: $294,091 (Nevada: $203,124)
> Avg. household income, bottom 20%: $6,533 (Nevada: $14,239)
> Share of all income in 89109 that went to top 20%: 64.8% (Nevada: 49.8%)
> Share of all income in 89109 that went to bottom 20%: 1.4% (Nevada: 3.5%)
> Median household income: $42,837 (Nevada: $60,365)

New Hampshire: 03101
> Location: Manchester
> Gini index: 0.551 (New Hampshire: 0.438)
> Avg. household income, top 20%: $160,265 (New Hampshire: $236,675)
> Avg. household income, bottom 20%: $5,777 (New Hampshire: $18,862)
> Share of all income in 03101 that went to top 20%: 56.6% (New Hampshire: 47.7%)
> Share of all income in 03101 that went to bottom 20%: 2.0% (New Hampshire: 3.8%)
> Median household income: $32,607 (New Hampshire: $76,768)
[in-text-ad-2]

New Jersey: 07720
> Location: Bradley Beach
> Gini index: 0.589 (New Jersey: 0.481)
> Avg. household income, top 20%: $395,855 (New Jersey: $294,079)
> Avg. household income, bottom 20%: $14,200 (New Jersey: $16,981)
> Share of all income in 07720 that went to top 20%: 62.5% (New Jersey: 51.3%)
> Share of all income in 07720 that went to bottom 20%: 2.2% (New Jersey: 3.0%)
> Median household income: $64,246 (New Jersey: $82,545)
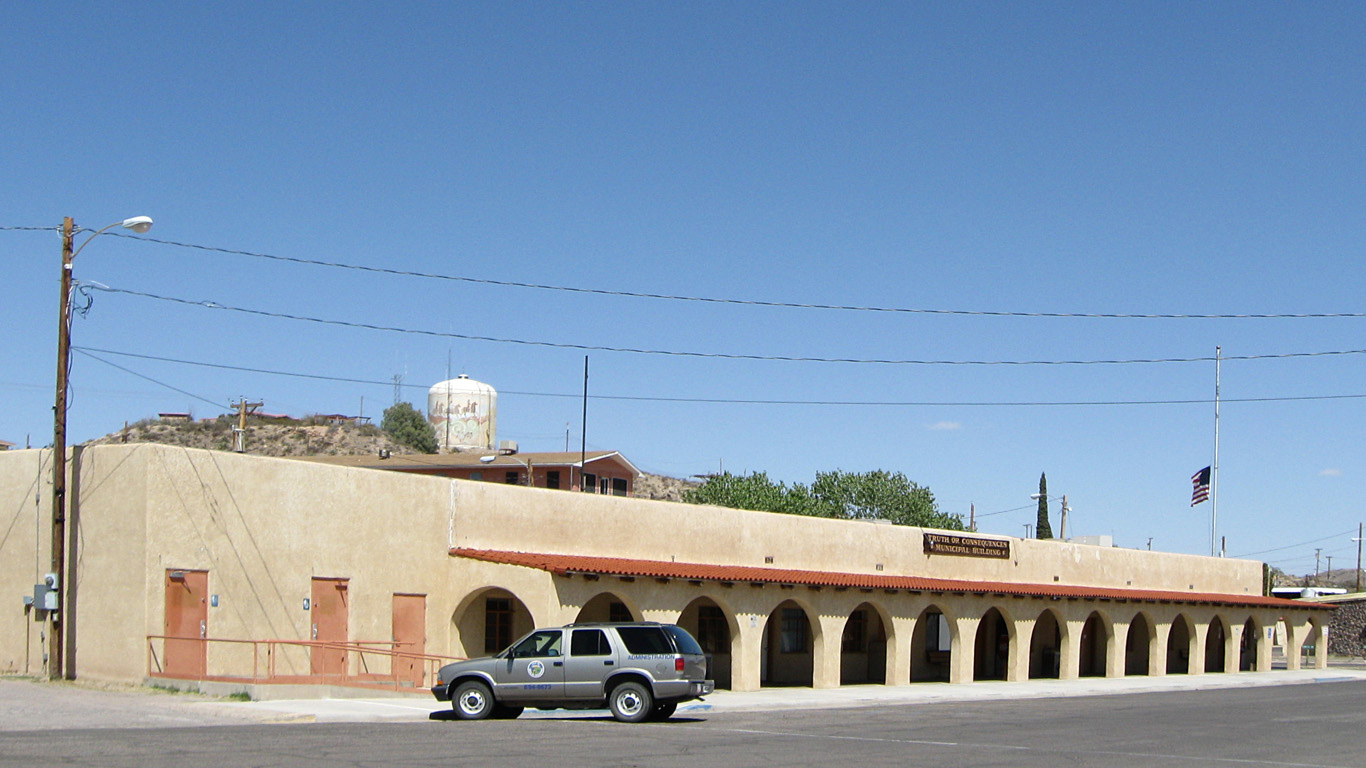
New Mexico: 87901
> Location: Truth or Consequences
> Gini index: 0.58 (New Mexico: 0.478)
> Avg. household income, top 20%: $152,964 (New Mexico: $175,925)
> Avg. household income, bottom 20%: $7,617 (New Mexico: $10,558)
> Share of all income in 87901 that went to top 20%: 62.0% (New Mexico: 50.9%)
> Share of all income in 87901 that went to bottom 20%: 3.1% (New Mexico: 3.1%)
> Median household income: $25,052 (New Mexico: $49,754)
[in-text-ad]

New York: 10029
> Location: New York
> Gini index: 0.628 (New York: 0.514)
> Avg. household income, top 20%: $229,747 (New York: $276,728)
> Avg. household income, bottom 20%: $6,057 (New York: $13,020)
> Share of all income in 10029 that went to top 20%: 65.2% (New York: 54.3%)
> Share of all income in 10029 that went to bottom 20%: 1.7% (New York: 2.6%)
> Median household income: $33,720 (New York: $68,486)
[recirclink id=848904]

North Carolina: 28357
> Location: Lumber Bridge
> Gini index: 0.61 (North Carolina: 0.476)
> Avg. household income, top 20%: $214,200 (North Carolina: $196,793)
> Avg. household income, bottom 20%: $5,257 (North Carolina: $12,761)
> Share of all income in 28357 that went to top 20%: 63.4% (North Carolina: 51.2%)
> Share of all income in 28357 that went to bottom 20%: 1.6% (North Carolina: 3.3%)
> Median household income: $36,406 (North Carolina: $54,602)
North Dakota: 58316
> Location: Belcourt
> Gini index: 0.541 (North Dakota: 0.454)
> Avg. household income, top 20%: $166,690 (North Dakota: $208,518)
> Avg. household income, bottom 20%: $3,898 (North Dakota: $14,804)
> Share of all income in 58316 that went to top 20%: 55.9% (North Dakota: 48.8%)
> Share of all income in 58316 that went to bottom 20%: 1.3% (North Dakota: 3.5%)
> Median household income: $36,297 (North Dakota: $64,894)
[in-text-ad-2]

Ohio: 44115
> Location: Cleveland
> Gini index: 0.683 (Ohio: 0.465)
> Avg. household income, top 20%: $141,754 (Ohio: $192,225)
> Avg. household income, bottom 20%: $512 (Ohio: $12,861)
> Share of all income in 44115 that went to top 20%: 69.6% (Ohio: 50.0%)
> Share of all income in 44115 that went to bottom 20%: 0.3% (Ohio: 3.3%)
> Median household income: $14,952 (Ohio: $56,602)

Oklahoma: 74105
> Location: Tulsa
> Gini index: 0.594 (Oklahoma: 0.469)
> Avg. household income, top 20%: $334,163 (Oklahoma: $183,130)
> Avg. household income, bottom 20%: $10,723 (Oklahoma: $12,268)
> Share of all income in 74105 that went to top 20%: 63.1% (Oklahoma: 50.4%)
> Share of all income in 74105 that went to bottom 20%: 2.0% (Oklahoma: 3.4%)
> Median household income: $54,501 (Oklahoma: $52,919)
[in-text-ad]

Oregon: 97205
> Location: Portland
> Gini index: 0.605 (Oregon: 0.459)
> Avg. household income, top 20%: $228,962 (Oregon: $208,393)
> Avg. household income, bottom 20%: $4,742 (Oregon: $14,622)
> Share of all income in 97205 that went to top 20%: 62.5% (Oregon: 49.5%)
> Share of all income in 97205 that went to bottom 20%: 1.3% (Oregon: 3.5%)
> Median household income: $37,420 (Oregon: $62,818)
[recirclink id=850383]

Pennsylvania: 15208
> Location: Pittsburgh
> Gini index: 0.625 (Pennsylvania: 0.472)
> Avg. household income, top 20%: $272,171 (Pennsylvania: $214,725)
> Avg. household income, bottom 20%: $7,125 (Pennsylvania: $13,887)
> Share of all income in 15208 that went to top 20%: 65.6% (Pennsylvania: 50.6%)
> Share of all income in 15208 that went to bottom 20%: 1.7% (Pennsylvania: 3.3%)
> Median household income: $37,860 (Pennsylvania: $61,744)

Rhode Island: 02903
> Location: Providence
> Gini index: 0.668 (Rhode Island: 0.47)
> Avg. household income, top 20%: $294,448 (Rhode Island: $222,204)
> Avg. household income, bottom 20%: $3,324 (Rhode Island: $13,273)
> Share of all income in 02903 that went to top 20%: 69.0% (Rhode Island: 49.9%)
> Share of all income in 02903 that went to bottom 20%: 0.8% (Rhode Island: 3.0%)
> Median household income: $36,347 (Rhode Island: $67,167)
[in-text-ad-2]

South Carolina: 29401
> Location: Charleston
> Gini index: 0.63 (South Carolina: 0.474)
> Avg. household income, top 20%: $530,435 (South Carolina: $186,571)
> Avg. household income, bottom 20%: $7,869 (South Carolina: $11,736)
> Share of all income in 29401 that went to top 20%: 65.1% (South Carolina: 50.8%)
> Share of all income in 29401 that went to bottom 20%: 1.0% (South Carolina: 3.2%)
> Median household income: $79,539 (South Carolina: $53,199)
South Dakota: 57555
> Location: Mission
> Gini index: 0.527 (South Dakota: 0.444)
> Avg. household income, top 20%: $111,796 (South Dakota: $183,626)
> Avg. household income, bottom 20%: $2,305 (South Dakota: $14,543)
> Share of all income in 57555 that went to top 20%: 52.9% (South Dakota: 48.2%)
> Share of all income in 57555 that went to bottom 20%: 1.1% (South Dakota: 3.8%)
> Median household income: $32,007 (South Dakota: $58,275)
[in-text-ad]

Tennessee: 37403
> Location: Chattanooga
> Gini index: 0.641 (Tennessee: 0.479)
> Avg. household income, top 20%: $325,590 (Tennessee: $191,924)
> Avg. household income, bottom 20%: $10,390 (Tennessee: $12,221)
> Share of all income in 37403 that went to top 20%: 68.6% (Tennessee: 51.3%)
> Share of all income in 37403 that went to bottom 20%: 2.2% (Tennessee: 3.3%)
> Median household income: $37,550 (Tennessee: $53,320)
[recirclink id=920281]

Texas: 78705
> Location: Austin
> Gini index: 0.666 (Texas: 0.479)
> Avg. household income, top 20%: $163,152 (Texas: $224,146)
> Avg. household income, bottom 20%: $686 (Texas: $14,034)
> Share of all income in 78705 that went to top 20%: 67.7% (Texas: 51.4%)
> Share of all income in 78705 that went to bottom 20%: 0.3% (Texas: 3.2%)
> Median household income: $20,326 (Texas: $61,874)

Utah: 84102
> Location: Salt Lake City
> Gini index: 0.53 (Utah: 0.426)
> Avg. household income, top 20%: $193,524 (Utah: $214,437)
> Avg. household income, bottom 20%: $7,066 (Utah: $19,112)
> Share of all income in 84102 that went to top 20%: 56.0% (Utah: 47.0%)
> Share of all income in 84102 that went to bottom 20%: 2.0% (Utah: 4.2%)
> Median household income: $46,064 (Utah: $71,621)
[in-text-ad-2]

Vermont: 05672
> Location: Stowe
> Gini index: 0.63 (Vermont: 0.448)
> Avg. household income, top 20%: $380,474 (Vermont: $196,616)
> Avg. household income, bottom 20%: $5,686 (Vermont: $14,666)
> Share of all income in 05672 that went to top 20%: 65.1% (Vermont: 48.4%)
> Share of all income in 05672 that went to bottom 20%: 1.0% (Vermont: 3.6%)
> Median household income: $59,770 (Vermont: $61,973)

Virginia: 24137
> Location: Penhook
> Gini index: 0.659 (Virginia: 0.469)
> Avg. household income, top 20%: $425,608 (Virginia: $256,360)
> Avg. household income, bottom 20%: $11,786 (Virginia: $16,508)
> Share of all income in 24137 that went to top 20%: 69.2% (Virginia: 50.4%)
> Share of all income in 24137 that went to bottom 20%: 1.9% (Virginia: 3.3%)
> Median household income: $56,950 (Virginia: $74,222)
[in-text-ad]

Washington: 98105
> Location: Seattle
> Gini index: 0.607 (Washington: 0.457)
> Avg. household income, top 20%: $372,450 (Washington: $244,742)
> Avg. household income, bottom 20%: $5,334 (Washington: $17,314)
> Share of all income in 98105 that went to top 20%: 62.6% (Washington: 49.5%)
> Share of all income in 98105 that went to bottom 20%: 0.9% (Washington: 3.5%)
> Median household income: $62,582 (Washington: $73,775)
[recirclink id=970377]

West Virginia: 25301
> Location: Charleston
> Gini index: 0.599 (West Virginia: 0.467)
> Avg. household income, top 20%: $166,821 (West Virginia: $158,941)
> Avg. household income, bottom 20%: $6,446 (West Virginia: $10,504)
> Share of all income in 25301 that went to top 20%: 63.5% (West Virginia: 49.9%)
> Share of all income in 25301 that went to bottom 20%: 2.5% (West Virginia: 3.3%)
> Median household income: $22,973 (West Virginia: $46,711)

Wisconsin: 53726
> Location: Madison
> Gini index: 0.65 (Wisconsin: 0.445)
> Avg. household income, top 20%: $312,686 (Wisconsin: $194,624)
> Avg. household income, bottom 20%: $5,014 (Wisconsin: $15,311)
> Share of all income in 53726 that went to top 20%: 67.3% (Wisconsin: 48.3%)
> Share of all income in 53726 that went to bottom 20%: 1.1% (Wisconsin: 3.8%)
> Median household income: $37,976 (Wisconsin: $61,747)
[in-text-ad-2]

Wyoming: 83014
> Location: Moose Wilson Road
> Gini index: 0.509 (Wyoming: 0.436)
> Avg. household income, top 20%: $453,546 (Wyoming: $193,249)
> Avg. household income, bottom 20%: $25,616 (Wyoming: $15,572)
> Share of all income in 83014 that went to top 20%: 55.7% (Wyoming: 47.2%)
> Share of all income in 83014 that went to bottom 20%: 3.2% (Wyoming: 3.8%)
> Median household income: $110,711 (Wyoming: $64,049)
To determine the ZIP code with the widest income gaps in every state, 24/7 Wall St. reviewed five-year estimates of the Gini Index of income inequality from the U.S. Census Bureau’s 2019 American Community Survey.
The Gini Index of income inequality summarizes income dispersion in an area on a scale from 0 to 1. A value of 0 indicates perfect equality — everyone in the area receives an equal share of the income. A value of 1 indicates perfect inequality — only one recipient receives all the income.
We used ZIP Code Tabulation Areas — a Census geography type which defines areal representations of United States Postal Service ZIP codes (USPS ZIP codes do not define geographic boundaries but instead are a network of mail delivery routes in a service area). We refer to Census ZCTAs as ZIP codes.
Of the 33,120 ZIP codes the Census publishes data for, 32,936 had boundaries that fell within one of the 50 states, while the rest were in the District of Columbia or Puerto Rico.
ZIP codes were excluded if the Gini Index was not available in the 2019 ACS, if there were fewer than 1,000 housing units, or if the sampling error associated with a ZIP code’s data was deemed too high.
The sampling error was defined as too high if the coefficient of variation — a statistical assessment of how reliable an estimate is — for a ZIP code’s Gini Index was above 15% and greater than two standard deviations above the mean CV for all ZIP codes’ Gini Indices. We similarly excluded ZIP codes that had a sampling error too high for their population, using the same definition.
The remaining 16,721 places were ranked within their state based on their Gini Index. To break ties, we used the share of aggregate household income earned by the top 20% of households.
Additional information on average household income by quintile, share of aggregate household income by quintile, and median household income are also five-year estimates from the 2019 ACS.
Contact [email protected] for any questions or corrections.