Life expectancy is one of the most important and commonly cited indicators of population health — and in the United States, life expectancy is falling at a historic rate. According to the Centers for Disease Control and Prevention, life expectancy at birth declined by 1.5 years in 2020, the largest one-year drop since World War II.
The CDC attributes the decline to the COVID-19 pandemic and 93,000 drug overdose deaths — an all-time one-year high. Homicide, diabetes, and liver disease were also contributing factors. Here is a look at the states with the most drug overdose deaths in 2020.
Even before the pandemic, there were parts of the country where life expectancy at birth was far lower than the national average — in some cases by five years or more.
Using data from County Health Rankings & Roadmaps, a Robert Wood Johnson Foundation and University of Wisconsin Population Health Institute joint program, 24/7 Tempo identified the metro area with the shortest life expectancy at birth in every state. Four states — Delaware, New Hampshire, Rhode Island, and Vermont — have only one metro area. As a result, these areas rank as having the shortest average life expectancy in the state by default only. Life expectancy figures are averages for the years 2017 through 2019, the most recent period for which metro-level data is available.
Though each metro area on this list has the shortest life expectancy at birth in its state, average life expectancies vary considerably — from more than 80 years to less than 73. The comparable national average life expectancy stands at 79.2 years.
Variations in life expectancy are tied to a number of factors. Tobacco use, for example, is the leading cause of preventable death in the U.S., and in the majority of metro areas on this list, the share of adults who smoke is above the corresponding statewide average. Here is a look at the American cities where the most people smoke.
Income levels are also linked to life expectancy. Poverty, for example, presents challenges and stressors that can take a cumulative toll on both physical and mental health. Additionally, lower-income Americans are less able to afford adequate health care or a range of healthy options related to diet and lifestyle. Recent studies have shown that life expectancy among the wealthiest 1% of Americans exceeds that of the poorest 1% by well over a decade. In most metro areas on this list, the poverty rate exceeds the statewide poverty rate.
Click here to see the metro area with the shortest life expectancy in every state
Click here to see our detailed methodology

Alabama: Gadsden
> Life expectancy at birth (years): 73.3 (Alabama: 75.6)
> Adults reporting poor or fair health: 22.0% (Alabama: 21.4%)
> Adult obesity rate: 36.2% (Alabama: 36.1%)
> Smoking rate: 23.1% (Alabama: 20.0%)
> Population without health insurance: 13.2% (Alabama: 9.7%)
> Median household income: $41,447 (Alabama: $51,734)
> Poverty rate: 19.7% (Alabama: 15.5%)
[in-text-ad]

Alaska: Anchorage
> Life expectancy at birth (years): 79.4 (Alaska: 79.0)
> Adults reporting poor or fair health: 14.8% (Alaska: 15.6%)
> Adult obesity rate: 31.3% (Alaska: 31.9%)
> Smoking rate: 17.8% (Alaska: 18.5%)
> Population without health insurance: 11.5% (Alaska: 12.2%)
> Median household income: $80,676 (Alaska: $75,463)
> Poverty rate: 10.0% (Alaska: 10.1%)
[recirclink id=968539]

Arizona: Lake Havasu City-Kingman
> Life expectancy at birth (years): 76.0 (Arizona: 80.0)
> Adults reporting poor or fair health: 22.5% (Arizona: 18.6%)
> Adult obesity rate: 30.7% (Arizona: 27.9%)
> Smoking rate: 24.6% (Arizona: 14.5%)
> Population without health insurance: 7.9% (Arizona: 11.3%)
> Median household income: $50,179 (Arizona: $62,055)
> Poverty rate: 15.7% (Arizona: 13.5%)

Arkansas: Pine Bluff
> Life expectancy at birth (years): 73.8 (Arkansas: 76.1)
> Adults reporting poor or fair health: 28.0% (Arkansas: 23.3%)
> Adult obesity rate: 42.5% (Arkansas: 35.0%)
> Smoking rate: 25.2% (Arkansas: 23.7%)
> Population without health insurance: 7.2% (Arkansas: 9.1%)
> Median household income: $41,541 (Arkansas: $48,952)
> Poverty rate: 23.6% (Arkansas: 16.2%)
[in-text-ad-2]

California: Redding
> Life expectancy at birth (years): 76.2 (California: 81.7)
> Adults reporting poor or fair health: 17.2% (California: 17.6%)
> Adult obesity rate: 26.6% (California: 24.3%)
> Smoking rate: 17.1% (California: 11.5%)
> Population without health insurance: 7.1% (California: 7.7%)
> Median household income: $63,091 (California: $80,440)
> Poverty rate: 12.6% (California: 11.8%)

Colorado: Pueblo
> Life expectancy at birth (years): 76.3 (Colorado: 80.6)
> Adults reporting poor or fair health: 20.1% (Colorado: 13.8%)
> Adult obesity rate: 31.0% (Colorado: 22.4%)
> Smoking rate: 20.0% (Colorado: 14.7%)
> Population without health insurance: 7.3% (Colorado: 8.0%)
> Median household income: $51,276 (Colorado: $77,127)
> Poverty rate: 17.9% (Colorado: 9.3%)
[in-text-ad]

Connecticut: Norwich-New London
> Life expectancy at birth (years): 79.7 (Connecticut: 80.9)
> Adults reporting poor or fair health: 13.6% (Connecticut: 13.0%)
> Adult obesity rate: 30.4% (Connecticut: 26.3%)
> Smoking rate: 15.7% (Connecticut: 12.5%)
> Population without health insurance: 4.6% (Connecticut: 5.9%)
> Median household income: $75,633 (Connecticut: $78,833)
> Poverty rate: 7.2% (Connecticut: 10.0%)
[recirclink id=935343]

Delaware: Dover*
> Life expectancy at birth (years): 77.8 (Delaware: 78.5)
> Adults reporting poor or fair health: 21.0% (Delaware: 16.3%)
> Adult obesity rate: 38.4% (Delaware: 32.4%)
> Smoking rate: 19.7% (Delaware: 17.4%)
> Population without health insurance: 9.0% (Delaware: 6.6%)
> Median household income: $58,001 (Delaware: $70,176)
> Poverty rate: 13.0% (Delaware: 11.3%)
*Because Dover is the only eligible metro in Delaware, it is the metro with the shortest life expectancy by default.

Florida: Homosassa Springs
> Life expectancy at birth (years): 75.7 (Florida: 80.2)
> Adults reporting poor or fair health: 19.8% (Florida: 19.5%)
> Adult obesity rate: 28.7% (Florida: 27.2%)
> Smoking rate: 23.1% (Florida: 14.9%)
> Population without health insurance: 11.9% (Florida: 13.2%)
> Median household income: $50,751 (Florida: $59,227)
> Poverty rate: 15.7% (Florida: 12.7%)
[in-text-ad-2]

Georgia: Albany
> Life expectancy at birth (years): 74.9 (Georgia: 77.9)
> Adults reporting poor or fair health: 24.2% (Georgia: 18.4%)
> Adult obesity rate: 39.7% (Georgia: 32.3%)
> Smoking rate: 21.7% (Georgia: 16.3%)
> Population without health insurance: 17.0% (Georgia: 13.4%)
> Median household income: $40,625 (Georgia: $61,980)
> Poverty rate: 22.6% (Georgia: 13.3%)

Hawaii: Urban Honolulu
> Life expectancy at birth (years): 82.5 (Hawaii: 82.3)
> Adults reporting poor or fair health: 17.0% (Hawaii: 15.4%)
> Adult obesity rate: 24.4% (Hawaii: 24.6%)
> Smoking rate: 14.9% (Hawaii: 14.4%)
> Population without health insurance: 3.6% (Hawaii: 4.2%)
> Median household income: $87,470 (Hawaii: $83,102)
> Poverty rate: 8.1% (Hawaii: 9.3%)
[in-text-ad]

Idaho: Pocatello
> Life expectancy at birth (years): 77.1 (Idaho: 79.4)
> Adults reporting poor or fair health: 17.0% (Idaho: 15.1%)
> Adult obesity rate: 31.2% (Idaho: 29.0%)
> Smoking rate: 18.7% (Idaho: 15.0%)
> Population without health insurance: 10.3% (Idaho: 10.8%)
> Median household income: $51,612 (Idaho: $60,999)
> Poverty rate: 12.9% (Idaho: 11.2%)
[recirclink id=952318]
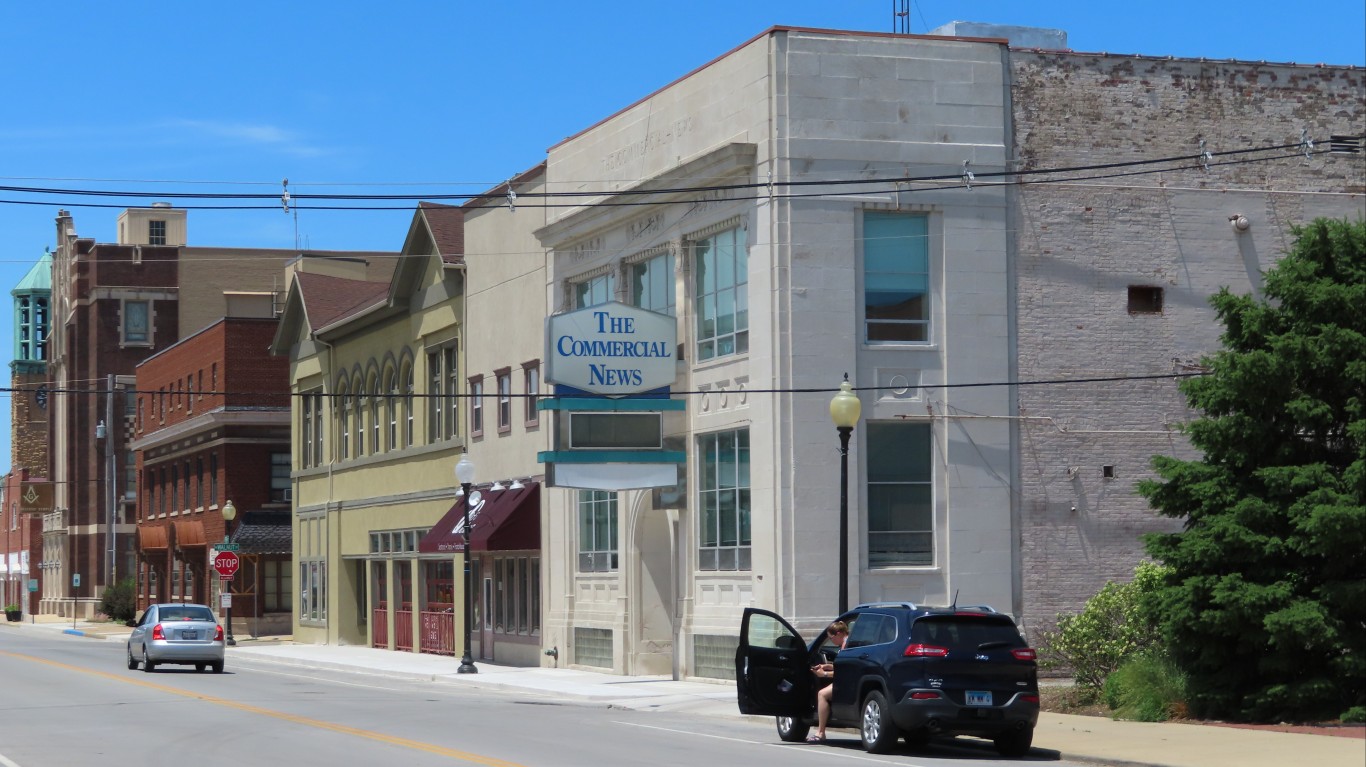
Illinois: Danville
> Life expectancy at birth (years): 74.9 (Illinois: 79.4)
> Adults reporting poor or fair health: 21.1% (Illinois: 15.9%)
> Adult obesity rate: 43.2% (Illinois: 29.7%)
> Smoking rate: 24.1% (Illinois: 15.9%)
> Population without health insurance: 5.0% (Illinois: 7.4%)
> Median household income: $43,111 (Illinois: $69,187)
> Poverty rate: 16.5% (Illinois: 11.5%)
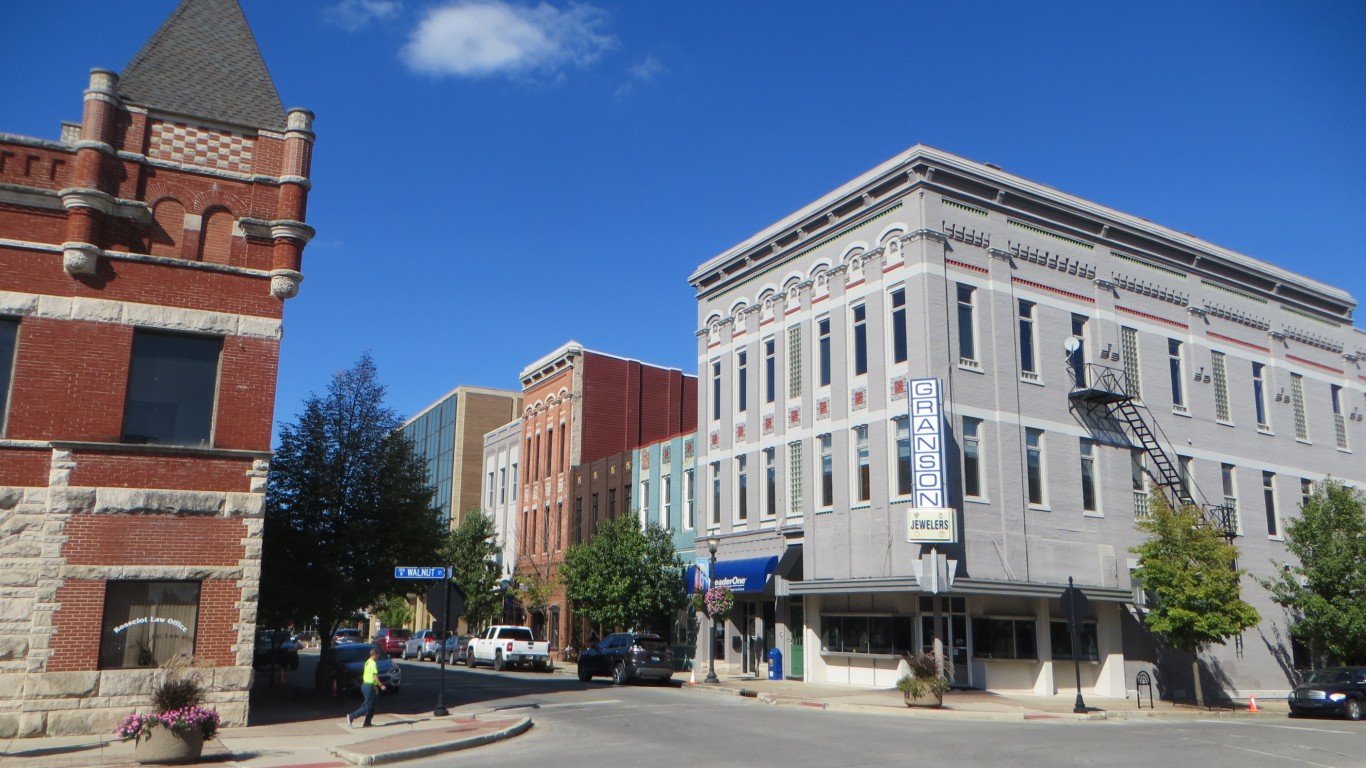
Indiana: Kokomo
> Life expectancy at birth (years): 74.5 (Indiana: 77.1)
> Adults reporting poor or fair health: 20.2% (Indiana: 18.2%)
> Adult obesity rate: 35.2% (Indiana: 33.9%)
> Smoking rate: 25.2% (Indiana: 21.7%)
> Population without health insurance: 11.7% (Indiana: 8.7%)
> Median household income: $53,440 (Indiana: $57,603)
> Poverty rate: 11.9% (Indiana: 11.9%)
[in-text-ad-2]

Iowa: Sioux City
> Life expectancy at birth (years): 78.2 (Iowa: 79.4)
> Adults reporting poor or fair health: 16.6% (Iowa: 13.5%)
> Adult obesity rate: 35.0% (Iowa: 34.3%)
> Smoking rate: 19.6% (Iowa: 17.4%)
> Population without health insurance: 6.2% (Iowa: 5.0%)
> Median household income: $60,132 (Iowa: $61,691)
> Poverty rate: 11.5% (Iowa: 11.2%)

Kansas: Topeka
> Life expectancy at birth (years): 77.4 (Kansas: 78.5)
> Adults reporting poor or fair health: 16.2% (Kansas: 16.3%)
> Adult obesity rate: 36.9% (Kansas: 33.0%)
> Smoking rate: 19.8% (Kansas: 17.9%)
> Population without health insurance: 6.4% (Kansas: 9.2%)
> Median household income: $59,567 (Kansas: $62,087)
> Poverty rate: 9.6% (Kansas: 11.4%)
[in-text-ad]

Kentucky: Louisville/Jefferson County
> Life expectancy at birth (years): 76.4 (Kentucky: 75.6)
> Adults reporting poor or fair health: 20.1% (Kentucky: 21.8%)
> Adult obesity rate: 32.7% (Kentucky: 34.6%)
> Smoking rate: 22.6% (Kentucky: 24.1%)
> Population without health insurance: 6.0% (Kentucky: 6.4%)
> Median household income: $61,172 (Kentucky: $52,295)
> Poverty rate: 11.9% (Kentucky: 16.3%)
[recirclink id=941091]

Louisiana: Alexandria
> Life expectancy at birth (years): 74.6 (Louisiana: 76.1)
> Adults reporting poor or fair health: 23.1% (Louisiana: 21.4%)
> Adult obesity rate: 40.4% (Louisiana: 36.3%)
> Smoking rate: 24.9% (Louisiana: 21.1%)
> Population without health insurance: 10.1% (Louisiana: 8.9%)
> Median household income: $50,553 (Louisiana: $51,073)
> Poverty rate: 17.6% (Louisiana: 19.0%)

Maine: Lewiston-Auburn
> Life expectancy at birth (years): 77.1 (Maine: 78.7)
> Adults reporting poor or fair health: 17.8% (Maine: 17.1%)
> Adult obesity rate: 33.4% (Maine: 29.8%)
> Smoking rate: 21.8% (Maine: 19.4%)
> Population without health insurance: 8.2% (Maine: 8.0%)
> Median household income: $63,813 (Maine: $58,924)
> Poverty rate: 8.8% (Maine: 10.9%)
[in-text-ad-2]

Maryland: Hagerstown-Martinsburg
> Life expectancy at birth (years): 76.3 (Maryland: 79.2)
> Adults reporting poor or fair health: 19.3% (Maryland: 15.2%)
> Adult obesity rate: 37.6% (Maryland: 31.6%)
> Smoking rate: 21.7% (Maryland: 12.6%)
> Population without health insurance: 7.0% (Maryland: 6.0%)
> Median household income: $60,095 (Maryland: $86,738)
> Poverty rate: 12.4% (Maryland: 9.0%)

Massachusetts: Pittsfield
> Life expectancy at birth (years): 78.3 (Massachusetts: 80.6)
> Adults reporting poor or fair health: 15.1% (Massachusetts: 13.5%)
> Adult obesity rate: 26.7% (Massachusetts: 25.0%)
> Smoking rate: 18.6% (Massachusetts: 13.7%)
> Population without health insurance: 2.9% (Massachusetts: 3.0%)
> Median household income: $58,895 (Massachusetts: $85,843)
> Poverty rate: 10.8% (Massachusetts: 9.4%)
[in-text-ad]

Michigan: Flint
> Life expectancy at birth (years): 75.5 (Michigan: 78.1)
> Adults reporting poor or fair health: 20.2% (Michigan: 18.3%)
> Adult obesity rate: 35.8% (Michigan: 32.4%)
> Smoking rate: 23.7% (Michigan: 20.1%)
> Population without health insurance: 5.3% (Michigan: 5.8%)
> Median household income: $50,389 (Michigan: $59,584)
> Poverty rate: 16.5% (Michigan: 13.0%)
[recirclink id=916524]

Minnesota: Duluth
> Life expectancy at birth (years): 79.0 (Minnesota: 80.9)
> Adults reporting poor or fair health: 14.3% (Minnesota: 12.9%)
> Adult obesity rate: 30.3% (Minnesota: 29.0%)
> Smoking rate: 21.0% (Minnesota: 15.5%)
> Population without health insurance: 4.3% (Minnesota: 4.9%)
> Median household income: $60,316 (Minnesota: $74,593)
> Poverty rate: 12.4% (Minnesota: 9.0%)

Mississippi: Gulfport-Biloxi
> Life expectancy at birth (years): 75.5 (Mississippi: 74.9)
> Adults reporting poor or fair health: 21.3% (Mississippi: 22.1%)
> Adult obesity rate: 35.3% (Mississippi: 39.1%)
> Smoking rate: 21.2% (Mississippi: 21.0%)
> Population without health insurance: 13.1% (Mississippi: 13.0%)
> Median household income: $50,642 (Mississippi: $45,792)
> Poverty rate: 16.4% (Mississippi: 19.6%)
[in-text-ad-2]

Missouri: Joplin
> Life expectancy at birth (years): 76.1 (Missouri: 77.3)
> Adults reporting poor or fair health: 21.4% (Missouri: 19.5%)
> Adult obesity rate: 34.8% (Missouri: 32.5%)
> Smoking rate: 23.3% (Missouri: 20.1%)
> Population without health insurance: 15.2% (Missouri: 10.0%)
> Median household income: $48,909 (Missouri: $57,409)
> Poverty rate: 18.0% (Missouri: 12.9%)

Montana: Great Falls
> Life expectancy at birth (years): 77.7 (Montana: 78.9)
> Adults reporting poor or fair health: 16.8% (Montana: 14.1%)
> Adult obesity rate: 31.1% (Montana: 27.1%)
> Smoking rate: 20.5% (Montana: 18.9%)
> Population without health insurance: 6.9% (Montana: 8.3%)
> Median household income: $51,227 (Montana: $57,153)
> Poverty rate: 15.4% (Montana: 12.6%)
[in-text-ad]

Nebraska: Grand Island
> Life expectancy at birth (years): 78.9 (Nebraska: 79.6)
> Adults reporting poor or fair health: 16.0% (Nebraska: 13.8%)
> Adult obesity rate: 37.4% (Nebraska: 33.4%)
> Smoking rate: 16.4% (Nebraska: 16.6%)
> Population without health insurance: 10.5% (Nebraska: 8.3%)
> Median household income: $55,907 (Nebraska: $63,229)
> Poverty rate: 10.3% (Nebraska: 9.9%)
[recirclink id=968539]

Nevada: Carson City
> Life expectancy at birth (years): 75.0 (Nevada: 78.7)
> Adults reporting poor or fair health: 20.6% (Nevada: 19.1%)
> Adult obesity rate: 30.9% (Nevada: 27.1%)
> Smoking rate: 19.8% (Nevada: 15.7%)
> Population without health insurance: 14.8% (Nevada: 11.4%)
> Median household income: $57,270 (Nevada: $63,276)
> Poverty rate: 12.5% (Nevada: 12.5%)

New Hampshire: Manchester-Nashua*
> Life expectancy at birth (years): 79.6 (New Hampshire: 79.7)
> Adults reporting poor or fair health: 12.2% (New Hampshire: 12.8%)
> Adult obesity rate: 28.5% (New Hampshire: 28.6%)
> Smoking rate: 16.0% (New Hampshire: 16.6%)
> Population without health insurance: 6.8% (New Hampshire: 6.3%)
> Median household income: $83,626 (New Hampshire: $77,933)
> Poverty rate: 7.3% (New Hampshire: 7.3%)
*Because Manchester-Nashua is the only eligible metro in New Hampshire, it is the metro with the shortest life expectancy by default.
[in-text-ad-2]

New Jersey: Vineland-Bridgeton
> Life expectancy at birth (years): 75.3 (New Jersey: 80.5)
> Adults reporting poor or fair health: 25.2% (New Jersey: 15.5%)
> Adult obesity rate: 36.5% (New Jersey: 27.0%)
> Smoking rate: 22.6% (New Jersey: 13.2%)
> Population without health insurance: 9.4% (New Jersey: 7.9%)
> Median household income: $54,587 (New Jersey: $85,751)
> Poverty rate: 13.2% (New Jersey: 9.2%)

New Mexico: Farmington
> Life expectancy at birth (years): 76.0 (New Mexico: 78.0)
> Adults reporting poor or fair health: 23.5% (New Mexico: 20.3%)
> Adult obesity rate: 34.6% (New Mexico: 27.3%)
> Smoking rate: 23.5% (New Mexico: 15.9%)
> Population without health insurance: 13.9% (New Mexico: 10.0%)
> Median household income: $44,321 (New Mexico: $51,945)
> Poverty rate: 21.2% (New Mexico: 18.2%)
[in-text-ad]

New York: Elmira
> Life expectancy at birth (years): 76.5 (New York: 81.4)
> Adults reporting poor or fair health: 17.6% (New York: 16.3%)
> Adult obesity rate: 35.1% (New York: 26.4%)
> Smoking rate: 23.6% (New York: 13.0%)
> Population without health insurance: 3.4% (New York: 5.2%)
> Median household income: $60,782 (New York: $72,108)
> Poverty rate: 13.9% (New York: 13.0%)
[recirclink id=935343]

North Carolina: Rocky Mount
> Life expectancy at birth (years): 74.6 (North Carolina: 78.1)
> Adults reporting poor or fair health: 23.5% (North Carolina: 18.0%)
> Adult obesity rate: 38.9% (North Carolina: 32.3%)
> Smoking rate: 22.4% (North Carolina: 17.9%)
> Population without health insurance: 9.5% (North Carolina: 11.3%)
> Median household income: $46,466 (North Carolina: $57,341)
> Poverty rate: 17.2% (North Carolina: 13.6%)

North Dakota: Grand Forks
> Life expectancy at birth (years): 78.8 (North Dakota: 79.7)
> Adults reporting poor or fair health: 15.7% (North Dakota: 13.6%)
> Adult obesity rate: 33.6% (North Dakota: 33.9%)
> Smoking rate: 19.1% (North Dakota: 19.7%)
> Population without health insurance: 4.1% (North Dakota: 6.9%)
> Median household income: $57,301 (North Dakota: $64,577)
> Poverty rate: 13.9% (North Dakota: 10.6%)
[in-text-ad-2]

Ohio: Springfield
> Life expectancy at birth (years): 74.3 (Ohio: 77.0)
> Adults reporting poor or fair health: 20.9% (Ohio: 17.8%)
> Adult obesity rate: 37.0% (Ohio: 33.5%)
> Smoking rate: 26.2% (Ohio: 21.4%)
> Population without health insurance: 6.6% (Ohio: 6.6%)
> Median household income: $50,128 (Ohio: $58,642)
> Poverty rate: 14.6% (Ohio: 13.1%)

Oklahoma: Enid
> Life expectancy at birth (years): 76.0 (Oklahoma: 76.1)
> Adults reporting poor or fair health: 20.5% (Oklahoma: 20.9%)
> Adult obesity rate: 35.1% (Oklahoma: 34.5%)
> Smoking rate: 21.0% (Oklahoma: 19.9%)
> Population without health insurance: 13.8% (Oklahoma: 14.3%)
> Median household income: $64,929 (Oklahoma: $54,449)
> Poverty rate: 10.1% (Oklahoma: 15.2%)
[in-text-ad]

Oregon: Grants Pass
> Life expectancy at birth (years): 76.6 (Oregon: 79.9)
> Adults reporting poor or fair health: 21.9% (Oregon: 18.2%)
> Adult obesity rate: 32.0% (Oregon: 29.3%)
> Smoking rate: 22.9% (Oregon: 15.7%)
> Population without health insurance: 12.5% (Oregon: 7.2%)
> Median household income: $47,573 (Oregon: $67,058)
> Poverty rate: 15.7% (Oregon: 11.4%)
[recirclink id=952318]

Pennsylvania: Johnstown
> Life expectancy at birth (years): 76.1 (Pennsylvania: 78.5)
> Adults reporting poor or fair health: 18.7% (Pennsylvania: 17.6%)
> Adult obesity rate: 29.4% (Pennsylvania: 30.8%)
> Smoking rate: 23.0% (Pennsylvania: 17.9%)
> Population without health insurance: 3.7% (Pennsylvania: 5.8%)
> Median household income: $49,076 (Pennsylvania: $63,463)
> Poverty rate: 15.3% (Pennsylvania: 12.0%)

Rhode Island: Providence-Warwick*
> Life expectancy at birth (years): 79.4 (Rhode Island: 79.8)
> Adults reporting poor or fair health: 16.8% (Rhode Island: 16.5%)
> Adult obesity rate: 28.6% (Rhode Island: 28.5%)
> Smoking rate: 18.0% (Rhode Island: 15.2%)
> Population without health insurance: 3.7% (Rhode Island: 4.1%)
> Median household income: $70,967 (Rhode Island: $71,169)
> Poverty rate: 11.0% (Rhode Island: 10.8%)
*Because Providence-Warwick is the only eligible metro in Rhode Island, it is the metro with the shortest life expectancy by default.
[in-text-ad-2]
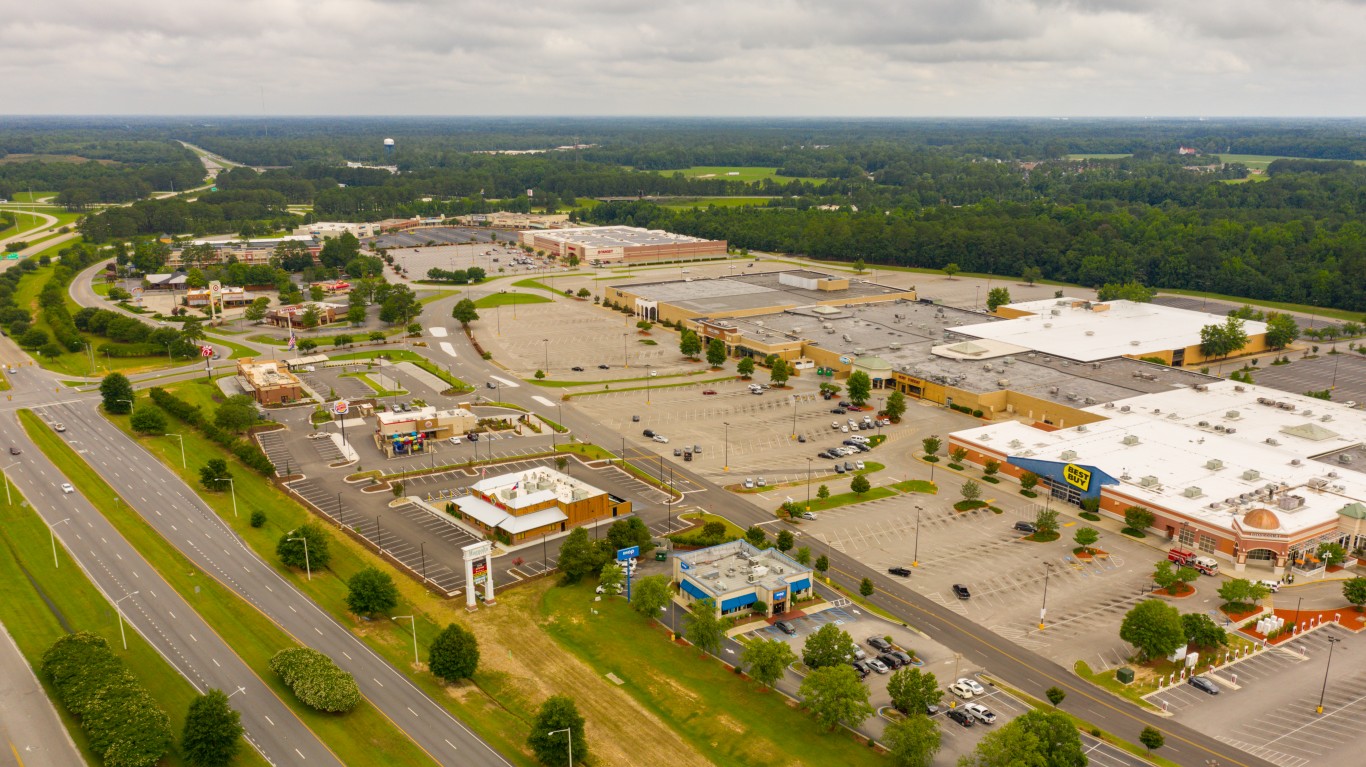
South Carolina: Florence
> Life expectancy at birth (years): 73.7 (South Carolina: 77.1)
> Adults reporting poor or fair health: 21.5% (South Carolina: 17.8%)
> Adult obesity rate: 38.4% (South Carolina: 34.0%)
> Smoking rate: 20.6% (South Carolina: 18.7%)
> Population without health insurance: 11.1% (South Carolina: 10.8%)
> Median household income: $48,547 (South Carolina: $56,227)
> Poverty rate: 16.9% (South Carolina: 13.8%)

South Dakota: Rapid City
> Life expectancy at birth (years): 79.2 (South Dakota: 78.9)
> Adults reporting poor or fair health: 14.2% (South Dakota: 13.4%)
> Adult obesity rate: 29.3% (South Dakota: 32.4%)
> Smoking rate: 18.8% (South Dakota: 20.2%)
> Population without health insurance: 10.6% (South Dakota: 10.2%)
> Median household income: $58,361 (South Dakota: $59,533)
> Poverty rate: 11.0% (South Dakota: 11.9%)
[in-text-ad]

Tennessee: Johnson City
> Life expectancy at birth (years): 75.2 (Tennessee: 76.0)
> Adults reporting poor or fair health: 21.8% (Tennessee: 21.2%)
> Adult obesity rate: 34.5% (Tennessee: 33.3%)
> Smoking rate: 24.3% (Tennessee: 20.8%)
> Population without health insurance: 11.0% (Tennessee: 10.1%)
> Median household income: $45,917 (Tennessee: $56,071)
> Poverty rate: 17.9% (Tennessee: 13.9%)
[recirclink id=941091]
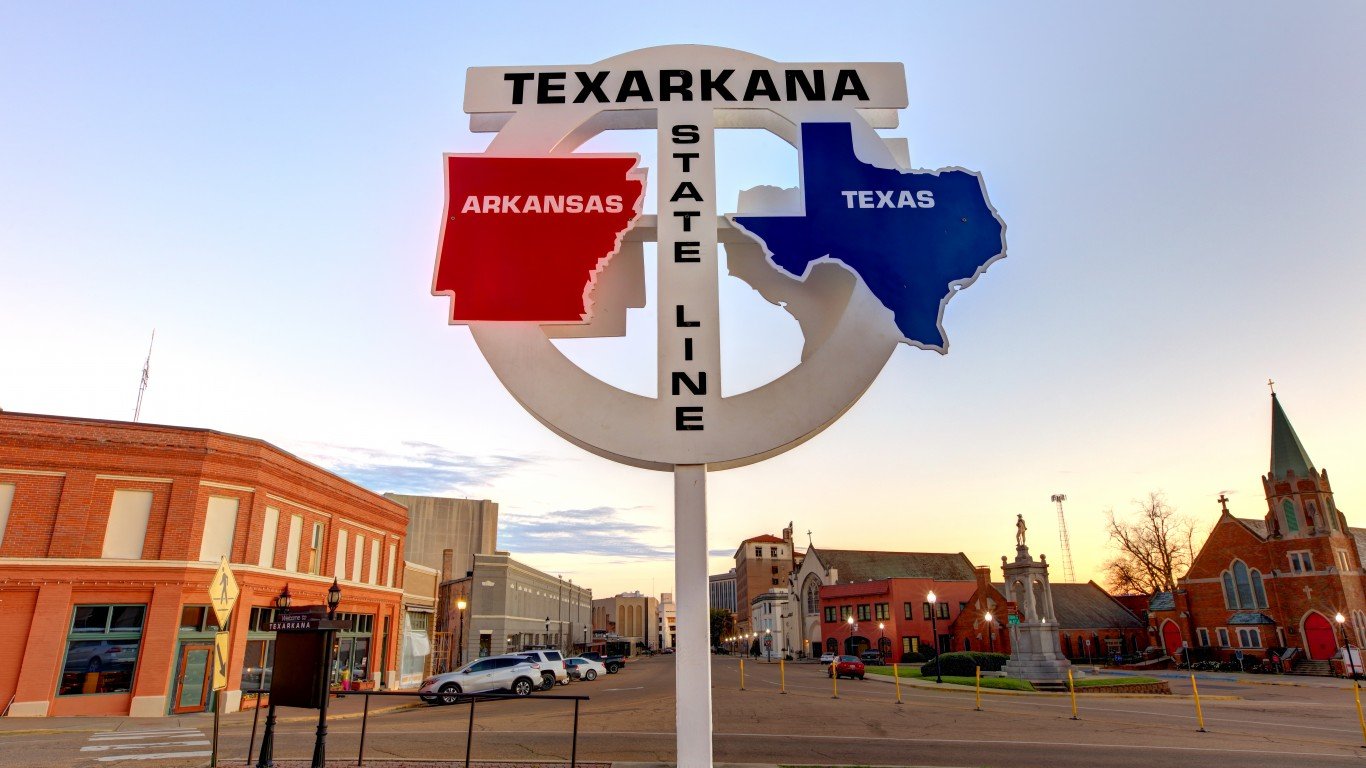
Texas: Texarkana
> Life expectancy at birth (years): 74.9 (Texas: 79.2)
> Adults reporting poor or fair health: 23.0% (Texas: 18.7%)
> Adult obesity rate: 42.7% (Texas: 31.4%)
> Smoking rate: 22.0% (Texas: 14.2%)
> Population without health insurance: 13.6% (Texas: 18.4%)
> Median household income: $51,544 (Texas: $64,034)
> Poverty rate: 14.4% (Texas: 13.6%)

Utah: Salt Lake City
> Life expectancy at birth (years): 79.7 (Utah: 80.1)
> Adults reporting poor or fair health: 16.3% (Utah: 14.8%)
> Adult obesity rate: 26.8% (Utah: 27.0%)
> Smoking rate: 11.2% (Utah: 9.1%)
> Population without health insurance: 10.4% (Utah: 9.7%)
> Median household income: $80,196 (Utah: $75,780)
> Poverty rate: 8.6% (Utah: 8.9%)
[in-text-ad-2]

Vermont: Burlington-South Burlington*
> Life expectancy at birth (years): 81.0 (Vermont: 79.8)
> Adults reporting poor or fair health: 11.8% (Vermont: 12.8%)
> Adult obesity rate: 25.4% (Vermont: 27.0%)
> Smoking rate: 13.6% (Vermont: 14.7%)
> Population without health insurance: 3.7% (Vermont: 4.5%)
> Median household income: $74,909 (Vermont: $63,001)
> Poverty rate: 11.4% (Vermont: 10.2%)
*Because Burlington-South Burlington is the only eligible metro in Vermont, it is the metro with the shortest life expectancy by default.

Virginia: Roanoke
> Life expectancy at birth (years): 77.2 (Virginia: 79.6)
> Adults reporting poor or fair health: 18.4% (Virginia: 16.6%)
> Adult obesity rate: 33.5% (Virginia: 30.5%)
> Smoking rate: 20.2% (Virginia: 15.1%)
> Population without health insurance: 6.9% (Virginia: 7.9%)
> Median household income: $60,471 (Virginia: $76,456)
> Poverty rate: 11.8% (Virginia: 9.9%)
[in-text-ad]

Washington: Longview
> Life expectancy at birth (years): 76.9 (Washington: 80.4)
> Adults reporting poor or fair health: 19.5% (Washington: 15.0%)
> Adult obesity rate: 37.7% (Washington: 28.6%)
> Smoking rate: 17.9% (Washington: 12.1%)
> Population without health insurance: 5.1% (Washington: 6.6%)
> Median household income: $55,497 (Washington: $78,687)
> Poverty rate: 12.2% (Washington: 9.8%)
[recirclink id=916524]

West Virginia: Beckley
> Life expectancy at birth (years): 72.7 (West Virginia: 74.8)
> Adults reporting poor or fair health: 25.6% (West Virginia: 23.6%)
> Adult obesity rate: 38.9% (West Virginia: 37.8%)
> Smoking rate: 27.9% (West Virginia: 26.9%)
> Population without health insurance: 7.2% (West Virginia: 6.7%)
> Median household income: $44,785 (West Virginia: $48,850)
> Poverty rate: 17.9% (West Virginia: 16.0%)

Wisconsin: Janesville-Beloit
> Life expectancy at birth (years): 78.2 (Wisconsin: 79.5)
> Adults reporting poor or fair health: 16.9% (Wisconsin: 14.8%)
> Adult obesity rate: 36.9% (Wisconsin: 31.7%)
> Smoking rate: 20.1% (Wisconsin: 17.2%)
> Population without health insurance: 4.9% (Wisconsin: 5.7%)
> Median household income: $61,243 (Wisconsin: $64,168)
> Poverty rate: 13.5% (Wisconsin: 10.4%)
[in-text-ad-2]

Wyoming: Casper
> Life expectancy at birth (years): 77.6 (Wyoming: 78.9)
> Adults reporting poor or fair health: 15.6% (Wyoming: 15.3%)
> Adult obesity rate: 31.2% (Wyoming: 29.2%)
> Smoking rate: 21.8% (Wyoming: 19.2%)
> Population without health insurance: 12.2% (Wyoming: 12.3%)
> Median household income: $65,034 (Wyoming: $65,003)
> Poverty rate: 8.6% (Wyoming: 10.1%)
Methodology
To determine the metro with the shortest life expectancy in every state, 24/7 Tempo reviewed data on life expectancy — the average number of years a person can expect to live — data from the Robert Wood Johnson Foundation and the University of Wisconsin Population Health Institute joint program’s 2021 County Health Rankings & Roadmaps report. While the CHR report is from 2021, life expectancy data published in the report are from 2017-2019.
We used the 384 metropolitan statistical areas as delineated by the United States Office of Management and Budget and used by the Census Bureau as our definition of metros.
Metros were ranked within their state based on life expectancy. Since many metros cross state lines, the metro was assigned to the state of its first-listed principal city. Thus, the Washington-Arlington-Alexandria, DC-VA-MD-WV metro area was excluded as it is principally in the District of Columbia.
Additional information on the share of adults reporting poor or fair health, the share of adults 20 years and older who report a body mass index of 30 kg/m2 or higher (adult obesity rate), and the share of adults who are current smokers are also from the 2021 CHR. The share of the civilian noninstitutionalized population without health insurance, median household income, and poverty rates are one-year estimates from the U.S. Census Bureau’s 2019 American Community Survey.
Contact [email protected] for any questions or corrections.