
The U.S. violent crime rate — an annual, population-adjusted measure of cases of rаpe, robbery, aggravated assault, and homicide — climbed by 5% in 2020. The increase was driven by a rise in aggravated assault and, most notably, a historic 29% surge in homicides that made 2020 the deadliest year in the United States since the mid-1990s.
Despite rising violence nationwide — and the largest single-year increase in homicides on record — many parts of the country remain relatively safe. In most states, there is at least one metropolitan area with a violent crime rate that is far below the national average.
Using data from the FBI’s 2020 Uniform Crime Report, 24/7 Wall St. identified the safest metro area in every state. Metro areas are ranked by the violent crime rate — specifically, the number of violent crimes reported for every 100,000 residents.
It is important to note that in eight states, there is only one eligible metro area with available data. In each of these cases, which are noted, the metro area listed ranks as the safest in the state by default only. In two states — Alabama and Pennsylvania — there are no qualifying metro areas with available crime data.
Though each of the metro areas on this list ranks as the safest in its state, violent crime rates in these cities vary considerably, from as low as 58 incidents per 100,000 people to as high as 841 per 100,000. Still, violent crime rates in nearly every city on this list are lower than the rate across the state as a whole.
Potential explanations for lower levels of violence in these places are varied, though one factor may be relative financial security, as low-income communities in the U.S. are disproportionately burdened by crime.
One study found that individuals with family incomes of less than $15,000 annually are three times more likely to be victimized by crime than those with family incomes of $75,000 or more. In most metro areas on this list, the share of residents living on poverty-level income is lower than the 12.3% national poverty rate. Here is a look at the city hit hardest by extreme poverty in every state.
Click here to see the safest metro area in every state
Click here to read our detailed methodology

Alabama: No eligible metros
> Violent crimes per 100k people: N/A (Alabama: 453.6)
> Number of violent crimes: N/A (Alabama: 22,322)
> Murders reported in 2020: N/A (Alabama: 471)
> Poverty rate: N/A (Alabama: 15.5%)
[in-text-ad]

Alaska: Fairbanks
> Violent crimes per 100k people: 841.4 (Alaska: 837.8)
> Number of violent crimes: 277 (Alaska: 6,126)
> Murders reported in 2020: 3 (Alaska: 49)
> Poverty rate: 5.9% (Alaska: 10.1%)
[recirclink id=968539]

Arizona: Lake Havasu City-Kingman
> Violent crimes per 100k people: 228.3 (Arizona: 484.8)
> Number of violent crimes: 490 (Arizona: 35,980)
> Murders reported in 2020: 14 (Arizona: 513)
> Poverty rate: 15.7% (Arizona: 13.5%)

Arkansas: Hot Springs
> Violent crimes per 100k people: 583.4 (Arkansas: 671.9)
> Number of violent crimes: 582 (Arkansas: 20,363)
> Murders reported in 2020: 9 (Arkansas: 321)
> Poverty rate: 17.4% (Arkansas: 16.2%)
[in-text-ad-2]

California: Oxnard-Thousand Oaks-Ventura
> Violent crimes per 100k people: 200.7 (California: 442.0)
> Number of violent crimes: 1,686 (California: 174,026)
> Murders reported in 2020: 20 (California: 2,203)
> Poverty rate: 7.9% (California: 11.8%)

Colorado: Boulder
> Violent crimes per 100k people: 293.2 (Colorado: 423.1)
> Number of violent crimes: 961 (Colorado: 24,570)
> Murders reported in 2020: 4 (Colorado: 294)
> Poverty rate: 10.9% (Colorado: 9.3%)
[in-text-ad]

Connecticut: Bridgeport-Stamford-Norwalk
> Violent crimes per 100k people: 163.9 (Connecticut: 181.6)
> Number of violent crimes: 1,522 (Connecticut: 6,459)
> Murders reported in 2020: 40 (Connecticut: 140)
> Poverty rate: 9.1% (Connecticut: 10.0%)
[recirclink id=966311]

Delaware: Dover*
> Violent crimes per 100k people: 442.6 (Delaware: 431.9)
> Number of violent crimes: 813 (Delaware: 4,262)
> Murders reported in 2020: 13 (Delaware: 73)
> Poverty rate: 13.0% (Delaware: 11.3%)
*Because Dover is the only eligible metro in Delaware, it is the safest metro by default.

Florida: Sebastian-Vero Beach
> Violent crimes per 100k people: 135.1 (Florida: 383.6)
> Number of violent crimes: 219 (Florida: 83,368)
> Murders reported in 2020: 3 (Florida: 1,290)
> Poverty rate: 12.3% (Florida: 12.7%)
[in-text-ad-2]

Georgia: Gainesville
> Violent crimes per 100k people: 231.4 (Georgia: 400.1)
> Number of violent crimes: 479 (Georgia: 42,850)
> Murders reported in 2020: 7 (Georgia: 943)
> Poverty rate: 14.5% (Georgia: 13.3%)

Hawaii: Kahului-Wailuku-Lahaina*
> Violent crimes per 100k people: 226.7 (Hawaii: 254.2)
> Number of violent crimes: 379 (Hawaii: 3,576)
> Murders reported in 2020: 5 (Hawaii: 41)
> Poverty rate: 11.9% (Hawaii: 9.3%)
*Because Kahului-Wailuku-Lahaina is the only eligible metro in Hawaii, it is the safest metro by default.
[in-text-ad]

Idaho: Lewiston
> Violent crimes per 100k people: 184.4 (Idaho: 242.6)
> Number of violent crimes: 117 (Idaho: 4,432)
> Murders reported in 2020: 3 (Idaho: 41)
> Poverty rate: 11.2% (Idaho: 11.2%)
[recirclink id=954316]

Illinois: Bloomington
> Violent crimes per 100k people: 282.8 (Illinois: 425.9)
> Number of violent crimes: 483 (Illinois: 53,612)
> Murders reported in 2020: 1 (Illinois: 1,151)
> Poverty rate: 15.7% (Illinois: 11.5%)

Indiana: Fort Wayne
> Violent crimes per 100k people: 334.9 (Indiana: 357.7)
> Number of violent crimes: 1,392 (Indiana: 24,161)
> Murders reported in 2020: 41 (Indiana: 505)
> Poverty rate: 10.2% (Indiana: 11.9%)
[in-text-ad-2]

Iowa: Ames
> Violent crimes per 100k people: 183.8 (Iowa: 303.5)
> Number of violent crimes: 228 (Iowa: 9,601)
> Murders reported in 2020: 1 (Iowa: 111)
> Poverty rate: 15.6% (Iowa: 11.2%)

Kansas: Manhattan*
> Violent crimes per 100k people: 376.1 (Kansas: 425.0)
> Number of violent crimes: 490 (Kansas: 12,385)
> Murders reported in 2020: 6 (Kansas: 100)
> Poverty rate: 18.6% (Kansas: 11.4%)
*Because Manhattan is the only eligible metro in Kansas, it is the safest metro by default.
[in-text-ad]

Kentucky: Elizabethtown-Fort Knox
> Violent crimes per 100k people: 100.5 (Kentucky: 259.1)
> Number of violent crimes: 155 (Kentucky: 11,600)
> Murders reported in 2020: 5 (Kentucky: 323)
> Poverty rate: 11.1% (Kentucky: 16.3%)
[recirclink id=950673]

Louisiana: Lafayette
> Violent crimes per 100k people: 450.0 (Louisiana: 639.4)
> Number of violent crimes: 2,205 (Louisiana: 29,704)
> Murders reported in 2020: 41 (Louisiana: 734)
> Poverty rate: 18.4% (Louisiana: 19.0%)

Maine: Bangor
> Violent crimes per 100k people: 57.7 (Maine: 108.6)
> Number of violent crimes: 88 (Maine: 1,466)
> Murders reported in 2020: 6 (Maine: 22)
> Poverty rate: 12.1% (Maine: 10.9%)
[in-text-ad-2]

Maryland: California-Lexington Park*
> Violent crimes per 100k people: 196.4 (Maryland: 399.9)
> Number of violent crimes: 224 (Maryland: 24,215)
> Murders reported in 2020: 8 (Maryland: 553)
> Poverty rate: 7.3% (Maryland: 9.0%)
*Because California-Lexington Park is the only eligible metro in Maryland, it is the safest metro by default.

Massachusetts: Boston-Cambridge-Newton
> Violent crimes per 100k people: 253.8 (Massachusetts: 308.8)
> Number of violent crimes: 12,399 (Massachusetts: 21,288)
> Murders reported in 2020: 109 (Massachusetts: 160)
> Poverty rate: 8.6% (Massachusetts: 9.4%)
[in-text-ad]

Michigan: Midland
> Violent crimes per 100k people: 144.9 (Michigan: 478.0)
> Number of violent crimes: 120 (Michigan: 47,641)
> Murders reported in 2020: 1 (Michigan: 754)
> Poverty rate: 9.3% (Michigan: 13.0%)
[recirclink id=948659]

Minnesota: Mankato
> Violent crimes per 100k people: 187.0 (Minnesota: 277.5)
> Number of violent crimes: 191 (Minnesota: 15,698)
> Murders reported in 2020: 1 (Minnesota: 190)
> Poverty rate: 16.1% (Minnesota: 9.0%)

Mississippi: Hattiesburg*
> Violent crimes per 100k people: 249.8 (Mississippi: 291.2)
> Number of violent crimes: 422 (Mississippi: 8,638)
> Murders reported in 2020: 10 (Mississippi: 315)
> Poverty rate: 22.5% (Mississippi: 19.6%)
*Because Hattiesburg is the only eligible metro in Mississippi, it is the safest metro by default.
[in-text-ad-2]

Missouri: Jefferson City
> Violent crimes per 100k people: 165.9 (Missouri: 542.7)
> Number of violent crimes: 251 (Missouri: 33,385)
> Murders reported in 2020: 4 (Missouri: 723)
> Poverty rate: 10.8% (Missouri: 12.9%)

Montana: Missoula
> Violent crimes per 100k people: 404.0 (Montana: 469.8)
> Number of violent crimes: 489 (Montana: 5,077)
> Murders reported in 2020: 6 (Montana: 54)
> Poverty rate: 11.5% (Montana: 12.6%)
[in-text-ad]

Nebraska: Grand Island
> Violent crimes per 100k people: 340.5 (Nebraska: 334.1)
> Number of violent crimes: 257 (Nebraska: 6,473)
> Murders reported in 2020: 0 reported (Nebraska: 69)
> Poverty rate: 10.3% (Nebraska: 9.9%)
[recirclink id=968539]

Nevada: Carson City
> Violent crimes per 100k people: 400.0 (Nevada: 460.3)
> Number of violent crimes: 225 (Nevada: 14,445)
> Murders reported in 2020: 1 (Nevada: 180)
> Poverty rate: 12.5% (Nevada: 12.5%)

New Hampshire: Manchester-Nashua*
> Violent crimes per 100k people: 217.7 (New Hampshire: 146.4)
> Number of violent crimes: 913 (New Hampshire: 2,000)
> Murders reported in 2020: 5 (New Hampshire: 12)
> Poverty rate: 7.3% (New Hampshire: 7.3%)
*Because Manchester-Nashua is the only eligible metro in New Hampshire, it is the safest metro by default.
[in-text-ad-2]
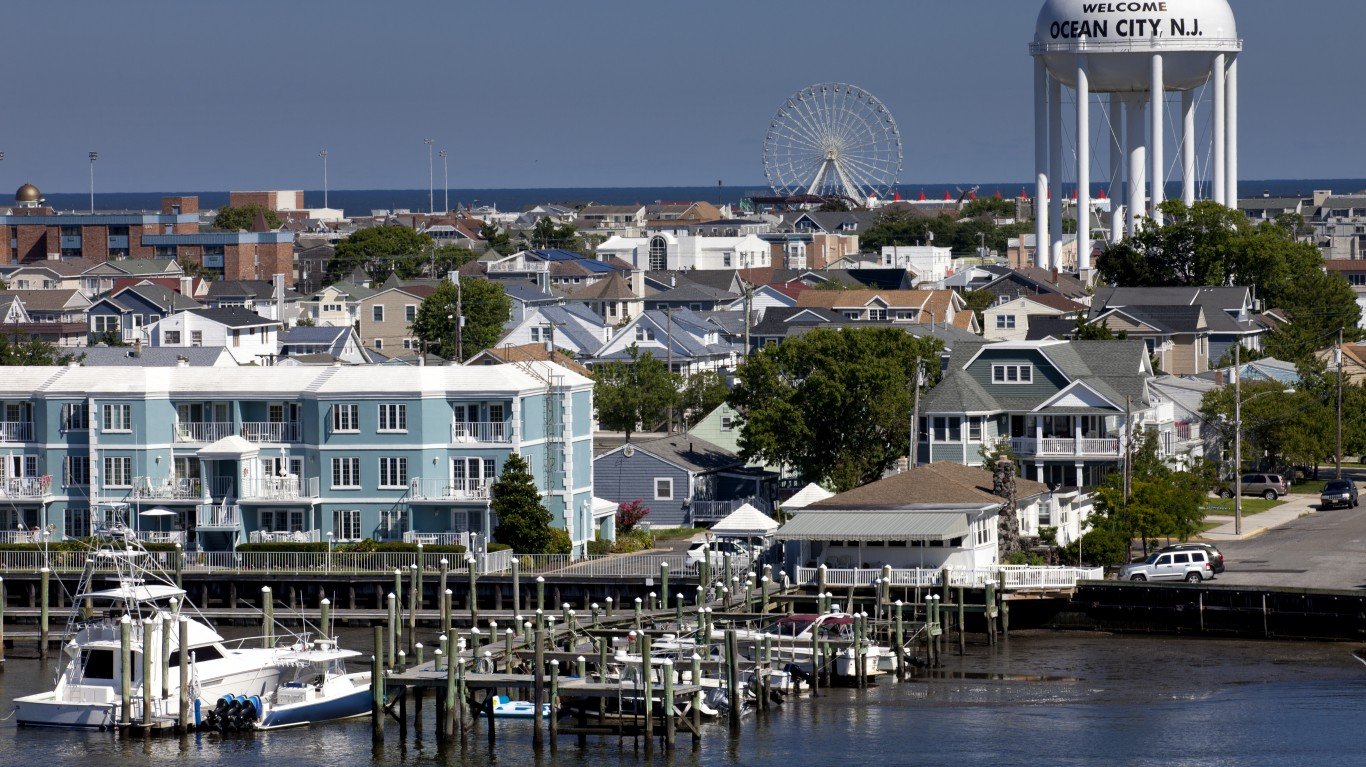
New Jersey: Ocean City
> Violent crimes per 100k people: 168.5 (New Jersey: 195.4)
> Number of violent crimes: 154 (New Jersey: 17,353)
> Murders reported in 2020: 0 reported (New Jersey: 329)
> Poverty rate: 8.8% (New Jersey: 9.2%)

New Mexico: Farmington
> Violent crimes per 100k people: 661.0 (New Mexico: 778.3)
> Number of violent crimes: 817 (New Mexico: 16,393)
> Murders reported in 2020: 4 (New Mexico: 164)
> Poverty rate: 21.2% (New Mexico: 18.2%)
[in-text-ad]

New York: Glens Falls
> Violent crimes per 100k people: 125.9 (New York: 363.8)
> Number of violent crimes: 156 (New York: 70,339)
> Murders reported in 2020: 0 reported (New York: 808)
> Poverty rate: 10.8% (New York: 13.0%)
[recirclink id=966311]

North Carolina: Jacksonville
> Violent crimes per 100k people: 210.3 (North Carolina: 419.3)
> Number of violent crimes: 419 (North Carolina: 44,451)
> Murders reported in 2020: 4 (North Carolina: 852)
> Poverty rate: 11.1% (North Carolina: 13.6%)

North Dakota: Grand Forks
> Violent crimes per 100k people: 232.6 (North Dakota: 329.0)
> Number of violent crimes: 233 (North Dakota: 2,518)
> Murders reported in 2020: 6 (North Dakota: 32)
> Poverty rate: 13.9% (North Dakota: 10.6%)
[in-text-ad-2]

Ohio: Cincinnati
> Violent crimes per 100k people: 235.7 (Ohio: 308.8)
> Number of violent crimes: 5,250 (Ohio: 36,104)
> Murders reported in 2020: 128 (Ohio: 820)
> Poverty rate: 11.3% (Ohio: 13.1%)

Oklahoma: Enid
> Violent crimes per 100k people: 415.8 (Oklahoma: 458.6)
> Number of violent crimes: 254 (Oklahoma: 18,255)
> Murders reported in 2020: 4 (Oklahoma: 296)
> Poverty rate: 10.1% (Oklahoma: 15.2%)
[in-text-ad]

Oregon: Albany-Lebanon
> Violent crimes per 100k people: 149.3 (Oregon: 291.9)
> Number of violent crimes: 195 (Oregon: 12,380)
> Murders reported in 2020: 7 (Oregon: 125)
> Poverty rate: 13.3% (Oregon: 11.4%)
[recirclink id=954316]

Pennsylvania: No eligible metros
> Violent crimes per 100k people: N/A (Pennsylvania: 389.5)
> Number of violent crimes: N/A (Pennsylvania: 49,793)
> Murders reported in 2020: N/A (Pennsylvania: 1,009)
> Poverty rate: N/A (Pennsylvania: 12.0%)

Rhode Island: Providence-Warwick*
> Violent crimes per 100k people: 285.6 (Rhode Island: 230.8)
> Number of violent crimes: 4,630 (Rhode Island: 2,440)
> Murders reported in 2020: 41 (Rhode Island: 32)
> Poverty rate: 11.0% (Rhode Island: 10.8%)
*Because Providence-Warwick is the only eligible metro in Rhode Island, it is the safest metro by default.
[in-text-ad-2]

South Carolina: Hilton Head Island-Bluffton
> Violent crimes per 100k people: 326.9 (South Carolina: 530.7)
> Number of violent crimes: 741 (South Carolina: 27,691)
> Murders reported in 2020: 22 (South Carolina: 549)
> Poverty rate: 10.8% (South Carolina: 13.8%)

South Dakota: Sioux Falls
> Violent crimes per 100k people: 477.7 (South Dakota: 501.4)
> Number of violent crimes: 1,304 (South Dakota: 4,476)
> Murders reported in 2020: 15 (South Dakota: 40)
> Poverty rate: 7.7% (South Dakota: 11.9%)
[in-text-ad]

Tennessee: Johnson City
> Violent crimes per 100k people: 306.1 (Tennessee: 672.7)
> Number of violent crimes: 625 (Tennessee: 46,328)
> Murders reported in 2020: 6 (Tennessee: 663)
> Poverty rate: 17.9% (Tennessee: 13.9%)
[recirclink id=950673]

Texas: McAllen-Edinburg-Mission
> Violent crimes per 100k people: 274.8 (Texas: 446.5)
> Number of violent crimes: 2,408 (Texas: 131,084)
> Murders reported in 2020: 35 (Texas: 1,931)
> Poverty rate: 27.3% (Texas: 13.6%)

Utah: Logan
> Violent crimes per 100k people: 118.2 (Utah: 260.7)
> Number of violent crimes: 170 (Utah: 8,471)
> Murders reported in 2020: 1 (Utah: 102)
> Poverty rate: 14.7% (Utah: 8.9%)
[in-text-ad-2]

Vermont: Burlington-South Burlington*
> Violent crimes per 100k people: 198.4 (Vermont: 173.4)
> Number of violent crimes: 439 (Vermont: 1,081)
> Murders reported in 2020: 5 (Vermont: 14)
> Poverty rate: 11.4% (Vermont: 10.2%)
*Because Burlington-South Burlington is the only eligible metro in Vermont, it is the safest metro by default.

Virginia: Winchester
> Violent crimes per 100k people: 150.8 (Virginia: 208.7)
> Number of violent crimes: 214 (Virginia: 17,925)
> Murders reported in 2020: 5 (Virginia: 524)
> Poverty rate: 8.6% (Virginia: 9.9%)
[in-text-ad]

Washington: Wenatchee
> Violent crimes per 100k people: 116.2 (Washington: 293.7)
> Number of violent crimes: 141 (Washington: 22,596)
> Murders reported in 2020: 1 (Washington: 301)
> Poverty rate: 13.0% (Washington: 9.8%)
[recirclink id=948659]

West Virginia: Huntington-Ashland
> Violent crimes per 100k people: 240.2 (West Virginia: 355.9)
> Number of violent crimes: 850 (West Virginia: 6,352)
> Murders reported in 2020: 14 (West Virginia: 117)
> Poverty rate: 16.9% (West Virginia: 16.0%)

Wisconsin: La Crosse-Onalaska
> Violent crimes per 100k people: 155.8 (Wisconsin: 323.4)
> Number of violent crimes: 213 (Wisconsin: 18,861)
> Murders reported in 2020: 1 (Wisconsin: 308)
> Poverty rate: 11.6% (Wisconsin: 10.4%)
[in-text-ad-2]

Wyoming: Casper
> Violent crimes per 100k people: 227.0 (Wyoming: 234.2)
> Number of violent crimes: 183 (Wyoming: 1,364)
> Murders reported in 2020: 4 (Wyoming: 18)
> Poverty rate: 8.6% (Wyoming: 10.1%)
Methodology
To determine the safest metro area in every state, 24/7 Wall St. reviewed violent crime figures from the FBI’s 2020 Uniform Crime Report. Violent crime includes murder, non-negligent manslaughter, rape, robbery, and aggravated assault. The rate of violent crimes per 100,000 people was calculated using population data from the FBI.
Limited data was available in the 2020 UCR for areas in Alabama, Maryland, Pennsylvania, and Illinois, though these states were not excluded from analysis. Only metro areas for which the boundaries defined by the FBI match the boundaries as defined by the U.S. Census Bureau were considered.
Poverty rates are one-year estimates from the 2019 ACS.
Contact [email protected] for any questions or corrections.