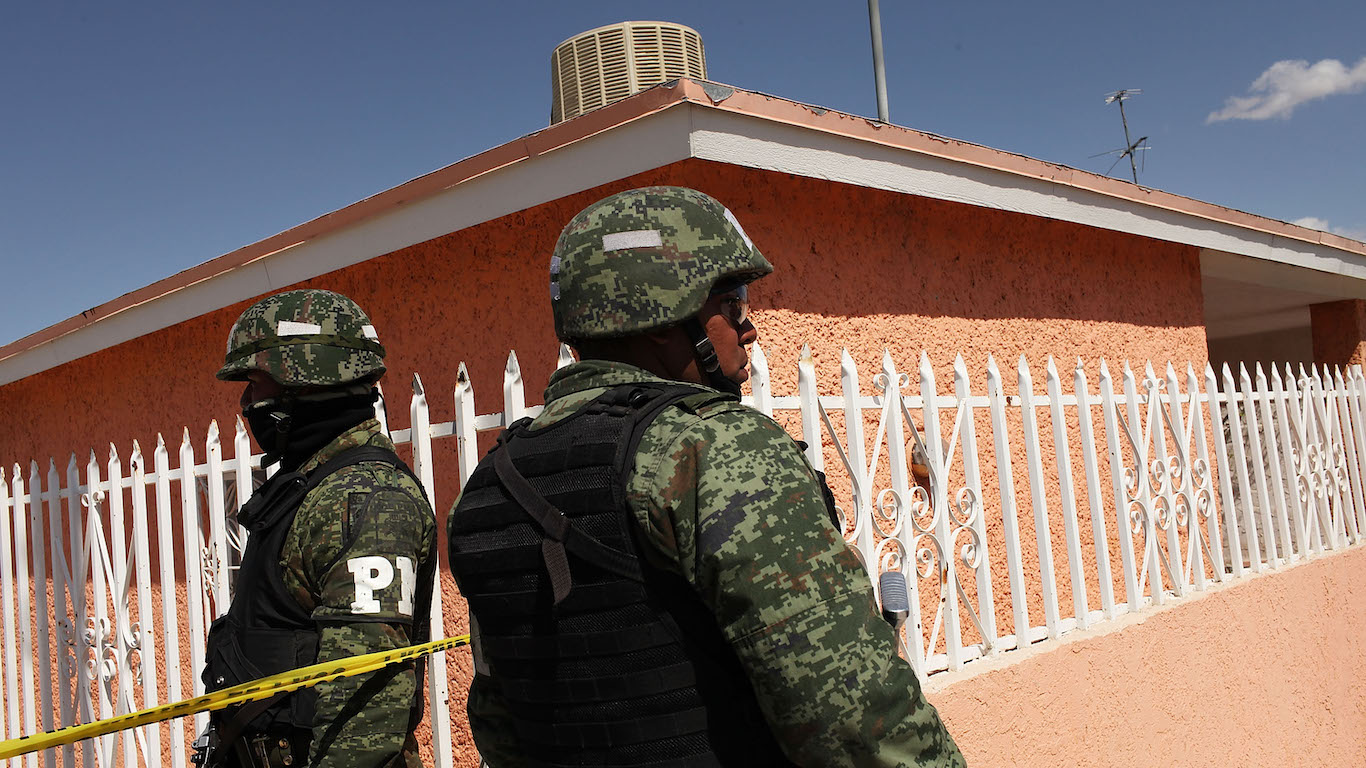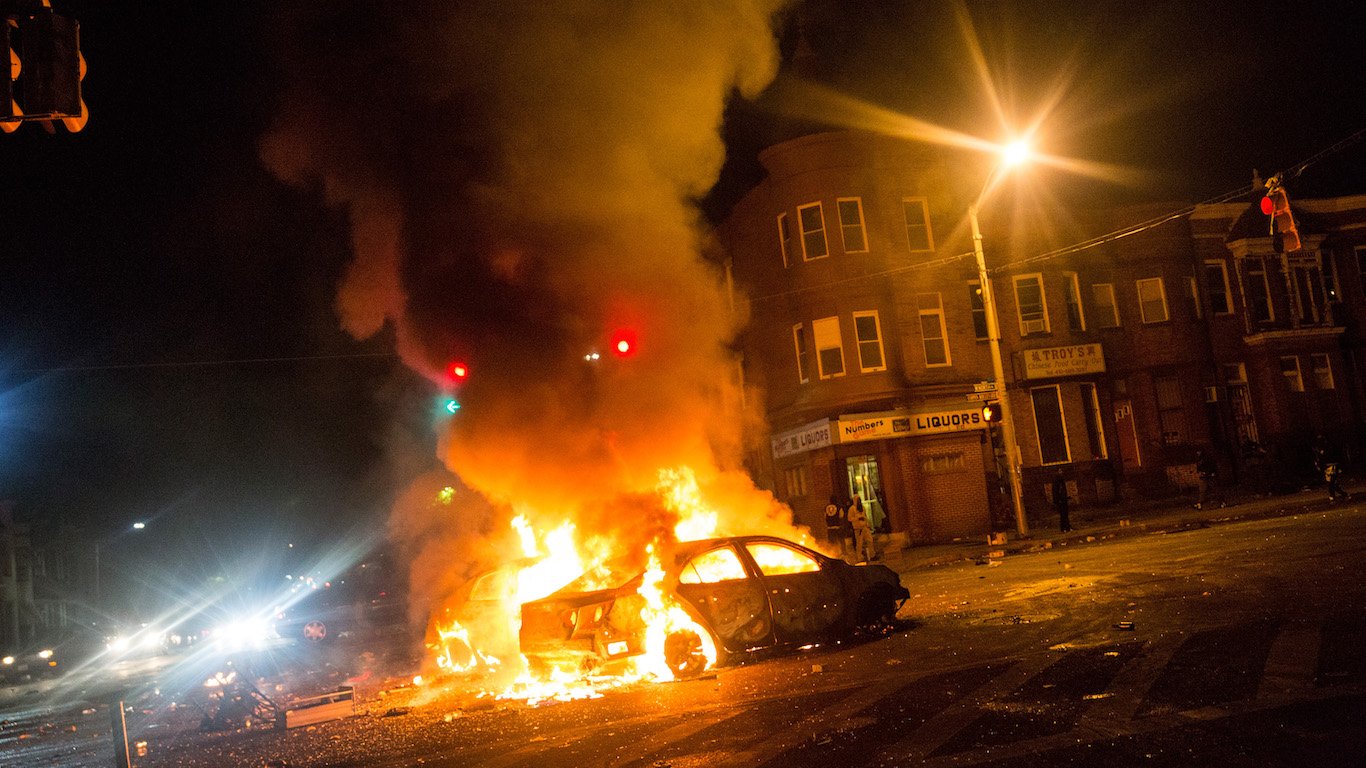

The U.S. violent crime rate — an annual, population-adjusted measure of cases of rаpe, robbery, aggravated assault, and homicide — climbed by 5% in 2020. The increase was driven by a rise in aggravated assault and, most notably, a historic 29% surge in homicides that made 2020 the deadliest year in the United States since the mid-1990s.
Despite the largest single-year increase in homicides on record, the overall violent crime rate remains relatively low by historical standards. There were 1.3 million violent crimes reported in the U.S. in 2020, or 399 for every 100,000 people. For context, the national violent crime rate ranged between 523 and 758 incidents per 100,000 throughout the 1990s.
Of course, crime is a local phenomenon influenced by a wide range of factors at the community and even household level. As a result, violent crime rates in the U.S. can vary considerably from place to place — and in some cities, rates of violence far exceed the nation-level highs recorded in decades past.
Using data from the FBI’s 2020 Uniform Crime Report, 24/7 Wall St. identified the most dangerous city in each state. Cities are ranked by the violent crime rate — specifically, the number of violent crimes reported for every 100,000 residents. Only cities with populations of more than 25,000 were considered.
It is important to note that in four states — Alabama, Maryland, Pennsylvania, and Vermont — there is only one city with available data. In each of these cases, which are noted, the city listed ranks as the most dangerous city by default only. In Hawaii, there are no eligible cities with available crime data.
Though each of the cities on this list ranks as the most dangerous in its state, violent crime rates in these cities vary considerably, from as low as 103 incidents per 100,000 people to as high as 2,969 per 100,000. Still, in nearly every city on this list, violent crime rates exceed the comparable rate across the state as a whole.
Explanations for the high levels of violence in these places are varied and complex. Major current events that have impacted the entire country — such as the COVID-19 pandemic and unrest fueled by the murder of George Floyd — have likely played a role in some places. Other factors, such as a lack of economic opportunity, are more endemic.
Low-income communities in the United States are disproportionately burdened by crime. One study found that individuals with family incomes of less than $15,000 annually are three times more likely to be victimized by crime than those with family incomes of $75,000 or more. In most cities on this list, the share of residents living on poverty-level income exceeds the comparable statewide poverty rate. Here is a look at the city hit hardest by extreme poverty in every state.
Click here to see the most dangerous city in every state
To determine the most dangerous city in every state, 24/7 Wall St. reviewed violent crime figures from the FBI’s 2020 Uniform Crime Report. Violent crime includes murder, non-negligent manslaughter, rаpe, robbery, and aggravated assault. Rates of violent crimes per 100,000 people were calculated using population data from the FBI.
We included cities that have more than 25,000 people based on five-year estimates from the U.S. Census Bureau’s 2019 American Community Survey. Limited data was available in the 2020 UCR for areas in Alabama, Maryland, Pennsylvania, and Illinois, though these states were not excluded from analysis.
Additional information on the number of murders are also from the 2020 FBI UCR. Poverty rates are five-year estimates from the 2019 ACS.
Alabama: Enterprise*
> Violent crimes per 100k people: 448.0 (Alabama: 453.6)
> Number of violent crimes: 128 (Alabama: 22,322)
> Murders reported in 2020: 2 (Alabama: 471)
> Poverty rate: 14.8% (Alabama: 16.7%)
*Because Enterprise is the only eligible city in Alabama, it is the most dangerous city by default.
[in-text-ad]

Alaska: Anchorage
> Violent crimes per 100k people: 1,212.3 (Alaska: 837.8)
> Number of violent crimes: 3,472 (Alaska: 6,126)
> Murders reported in 2020: 18 (Alaska: 49)
> Poverty rate: 9.0% (Alaska: 10.7%)

Arizona: Phoenix
> Violent crimes per 100k people: 798.5 (Arizona: 484.8)
> Number of violent crimes: 13,646 (Arizona: 35,980)
> Murders reported in 2020: 187 (Arizona: 513)
> Poverty rate: 18.0% (Arizona: 15.1%)

Arkansas: Little Rock
> Violent crimes per 100k people: 1,849.9 (Arkansas: 671.9)
> Number of violent crimes: 3,657 (Arkansas: 20,363)
> Murders reported in 2020: 49 (Arkansas: 321)
> Poverty rate: 16.6% (Arkansas: 17.0%)
[in-text-ad-2]
California: San Bernardino
> Violent crimes per 100k people: 1,401.8 (California: 442.0)
> Number of violent crimes: 3,033 (California: 174,026)
> Murders reported in 2020: 68 (California: 2,203)
> Poverty rate: 26.0% (California: 13.4%)

Colorado: Pueblo
> Violent crimes per 100k people: 1,045.1 (Colorado: 423.1)
> Number of violent crimes: 1,181 (Colorado: 24,570)
> Murders reported in 2020: 16 (Colorado: 294)
> Poverty rate: 23.5% (Colorado: 10.3%)
[in-text-ad]

Connecticut: Hartford
> Violent crimes per 100k people: 992.2 (Connecticut: 181.6)
> Number of violent crimes: 1,208 (Connecticut: 6,459)
> Murders reported in 2020: 23 (Connecticut: 140)
> Poverty rate: 28.1% (Connecticut: 9.9%)

Delaware: Wilmington
> Violent crimes per 100k people: 1,590.6 (Delaware: 431.9)
> Number of violent crimes: 1,115 (Delaware: 4,262)
> Murders reported in 2020: 31 (Delaware: 73)
> Poverty rate: 26.0% (Delaware: 11.8%)

Florida: Riviera Beach
> Violent crimes per 100k people: 1,195.6 (Florida: 383.6)
> Number of violent crimes: 428 (Florida: 83,368)
> Murders reported in 2020: 16 (Florida: 1,290)
> Poverty rate: 21.9% (Florida: 14.0%)
[in-text-ad-2]

Georgia: Albany
> Violent crimes per 100k people: 1,724.3 (Georgia: 400.1)
> Number of violent crimes: 1,234 (Georgia: 42,850)
> Murders reported in 2020: 19 (Georgia: 943)
> Poverty rate: 30.8% (Georgia: 15.1%)

Hawaii: No eligible cities
> Violent crimes per 100k people: N/A (Hawaii: 254.2)
> Number of violent crimes: N/A (Hawaii: 3,576)
> Murders reported in 2020: N/A (Hawaii: 41)
> Poverty rate: N/A (Hawaii: 9.4%)
[in-text-ad]

Idaho: Twin Falls
> Violent crimes per 100k people: 509.1 (Idaho: 242.6)
> Number of violent crimes: 259 (Idaho: 4,432)
> Murders reported in 2020: 2 (Idaho: 41)
> Poverty rate: 14.8% (Idaho: 13.1%)
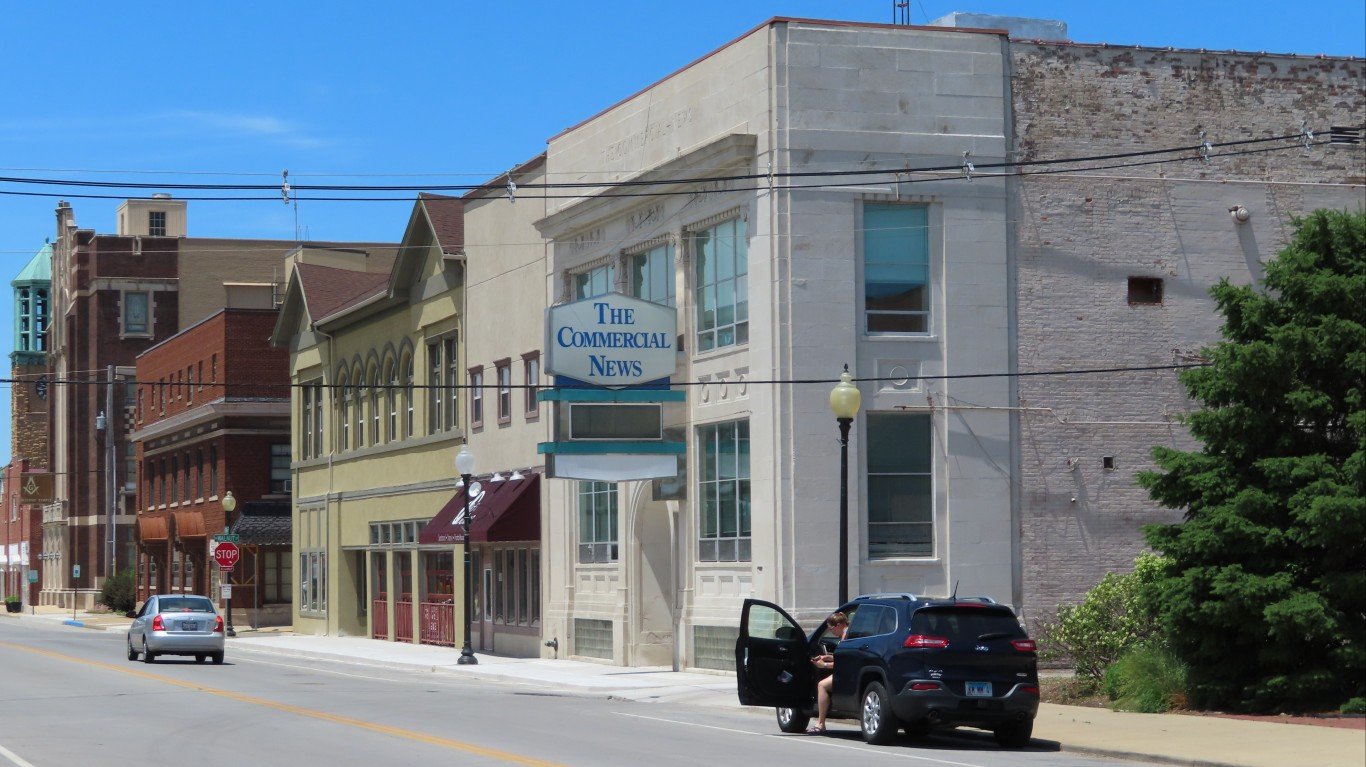
Illinois: Danville
> Violent crimes per 100k people: 1,671.7 (Illinois: 425.9)
> Number of violent crimes: 505 (Illinois: 53,612)
> Murders reported in 2020: 8 (Illinois: 1,151)
> Poverty rate: 29.4% (Illinois: 12.5%)

Indiana: South Bend
> Violent crimes per 100k people: 1,728.4 (Indiana: 357.7)
> Number of violent crimes: 1,765 (Indiana: 24,161)
> Murders reported in 2020: 28 (Indiana: 505)
> Poverty rate: 23.6% (Indiana: 13.4%)
[in-text-ad-2]

Iowa: Council Bluffs
> Violent crimes per 100k people: 923.7 (Iowa: 303.5)
> Number of violent crimes: 574 (Iowa: 9,601)
> Murders reported in 2020: 0 reported (Iowa: 111)
> Poverty rate: 12.8% (Iowa: 11.5%)

Kansas: Leavenworth
> Violent crimes per 100k people: 816.1 (Kansas: 425.0)
> Number of violent crimes: 294 (Kansas: 12,385)
> Murders reported in 2020: 4 (Kansas: 100)
> Poverty rate: 15.0% (Kansas: 12.0%)
[in-text-ad]

Kentucky: Covington
> Violent crimes per 100k people: 381.9 (Kentucky: 259.1)
> Number of violent crimes: 154 (Kentucky: 11,600)
> Murders reported in 2020: 1 (Kentucky: 323)
> Poverty rate: 23.1% (Kentucky: 17.3%)

Louisiana: Monroe
> Violent crimes per 100k people: 2,969.1 (Louisiana: 639.4)
> Number of violent crimes: 1,399 (Louisiana: 29,704)
> Murders reported in 2020: 19 (Louisiana: 734)
> Poverty rate: 36.8% (Louisiana: 19.2%)

Maine: Lewiston
> Violent crimes per 100k people: 268.1 (Maine: 108.6)
> Number of violent crimes: 97 (Maine: 1,466)
> Murders reported in 2020: 2 (Maine: 22)
> Poverty rate: 18.1% (Maine: 11.8%)
[in-text-ad-2]

Maryland: Bowie*
> Violent crimes per 100k people: 103.4 (Maryland: 399.9)
> Number of violent crimes: 61 (Maryland: 24,215)
> Murders reported in 2020: 1 (Maryland: 553)
> Poverty rate: 3.2% (Maryland: 9.2%)
*Because Bowie is the only eligible city in Maryland, it is the most dangerous city by default.

Massachusetts: Springfield
> Violent crimes per 100k people: 966.8 (Massachusetts: 308.8)
> Number of violent crimes: 1,480 (Massachusetts: 21,288)
> Murders reported in 2020: 18 (Massachusetts: 160)
> Poverty rate: 26.9% (Massachusetts: 10.3%)
[in-text-ad]

Michigan: Detroit
> Violent crimes per 100k people: 2,178.5 (Michigan: 478.0)
> Number of violent crimes: 14,370 (Michigan: 47,641)
> Murders reported in 2020: 328 (Michigan: 754)
> Poverty rate: 35.0% (Michigan: 14.4%)

Minnesota: Minneapolis
> Violent crimes per 100k people: 1,154.9 (Minnesota: 277.5)
> Number of violent crimes: 5,025 (Minnesota: 15,698)
> Murders reported in 2020: 79 (Minnesota: 190)
> Poverty rate: 19.1% (Minnesota: 9.7%)

Mississippi: Gulfport
> Violent crimes per 100k people: 439.4 (Mississippi: 291.2)
> Number of violent crimes: 317 (Mississippi: 8,638)
> Murders reported in 2020: 10 (Mississippi: 315)
> Poverty rate: 26.3% (Mississippi: 20.3%)
[in-text-ad-2]

Missouri: St. Louis
> Violent crimes per 100k people: 2,016.3 (Missouri: 542.7)
> Number of violent crimes: 6,017 (Missouri: 33,385)
> Murders reported in 2020: 263 (Missouri: 723)
> Poverty rate: 21.8% (Missouri: 13.7%)

Montana: Billings
> Violent crimes per 100k people: 852.4 (Montana: 469.8)
> Number of violent crimes: 939 (Montana: 5,077)
> Murders reported in 2020: 14 (Montana: 54)
> Poverty rate: 10.0% (Montana: 13.1%)
[in-text-ad]

Nebraska: Omaha
> Violent crimes per 100k people: 631.3 (Nebraska: 334.1)
> Number of violent crimes: 3,032 (Nebraska: 6,473)
> Murders reported in 2020: 37 (Nebraska: 69)
> Poverty rate: 13.4% (Nebraska: 11.1%)

Nevada: Reno
> Violent crimes per 100k people: 563.3 (Nevada: 460.3)
> Number of violent crimes: 1,460 (Nevada: 14,445)
> Murders reported in 2020: 17 (Nevada: 180)
> Poverty rate: 13.5% (Nevada: 13.1%)

New Hampshire: Manchester
> Violent crimes per 100k people: 592.8 (New Hampshire: 146.4)
> Number of violent crimes: 670 (New Hampshire: 2,000)
> Murders reported in 2020: 5 (New Hampshire: 12)
> Poverty rate: 14.1% (New Hampshire: 7.6%)
[in-text-ad-2]

New Jersey: Trenton
> Violent crimes per 100k people: 1,168.8 (New Jersey: 195.4)
> Number of violent crimes: 969 (New Jersey: 17,353)
> Murders reported in 2020: 40 (New Jersey: 329)
> Poverty rate: 28.7% (New Jersey: 10.0%)

New Mexico: Albuquerque
> Violent crimes per 100k people: 1,343.6 (New Mexico: 778.3)
> Number of violent crimes: 7,552 (New Mexico: 16,393)
> Murders reported in 2020: 80 (New Mexico: 164)
> Poverty rate: 16.9% (New Mexico: 19.1%)
[in-text-ad]

New York: Buffalo
> Violent crimes per 100k people: 1,018.0 (New York: 363.8)
> Number of violent crimes: 2,592 (New York: 70,339)
> Murders reported in 2020: 61 (New York: 808)
> Poverty rate: 30.1% (New York: 14.1%)
North Carolina: Goldsboro
> Violent crimes per 100k people: 1,165.9 (North Carolina: 419.3)
> Number of violent crimes: 397 (North Carolina: 44,451)
> Murders reported in 2020: 2 (North Carolina: 852)
> Poverty rate: 26.1% (North Carolina: 14.7%)

North Dakota: Fargo
> Violent crimes per 100k people: 460.1 (North Dakota: 329.0)
> Number of violent crimes: 584 (North Dakota: 2,518)
> Murders reported in 2020: 7 (North Dakota: 32)
> Poverty rate: 13.2% (North Dakota: 10.7%)
[in-text-ad-2]

Ohio: Cleveland
> Violent crimes per 100k people: 1,656.7 (Ohio: 308.8)
> Number of violent crimes: 6,281 (Ohio: 36,104)
> Murders reported in 2020: 160 (Ohio: 820)
> Poverty rate: 32.7% (Ohio: 14.0%)

Oklahoma: Muskogee
> Violent crimes per 100k people: 1,209.2 (Oklahoma: 458.6)
> Number of violent crimes: 446 (Oklahoma: 18,255)
> Murders reported in 2020: 3 (Oklahoma: 296)
> Poverty rate: 24.6% (Oklahoma: 15.7%)
[in-text-ad]

Oregon: Portland
> Violent crimes per 100k people: 522.7 (Oregon: 291.9)
> Number of violent crimes: 3,465 (Oregon: 12,380)
> Murders reported in 2020: 53 (Oregon: 125)
> Poverty rate: 13.7% (Oregon: 13.2%)

Pennsylvania: Harrisburg*
> Violent crimes per 100k people: 857.0 (Pennsylvania: 389.5)
> Number of violent crimes: 422 (Pennsylvania: 49,793)
> Murders reported in 2020: 23 (Pennsylvania: 1,009)
> Poverty rate: 26.2% (Pennsylvania: 12.4%)
*Because Harrisburg is the only eligible city in Pennsylvania, it is the most dangerous city by default.

Rhode Island: Woonsocket
> Violent crimes per 100k people: 501.3 (Rhode Island: 230.8)
> Number of violent crimes: 209 (Rhode Island: 2,440)
> Murders reported in 2020: 4 (Rhode Island: 32)
> Poverty rate: 21.8% (Rhode Island: 12.4%)
[in-text-ad-2]

South Carolina: Florence
> Violent crimes per 100k people: 1,456.1 (South Carolina: 530.7)
> Number of violent crimes: 562 (South Carolina: 27,691)
> Murders reported in 2020: 12 (South Carolina: 549)
> Poverty rate: 19.1% (South Carolina: 15.2%)

South Dakota: Rapid City
> Violent crimes per 100k people: 857.4 (South Dakota: 501.4)
> Number of violent crimes: 673 (South Dakota: 4,476)
> Murders reported in 2020: 13 (South Dakota: 40)
> Poverty rate: 16.2% (South Dakota: 13.1%)
[in-text-ad]

Tennessee: Memphis
> Violent crimes per 100k people: 2,352.0 (Tennessee: 672.7)
> Number of violent crimes: 15,310 (Tennessee: 46,328)
> Murders reported in 2020: 289 (Tennessee: 663)
> Poverty rate: 25.1% (Tennessee: 15.2%)

Texas: Houston
> Violent crimes per 100k people: 1,256.3 (Texas: 446.5)
> Number of violent crimes: 29,474 (Texas: 131,084)
> Murders reported in 2020: 400 (Texas: 1,931)
> Poverty rate: 20.1% (Texas: 14.7%)
Utah: South Salt Lake
> Violent crimes per 100k people: 964.5 (Utah: 260.7)
> Number of violent crimes: 249 (Utah: 8,471)
> Murders reported in 2020: 4 (Utah: 102)
> Poverty rate: 18.7% (Utah: 9.8%)
[in-text-ad-2]

Vermont: Burlington*
> Violent crimes per 100k people: 352.3 (Vermont: 173.4)
> Number of violent crimes: 151 (Vermont: 1,081)
> Murders reported in 2020: 1 (Vermont: 14)
> Poverty rate: 26.4% (Vermont: 10.9%)
*Because Burlington is the only eligible city in Vermont, it is the most dangerous city by default.

Virginia: Portsmouth
> Violent crimes per 100k people: 920.3 (Virginia: 208.7)
> Number of violent crimes: 867 (Virginia: 17,925)
> Murders reported in 2020: 34 (Virginia: 524)
> Poverty rate: 16.8% (Virginia: 10.6%)
[in-text-ad]

Washington: Tacoma
> Violent crimes per 100k people: 843.2 (Washington: 293.7)
> Number of violent crimes: 1,856 (Washington: 22,596)
> Murders reported in 2020: 28 (Washington: 301)
> Poverty rate: 14.6% (Washington: 10.8%)

West Virginia: Wheeling
> Violent crimes per 100k people: 1,258.5 (West Virginia: 355.9)
> Number of violent crimes: 330 (West Virginia: 6,352)
> Murders reported in 2020: 1 (West Virginia: 117)
> Poverty rate: 13.8% (West Virginia: 17.6%)

Wisconsin: Milwaukee
> Violent crimes per 100k people: 1,596.8 (Wisconsin: 323.4)
> Number of violent crimes: 9,407 (Wisconsin: 18,861)
> Murders reported in 2020: 191 (Wisconsin: 308)
> Poverty rate: 25.4% (Wisconsin: 11.3%)
[in-text-ad-2]

Wyoming: Cheyenne
> Violent crimes per 100k people: 376.8 (Wyoming: 234.2)
> Number of violent crimes: 244 (Wyoming: 1,364)
> Murders reported in 2020: 2 (Wyoming: 18)
> Poverty rate: 10.4% (Wyoming: 11.0%)
Take This Retirement Quiz To Get Matched With A Financial Advisor (Sponsored)
Take the quiz below to get matched with a financial advisor today.
Each advisor has been vetted by SmartAsset and is held to a fiduciary standard to act in your best interests.
Here’s how it works:
1. Answer SmartAsset advisor match quiz
2. Review your pre-screened matches at your leisure. Check out the
advisors’ profiles.
3. Speak with advisors at no cost to you. Have an introductory call on the phone or introduction in person and choose whom to work with in the future
Take the retirement quiz right here.
Thank you for reading! Have some feedback for us?
Contact the 24/7 Wall St. editorial team.

 24/7 Wall St.
 24/7 Wall St.

 24/7 Wall St.
 24/7 Wall St.
